
Under-Frequency Load Shedding (UFLS) Schemes A Survey · E-mail: [email protected] D. H. A....
17
International Journal of Applied Engineering Research ISSN 0973-4562 Volume 11, Number 1 (2016) pp 456-472 © Research India Publications. http://www.ripublication.com 456 Under-Frequency Load Shedding (UFLS) Schemes – A Survey M. Lu PG Scholar, Department of Electrical and Electronic Engineering, Universiti Malaysia Sarawak, Kuching, Malaysia. E-mail: [email protected] W. A. W. ZainalAbidin Associate Professor, Department of Electrical and Electronic Engineering, Universiti Malaysia Sarawak, Kuching, Malaysia. E-mail: [email protected] T. Masri Senior Lecturer, Department of Electrical and Electronic Engineering, Universiti Malaysia Sarawak, Kuching, Malaysia. E-mail: [email protected] D. H. A. Lee, S. Chen Sarawak Energy Berhad, Kuching, Malaysia. E-mail: [email protected] Abstract The Under-frequency Load Shedding (UFLS) scheme has been used by utility companies around the world to mitigate frequency drop caused by simultaneous or cascading tripping of transmission lines and/or generators in a power system. In the effort to devise an optimal load shedding scheme, it is imperative that investigations are done on the many factors that may affect the response of the scheme in the event of a system contingency. This paper starts by analysing the implementation of UFLS in various power utility companies in Asia, Europe, Australasia, South Africa, Middle East and the Americas. It is observed that UFLS in these continents differ in terms of total load shed, number of UFLS blocks, average block size and trip frequency deviation thresholds depending on their system size, system inertia and generation mix. This paper also looked at the usage of System Frequency Response (SFR) models in the computation of UFLS and system parameters. Analysis on the SFR model showed that the impact of voltage dependence of loads was not taken into consideration in the early implementation of the model albeit load characteristics have significant influence on the dynamic behaviour of power systems during low frequency oscillation and severe faults. SFR model incorporating frequency and voltage dependence load models was proposed later in literature and used in the design of an optimal UFLS scheme. Investigation was also conducted on UFLS operating philosophies in terms of load shedding trigger, power imbalance estimation and distribution of load shedding. UFLS operating philosophies based solely on frequency parameters is inadequate to determine the stability of a power system especially for an islanded power system following severe disturbances. The power system may be susceptible to voltage collapse as well, which will lead to total system blackout within shorter time duration as compared to a frequency collapse phenomenon. Hence, trigger condition considering voltage information and voltage stability criterions were introduced and implemented in UFLS schemes. Distribution of load shedding based on power flow tracing method catering for both frequency and voltage instabilities was also introduced and proven to give optimal system response. Keywords: Under-frequency Load Shedding (UFLS), frequency drop, load shed, System Frequency Response (SFR) model, operating philosophies. Introduction Under-frequency Load shedding (UFLS) is a common demand reduction measure taken by most energy utilities to mitigate frequency drop whenever there is dangerous imbalance between loads and generation due to disturbances to the system such as loss of generation or major transmission lines. UFLS is performed to force the perturbed system to a new equilibrium state, balancing load and generation, to minimize the risk of a further uncontrolled system separation and loss of generation and to prevent continuous frequency drop which may lead to total frequency collapse and prolonged system outage [1]. UFLS has to be well-coordinated between interconnected power systems and also with other system defense schemes such as Under-Frequency Capacitor Shedding (UFCS), Under-Frequency Generator Isolation (UFGI), Special Protection Scheme (SPS), Under-Voltage Load Shedding (UVLS) and other automatic actions that will kick in to arrest system from collapsing during abnormal frequency, voltage and/or power flow conditions [2]. For power system that has industrial and commercial customers with local generation connected to it, UFLS can detect onset of disturbance, isolate power systems by opening system ties and trip non-essential industrial loads to match total loss of generation. However, tripping these tie lines having active parallel generation reduces the beneficial impacts of load shedding because the sources of generation supporting system inertia are eliminated.
Transcript of Under-Frequency Load Shedding (UFLS) Schemes A Survey · E-mail: [email protected] D. H. A....
International Journal of Applied Engineering Research ISSN 0973-4562 Volume 11, Number 1 (2016) pp 456-472
© Research India Publications. http://www.ripublication.com
456
Under-Frequency Load Shedding (UFLS) Schemes – A Survey
M. Lu
PG Scholar, Department of Electrical and Electronic Engineering,
Universiti Malaysia Sarawak, Kuching, Malaysia.
E-mail: [email protected]
W. A. W. ZainalAbidin
Associate Professor, Department of Electrical and Electronic Engineering,
Universiti Malaysia Sarawak, Kuching, Malaysia.
E-mail: [email protected]
T. Masri
Senior Lecturer, Department of Electrical and Electronic Engineering, Universiti Malaysia Sarawak, Kuching, Malaysia.
E-mail: [email protected]
D. H. A. Lee, S. Chen
Sarawak Energy Berhad, Kuching, Malaysia.
E-mail: [email protected]
Abstract The Under-frequency Load Shedding (UFLS) scheme has been
used by utility companies around the world to mitigate frequency drop caused by simultaneous or cascading tripping of
transmission lines and/or generators in a power system. In the
effort to devise an optimal load shedding scheme, it is imperative
that investigations are done on the many factors that may affect
the response of the scheme in the event of a system contingency.
This paper starts by analysing the implementation of UFLS in
various power utility companies in Asia, Europe, Australasia,
South Africa, Middle East and the Americas. It is observed that
UFLS in these continents differ in terms of total load shed,
number of UFLS blocks, average block size and trip frequency
deviation thresholds depending on their system size, system
inertia and generation mix. This paper also looked at the usage of System Frequency Response (SFR) models in the computation of
UFLS and system parameters. Analysis on the SFR model
showed that the impact of voltage dependence of loads was not
taken into consideration in the early implementation of the model
albeit load characteristics have significant influence on the
dynamic behaviour of power systems during low frequency
oscillation and severe faults. SFR model incorporating frequency
and voltage dependence load models was proposed later in
literature and used in the design of an optimal UFLS scheme.
Investigation was also conducted on UFLS operating philosophies
in terms of load shedding trigger, power imbalance estimation and distribution of load shedding. UFLS operating philosophies based
solely on frequency parameters is inadequate to determine the
stability of a power system especially for an islanded power
system following severe disturbances. The power system may be
susceptible to voltage collapse as well, which will lead to total
system blackout within shorter time duration as compared to a
frequency collapse phenomenon. Hence, trigger condition
considering voltage information and voltage stability criterions
were introduced and implemented in UFLS schemes. Distribution
of load shedding based on power flow tracing method catering for
both frequency and voltage instabilities was also introduced
and proven to give optimal system response.
Keywords: Under-frequency Load Shedding (UFLS),
frequency drop, load shed, System Frequency Response
(SFR) model, operating philosophies.
Introduction Under-frequency Load shedding (UFLS) is a common
demand reduction measure taken by most energy utilities to
mitigate frequency drop whenever there is dangerous
imbalance between loads and generation due to disturbances to the system such as loss of generation or major
transmission lines. UFLS is performed to force the perturbed
system to a new equilibrium state, balancing load and
generation, to minimize the risk of a further uncontrolled
system separation and loss of generation and to prevent
continuous frequency drop which may lead to total frequency
collapse and prolonged system outage [1].
UFLS has to be well-coordinated between interconnected
power systems and also with other system defense schemes
such as Under-Frequency Capacitor Shedding (UFCS),
Under-Frequency Generator Isolation (UFGI), Special
Protection Scheme (SPS), Under-Voltage Load Shedding (UVLS) and other automatic actions that will kick in to arrest
system from collapsing during abnormal frequency, voltage
and/or power flow conditions [2]. For power system that has
industrial and commercial customers with local generation
connected to it, UFLS can detect onset of disturbance, isolate
power systems by opening system ties and trip non-essential
industrial loads to match total loss of generation. However,
tripping these tie lines having active parallel generation
reduces the beneficial impacts of load shedding because the
sources of generation supporting system inertia are
eliminated.
International Journal of Applied Engineering Research ISSN 0973-4562 Volume 11, Number 1 (2016) pp 456-472
© Research India Publications. http://www.ripublication.com
457
Various UFLS load shedding schemes are used in the industry
worldwide. UFLS can be classified into two main categories –
fixed and adaptive. The fixed scheme sheds a pre-defined amount
of loads when the system frequency falls below a certain
threshold. Further load shedding is performed if the system
frequency continues to deteriorate after the activating the first stage of UFLS scheme. The total amount of load shed as a
function of time is expressed as a sum of incremental step
function [3]. The adaptive scheme sheds loads dynamically by
taking into consideration severity of disturbances and system
frequency-voltage characteristics and is proven to provide optimal
amount of load shed thereby giving better frequency recovery,
lower frequency overshoot and lesser minimum frequency
deviation [3]. However, simulation studies for system
contingencies for three load step increments also show that the
adaptive scheme only out-performs the fixed scheme for a
medium size disturbance [4].
Terjiza presented a new approach to adaptive UFLS in [5]. In the initial stage, the frequency and the rate of frequency change were
estimated using the non-recursive Newton-type algorithm and in
the latter stage, the magnitude of disturbance was determined
using the simplest expression of the generator swing equation.
In [6] and [7], two centralized adaptive load-shedding algorithms
called the response-based algorithm and the combination of
event-based and response-based, were introduced. These methods
were shown to be capable of mitigating instabilities during severe
or combinational power system contingencies.
Combinational load shedding schemes gain popularity when the
industry realizes the susceptibility of power systems to combinatorial frequency and voltage collapses. In [8], the authors
presented two combinatorial algorithms to combine UFLS and
UVLS schemes whereby locally measured frequency and voltage
signals were used to determine distribution of load curtailment
during severe disturbances. These methods known as V-F and
dV-F load shedding schemes, were shown to increase adaptability
of UFLS relay and enhance power system susceptibility to
voltage collapse by improving voltage stability margins whereby
loads with lower voltage level and greater voltage decline were
shed sooner. Voltage stability has become an issue in recent
decades as power systems are getting more interconnected and
heavily loaded [9], [10]. M. V. Suganyadevi and C. K. Babulal in [11] has defined voltage stability as "the ability of a power system
to maintain steady state voltages at all buses in the system after
being subjected to a disturbance from a given initial operating
condition".
Implementation of an integrated UFLS and UVLS scheme was
proposed in [12] to keep power islands stable after power
oscillations or out-of-step islanding. An interconnected grid
system such as China was susceptible to large disturbances and
has the tendency to go out-of-step. With the integrated scheme, a
certain proportion of load would be shed when system splitting
occurred whereby quantum of load shed was set according to the generation deficit of the area. UVLS would be activated if system
voltage was low but frequency was high at the same time. The
authors believed that this would improve the voltage profile,
increase the generators' output power, and limit island frequency.
Following system islanding, UFLS would be triggered when the
island frequency was lower than the UFLS setting threshold
whereas UVLS would work if the island voltage profile was
lower than its setting value. Simulation results showed that
the integrated measure could keep the island stable.
In [13] and [14], the conventional non-adaptive under-
frequency load-shedding scheme has been deemed
inadequate to provide sufficient protection against system
collapse. The authors in [13] proposed the use of three adaptive combinational load shedding methods to improve
the operation of a conventional UFLS scheme to enhance
power system stability following severe disturbances.
Operation of the conventional and the proposed load
shedding methods were simulated in an actual large network.
Obtained simulation results confirmed that the proposed
methods would provide considerable enhancement in the
power system voltage stability margin, and by using the
proposed algorithms, various power system blackouts could
be prevented.
Zhang and Wang proposed the use of a WAMS-based
adaptive UFLS scheme using real-time online power system measurements in [15]. The scheme was proven to be capable
of adapting its sensitivity to the current operating conditions
thereby eliminating the need for making many assumptions
necessary while tuning a conventional local scheme. In [16],
a coordinated UFLS and UFCS scheme combining with
automatic switching of shunt reactors was presented to
optimize the performance of the existing UFLS scheme
following major disturbances which resulted in large
mismatch between load and generation. Fixed and switched
shunt capacitors in service during normal operation for
maintaining system voltage and dynamic MVAR reserve could generate surplus reactive power post operation of
UFLS relays resulting in over voltage issues, generator under
excitation and other undesirable conditions such as
transformer saturation and ferro-resonance.
This paper is structured as follows: Survey on the application
of UFLS in 36 different power systems worldwide in terms
of total load shed, number of UFLS stages and average block
size followed by analysis on the System Frequency Response
(SFR) Models for computation of load-frequency response,
and lastly, study on the operating philosophy of UFLS
scheme in terms of trigger criteria, imbalance estimation and
load shedding distribution.
UFLS in Asia, Europe, Australasia, Africa, Middle
East and the Americas A few countries within each continent were selected
randomly for this survey. For Asia, survey was done on the
Malaysia (East), Japan, Taiwan, Central China Power Grid, North China Power Grid, Eastern China Power Grid,
China/Hong Kong Interconnection and Thailand; for Europe,
Portugal, Spain, Union for the Coordination of Transmission
of Electricity (UCTE), Ireland, Western Europe, United
Kingdom (UK), Slovenia and Sweden; for Australasia, Africa
and Middle East, New Zealand (North and South Island),
South Africa, Libya, Bangladesh and Israel; for the
Americas, Florida Reliability Coordinating Council (FRCC),
Midwest Reliability Organization (MRO), Mid-Atlantic Area
Council (MAAC), Pennsylvania-New Jersey-Maryland
Interconnection (PJM), Electric Reliability Council of Texas
(ERCOT), Western Electricity Coordinating Council (WECC), Mid Continent Area Power Pool (MAPP), Mid
International Journal of Applied Engineering Research ISSN 0973-4562 Volume 11, Number 1 (2016) pp 456-472
© Research India Publications. http://www.ripublication.com
458
America Interconnected Network (MAIN), Southwest Power Pool
(SPP), East Central Area Realibility Coordination Agreement
(ECAR), Northeast Power Coordinating Council (NPCC),
Northwest Power Pool (NWPP), Brazil and Guam. Most of these
systems are operated at nominal frequency of 50Hz except for
Taiwan and the Americas. Parameters of load shedding algorithm differ by countries and
continents [17]. In this survey, various UFLS criterion such as
maximal capacity of a load connected to the load shedding
system, selection of average block sizes for load shedding,
selection of the number of necessary steps for the load shedding,
selection of upper frequency setting level, selection of intervals
between nearest frequency settings and selection of the tripping
time for a load shedding automatic relay were also investigated.
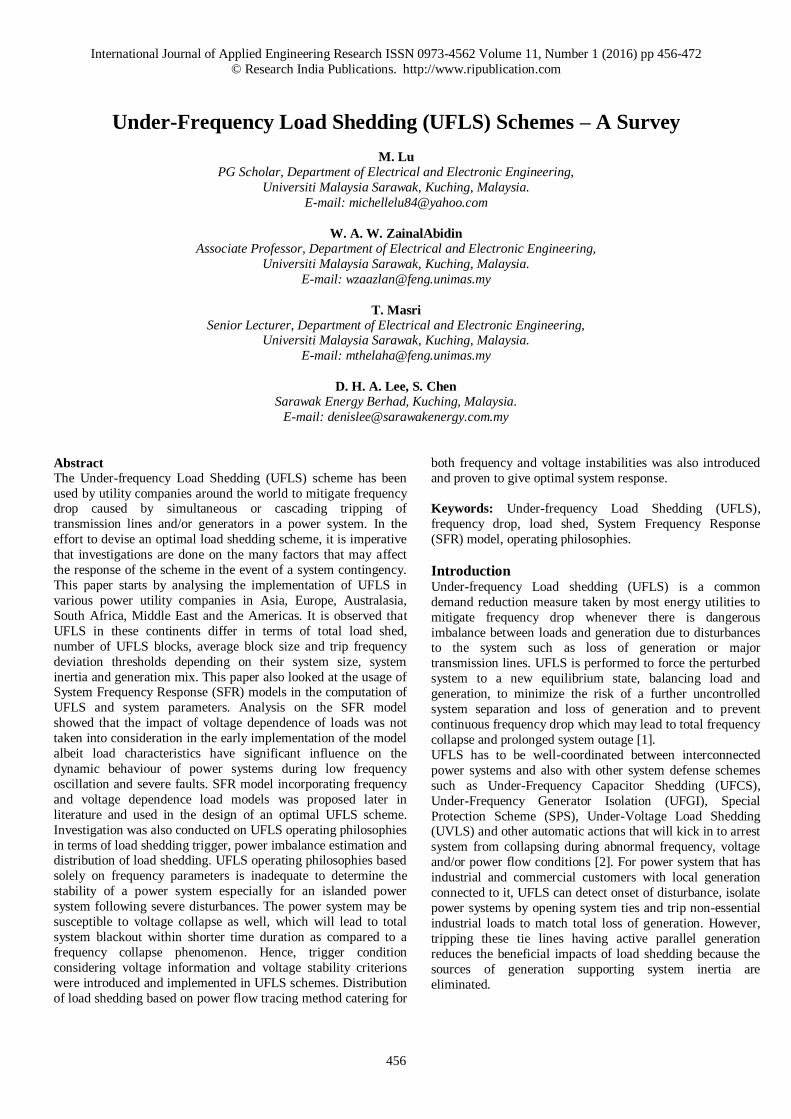
Figures 1 to 3 summarizes the survey on UFLS scheme in Asia in
terms of total load shed/system loading, number of blocks and
average block size [18]-[22]. Out of the eight power systems in
this survey, two are located in Southeast Asia namely Malaysia (East) and Thailand, four from the People’s Republic of China
and another two from Northeast Asia namely Japan and Taiwan.
Majority of these systems adopt customer load shedding schemes
except for Taiwan and China/Hong Kong Interconnection
whereby pumped-storages are also shed during system
disturbances.
Figure 1: Total Load Shed/System Loading (%) for UFLS
in Asia
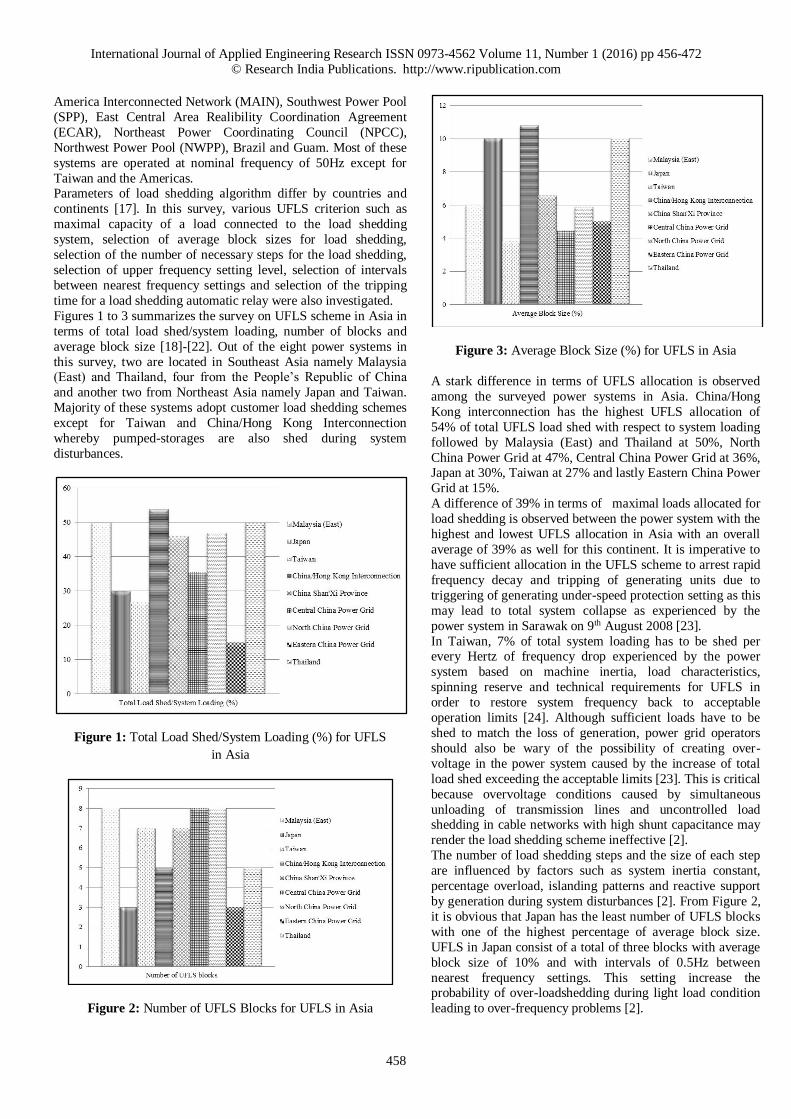
Figure 2: Number of UFLS Blocks for UFLS in Asia
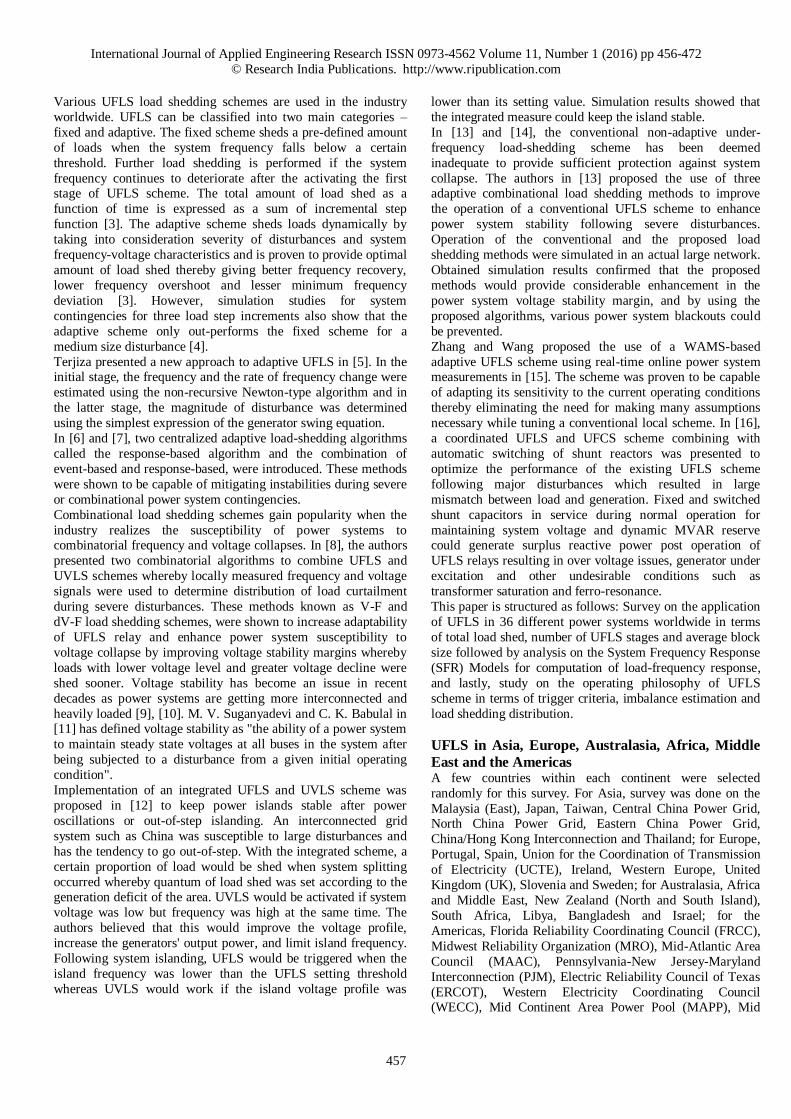
Figure 3: Average Block Size (%) for UFLS in Asia
A stark difference in terms of UFLS allocation is observed
among the surveyed power systems in Asia. China/Hong
Kong interconnection has the highest UFLS allocation of
54% of total UFLS load shed with respect to system loading
followed by Malaysia (East) and Thailand at 50%, North
China Power Grid at 47%, Central China Power Grid at 36%, Japan at 30%, Taiwan at 27% and lastly Eastern China Power
Grid at 15%.
A difference of 39% in terms of maximal loads allocated for
load shedding is observed between the power system with the
highest and lowest UFLS allocation in Asia with an overall
average of 39% as well for this continent. It is imperative to
have sufficient allocation in the UFLS scheme to arrest rapid
frequency decay and tripping of generating units due to
triggering of generating under-speed protection setting as this
may lead to total system collapse as experienced by the
power system in Sarawak on 9th August 2008 [23].
In Taiwan, 7% of total system loading has to be shed per every Hertz of frequency drop experienced by the power
system based on machine inertia, load characteristics,
spinning reserve and technical requirements for UFLS in
order to restore system frequency back to acceptable
operation limits [24]. Although sufficient loads have to be
shed to match the loss of generation, power grid operators
should also be wary of the possibility of creating over-
voltage in the power system caused by the increase of total
load shed exceeding the acceptable limits [23]. This is critical
because overvoltage conditions caused by simultaneous
unloading of transmission lines and uncontrolled load shedding in cable networks with high shunt capacitance may
render the load shedding scheme ineffective [2].
The number of load shedding steps and the size of each step
are influenced by factors such as system inertia constant,
percentage overload, islanding patterns and reactive support
by generation during system disturbances [2]. From Figure 2,
it is obvious that Japan has the least number of UFLS blocks
with one of the highest percentage of average block size.
UFLS in Japan consist of a total of three blocks with average
block size of 10% and with intervals of 0.5Hz between
nearest frequency settings. This setting increase the probability of over-loadshedding during light load condition
leading to over-frequency problems [2].
International Journal of Applied Engineering Research ISSN 0973-4562 Volume 11, Number 1 (2016) pp 456-472
© Research India Publications. http://www.ripublication.com
459
Albeit a responsive govenor in the system will help to limit the
over-frequency to reasonable level, the problem may still be a
threat to the system if the amount of imbalance is large enough to
trigger load rejection controls or cause problems in plants due to
the sudden decrease in steam flow through the turbines. Load
controllers may eventually override the govenor action and return power to original set point, sinking the system back to under-
frequency condition. In addition, shedding of a big block of loads
at one time may have a big impact on an already weakened
system.
Similar situation exists for China/Hong Kong interconnection
which has the largest average block sizes but among one with the
least number of load shedding blocks. However, in cases where
over-shedding of loads do not cause over-frequency, systems with
larger average block size will take lesser time to stabilize the
system frequency. This is critical especially when power system
is encountering severe contingencies and quick immediate
intervention is required to arrest system frequency decline and prevent a total system collapse. The remaining survey results for
UFLS in Europe, Australasia, Africa, Middle East and the
Americas are shown in Figures 4 to 12 [25]-[33].
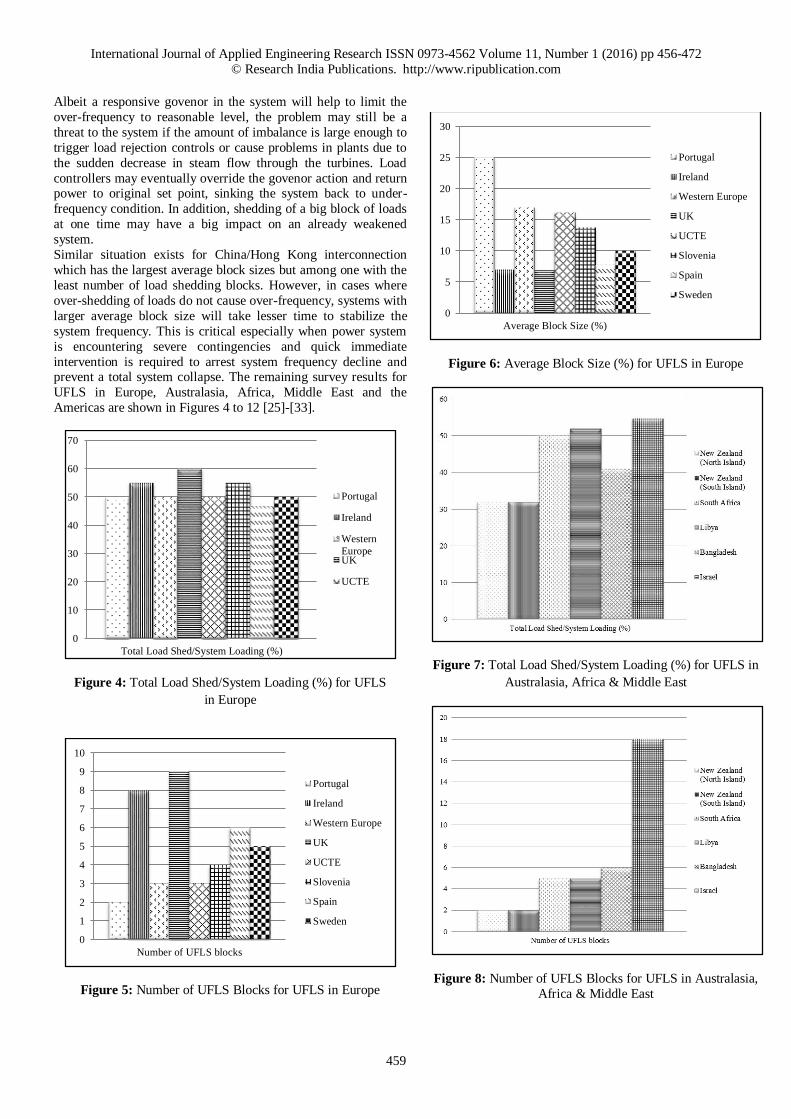
Figure 4: Total Load Shed/System Loading (%) for UFLS
in Europe
Figure 5: Number of UFLS Blocks for UFLS in Europe
Figure 6: Average Block Size (%) for UFLS in Europe
Figure 7: Total Load Shed/System Loading (%) for UFLS in
Australasia, Africa & Middle East
Figure 8: Number of UFLS Blocks for UFLS in Australasia,
Africa & Middle East
0
10
20
30
40
50
60
70
Total Load Shed/System Loading (%)
Portugal
Ireland
Western
EuropeUK
UCTE
0
1
2
3
4
5
6
7
8
9
10
Number of UFLS blocks
Portugal
Ireland
Western Europe
UK
UCTE
Slovenia
Spain
Sweden
0
5
10
15
20
25
30
Average Block Size (%)
Portugal
Ireland
Western Europe
UK
UCTE
Slovenia
Spain
Sweden
International Journal of Applied Engineering Research ISSN 0973-4562 Volume 11, Number 1 (2016) pp 456-472
© Research India Publications. http://www.ripublication.com
460
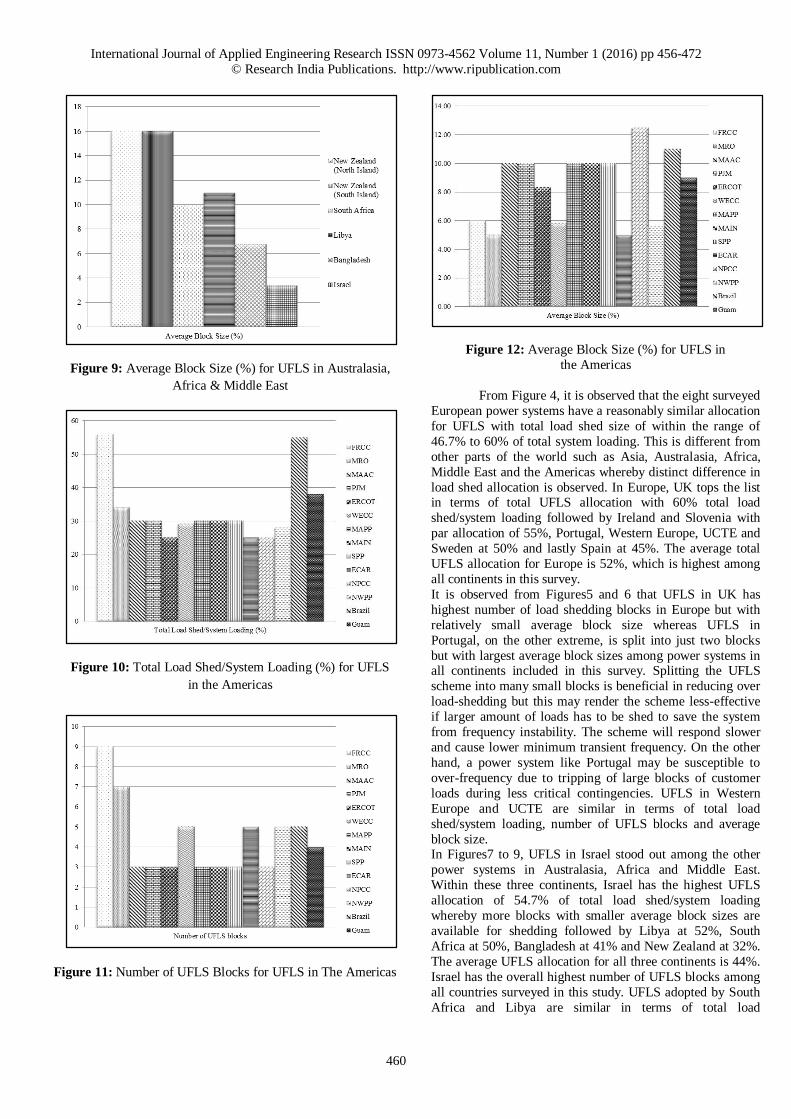
Figure 9: Average Block Size (%) for UFLS in Australasia,
Africa & Middle East
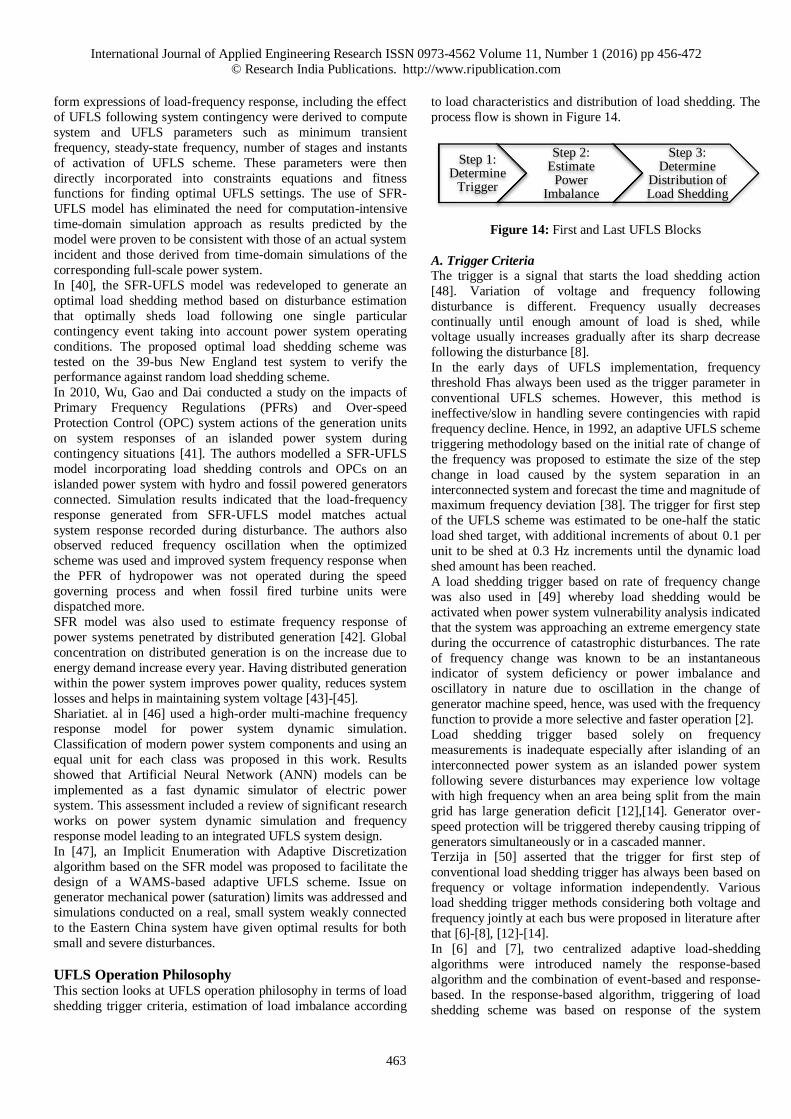
Figure 10: Total Load Shed/System Loading (%) for UFLS
in the Americas
Figure 11: Number of UFLS Blocks for UFLS in The Americas
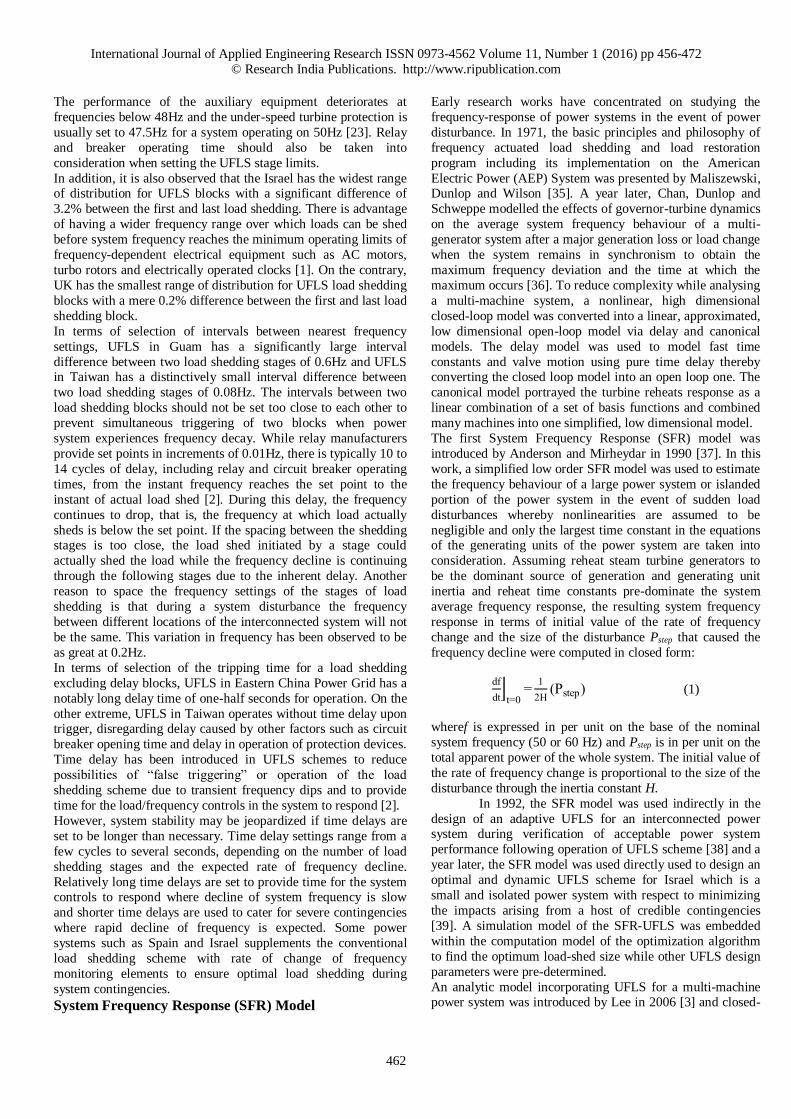
Figure 12: Average Block Size (%) for UFLS in
the Americas
From Figure 4, it is observed that the eight surveyed
European power systems have a reasonably similar allocation
for UFLS with total load shed size of within the range of
46.7% to 60% of total system loading. This is different from
other parts of the world such as Asia, Australasia, Africa,
Middle East and the Americas whereby distinct difference in
load shed allocation is observed. In Europe, UK tops the list in terms of total UFLS allocation with 60% total load
shed/system loading followed by Ireland and Slovenia with
par allocation of 55%, Portugal, Western Europe, UCTE and
Sweden at 50% and lastly Spain at 45%. The average total
UFLS allocation for Europe is 52%, which is highest among
all continents in this survey.
It is observed from Figures5 and 6 that UFLS in UK has
highest number of load shedding blocks in Europe but with
relatively small average block size whereas UFLS in
Portugal, on the other extreme, is split into just two blocks
but with largest average block sizes among power systems in all continents included in this survey. Splitting the UFLS
scheme into many small blocks is beneficial in reducing over
load-shedding but this may render the scheme less-effective
if larger amount of loads has to be shed to save the system
from frequency instability. The scheme will respond slower
and cause lower minimum transient frequency. On the other
hand, a power system like Portugal may be susceptible to
over-frequency due to tripping of large blocks of customer
loads during less critical contingencies. UFLS in Western
Europe and UCTE are similar in terms of total load
shed/system loading, number of UFLS blocks and average
block size. In Figures7 to 9, UFLS in Israel stood out among the other
power systems in Australasia, Africa and Middle East.
Within these three continents, Israel has the highest UFLS
allocation of 54.7% of total load shed/system loading
whereby more blocks with smaller average block sizes are
available for shedding followed by Libya at 52%, South
Africa at 50%, Bangladesh at 41% and New Zealand at 32%.
The average UFLS allocation for all three continents is 44%.
Israel has the overall highest number of UFLS blocks among
all countries surveyed in this study. UFLS adopted by South
Africa and Libya are similar in terms of total load

International Journal of Applied Engineering Research ISSN 0973-4562 Volume 11, Number 1 (2016) pp 456-472
© Research India Publications. http://www.ripublication.com
461
shed/system loading, number of UFLS blocks and average block
size. In addition, it is also noted that UFLS for North and South
Island in New Zealand are identical in terms of total load
shed/system loading, number of UFLS blocks and average block
size.
Figures10 to 12 show that FRCC has the highest total load shed of 56% relative to system loading with the most number
of UFLS blocks in the Americas. Brazil has the second highest
quantum of UFLS allocation at 55% with the second highest
average block size also. Next in line in terms of UFLS allocation
is Guam at 38%, followed by MRO at 34%. Guam is also ranked
fourth amongst other power utility companies in the Americas in
terms of number of UFLS blocks and average block size. MRO is
ranked second in terms of number of UFLS blocks but has one of
the smallest average block sizes which is similar to that of North
China Power Grid and Ireland.
MAAC, PJM, MAPP, MAIN and SPP has identical
UFLS allocation in terms of total load shed/system loading (30%), number of UFLS blocks (three) and average block size
(10%). Next in line are WECC with total UFLS allocation of
29.1% with respect to system loading, NWPP at 28% and lastly
ERCOT, ECAR and NPCC, with the lowest quantum of UFLS
allocation of 25% respectively. WECC, NWPP and ECAR have
relatively high number of UFLS blocks with small block sizes.
On the contrary, ERCOT and NPCC have the least number of
UFLS blocks but with relatively high average block size. The
average total UFLS allocation for this continent is 33%.
Table 1 and Figure 13 show the trip frequencies for the
first and last UFLS block on the 36 power systems studied. FRCC and PJM have the least tolerance for frequency deviation whereby
first UFLS block for both systems operates once the system
frequency drop to 0.5% from the nominal frequency.
Table 1: Trip Frequency Deviation from Nominal Base (%)
Region Power System First UFLS
Block
Last UFLS
Block
Asia Malaysia (East)
Japan Taiwan Thailand Central China Power Grid North China Power Grid Eastern China Power
Grid China/Hong Kong Interconnection
1.2
2.0 1.0 2.0 2.0 1.5 2.0
2.4
3.6
4.0 1.5 4.2 4.0 4.5 4.0
4.0
Europe Portugal Spain UCTE Ireland Western Europe UK
Slovenia Sweden
2.0 1.5 1.0 1.2 1.5 2.0
2.0 2.0
3.0 2.7 1.6 1.5 2.3 2.2
4.0 4.0
Australasia, Africa & Middle East
New Zealand (North Island) New Zealand (South Island) South Africa Libya
2.2 2.5 0.8 0.6
2.5 4.5 2.1 1.4
Bangladesh Israel
NA 1.2
NA 4.4
The Americas FRCC MRO MAAC
PJM ERCOT WECC MAPP MAIN SPP ECAR NPCC
NWPP Brazil Guam
0.5 1.2 1.2
0.5 1.2 1.5 1.2 1.2 1.2 0.8 1.2
1.2 1.5 1.0
3.0 2.7 2.5
1.5 2.5 2.8 2.2 2.2 2.2 2.2 2.0
2.0 2.5 2.8
Figure 13: First and Last UFLS Blocks
The first step frequency is usually set be just below the
system normal operating or the frequency at which the
system could continue to operate [34]. In most systems, the
first block is set to trip at frequency deviation of slightly
lower than 1% from nominal as ±1% of nominal frequency is
the normal operating range whereby generating units can operate continuously [2]. Earlier initiation of load shedding
enables the system to be able to respond faster and allows
more time for generator’s Automatic Voltage Regulators
(AVRs) to respond so that more loads can be shed without
over-voltage problems. However, it is essential to ensure that
the first UFLS block is not too close to the nominal
frequency to avoid unnecessary tripping caused by frequency
swings caused by minor disturbances or sudden changes of
loads whereby the system is able to recover on its own.
Last UFLS block for North China Power Grid and New
Zealand (South Island) is triggered at frequency deviation of
4.5% from nominal and this marks the largest frequency deviation threshold tolerance for the last UFLS block. The
final UFLS block must be coordinated with equipment
operating limits during low frequency operation for instance,
operating limits of plant auxiliaries and turbine protection.
0.0
0.5
1.0
1.5
2.0
2.5
3.0
3.5
4.0
4.5
5.0
Fre
qu
ency
Dev
iati
on (
%)
First UFLS block Last UFLS block
International Journal of Applied Engineering Research ISSN 0973-4562 Volume 11, Number 1 (2016) pp 456-472
© Research India Publications. http://www.ripublication.com
462
The performance of the auxiliary equipment deteriorates at
frequencies below 48Hz and the under-speed turbine protection is
usually set to 47.5Hz for a system operating on 50Hz [23]. Relay
and breaker operating time should also be taken into
consideration when setting the UFLS stage limits.
In addition, it is also observed that the Israel has the widest range of distribution for UFLS blocks with a significant difference of
3.2% between the first and last load shedding. There is advantage
of having a wider frequency range over which loads can be shed
before system frequency reaches the minimum operating limits of
frequency-dependent electrical equipment such as AC motors,
turbo rotors and electrically operated clocks [1]. On the contrary,
UK has the smallest range of distribution for UFLS load shedding
blocks with a mere 0.2% difference between the first and last load
shedding block.
In terms of selection of intervals between nearest frequency
settings, UFLS in Guam has a significantly large interval
difference between two load shedding stages of 0.6Hz and UFLS in Taiwan has a distinctively small interval difference between
two load shedding stages of 0.08Hz. The intervals between two
load shedding blocks should not be set too close to each other to
prevent simultaneous triggering of two blocks when power
system experiences frequency decay. While relay manufacturers
provide set points in increments of 0.01Hz, there is typically 10 to
14 cycles of delay, including relay and circuit breaker operating
times, from the instant frequency reaches the set point to the
instant of actual load shed [2]. During this delay, the frequency
continues to drop, that is, the frequency at which load actually
sheds is below the set point. If the spacing between the shedding stages is too close, the load shed initiated by a stage could
actually shed the load while the frequency decline is continuing
through the following stages due to the inherent delay. Another
reason to space the frequency settings of the stages of load
shedding is that during a system disturbance the frequency
between different locations of the interconnected system will not
be the same. This variation in frequency has been observed to be
as great at 0.2Hz.
In terms of selection of the tripping time for a load shedding
excluding delay blocks, UFLS in Eastern China Power Grid has a
notably long delay time of one-half seconds for operation. On the
other extreme, UFLS in Taiwan operates without time delay upon trigger, disregarding delay caused by other factors such as circuit
breaker opening time and delay in operation of protection devices.
Time delay has been introduced in UFLS schemes to reduce
possibilities of “false triggering” or operation of the load
shedding scheme due to transient frequency dips and to provide
time for the load/frequency controls in the system to respond [2].
However, system stability may be jeopardized if time delays are
set to be longer than necessary. Time delay settings range from a
few cycles to several seconds, depending on the number of load
shedding stages and the expected rate of frequency decline.
Relatively long time delays are set to provide time for the system controls to respond where decline of system frequency is slow
and shorter time delays are used to cater for severe contingencies
where rapid decline of frequency is expected. Some power
systems such as Spain and Israel supplements the conventional
load shedding scheme with rate of change of frequency
monitoring elements to ensure optimal load shedding during
system contingencies.
System Frequency Response (SFR) Model
Early research works have concentrated on studying the
frequency-response of power systems in the event of power
disturbance. In 1971, the basic principles and philosophy of
frequency actuated load shedding and load restoration
program including its implementation on the American
Electric Power (AEP) System was presented by Maliszewski, Dunlop and Wilson [35]. A year later, Chan, Dunlop and
Schweppe modelled the effects of governor-turbine dynamics
on the average system frequency behaviour of a multi-
generator system after a major generation loss or load change
when the system remains in synchronism to obtain the
maximum frequency deviation and the time at which the
maximum occurs [36]. To reduce complexity while analysing
a multi-machine system, a nonlinear, high dimensional
closed-loop model was converted into a linear, approximated,
low dimensional open-loop model via delay and canonical
models. The delay model was used to model fast time
constants and valve motion using pure time delay thereby converting the closed loop model into an open loop one. The
canonical model portrayed the turbine reheats response as a
linear combination of a set of basis functions and combined
many machines into one simplified, low dimensional model.
The first System Frequency Response (SFR) model was
introduced by Anderson and Mirheydar in 1990 [37]. In this
work, a simplified low order SFR model was used to estimate
the frequency behaviour of a large power system or islanded
portion of the power system in the event of sudden load
disturbances whereby nonlinearities are assumed to be
negligible and only the largest time constant in the equations of the generating units of the power system are taken into
consideration. Assuming reheat steam turbine generators to
be the dominant source of generation and generating unit
inertia and reheat time constants pre-dominate the system
average frequency response, the resulting system frequency
response in terms of initial value of the rate of frequency
change and the size of the disturbance Pstep that caused the
frequency decline were computed in closed form:
df
dt⌋
t=0=
1
2H(Pstep) (1)
wheref is expressed in per unit on the base of the nominal
system frequency (50 or 60 Hz) and Pstep is in per unit on the
total apparent power of the whole system. The initial value of
the rate of frequency change is proportional to the size of the
disturbance through the inertia constant H.
In 1992, the SFR model was used indirectly in the
design of an adaptive UFLS for an interconnected power system during verification of acceptable power system
performance following operation of UFLS scheme [38] and a
year later, the SFR model was used directly used to design an
optimal and dynamic UFLS scheme for Israel which is a
small and isolated power system with respect to minimizing
the impacts arising from a host of credible contingencies
[39]. A simulation model of the SFR-UFLS was embedded
within the computation model of the optimization algorithm
to find the optimum load-shed size while other UFLS design
parameters were pre-determined.
An analytic model incorporating UFLS for a multi-machine power system was introduced by Lee in 2006 [3] and closed-
International Journal of Applied Engineering Research ISSN 0973-4562 Volume 11, Number 1 (2016) pp 456-472
© Research India Publications. http://www.ripublication.com
463
form expressions of load-frequency response, including the effect
of UFLS following system contingency were derived to compute
system and UFLS parameters such as minimum transient
frequency, steady-state frequency, number of stages and instants
of activation of UFLS scheme. These parameters were then
directly incorporated into constraints equations and fitness functions for finding optimal UFLS settings. The use of SFR-
UFLS model has eliminated the need for computation-intensive
time-domain simulation approach as results predicted by the
model were proven to be consistent with those of an actual system
incident and those derived from time-domain simulations of the
corresponding full-scale power system.
In [40], the SFR-UFLS model was redeveloped to generate an
optimal load shedding method based on disturbance estimation
that optimally sheds load following one single particular
contingency event taking into account power system operating
conditions. The proposed optimal load shedding scheme was
tested on the 39-bus New England test system to verify the performance against random load shedding scheme.
In 2010, Wu, Gao and Dai conducted a study on the impacts of
Primary Frequency Regulations (PFRs) and Over-speed
Protection Control (OPC) system actions of the generation units
on system responses of an islanded power system during
contingency situations [41]. The authors modelled a SFR-UFLS
model incorporating load shedding controls and OPCs on an
islanded power system with hydro and fossil powered generators
connected. Simulation results indicated that the load-frequency
response generated from SFR-UFLS model matches actual
system response recorded during disturbance. The authors also observed reduced frequency oscillation when the optimized
scheme was used and improved system frequency response when
the PFR of hydropower was not operated during the speed
governing process and when fossil fired turbine units were
dispatched more.
SFR model was also used to estimate frequency response of
power systems penetrated by distributed generation [42]. Global
concentration on distributed generation is on the increase due to
energy demand increase every year. Having distributed generation
within the power system improves power quality, reduces system
losses and helps in maintaining system voltage [43]-[45].
Shariatiet. al in [46] used a high-order multi-machine frequency response model for power system dynamic simulation.
Classification of modern power system components and using an
equal unit for each class was proposed in this work. Results
showed that Artificial Neural Network (ANN) models can be
implemented as a fast dynamic simulator of electric power
system. This assessment included a review of significant research
works on power system dynamic simulation and frequency
response model leading to an integrated UFLS system design.
In [47], an Implicit Enumeration with Adaptive Discretization
algorithm based on the SFR model was proposed to facilitate the
design of a WAMS-based adaptive UFLS scheme. Issue on generator mechanical power (saturation) limits was addressed and
simulations conducted on a real, small system weakly connected
to the Eastern China system have given optimal results for both
small and severe disturbances.
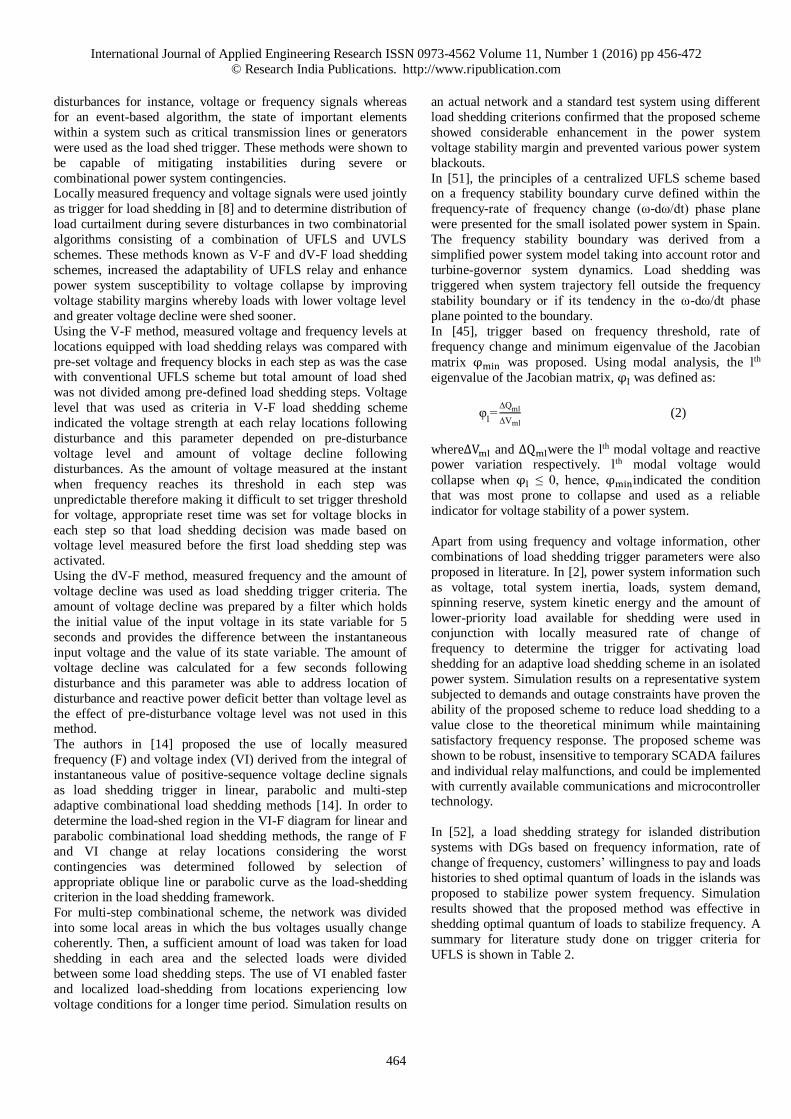
UFLS Operation Philosophy This section looks at UFLS operation philosophy in terms of load
shedding trigger criteria, estimation of load imbalance according
to load characteristics and distribution of load shedding. The
process flow is shown in Figure 14.
Figure 14: First and Last UFLS Blocks
A. Trigger Criteria
The trigger is a signal that starts the load shedding action
[48]. Variation of voltage and frequency following
disturbance is different. Frequency usually decreases
continually until enough amount of load is shed, while voltage usually increases gradually after its sharp decrease
following the disturbance [8].
In the early days of UFLS implementation, frequency
threshold Fhas always been used as the trigger parameter in
conventional UFLS schemes. However, this method is
ineffective/slow in handling severe contingencies with rapid
frequency decline. Hence, in 1992, an adaptive UFLS scheme
triggering methodology based on the initial rate of change of
the frequency was proposed to estimate the size of the step
change in load caused by the system separation in an
interconnected system and forecast the time and magnitude of maximum frequency deviation [38]. The trigger for first step
of the UFLS scheme was estimated to be one-half the static
load shed target, with additional increments of about 0.1 per
unit to be shed at 0.3 Hz increments until the dynamic load
shed amount has been reached.
A load shedding trigger based on rate of frequency change
was also used in [49] whereby load shedding would be
activated when power system vulnerability analysis indicated
that the system was approaching an extreme emergency state
during the occurrence of catastrophic disturbances. The rate
of frequency change was known to be an instantaneous indicator of system deficiency or power imbalance and
oscillatory in nature due to oscillation in the change of
generator machine speed, hence, was used with the frequency
function to provide a more selective and faster operation [2].
Load shedding trigger based solely on frequency
measurements is inadequate especially after islanding of an
interconnected power system as an islanded power system
following severe disturbances may experience low voltage
with high frequency when an area being split from the main
grid has large generation deficit [12],[14]. Generator over-
speed protection will be triggered thereby causing tripping of
generators simultaneously or in a cascaded manner. Terzija in [50] asserted that the trigger for first step of
conventional load shedding trigger has always been based on
frequency or voltage information independently. Various
load shedding trigger methods considering both voltage and
frequency jointly at each bus were proposed in literature after
that [6]-[8], [12]-[14].
In [6] and [7], two centralized adaptive load-shedding
algorithms were introduced namely the response-based
algorithm and the combination of event-based and response-
based. In the response-based algorithm, triggering of load
shedding scheme was based on response of the system
Step 1: Determine
Trigger
Step 2: Estimate
Power Imbalance
Step 3: Determine
Distribution of Load Shedding
International Journal of Applied Engineering Research ISSN 0973-4562 Volume 11, Number 1 (2016) pp 456-472
© Research India Publications. http://www.ripublication.com
464
disturbances for instance, voltage or frequency signals whereas
for an event-based algorithm, the state of important elements
within a system such as critical transmission lines or generators
were used as the load shed trigger. These methods were shown to
be capable of mitigating instabilities during severe or
combinational power system contingencies. Locally measured frequency and voltage signals were used jointly
as trigger for load shedding in [8] and to determine distribution of
load curtailment during severe disturbances in two combinatorial
algorithms consisting of a combination of UFLS and UVLS
schemes. These methods known as V-F and dV-F load shedding
schemes, increased the adaptability of UFLS relay and enhance
power system susceptibility to voltage collapse by improving
voltage stability margins whereby loads with lower voltage level
and greater voltage decline were shed sooner.
Using the V-F method, measured voltage and frequency levels at
locations equipped with load shedding relays was compared with
pre-set voltage and frequency blocks in each step as was the case with conventional UFLS scheme but total amount of load shed
was not divided among pre-defined load shedding steps. Voltage
level that was used as criteria in V-F load shedding scheme
indicated the voltage strength at each relay locations following
disturbance and this parameter depended on pre-disturbance
voltage level and amount of voltage decline following
disturbances. As the amount of voltage measured at the instant
when frequency reaches its threshold in each step was
unpredictable therefore making it difficult to set trigger threshold
for voltage, appropriate reset time was set for voltage blocks in
each step so that load shedding decision was made based on voltage level measured before the first load shedding step was
activated.
Using the dV-F method, measured frequency and the amount of
voltage decline was used as load shedding trigger criteria. The
amount of voltage decline was prepared by a filter which holds
the initial value of the input voltage in its state variable for 5
seconds and provides the difference between the instantaneous
input voltage and the value of its state variable. The amount of
voltage decline was calculated for a few seconds following
disturbance and this parameter was able to address location of
disturbance and reactive power deficit better than voltage level as
the effect of pre-disturbance voltage level was not used in this method.
The authors in [14] proposed the use of locally measured
frequency (F) and voltage index (VI) derived from the integral of
instantaneous value of positive-sequence voltage decline signals
as load shedding trigger in linear, parabolic and multi-step
adaptive combinational load shedding methods [14]. In order to
determine the load-shed region in the VI-F diagram for linear and
parabolic combinational load shedding methods, the range of F
and VI change at relay locations considering the worst
contingencies was determined followed by selection of
appropriate oblique line or parabolic curve as the load-shedding criterion in the load shedding framework.
For multi-step combinational scheme, the network was divided
into some local areas in which the bus voltages usually change
coherently. Then, a sufficient amount of load was taken for load
shedding in each area and the selected loads were divided
between some load shedding steps. The use of VI enabled faster
and localized load-shedding from locations experiencing low
voltage conditions for a longer time period. Simulation results on
an actual network and a standard test system using different
load shedding criterions confirmed that the proposed scheme
showed considerable enhancement in the power system
voltage stability margin and prevented various power system
blackouts.
In [51], the principles of a centralized UFLS scheme based on a frequency stability boundary curve defined within the
frequency-rate of frequency change (ω-dω/dt) phase plane
were presented for the small isolated power system in Spain.
The frequency stability boundary was derived from a
simplified power system model taking into account rotor and
turbine-governor system dynamics. Load shedding was
triggered when system trajectory fell outside the frequency
stability boundary or if its tendency in the ω-dω/dt phase
plane pointed to the boundary.
In [45], trigger based on frequency threshold, rate of
frequency change and minimum eigenvalue of the Jacobian
matrix φmin was proposed. Using modal analysis, the lth
eigenvalue of the Jacobian matrix, φl was defined as:
φl=
∆Qml
∆Vml (2)
where∆Vml and ∆Qmlwere the lth modal voltage and reactive power variation respectively. lth modal voltage would
collapse when φl ≤ 0, hence, φminindicated the condition
that was most prone to collapse and used as a reliable
indicator for voltage stability of a power system.
Apart from using frequency and voltage information, other
combinations of load shedding trigger parameters were also
proposed in literature. In [2], power system information such
as voltage, total system inertia, loads, system demand,
spinning reserve, system kinetic energy and the amount of
lower-priority load available for shedding were used in conjunction with locally measured rate of change of
frequency to determine the trigger for activating load
shedding for an adaptive load shedding scheme in an isolated
power system. Simulation results on a representative system
subjected to demands and outage constraints have proven the
ability of the proposed scheme to reduce load shedding to a
value close to the theoretical minimum while maintaining
satisfactory frequency response. The proposed scheme was
shown to be robust, insensitive to temporary SCADA failures
and individual relay malfunctions, and could be implemented
with currently available communications and microcontroller technology.
In [52], a load shedding strategy for islanded distribution
systems with DGs based on frequency information, rate of
change of frequency, customers’ willingness to pay and loads
histories to shed optimal quantum of loads in the islands was
proposed to stabilize power system frequency. Simulation
results showed that the proposed method was effective in
shedding optimal quantum of loads to stabilize frequency. A
summary for literature study done on trigger criteria for
UFLS is shown in Table 2.
International Journal of Applied Engineering Research ISSN 0973-4562 Volume 11, Number 1 (2016) pp 456-472
© Research India Publications. http://www.ripublication.com
465
Table 2: Literature Study on Trigger Criteria for UFLS
Year Trigger Criteria
Early Days
1992
2003
2006
2007
2008
2009
2011
2013
Frequency Threshold
Initial Rate of Frequency Change
Rate of Frequency Change
Frequency and Voltage Information Independently
Power System Information and Rate of Frequency
Change, Voltage/Frequency Information (Event-based),
Status of Critical Assets (Response-based)
Frequency and Voltage Information Jointly
Frequency Information, Customers’ Willingness to Pay,
Load Histories
VI-F Diagram
Frequency Boundary Curve, Frequency Threshold and Minimum Eigenvalue of Jacobian Matrix (Voltage
Stability Assessment)
B. Load Characteristics for Power Imbalance Estimation
Frequency of a power system is affected by components
connected to it especially bulk customer loads [46]. Past literature
has shown that load characteristics have significant influence on
the dynamic behaviour of power systems during low frequency
oscillation and severe faults.
In the classic SFR model, only inertia constant of generator and frequency information are considered and the impact of voltage
dependence of loads is not taken into account. However, as
suggested in IEEE standard for UFLS [53], the load models with
voltage and frequency dependence should also be included in the
design for UFLS in order to achieve accurate active power
imbalance estimation. Voltage deviation controls the variation of
the load active power in the initial one to two seconds following
disturbance after which the frequency takes precedence [54].
When a power system encounters a severe under-frequency
condition, generator governor will regulate the mechanical output
power by frequency variation and the loads connected to the
system will regulate its active power [55] to prevent system from collapsing. Loads can be assumed to be highly frequency and
voltage dependent in order to simulate the worst case contingency
scenario for the design of an optimal load shedding scheme [56].
There are three main types of loads usually used in power system
dynamic analysis namely static loads, dynamic loads and
composite loads. Characteristics of static load models can be
expressed using voltage and frequency dependent algebraic
models [57]. The exponential and polynomial representation of
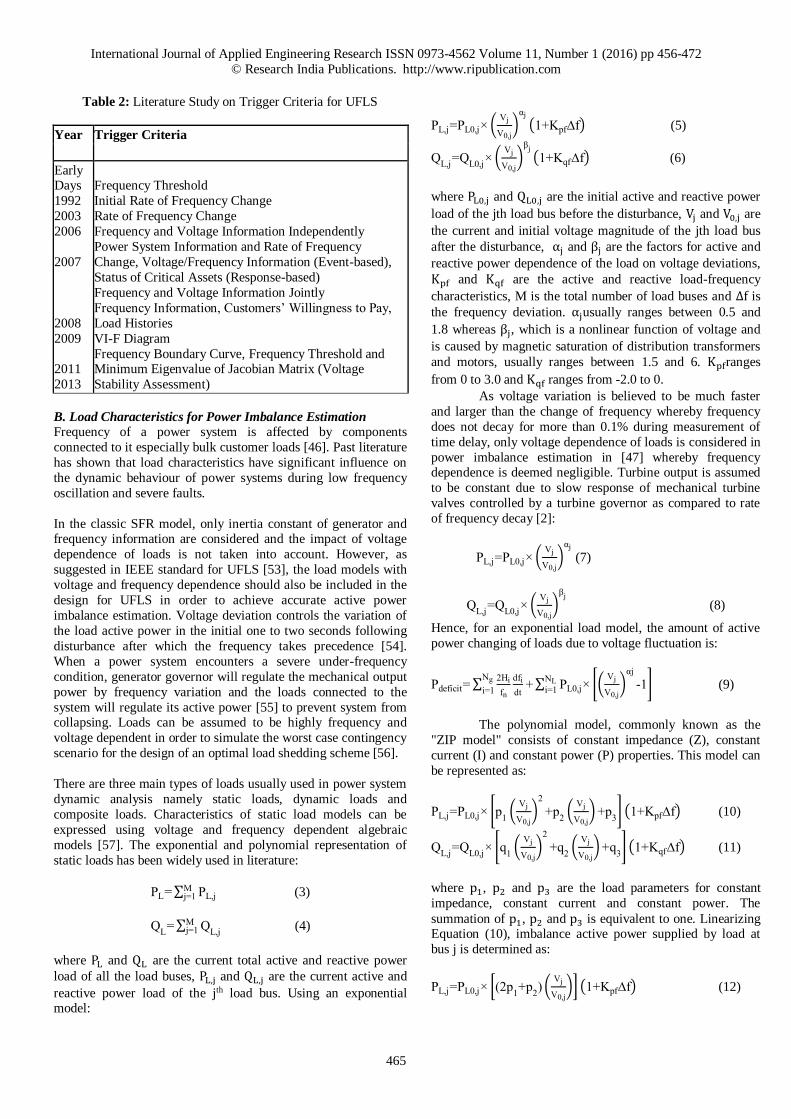
static loads has been widely used in literature:
PL= ∑ PL,jMj=1 (3)
QL= ∑ Q
L,jMj=1 (4)
where PL and QL are the current total active and reactive power
load of all the load buses, PL,j and QL,j are the current active and
reactive power load of the jth load bus. Using an exponential model:
PL,j=PL0,j× (Vj
V0,j)
αj
(1+Kpf∆f) (5)
QL,j
=QL0,j
× (Vj
V0,j)
βj
(1+Kqf∆f) (6)
where PL0,j and QL0,j are the initial active and reactive power
load of the jth load bus before the disturbance, Vj and V0,j are
the current and initial voltage magnitude of the jth load bus
after the disturbance, αj and βj are the factors for active and
reactive power dependence of the load on voltage deviations,
Kpf and Kqf are the active and reactive load-frequency
characteristics, M is the total number of load buses and ∆f is
the frequency deviation. αjusually ranges between 0.5 and
1.8 whereas βj, which is a nonlinear function of voltage and
is caused by magnetic saturation of distribution transformers
and motors, usually ranges between 1.5 and 6. Kpfranges
from 0 to 3.0 and Kqf ranges from -2.0 to 0.
As voltage variation is believed to be much faster
and larger than the change of frequency whereby frequency
does not decay for more than 0.1% during measurement of
time delay, only voltage dependence of loads is considered in
power imbalance estimation in [47] whereby frequency dependence is deemed negligible. Turbine output is assumed
to be constant due to slow response of mechanical turbine
valves controlled by a turbine governor as compared to rate
of frequency decay [2]:
PL,j=PL0,j× (Vj
V0,j)
αj
(7)
QL,j
=QL0,j
× (Vj
V0,j)
βj
(8)
Hence, for an exponential load model, the amount of active
power changing of loads due to voltage fluctuation is:
Pdeficit= ∑2Hi
fn
dfi
dt+
Ng
i=1∑ PL0,j× [(
Vj
V0,j)
αj
-1]NL
i=1 (9)
The polynomial model, commonly known as the
"ZIP model" consists of constant impedance (Z), constant
current (I) and constant power (P) properties. This model can
be represented as:
PL,j=PL0,j× [p1(
Vj
V0,j)
2
+p2(
Vj
V0,j) +p
3] (1+Kpf∆f) (10)
QL,j
=QL0,j
× [q1(
Vj
V0,j)
2
+q2(
Vj
V0,j) +q
3] (1+Kqf∆f) (11)
where p1, p2 and p3 are the load parameters for constant
impedance, constant current and constant power. The
summation of p1, p2 and p3 is equivalent to one. Linearizing Equation (10), imbalance active power supplied by load at
bus j is determined as:
PL,j=PL0,j× [(2p1+p
2)(
Vj
V0,j)] (1+Kpf∆f) (12)

International Journal of Applied Engineering Research ISSN 0973-4562 Volume 11, Number 1 (2016) pp 456-472
© Research India Publications. http://www.ripublication.com
466
whereby ∆Vj = Vj − V0,j. As voltage variation is believed to be
much faster and larger than the change of frequency whereby
frequency does not decay for more than 0.1% during
measurement of time delay, only voltage dependence of loads is
considered in power imbalance estimation in whereby frequency
dependence is deemed negligible. Therefore, the total active
power imbalance for a polynomial model is:
Pdeficit= ∑2Hi
fn
dfi
dt+
Ng
i=1
∑ PL0,j× [(2p1+p
2)(
Vj
V0,j
)]
NL
i=1
=2Hc
fc
dfcoi
dt+ ∑ PL0,j× [(2p
1+p
2)(
Vj
V0,j)]NL
i=1 (13)
In [46], the EPRI static load model was used to represent
voltage and frequency dependence of this type of load
appropriately:
PL=P0 [Pα1 (V
V0)
kpv1
(1+Kpf1∆f)+(1-Pα1) (V
V0)
kpv2
] (14)
QL=P0 [Q
α1(
V
V0)
kqv1
(1+Kqf1∆f)+ (Q0
P0-Q
α1) (
V
V0)
kqv2
(1+Kqf2∆f)]
(15)
wherePα1 was the frequency dependent fraction of real load and
Qα1 was the reactive load coefficient of uncompensated reactive
load to real power load. kpv1andkpv2 were the voltage exponents
for frequency-dependent and frequency-independent real power
load whereas kqv1 and kqv2 were the voltage exponents for
uncompensated and compensated reactive power load. Kpf1was
the frequency sensitivity coefficient for real power load whereas
Kqf1 and Kqf2 were the frequency sensitivity coefficient for
uncompensated and compensated reactive power load. Hence, the
total active power imbalance for the model is:
Pdeficit= ∑2Hi
fn
dfi
dt+
Ng
i=1∑ PL0,j× [Pα1 (
V
V0)
kpv1
(1+Kpf1∆f)+(1-NL
i=1
Pα1) (V
V0)
kpv2
] (16)
Two commonly known types of dynamic loads are induction
motor loads and synchronous motor loads. The dynamics of loads
are usually modelled using EPRI LOADSYN program in studies
of inter-area oscillations and voltage stability or when running
studies on systems with large concentration of motors. The
program converts data on the dynamic aspects of load
components into the form required for stability studies. Dynamic
aspects of load components include load class mix, dynamics of
motors which consume more than 60% of total energy supplied
by a power system, operation of protective relays, thermostatic
control of loads such as water heaters and refrigerators which
operate longer during low voltages and response of ULTCs on
distribution transformers and voltage regulators.
The dynamic differential state equations were treated as algebraic
constraints in [58] after discretization thereby enabling the
transient behaviour of the system after fault clearing time to be
written in a compact way [58]-[60]. The consumer loads used in
the model were approximated by a resistive fraction of 60 %
and an inductive rotating fraction of 40% of the respective
maximal load. An induction motor load was used to represent
the 40% inductive fraction.
In [42], an equivalent induction motor was modelled as a
dynamic load model [61] at each load bus to represent the
induction motor portion of the load at that bus, in order to
consider the large impact of dynamic loads on the system
voltage stability. Figures15 and 16 show the equivalent
circuit of an induction motor [57] and a synchronous motor
where Rs is the stator resistance, Rr is the rotor resistance, Xr
is the rotor reactance, Xs is the stator reactance, S is the slip
and Xm is the exciting reactance.
Figure 15: Architecture of Sensor Node
Figure 16: Equivalent Circuit of Synchronous Motor
Composite load model consist of a combination of static and
dynamic load models. The equivalent circuit of a composite
model [52] is shown in Figure 17. Table 3 shows the
summary table for computation of power imbalance for
static, dynamic and composite loads. It is observed that
quantum of active power imbalance is affected by type or
characteristics of loads connected to the power system.
Figure 17: Equivalent Circuit of Composite Model
Rr
s
Rs Xs Xr
Xm V Rr
s
Rs Xs Xr
Xm Rc Rr
s
Rr
s Xm
Xr Rs Xs
V Static Model
Rr
s

International Journal of Applied Engineering Research ISSN 0973-4562 Volume 11, Number 1 (2016) pp 456-472
© Research India Publications. http://www.ripublication.com
467
Table 3: Summary on Computation of Power Imbalance for
Static, Dynamic and Composite Loads
Type of Loads Power Imbalance Calculation
Static Exponential
Polynomial
(ZIP)
EPRI
Pdeficit= ∑2Hi
fn
dfi
dt+
Ng
i=1
∑ PL0,j× [(Vj
V0,j
)
αj
-1]
NL
i=1
Pdeficit= ∑2Hi
fn
dfi
dt+
Ng
i=1
∑ PL0,j× [(2p1+p
2) (
Vj
V0,j
)]
NL
i=1
Pdeficit= ∑2Hi
fn
dfi
dt+
Ng
i=1
∑ PL0,j×
[ Pα1 (
V
V0
)kpv1
(1+Kpf1∆f)+
(1-Pα1) (V
V0
)kpv2
] NL
i=1
Dyna
mic
Induction
Motor
Synchronous
Motor
Parameters Computed with EPRI
LOADSYN Program
Parameters Computed with EPRI
LOADSYN Program
Composite Parameters Computed with EPRI
LOADSYN Program
Distribution of Load Shedding In conventional schemes, fixed quantum of loads is shed at pre-
determined locations when frequency drops below frequency
threshold regardless of type of disturbance and all load buses are
involved in sharing of total power imbalance without selection.
This type of load shedding scheme is not practical and lacks
flexibility to execute load shedding fit for different type of
instabilities.
Other form of frequency-related information are also used to
determine distribution of load shedding for instance rate of
frequency change, df/dt and average rate of frequency change, Δf,
although the latter is usually used [53] due to the oscillatory
nature of the former which may provide misleading information on frequency variation during system contingencies. In [62], the
quantum of active power loads to be shed at jth load bus was
estimated as follows:
∆PLj=∆fLj∙PL0,j
∑ (∆fLj∙PL0,j)Mj=1
∙∆P (17)
where∆PL0,j is the quantum of active power load on jth bus before
disturbance, ∆fLj is the frequency deviation at jth load bus
compared to nominal frequency and M is the number of load
buses.
Load shedding distribution relying solely on frequency
information is inadequate because frequency decline during major
contingency may also lead to voltage instability. The concept of centralized adaptive UFLS algorithm was proposed in [6] and [7]
to mitigate cascading events due to frequency and voltage
instability following combinational disturbances. The authors
asserted that power systems were prone to cascading events due
to high dependence of loads on voltage, low frequency settings of
UFLS relays and inappropriate selection of quantum and location
of load shed. The authors proposed two algorithms to determine
the distribution of load shedding namely magnitude of sub-
transmission bus voltages and static voltage stability V-Q margins
of buses. Simulation studies performed on the Khorasan’s
network within the Iran interconnected grid showed that
these algorithms could effectively preserve system stability
following severe contingencies and successfully optimize the
quantum of load shed.
In [8], two combinatorial algorithms to combine UFLS and UVLS schemes were presented whereby parameters such as
voltage sensitivity of loads, voltage profile and location of
disturbance, determined from locally measured frequency
and voltage signals were used to determine distribution of
load curtailment during severe disturbances. These methods
known as V-F and dV-F load shedding schemes, was proven
to increase adaptability of UFLS relay and enhance power
system susceptibility to voltage collapse by improving
voltage stability margins especially for vulnerable points of
the system whereby loads with greater voltage decline and
higher reactive power demand were shed sooner.
With the V-F method, loads were classified into different steps according to the measured voltage level following
disturbance whereby loads with lower voltage and more
reactive power shortage were shed sooner. The scheme
comprised of a logical AND combination of voltage and
frequency blocks which was activated when the measured
voltage and frequency at the relay location were lesser than
predetermined thresholds of the voltage and frequency
blocks.
In the dV-F scheme, the amount of voltage decline was used
as a criterion in the voltage blocks instead of the voltage
level. The amount of voltage decline could address location of disturbance and reactive power deficit better than voltage
level, because the effect of pre-disturbance voltage level was
excluded in this method. Loads with greater voltage decline
or more reactive power shortage were shed sooner and
therefore selected locations of load shedding became more
dependent to the location of disturbance.
In [63], distribution of load shedding for an adaptive scheme
designed for a system connected with distributed generation
was done through a distribution management system (DMS)
which provided fast and optimal load management by
utilizing system topology, DG power generation; load demand and actual operating conditions. The quantum of
loads to be disconnected was evaluated according to real-time
loading of the feeder to be cut off and the total should meet
the calculated load shedding amount required.
An improved method of load-shedding model based on
contribution factors and distribution factors between loads
and generators in power flow tracing was proposed in [64]
whereby nodes with larger contribution factors and
distribution factors are selected to be adjusted to ensure that
the adjustment on the overload lines is the most effective, while having little impact on the non-overload lines. This
method decreased the number of the nodes to be regulated,
which in turn improved calculation speed and accuracy. The
contribution factor, αg referred to the share of the power of
generator contributing to the target line ratio of overloaded
line whereas distribution factor, αf represented the share of
the power injections of generation buses to the target line
ratio of generator power:

International Journal of Applied Engineering Research ISSN 0973-4562 Volume 11, Number 1 (2016) pp 456-472
© Research India Publications. http://www.ripublication.com
468
αf=PGi→l
PGi (18)
αg=PGi→l
Pl (19)
wherePGi→l was the power of ith generator that carries inflow to
line l, PGi was the power of generator i and Pl was the power flow
of line l. The suggested method could be useful in the risk
assessment of generation and transmission system for regulating
power flow.
Liu, Zhang and Yu in [12] proposed that load shedding should be
started from the locations encountering higher voltage decay and for longer period of time. The speed, location, and amount of load
shedding have to be changed adaptively depending on the
disturbance location, voltage status of the system, and the rate of
frequency decline. Operation of the conventional and the
proposed adaptive combinatorial load shedding methods were
simulated in an actual large network and simulation results
confirmed that the proposed methods provide considerable
enhancement in the power system voltage stability margin, and by
using the proposed algorithms, various power system blackouts
could be prevented.
A WAMS-based load shedding scheme was proposed in [65] to
mitigate combinatorial and severe contingencies which can jeopardize both frequency and voltage stability. The quantum of
load shed was calculated based on computed disturbance power
and voltage stability conditions of the power system with the aid
of real-time data taken from synchrophasor-based wide area
monitoring and control system (WAMCS). Frequency stability
analysis was carried out based on the low-order SFR model in
[37] for estimating the magnitude and subsequent classification of
the disturbance. Voltage stability was determined based on a
dynamic voltage stability criterion, formulated using Voltage
Stability Risk Index (VSRI) and load curtailments on load buses
were done according to this index:
VSRIj= {
∑(dk+d
k-1)
2j
j
k=1 , j=1, 2, …, N if j≤N)
∑(dk+d
k-1)∆t/2N
2j
j
k=j-N+1, j=N+1,…, M if j>N
(20)
whereby moving average value of load bus voltage at jth instant
from N available PMU measurements was computed from:
vj= {∑ y
k/j
j
k=1 , j=1, 2,…,M if j≤N
∑ yk/N
j
k=1 , j=N+1, …,M if j>N (21)
versity between voltage measured at jth instant was taken to be:
dj= (yj-vj) ×
100
vj, j=1, 2, …, M (22)
Load buses with a smaller negative index has the higher risk of
the voltage instability, hence, would be shed earlier. Peak values
of the VSRIs at buses indicated the highest voltage deviation from
nominal values and would converge to zero during steady-state.
Distribution of load shedding was determined as follows:
∆Pj= {
∆vj
∑ (∆vj)Mj=1
×∆P, for large disturbances
VSRIj
∑ (VSRIj)Mj=1
×∆P, for small disturbances (23)
In [48], Tang et.al. identified two setbacks in existing load
shedding distribution methods namely negligence of reactive
power and voltage stability issues leading to ineffective load
shedding. To address these setbacks, the authors proposed the
use of two indices – the load shedding distribution factor for
active power (LSDFP) and load shedding distribution factor
for reactive power (LSDFQ) which represented the active and
reactive load imbalance. In the calculation of these indices,
power flow tracing method was used to estimate the initial
loading of each load buses:
LSDFPj=∆fLj∙Ptracing,j
∑ (Mj=1 ∆fLj∙Ptracing,j)
(24)
LSDFQj=
VQSj∙Qtracing,j
∑ (Mj=1 VQSj ∙Qtracing,j)
(25)
where ∆fLj was the frequency deviation to the rated
frequency of the jth load bus, VQSj was the sensitivity of
voltage variation to reactive power of the jth load bus, Ptracing,j
and Qtracing,j
were the tracing active and reactive power from
the generators and lines to load buses. Hence, the distribution
of active and reactive power load shed was computed as:
∆PLj=∆Pimprovement ∙LSDFPj (26)
∆QLj
=∆Qimprovement
∙LSDFQj (27)
where∆Pimprovement and ∆Qimprovement
were total active and
reactive power deficit for voltage-dependent load models.
The new method was tested on the IEEE 39-Bus system and
simulation results showed improvement in terms of
frequency and voltage stability and loadability. Table 4
shows the summary of literature study done on the
distribution of load shedding for UFLS.
Table 4: Literature Study on Distribution of Load Shedding
for UFLS
Year Distribution of Load Shedding
Early Days
2005 2007
2008
2009
2011
2013
Fixed quantum of load shed
Based on average rate of frequency change Based on V-Q margin
Based on V-F and dV-F
Distribution Management System, Based on
disturbance location, voltage status, rate of
frequency decline
Power flow tracing using contribution and
distribution factors, Frequency stability analysis
and voltage stability analysis (VSRI)
Power flow tracing using LSDFP and LSDFQ
International Journal of Applied Engineering Research ISSN 0973-4562 Volume 11, Number 1 (2016) pp 456-472
© Research India Publications. http://www.ripublication.com
469
Conclusion UFLS scheme is a popular mitigation method used to arrest a
power system from load-generation imbalance in various parts of
the world such as Asia, Europe, Australasia, Africa, Middle East and the Americas. UFLS in these continents differ in terms of
total load shed, number of UFLS blocks, average block size and
trip frequency deviation thresholds depending on their system
size, system inertia and generation mix.
The SFR model has been widely used in computation of load-
frequency response of a power system during system
contingency. However in the classic SFR model, only inertia
constant of generator and frequency information are considered
and the impact of voltage dependence of loads is not taken into
account although load characteristics have been proven to have
significant influence on the dynamic behaviour of power systems during low frequency oscillation and severe faults. In more recent
literature, SFR model incorporating frequency and voltage
dependence load models is proposed and used in the design of
optimal UFLS scheme.
UFLS operating philosophies consisting of three important areas
namely trigger criteria, load characteristics and load shedding
distribution have always been based solely on frequency
parameters in the early days of implementation. Load shedding
trigger based solely on frequency measurements is inadequate to
determine the stability and “health” of a power system especially
after islanding of an interconnected power system as an islanded
power system following severe disturbances may experience low voltage with high frequency when an area being split from the
main grid has large generation deficit. The power system may be
susceptible to voltage collapse as well, which will lead to total
system blackout within shorter time duration as compared to a
frequency collapse phenomenon. Hence, trigger condition
considering voltage information and voltage stability criterions
are introduced and implemented in UFLS schemes.
Distribution of load shedding affects the minimum frequency
deviation from nominal and steady-state frequency recovery
following disturbances. In the early days of UFLS
implementation, fixed quantum of loads is shed at pre-determined locations based solely on system frequency information
regardless of type of disturbance and all load buses are involved
in sharing of total power imbalance without selection.
Improvement in this area is introduced over the years to cater for
combined frequency and voltage instabilities. In recent years,
distribution of load shedding based on power flow tracing method
is used. This method caters for both frequency and voltage
instabilities and has been proven to give optimal system response.
Acknowledgement The authors would like to thank Universiti Malaysia Sarawak
who has funded this research work.
References
[1] A. A. MohdZin, Mohd Hafiz, and M. S. Aziz, “A Review
of Under-frequency Load Shedding Scheme on TNB
System”, National Power and Energy Conference, 2004.
[2] Power Systems Relaying Committee, IEEE Power
Engineering Society, “IEEE Guide for the Application of
Protective Relays Used for Abnormal Frequency Load
Shedding and Restoration”, IEEE Standard C37.117-
2007, 2007.
[3] D. H. A. Lee, “A General-Order System Frequency
Response Modelincorporating Load Shedding:
Analytic Modelling and Applications”, IEEE
Transactions on Power System, vol. 21, no.2, pp. 709
– 717, 2006.
[4] B. Delfino, S. Massucco, A. Morini, P. Scalera, and F.
Silvestro, “Implementation and comparison of
different under-frequency load shedding scheme”,
Power Engineering Society Summer Meeting 2001,
2001.
[5] V. V. Terzija, “Adaptive Underfrequency Load
Shedding Based on the Magnitude of the Disturbance
Estimation”, IEEE Transactions on Power Systems,
vol. 21, no.3, pp. 1260-1266, 2006.
[6] M. S. Pasand, and H. Seyedi, “New Centralized
Adaptive Under Frequency Load Shedding
Algorithms”, 2007 Large Engineering Systems
Conference on Power Engineering, 2007.
[7] H. Seyedi, and M. S. Pasand, “New Centralised
Adaptive Load-Shedding Algorithms to Mitigate
Power System Blackouts”, IET Generation,
Transmission & Distribution, vol. 3, no. 1, pp. 99-114,
2009.
[8] A. Saffarian, M. S. Pasand, and H. Asadi,
“Performance Investigation of New Combinational
Load Shedding Schemes”, Joint International
Conference on Power System Technology and 2008
IEEE Power India Conference (POWERCON 2008),
2008.
[9] Y. Welhazi, T. Guesmi, I. B. Jaoued, and H. H.
Abdallah, “Power System Stability Enhancement
Using FACTS Controllers in Multimachine Power
Systems”, Journal of Electrical Systems, vol. 10, no. 3,
pp. 276-291, 2014.
[10] R. Z. Davarani, and R. Ghazi, “Optimal Simultaneous
Coordination of PSS and TCSSC using Multi
Objective Genetic Algorithm”, Journal of Electrical
Systems, vol. 9, no. 4, pp. 410-421, 2013.
[11] M. V. Suganyadevi, and C. K. Babulal, “Fast
Assessment of Voltage Stability Margin of a Power
System”, Journal of Electrical Systems, vol. 20, no. 3,
pp. 305-316, 2014.
[12] Y. Liu, W. Zhang, and Z. Yu, “Measures to Keep
Islands Stable after Power Oscillation or Out of Step
Islanding”, 8th International Conference on Advances
in Power System Control, Operation and Management
(APSCOM 2009), 2009.
[13] A. Saffarian, and M. S. Pasand, “Enhancement of
Power System Stability Using Adaptive
Combinational Load Shedding Methods”, IEEE
Transactions on Power Systems, vol. 26, no. 3, pp.
1010-1020, 2011.
International Journal of Applied Engineering Research ISSN 0973-4562 Volume 11, Number 1 (2016) pp 456-472
© Research India Publications. http://www.ripublication.com
470
[14] A. P. Ghaleh, M. S. Pasand, and A. Saffarian, “Power
System Stability Enhancement using a New Combinational
Load-Shedding Algorithm”, IET Generation, Transmission
& Distribution, vol. 5, no. 5, pp. 551-560, 2011.
[15] Z. Zhang, and Z. C. X. Wang, “Study on Emergency
Control Based on Regional Frequency Response Model”,
2011 The International Conference on Advanced Power
System Automation and Protection, 2011.
[16] H. Samet, and M. Rashidi, “Coordinated Under Frequency
Load and Capacitor Shedding for Bulk Power Systems”,
IET Generation, Transmission & Distribution, vol. 7, no. 8,
pp. 799-812, 2013.
[17] A. Sauhats, V. Chuvychin, V. Strelkovs, R. Petrichenko,
and E. Antonov, “Underfrequency Load Shedding in Large
Interconnection”, IEEE Grenoble Power Tech
(POWERTECH), 2013.
[18] Y-W. Au, and K-M. Yung, “Emergency Control and
Restoration of Power System under Disturbance”,
Proceedings of the 4th International Conference on
Advances in Power System Control, Operation and
Management (APSCOM-97), 1997.
[19] L. E. Ling, and N. M. Vong, “Special Load Shedding
Scheme to Enhance System Stability of Small Power
System”, 2006 International Conference on Power System
Technology, 2006.
[20] W. Pimjaipong, T. Junrussameevilai, and N. Maneerat,
“Blackout Prevention Plan – The Stability, Reliability and
Security Enhancement in Thailand Power Grid”, 2005
IEEE/PES Transmission and Distribution Conference and
Exhibition: Asia and Pacific, 2005.
[21] S. Imai, and T. Yasuda, “UFLS Program to Ensure Stable
Island Operation”, IEEE PES Power Systems Conference
and Exposition, 2004.
[22] S.-J. Huang, and C.-C. Huang, “An Automatic Load
Shedding Scheme Including Pumped-Storage Units”, IEEE
Transactions on Energy Conversion, vo. 15, no. 4, pp. 427-
432, 2000.
[23] L. E. Ling, V. Wong, and N. M. Vong, “Wide Area
Protection (WAP) as an Enhanced Load Shedding Scheme
to Mitigate Loss of Supply to Load Center”, Conference of
the Electric Power Supply Industry (CEPSI) 2010, 2010.
[24] Y. Lu, W-S. Kao, and Y-T. Chen, “Study of Applying
Load Shedding Scheme with Dynamic D-Factor Values of
Various Dynamic Load Models to Taiwan Power System”,
IEEE Transactions on Power Systems, vol. 20, no. 4, pp.
1976-1984, 2005.
[25] Midwest Reliability Organization, “Midwest Reliability
Organization Under-frequency Load Shedding Program
Report and Recommendations”, 2007.
[26] K. U. Z. Mollah, M. Bahadornejad, and N. K. –C. Nair,
“Automatic Under-Frequency Load Shedding in New
Zealand Power System – A Systematic Review”, 21st
Australasian Universities Power Engineering Conference
(AUPEC), 2011.
[27] U. Rudez, and R. Mihalic, “Dynamic Analysis of
Transition into Island Conditions of Slovenian Power
System Applying Underfreuqency Load Shedding
Scheme”, 2009 IEEE Bucharest Power Tech
Conference, 2009.
[28] S. Lindahl, G. Runvik, and G. Stranne, “Operational
Experience of Load Shedding and New Requirements
on Frequency Relays”, Developments in Power
System Protection, 1997.
[29] R. V. Fernandes, S. A. B. de Almeida, F. P. Maciel
Barbosa, and RuiPestana, “Load Shedding –
Coordination between the Portuguese Transmission
Grid and the Distribution Grid with Minimization of
Loss of Distributed Generation”, 2009 IEEE Bucharest
Power Tech Conference, 2009.
[30] WECC, “WECC Coordinated Off-Nominal Frequency
Load Shedding and Restoration Requirements”, 2003.
[31] H. H. Wong, J. C. Flores, Y. Fang, and R. P. Baldevia
Jr., “Guam Power Authority Automatic
Underfrequency Load Shedding Study”, International
Conference on Energy Management and Power
Delivery, 1995.
[32] FRCC, Florida Reliability Coordinating Council,
“FRCC Handbook”, 2008.
[33] MAAC, Mid Atlantic Area Council, “MAAC
Protective Relaying Philosophy and Design
Standards”, 1997.
[34] Y. R. Omar, I. Z. Abidin, S. Yusof, H. Hashim, H. A.
Abdul Rashid, “Under Frequency Load Shedding
(UFLS): Principles and Implementation”, Proceedings
of 2010 IEEE International Conference on Power and
Energy, 2010.
[35] R. M. Maliszewski, R. D. Dunlop, and G. L. Wilson,
“Frequency Actuated Load Shedding and Restoration
Part I – Philosophy”, IEEE Transactions on Power
Apparatus and Systems, vol. PAS-90, no. 4, pp. 1452-
1459, 1971.
[36] M. L. Chan, R. D. Dunlop, and F. Schweppe,
“Dynamic Equivalents for Average System Frequency
Behavior Following Major Disturbances”, IEEE
Transactions on Power Apparatus and Systems, vol.
PAS-91, no. 4, pp. 1637-1642, 1972.
[37] P. M. Anderson, and M. Mirheydar, “A Low-Order
System Frequency Response Model”, IEEE
Transactions on Power Systems, vol. 5, no. 3, pp. 720-
729, 1990.
[38] P. M. Anderson, and M. Mirheydar, “An Adaptive
Method for Setting Underfrequency Load Shedding
Relays”, IEEE Transactions on Power Systems, vol. 7,
no. 2, pp. 647-655, 1992.
[39] Y. Halevi, and D. Kottick, “Optimization of Load
Shedding System”, IEEE Transactions on Energy
Conversion, vol. 8, no. 2, pp. 207-213, 1993.
[40] V. Chin, Z. Y. Dong, T. K. Saha, J. Ford, and J.
Zhang, “Adaptive and Optimal Under Frequency Load

International Journal of Applied Engineering Research ISSN 0973-4562 Volume 11, Number 1 (2016) pp 456-472
© Research India Publications. http://www.ripublication.com
471
Shedding”, 2008 Australasian Universities Power
Engineering Conference (AUPEC’08), 2008.
[41] C. Wu, L. Gao, and Y. Dai, “Simulation and Optimization
of Load Shedding Scheme for Islanded Power System”,
2010 International Conference on Power System
Technology, 2010.
[42] H. Y. Yu, and Z. Y. Dong, “Optimal Decentralized Load
Curtailment by utilizing NMPA with Distributed
Generations”, IEEE PES ISGT ASIA 2012, 2012.
[43] Y. R. Bhavanam, and M. Shahrazad, “Impact of Increased
Distributed Generation on Fault Levels and the Network
Equipment”, Journal of Electrical Systems, vol. 10, no. 2,
pp. 209-222, 2014.
[44] S. Mirsaeidi, D. M. Said, M. W. Mustafa, M. H.
Habibuddin, and K. Ghaffari, “Review and Analysis of
Existing Protection Strategies for Micro-grids”, Journal of
Electrical Systems, vol. 10, no.1, pp. 1-10, 2014.
[45] S. C. Reddy, P. V. N. Prasad, and A. J. Laxmi, “Hybrid
Approach for Voltage Sag Mitigation in Distribution
System by Optimal Location and Size of Distributed
Generation”, Journal of Electrical Systems, vol. 9, no. 2,
pp. 150-166, 2013.
[46] O. Shariati, A. A. MohdZin, A. Khairuddin, M. Pesaran,
and M. R. Aghamohammadi, “An Integrated Method for
Under Frequency Load Shedding Based on Hybrid
Intelligent System-Part I: Dynamic Simulation”, 2012
Asia-Pacific Power and Energy Engineering Conference
(APPEEC), 2012.
[47] G. Wang, H. Xin, D. Gan, N. Li, and Z. Wang, “An
Investigation into WAMS-based Under-Frequency Load
Shedding”, 2012 IEEE Power and Energy Society General
Meeting, 2012.
[48] J. Tang, J. Liu, F.Ponci, and A. Monti, “Adaptive Load
Shedding Based on Combined Frequency and Voltage
Stability Assessment Using Synchrophasor
Measurements”, IEEE Transactions on Power Systems,
vol. 28, no. 2, pp. 2035-2047, 2013.
[49] H. You, V. Vittal, and Z. Yang, “Self-Healing in Power
Systems: An Approach Using Islanding and Rate of
Frequency Decline-Based Load Shedding”, IEEE
Transactions on Power Systems, vol. 18, no. 1, pp. 174-
181, 2003.
[50] V. V. Terzija, “Adaptive Underfrequency Load Shedding
Based on the Magnitude of the Disturbance Estimation”,
IEEE Transactions on Power Systems, vol. 21, no. 3, pp.
1260-1266, 2006.
[51] L. Sigrist, I. Egido, and L. Rouco, “Principles of a
Centralized UFLS Scheme for Small Isolated Power
Systems”, IEEE Transactions on Power Systems, vol. 28,
no. 2, pp. 1779-1786, 2013.
[52] P. Mahat, Z. Chen, and B. Bak-Jensen, “Underfrequency
Load Shedding for an Islanded Distribution System With
Distributed Generators”, IEEE Transactions on Power
Delivery, 2009.
[53] Power Systems Relaying Committee, IEEE Power
Engineering Society, “IEEE Guide for the Application
of Protective Relays Used for Abnormal Frequency
Load Shedding and Restoration”, 2007.
[54] W. Tan, C. Shen, X. Zhang, and J. Ni, “A New Under-
Frequency Load Shedding Scheme Based on OBDD”,
International Conference on Sustainable Power
Generation and Supply (SUPERGEN ‘09), 2009.
[55] A. Li, and Z. Cai, “A Method for Frequency Dynamics
Analysis and Load Shedding Assessment Based on the
Trajectory of Power System Simulation”, Third
International Conference on Electric Utility
Deregulation and Restructuring and Power
Technologies (DRPT2008), 2008.
[56] P. Du, and J. K. Nelson, “Two-step Solution to
Optimal Load Shedding in a Micro-grid”, IEEE/PES
Power Systems Conference and Exposition (PSCE
’09), 2009.
[57] Y. Lu, W-S. Kao, and Y-T. Chen, “Study of Applying
Load Shedding Scheme with Dynamic D-Factor
Values of Various Dynamic Load Models to Taiwan
Power System”, IEEE Transactions on Power
Systems, vol. 20, no. 4, pp. 1976-1984, 2005.
[58] E. E. Aponte, and J. Keith Nelson, “Time Optimal
Load Shedding for Distributed Power Systems”, IEEE
Transactions on Power Systems, 2000.
[59] E. D. Tuglie, M. Dicorato, M. La Scala, and P.
Scarpellini, “A Corrective Control for Angle and
Voltage Stability Enhancement on the Transient Time-
Scale”, IEEE Transactions on Power Systems, vol. 15,
no. 4, pp. 1345-1353, 2000.
[60] M. La Scala, M. Trovato, and C. Antonelli, “On-line
Dynamic Preventive Control: An Algorithm for
Transient Securirty Dispatch”, IEEE Transactions on
Power Systems, vol. 13, no. 2, pp. 601-610, 1998.
[61] Z. Zhong, “Power Systems Frequency Dynamic
Monitoring System Design and Applications”, PhD.
dissertation, Virginia Polytechnic Institute and State
University Blacksburg, 2005.
[62] Y. Zhao, N. Zho, J. Zhou, K. Xie, Y. Liu, and J.
Kuang, “A Heuristic Approach to Local Load
Shedding Scheme for Reliability Assessment of Bulk
Power Systems”, 2005 IEEE/PES Transmission and
Distribution Conference & Exhibition, 2005.
[63] H. Hirodontis, H. Li, and P. A. Crossley, “Load
Shedding in a Distribution Network”, International
Conference on Sustainable Power Generation and
Supply (SUPERGEN ’09), 2009.
[64] R. Niu, Y.Zeng, M. Cheng, and X. Wang, “Study on
Load-shedding Model Based on Improved Power Flow
Tracing Method in Power System Risk Assessment”,
2011 4th International Conference on Electric Utility
Deregulation and Restructuring and Power
Technologies (DRPT), 2011.

International Journal of Applied Engineering Research ISSN 0973-4562 Volume 11, Number 1 (2016) pp 456-472
© Research India Publications. http://www.ripublication.com
472
[65] K. Seethalekshmi, S. N. Singh, and S. C. Sriastava, “A
Synchrophasor Assisted Frequency and Voltage Stability
Based Load Shedding Scheme for Self-Healing of Power
System”, IEEE Transactions on Smart Grid, 2011.