Under Armour Inc. - NUS Investment Society€¦ · 2 Figure 4. Margin Compression of UA vs Nike...
14
Analysts Ray Han Song Director, Equity Research [email protected] Ong Zi Hao Deputy Director, Equity Research [email protected] Basic Information Last Closed Price US$43.01 12M Target Price US$32.10 +/- Potential -25.3% Bloomberg Ticker UA US Equity GICS Sector Consumer Discretionary GICS Sub-Industry Apparel, Accessories, Luxury 1Y Price v Relative Index Company Description Under Armour, Inc. engages in the development, marketing and distribution of branded performance apparel, footwear and accessories for men, women and youth. It operates through the following geographical segments: North America, Latin America, Europe, the Middle East, and Africa. Key Financials Market Cap 17.802B Basic Shares O/S 183.4M Free Float 98.9% 52-Wk High-Low US$54.70 - US$31.66 Fiscal Year End 31-Dec-15 (US$ M) FY14A FY15A FY16E FY17E Revenue 3084 3963 5668 7071 Gr Rate (%) 32.3 28.5 43% 25% EBITDA 419 502 726 920 Margin (%) 13.6 12.7 12.8 13.0 Net Income 208 232 337 421 Margin (%) 6.7 5.9 5.9 6.0 ROA 11.3 9.4 10.1 9.9 ROE 17.3 15.4 15.5 15.2 EV/EBITDA 33.3 35.3 20 16 P/E Ratio 73.8 77.9 67.8 51.1 D/E Ratio 21.1 40.1 35.4 31.6 Key Executives Kevin A. Plank Chairman & CEO Lawrence P. Molloy Chief Financial Officer Kip J. Fulks Chief Product Officer Cracks Appearing Under the Armour We are initiating coverage of UA with a Sell rating and a $32.10 12M price target. 2Q16 Earnings Review Total revenue up 28% yoy; international revenues +68%, comprising of 15% of total revenues; driven primarily by eCommerce sales in China. 2Q16 operating income decreased 39% yoy to US$19m, driven by US$23m impairment from Sports Authority liquidation; 2Q16 net income declined drastically by 58% yoy to US$6m Worse-than-expected impact on earnings; missed 2Q16 consensus EPS estimates of US$0.04 with actual EPS of US$0.01. Inventory build-up +30% qoq outpacing sales growth of +28% qoq is a sign of slowing consumer demand; we expect 3Q16 revenue growth to decelerate to +20% yoy. Investment Thesis Aggressive discounting tactic propping up sales growth of >20% at the expense of margins; euphoric expectations to disappoint as thinned margins limit further discounting; expect re-rating of high multiples when sales CAGR fall below the all-important +20% threshold. UA’s domestic sales re-align with overall weak retail sales outlook in 2H16 as discounting tactic tapers; strong dollar hurting sales abroad coupled with double whammy of slowing Chinese economy and post-Brexit jitters in UK. Economic headwinds resulting in consumers’ reduced spending on discretionary goods, affecting downstream distributor businesses. Key client risk heightened with the recent bankruptcy of Sports Authority. Catalysts Sales growth falling sub-20% in FY2016A will trigger a downward re-rating of UA’s high multiples. Unfavourable surprise quarterly earnings due to bankruptcy of key client Further strengthening of dollar translating to more than proportionate loss in overseas sales Investors going defensive with heightened market volatility due to recent global macro events such as Brexit as upcoming USA elections; dragging consumer discretionary sector down Valuations Our 12 month price target from date of coverage is $32.10, reflecting 54x our 2017E EPS of $0.78. Our 54x multiple represents a 15% premium to NKE’s 2017E PEG of 1.7x—appropriate, in our view, given an expanding active/athletic sector and improved company- specific top-line prospects, including higher wholesale demand (DKS shop-in- shops/Dept stores), improved women’s traction (studio line), International traction, and retail specialty door concept over time. Investment Risks Expensive valuations to maintain if FY16A revenue growth holds above 20% driven by better than expected upswings in employment picture and personal wealth. Potential consolidation play via M&A leading to larger market share and subsequently higher valuations. 30 40 50 60 UA Close S&P Rebased Equity Research Department 20 August 2016 Under Armour Inc. SELL: US$32.10 (-25.3%)
Transcript of Under Armour Inc. - NUS Investment Society€¦ · 2 Figure 4. Margin Compression of UA vs Nike...

Analysts
Ray Han Song Director, Equity Research [email protected]
Ong Zi Hao Deputy Director, Equity Research [email protected]
Basic Information Last Closed Price US$43.01 12M Target Price US$32.10 +/- Potential -25.3% Bloomberg Ticker UA US Equity GICS Sector Consumer Discretionary GICS Sub-Industry Apparel, Accessories,
Luxury
1Y Price v Relative Index
Company Description Under Armour, Inc. engages in the development, marketing and distribution of branded performance apparel, footwear and accessories for men, women and youth. It operates through the following geographical segments: North America, Latin America, Europe, the Middle East, and Africa.
Key Financials Market Cap 17.802B Basic Shares O/S 183.4M Free Float 98.9% 52-Wk High-Low US$54.70 - US$31.66 Fiscal Year End 31-Dec-15
(US$ M) FY14A FY15A FY16E FY17E Revenue 3084 3963 5668 7071 Gr Rate (%) 32.3 28.5 43% 25% EBITDA 419 502 726 920 Margin (%) 13.6 12.7 12.8 13.0 Net Income 208 232 337 421 Margin (%) 6.7 5.9 5.9 6.0 ROA 11.3 9.4 10.1 9.9 ROE 17.3 15.4 15.5 15.2 EV/EBITDA 33.3 35.3 20 16 P/E Ratio 73.8 77.9 67.8 51.1 D/E Ratio 21.1 40.1 35.4 31.6
Key Executives Kevin A. Plank Chairman & CEO Lawrence P. Molloy Chief Financial Officer Kip J. Fulks Chief Product Officer
Cracks Appearing Under the Armour
We are initiating coverage of UA with a Sell rating and a $32.10 12M price target.
2Q16 Earnings Review Total revenue up 28% yoy; international revenues +68%,
comprising of 15% of total revenues; driven primarily by eCommerce sales in China.
2Q16 operating income decreased 39% yoy to US$19m, driven by US$23m impairment from Sports Authority liquidation; 2Q16 net income declined drastically by 58% yoy to US$6m
Worse-than-expected impact on earnings; missed 2Q16 consensus EPS estimates of US$0.04 with actual EPS of US$0.01.
Inventory build-up +30% qoq outpacing sales growth of +28% qoq is a sign of slowing consumer demand; we expect 3Q16 revenue growth to decelerate to +20% yoy.
Investment Thesis Aggressive discounting tactic propping up sales growth of >20% at
the expense of margins; euphoric expectations to disappoint as thinned margins limit further discounting; expect re-rating of high multiples when sales CAGR fall below the all-important +20% threshold.
UA’s domestic sales re-align with overall weak retail sales outlook in 2H16 as discounting tactic tapers; strong dollar hurting sales abroad coupled with double whammy of slowing Chinese economy and post-Brexit jitters in UK.
Economic headwinds resulting in consumers’ reduced spending on discretionary goods, affecting downstream distributor businesses. Key client risk heightened with the recent bankruptcy of Sports Authority.
Catalysts Sales growth falling sub-20% in FY2016A will trigger a downward
re-rating of UA’s high multiples. Unfavourable surprise quarterly earnings due to bankruptcy of key
client Further strengthening of dollar translating to more than
proportionate loss in overseas sales Investors going defensive with heightened market volatility due to
recent global macro events such as Brexit as upcoming USA elections; dragging consumer discretionary sector down
Valuations Our 12 month price target from date of coverage is $32.10, reflecting 54x our 2017E EPS of $0.78. Our 54x multiple represents a 15% premium to NKE’s 2017E PEG of 1.7x—appropriate, in our view, given an expanding active/athletic sector and improved company- specific top-line prospects, including higher wholesale demand (DKS shop-in- shops/Dept stores), improved women’s traction (studio line), International traction, and retail specialty door concept over time.
Investment Risks Expensive valuations to maintain if FY16A revenue growth holds
above 20% driven by better than expected upswings in employment picture and personal wealth.
Potential consolidation play via M&A leading to larger market share and subsequently higher valuations.
30
40
50
60
UA Close S&P Rebased
Equity Research Department 20 August 2016
Under Armour Inc. SELL: US$32.10 (-25.3%)

1
Figure 1. Revenue by Products, FY15
Source: UA Annual Report 2015 Figure 2. Revenue by Geography, FY15
Source: UA Annual Report 2015 Figure 3. Under Armour Retail Store
Source: Under Armour
Company Overview
Under Armour peddles various athleisure products ranging from sports shoes to Charged Cotton shirts. UA relies heavily on sponsoring top athletes to build brand equity internationally, as is known as the “performance brand” in China, according to CEO Kevin Plank in 2Q16 earnings conference call. The company faces strong near term headwinds such as a strong dollar resulting in weaker international sales, slowdown in China, post-Brexit weakness in UK and the recent impairment losses due to The Sports Authority (TSA) bankruptcy filing earlier this year. UA is aggressively diversifying to other product categories and markets. This quarter’s earnings is mainly driven by strong international sales, especially via eCommerce in China and footwear sales outpaced core apparel sales. In the long term, UA aims to diversify revenues from sporting attire sales by monetizing the “Connected Fitness” strategy with their acquisition of MyFitnessPal.com and Map My Run. 2Q16 Earnings Review
Total revenue up 28% yoy; wholesale revenue +27%, direct-to-customer revenues +28%
Apparel sales growth decelerating below 20% threshold, with +19% yoy growth
International revenues +68%, comprising of 15% of total revenues; driven primarily by eCommerce sales in China
2Q16 gross margins decreased by 70bps to 47.7% from 48.4% SG&A spiked by 32%, driven by impairment costs from
bankruptcy of Sports Authority 2Q16 operating income decreased 39% yoy to US$19m, driven by
US$23m impairment from Sports Authority liquidation. As a result, 2Q16 net income decreased drastically 58% yoy to US$6m
Missed 2Q16 consensus EPS estimates of US$0.04 with actual EPS of US$0.01.
Management guide full year 2016 revenues to be US$4.925b, implying an annual growth of +24%, with 3Q gross margins to remain flat and negative FX translation impact from strong dollar
Inventory build-up +30% qoq outpacing sales growth of +28% qoq is a sign of slowing consumer demand; as such expect revenues in 3Q16 to decelerate to +20% yoy
Industry Outlook
Weak retail traffic remains a drag on apparel Branded-apparel and footwear companies enter 2H amid ongoing traffic and sales challenges at their largest wholesale customers, which may have a negative effect on the important holiday-shopping season. Sales in channels such as Wal-Mart, Target and Kohl’s have all missed recent earnings estimates, showing signs of spending power declines amongst American citizens. Department store sales significantly weakened in in the first two quarters of the year, forcing retailers to discount large inventory positions and lower future orders. Total US retail visits for the week ended April 2016 declined 6.58% y-o-y, total US retail same store traffic slid 8.75% y-o-y. The presidential election in US also has a part to play in creating sluggish traffic and sales as high end shoppers tend to scale down spending ahead of election for fear of tax raises. Globally, weak demand persists in Europe and China as both markets face slower economic growth. There has also been a subtle shift still ongoing in consumption behavior as most consumers live in an Instagram and
70.70%
17.10%
8.80%2.10% 1.30%
Apparel Footwear
Accessories Licensing
Connected Fitness
87.20%
11.50%1.30%
North America International
Connected Fitness

2
Figure 4. Margin Compression of UA vs Nike
Source: Motley Fool Figure 5. Porter’s 5 Forces
Source: NUS Investment Society Estimates Figure 6: USA Retail Sales YoY
Source: Trading Economics Figure 6. UA Total Apparel Sales YoY Gr.
Source: Morgan Stanley
Snapchat oriented era. Consumers opt for travel and experiences over purchasing. Global Pressure from a strong dollar to drag US sales further The drag of a strong dollar is likely to continue to weigh on apparel makers' reported sales and gross margins in 2H following the Brexit vote. Given the global nature of U.S.-based apparel and footwear brands, a weaker euro, pound and other currencies are pressuring financial performance. Sales made in foreign currencies translate to lower dollar amounts, while margins are contracting as merchandise costs more on a local level. Brands are left with the choice of raising prices, which may hurt demand. US retailers who have chosen to expand overseas may take longer time to realize returns on initial investments as per store sales are likely to fall amid strong headwinds. With recent buzz over a likely Fed rate hike, USD could potentially increase even further against currencies of main training blocs, thus impacting sales of US based retailers. Market Continues to be Highly Competitive US apparels and footwear market remains very competitive and fragmented as a broad range of players from domestic to international operate in the market. The rise of cheaper quality alternatives from China such as Li Ning and 361 degrees has led to market share erosion from major US based retailers. While Nike led sales in 2015 due to stronger brand image in sportswear, other brands remain in a lockdown fight for limited market share as demand for consumer discretionary is projected to fall at a global level given dimmer economic prospects. Increase in internet retailing businesses posts significant threat to brick and mortar sales in the immediate term, as ecommerce companies such as Amazon provide better services at a global level. We expect to see more manufacturers and retailers launching their own platforms and establishing presence in internet retailing space, improving range of services provided, at the same time compete on the price front. Increased levels of competition naturally leads to unwanted price wars, consequently leading to thinner margins for all retailers. Operationally, companies are facing challenging prospects due to their current razor thin margins amid rising costs and lower revenue. A knack for deep discounting to clear inventory at the same time loading up on debt has already led to bankruptcy of Sports Authority. With the marketplace only getting ever more competitive, Sports Authority might not be the last to go out of business.
Investment Thesis
1. 20+% revenue growth driven by aggressive discounting policies creating margin compression will be unsustainable
UA resort to aggressive inventory and discounting strategies to maintain revenue growth above the all-important 20% CAGR threshold.
Investors are closely watching revenue CAGR as high P/E multiples have priced in >20% revenue growth rate. Missed growth expectations will cause re-rating of multiples, hence tumbling share price
Discounting is very effective strategy to boost short term revenue as UA is a consumer discretionary company with price elastic demand
TTM EBIT Margins falling from 11% in 4Q14 to 9.6% in 2Q16; further discounting tactic to boost sales limited by thin margins
Inventory overhang already a sign of slowing retail sales vis-à-vis management’s expected sales
Looking forward, we expect discounting to be restrained and the reality of a soft domestic economy (evidenced from the loose monetary policy) coupled with weakness in consumer spending
0
1
2
3
4
5
CompetitionWithin
Industry
Threat ofNew
Entrants
Threat ofNew
Substitutes
BargainingPower ofBuyers
BargainingPower ofSuppliers
3
Figure 7. UA Return on Equity Trend
Source: Annual Report, NUS Investment Society Estimates Figure 8. Cash Conversion Cycle
Source: Annual Report, NUS Investment Society Estimates Figure 9. Debt to Equity Ratio
Source: Annual Report, NUS Investment Society Estimates
to drag revenue growth below the threshold of 20%, triggering a downward revaluation
2. Subdued growth abroad due to strong dollar
Dollar/Yuan appreciated; harder to compete on price with local Chinese brands like Li Ning that have stronger history and price point
Double Whammy of Dollar/Pound appreciation and restrained consumer spending in UK post-Brexit.
3. Reduced consumer spending on discretionary goods, affecting downstream distributor businesses
With US Retail sales hitting multi year low, there is significant headwinds in UA’s domestic market.
Discount strategy from most sports apparel leading to costly undercutting maneuvers. Compression of profit margins at industry level results in lower earnings. Recent bankruptcy of Sports Authority for instance casts doubts over sustainability.
Profit margins are unlikely to improve in the short to medium term as players compete for market share.
Catalysts
Sales growth falling sub-20% will trigger a downward re-rating of UA’s high multiples
Further strengthening of dollar translating to more than proportionate loss in sales
Slowdown in Chinese consumer spending translating to operating losses in that segment will further dampen euphoria
Financial Analysis
Overview: The financial condition chart above reveals UA’s prospects moving 6 years forward, highlighting our assumptions (refer to appendix for more details), with specific attention paid to debt repayments and operational efficiencies. While UA made a few acquisitions over the past 2 years, the impact on balance sheet and income statements are non-material and thus included in our projections. Falling Margins Amid Aggressive Expansions into Overseas Markets Recent expansions into European and Asian markets have largely contributed to the 124% increase in CapEx spending from FY2014 to FY2015. With even more stores in the pipeline, we expect CapEx to increase in FY2016 as well. With expansion CapEx set to increase in the short term combined with downward consumption trends in many of UA’s operational regions, we remain pessimistic that net margins will decrease within next 12 month. Reduced Flexibility in Financing Future Ventures UA’s current D/E ratio is at its historic high, while expected to be paid down subsequently over the next few years, UA has limited financing
0.11
0.12
0.13
0.14
0.15
0.16
0
20
40
60
80
100
120
140
2013A 2014A 2015A 2016E
UA Cash Conversion Cycle
21%
40.10%
35.40%
31.60%
15%
20%
25%
30%
35%
40%
45%
2014A 2015A 2016E 2017E
Debt to Equity Ratio
Financial Ratios 2014A 2015A 2016E 2017E 2018E 2019E 2020E
Profitability
Net Profit Margin 6.7% 5.9% 5.9% 6.0% 6.0% 6.0% 6.0%
Return on Asset 9.9% 8.1% 8.8% 9.0% 9.2% 9.5% 9.8%
Return on Equity 15.4% 13.9% 15.5% 15.2% 14.5% 13.8% 13.1%
Liquidity
Current Ratio 3.7 3.1 3.3 3.4 3.5 3.6 3.6
Cash Ratio 1.4 0.3 0.4 0.5 0.5 0.6 0.6
Asset Utilization
Total Asset Turnover 1.5 1.4 1.5 1.5 1.5 1.6 1.6
Inventory Turnover 2.9 2.6 2.6 2.6 2.6 2.6 2.6
Receivables Turnover 11.0 9.1 9.1 9.1 9.1 9.1 9.1
Financial Leverage
LT Debt to Assets 12.2% 21.9% 23.4% 20.8% 16.5% 11.9% 5.9%
LT Debt to Equity 18.9% 37.6% 41.2% 35.0% 25.7% 17.3% 7.9%
Debt to Equity 21.0% 40.1% 43.2% 36.5% 27.0% 18.3% 8.7%
Debt to Asset 14% 23% 24% 22% 17% 13% 7%
Interest Coverage 65 27 47 50 56 101 117
Debt Service Coverage 39 16 27 29 33 60 70
Market Value
Price to Earnings 90 81 57 46 39 34 30
EV/EBITDA 44 39 27 22 18 15 13
4
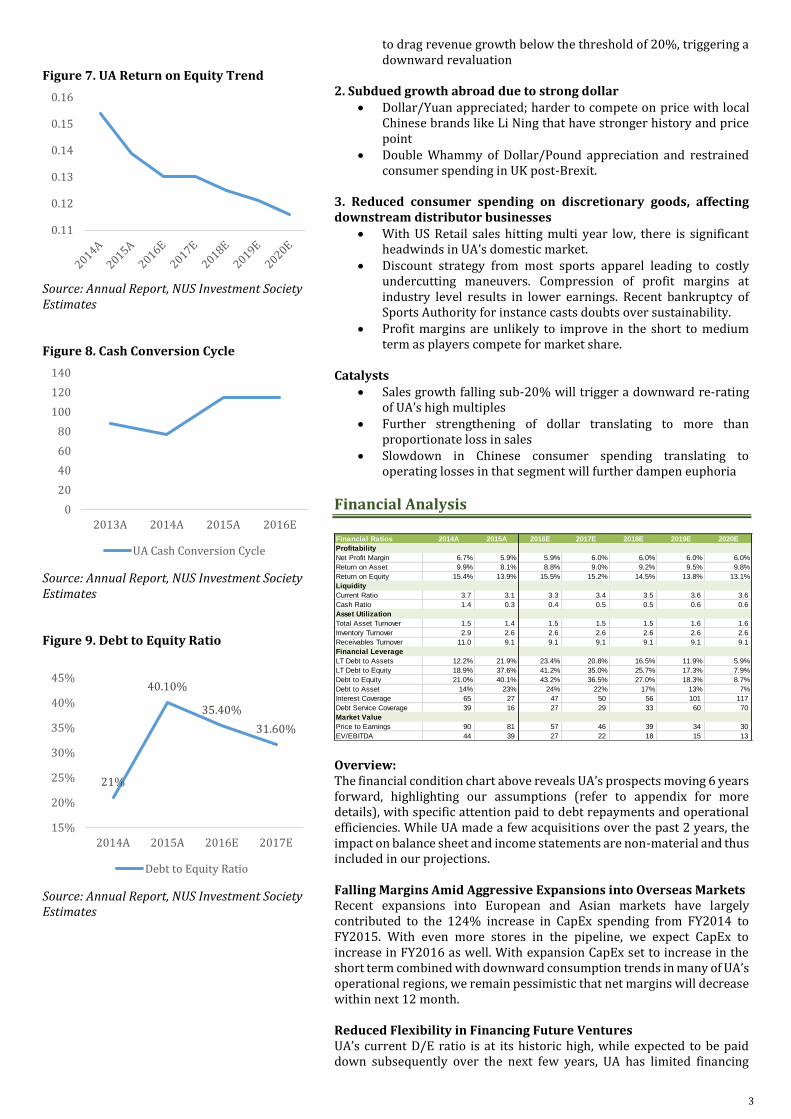
Figure 10. Extended DuPont Equation
Ratio 2016E 1 Tax Burden 60% 2 Interest
Burden 97.4%
3 Operating Margin
10.1%
4 Total Asset Turnover
1.3x
5 Equity Multiplier
1.6x
Source: Annual Report, NUS Investment Society Estimates
options in the short to medium term. We are expecting cost of revolver loan to increase should UA continue to tap on more funding. Higher level of inventory accounts for higher. Vulnerability in Periods of Adverse Cash Flow Shocks Having missed the quarter earnings for the first time since 2006, UA’s share price traded down by about 3.4%, 6% YTD, reflecting investor concerns over company’s revenue generation capabilities. In addition, a 5 year historic low in cash and cash equivalent highlights vulnerability in cash flow management. With a cash ratio of 0.4, significantly lower than industry average. UA is susceptible to revenue and cost induced shocks, with increasing risk of hitting undercapitalization. Operating Margins UA is facing a declining profit margin partly due to intensifying levels of price competition between sports apparel retailers. While not sustainable in the long run, many are taking the opportunity to boost top line figures at a lower profit margin. While considered a brand with high brand equity as well as high growth, UA has recently lacked behind other high growth competitors such as Lululemon (13.3%) in terms of profit margins. Asset Turnover UA over the past year has drastically increased its inventory holding in expectation of global expansion plans. A an industry level, UA has an average total asset turnover within the industry at 1.3x. Interest Burden UA has a high amount of debt, with significant interest burden of 97.4%. Tax Burden The company pays a hefty tax bill of almost 40% as it is based in the US, we expect UA to undergo tax optimization and undergo tax avoidance in the near future as the company expands overseas to leverage on better tax treatments. Leverage UA has one of the highest leverage ratios in apparel industry due to its pursuit of an aggressive strategy to capture market share. A combination of thinning cash flows and high cost of debt leads to higher risks for UA.
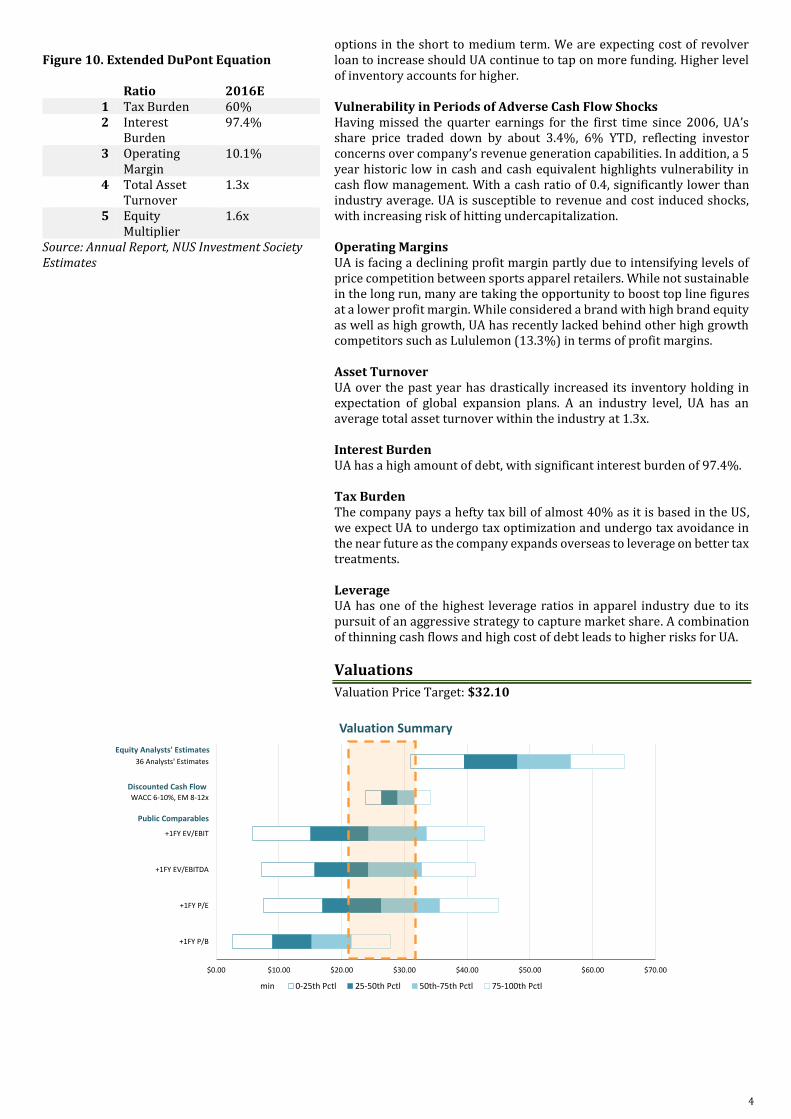
Valuations
Valuation Price Target: $32.10
$0.00 $10.00 $20.00 $30.00 $40.00 $50.00 $60.00 $70.00
+1FY P/B
+1FY P/E
+1FY EV/EBITDA
+1FY EV/EBIT
WACC 6-10%, EM 8-12x
36 Analysts' Estimates
Valuation Summary
min 0-25th Pctl 25-50th Pctl 50th-75th Pctl 75-100th Pctl
Discounted Cash Flow
Public Comparables
Equity Analysts' Estimates
5
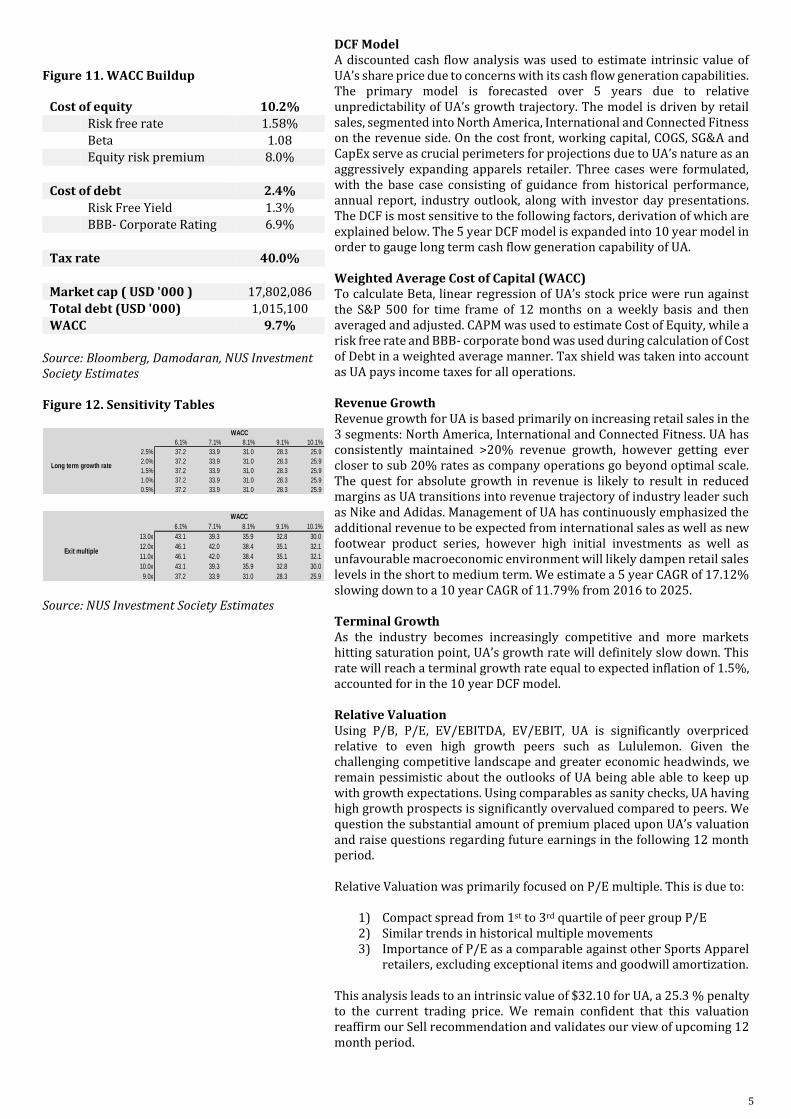
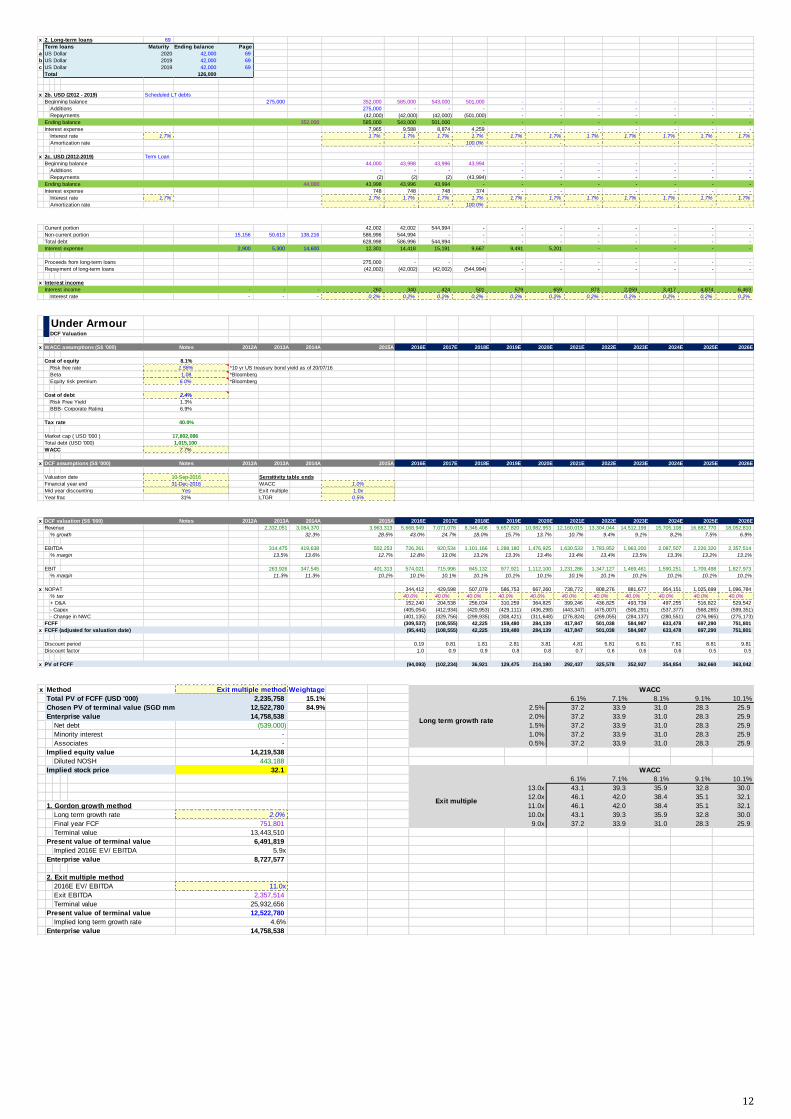
Figure 11. WACC Buildup
Cost of equity 10.2%
Risk free rate 1.58%
Beta 1.08
Equity risk premium 8.0%
Cost of debt 2.4%
Risk Free Yield 1.3%
BBB- Corporate Rating 6.9%
Tax rate 40.0%
Market cap ( USD '000 ) 17,802,086
Total debt (USD '000) 1,015,100
WACC 9.7%
Source: Bloomberg, Damodaran, NUS Investment Society Estimates Figure 12. Sensitivity Tables
Source: NUS Investment Society Estimates
DCF Model A discounted cash flow analysis was used to estimate intrinsic value of UA’s share price due to concerns with its cash flow generation capabilities. The primary model is forecasted over 5 years due to relative unpredictability of UA’s growth trajectory. The model is driven by retail sales, segmented into North America, International and Connected Fitness on the revenue side. On the cost front, working capital, COGS, SG&A and CapEx serve as crucial perimeters for projections due to UA’s nature as an aggressively expanding apparels retailer. Three cases were formulated, with the base case consisting of guidance from historical performance, annual report, industry outlook, along with investor day presentations. The DCF is most sensitive to the following factors, derivation of which are explained below. The 5 year DCF model is expanded into 10 year model in order to gauge long term cash flow generation capability of UA. Weighted Average Cost of Capital (WACC) To calculate Beta, linear regression of UA’s stock price were run against the S&P 500 for time frame of 12 months on a weekly basis and then averaged and adjusted. CAPM was used to estimate Cost of Equity, while a risk free rate and BBB- corporate bond was used during calculation of Cost of Debt in a weighted average manner. Tax shield was taken into account as UA pays income taxes for all operations. Revenue Growth Revenue growth for UA is based primarily on increasing retail sales in the 3 segments: North America, International and Connected Fitness. UA has consistently maintained >20% revenue growth, however getting ever closer to sub 20% rates as company operations go beyond optimal scale. The quest for absolute growth in revenue is likely to result in reduced margins as UA transitions into revenue trajectory of industry leader such as Nike and Adidas. Management of UA has continuously emphasized the additional revenue to be expected from international sales as well as new footwear product series, however high initial investments as well as unfavourable macroeconomic environment will likely dampen retail sales levels in the short to medium term. We estimate a 5 year CAGR of 17.12% slowing down to a 10 year CAGR of 11.79% from 2016 to 2025. Terminal Growth As the industry becomes increasingly competitive and more markets hitting saturation point, UA’s growth rate will definitely slow down. This rate will reach a terminal growth rate equal to expected inflation of 1.5%, accounted for in the 10 year DCF model. Relative Valuation Using P/B, P/E, EV/EBITDA, EV/EBIT, UA is significantly overpriced relative to even high growth peers such as Lululemon. Given the challenging competitive landscape and greater economic headwinds, we remain pessimistic about the outlooks of UA being able able to keep up with growth expectations. Using comparables as sanity checks, UA having high growth prospects is significantly overvalued compared to peers. We question the substantial amount of premium placed upon UA’s valuation and raise questions regarding future earnings in the following 12 month period. Relative Valuation was primarily focused on P/E multiple. This is due to:
1) Compact spread from 1st to 3rd quartile of peer group P/E 2) Similar trends in historical multiple movements 3) Importance of P/E as a comparable against other Sports Apparel
retailers, excluding exceptional items and goodwill amortization. This analysis leads to an intrinsic value of $32.10 for UA, a 25.3 % penalty to the current trading price. We remain confident that this valuation reaffirm our Sell recommendation and validates our view of upcoming 12 month period.
WACC
32 6.1% 7.1% 8.1% 9.1% 10.1%
2.5% 37.2 33.9 31.0 28.3 25.9
2.0% 37.2 33.9 31.0 28.3 25.9
1.5% 37.2 33.9 31.0 28.3 25.9
1.0% 37.2 33.9 31.0 28.3 25.9
0.5% 37.2 33.9 31.0 28.3 25.9
Long term growth rate
WACC
32 6.1% 7.1% 8.1% 9.1% 10.1%
13.0x 43.1 39.3 35.9 32.8 30.0
12.0x 46.1 42.0 38.4 35.1 32.1
11.0x 46.1 42.0 38.4 35.1 32.1
10.0x 43.1 39.3 35.9 32.8 30.0
9.0x 37.2 33.9 31.0 28.3 25.9
Exit multiple
6
Disclaimer
This research material has been prepared by NUS Invest. NUS Invest specifically prohibits the redistribution of this material in whole or in part without the written permission of NUS Invest. The research officer(s) primarily responsible for the content of this research material, in whole or in part, certifies that their views are accurately expressed and they will not receive direct or indirect compensation in exchange for expressing specific recommendations or views in this research material. Whilst we have taken all reasonable care to ensure that the information contained in this publication is not untrue or misleading at the time of publication, we cannot guarantee its accuracy or completeness, and you should not act on it without first independently verifying its contents. Any opinion or estimate contained in this report is subject to change without notice. We have not given any consideration to and we have not made any investigation of the investment objectives, financial situation or particular needs of the recipient or any class of persons, and accordingly, no warranty whatsoever is given and no liability whatsoever is accepted for any loss arising whether directly or indirectly as a result of the recipient or any class of persons acting on such information or opinion or estimate. You may wish to seek advice from a financial adviser regarding the suitability of the securities mentioned herein, taking into consideration your investment objectives, financial situation or particular needs, before making a commitment to invest in the securities. This report is published solely for information purposes, it does not constitute an advertisement and is not to be construed as a solicitation or an offer to buy or sell any securities or related financial instruments. No representation or warranty, either expressed or implied, is provided in relation to the accuracy, completeness or reliability of the information contained herein. The research material should not be regarded by recipients as a substitute for the exercise of their own judgement. Any opinions expressed in this research material are subject to change without notice.
© 2016 NUS Investment Society
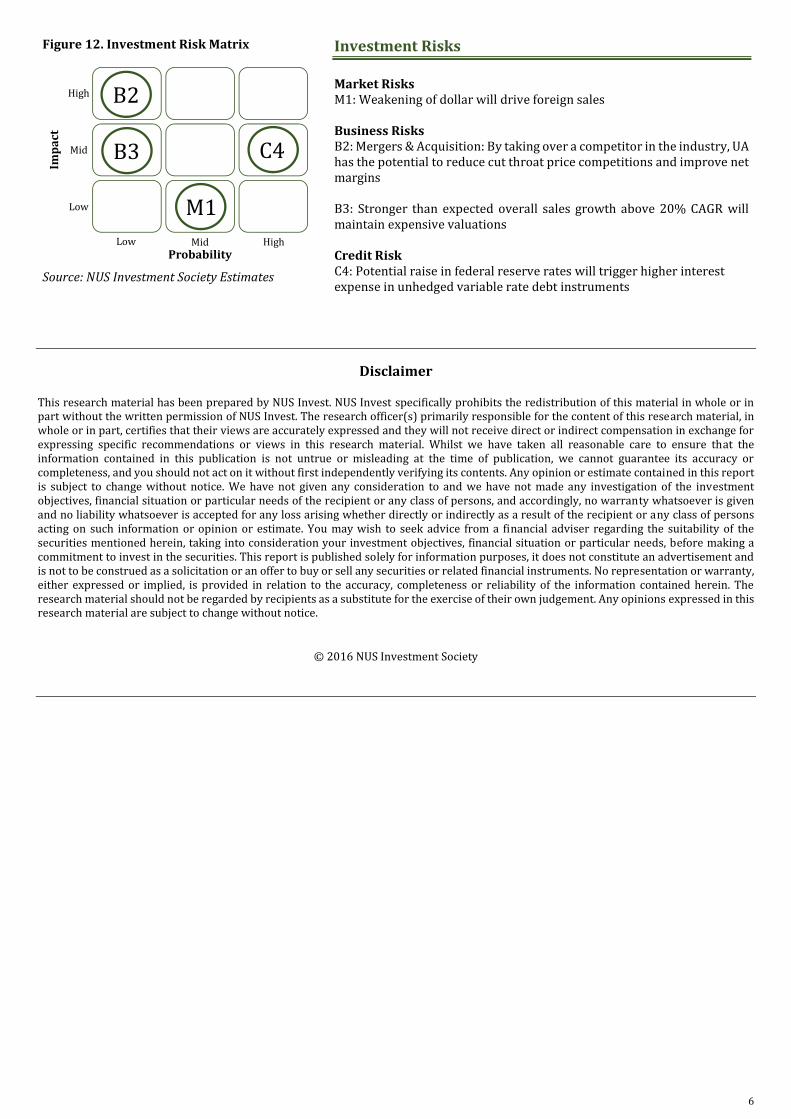
Figure 12. Investment Risk Matrix
Source: NUS Investment Society Estimates
Investment Risks
Market Risks M1: Weakening of dollar will drive foreign sales Business Risks B2: Mergers & Acquisition: By taking over a competitor in the industry, UA has the potential to reduce cut throat price competitions and improve net margins B3: Stronger than expected overall sales growth above 20% CAGR will maintain expensive valuations Credit Risk C4: Potential raise in federal reserve rates will trigger higher interest expense in unhedged variable rate debt instruments
Imp
act
Probability
Mid
High
Low
Low Mid High
B3
B2
C4
M1
7
Appendix:
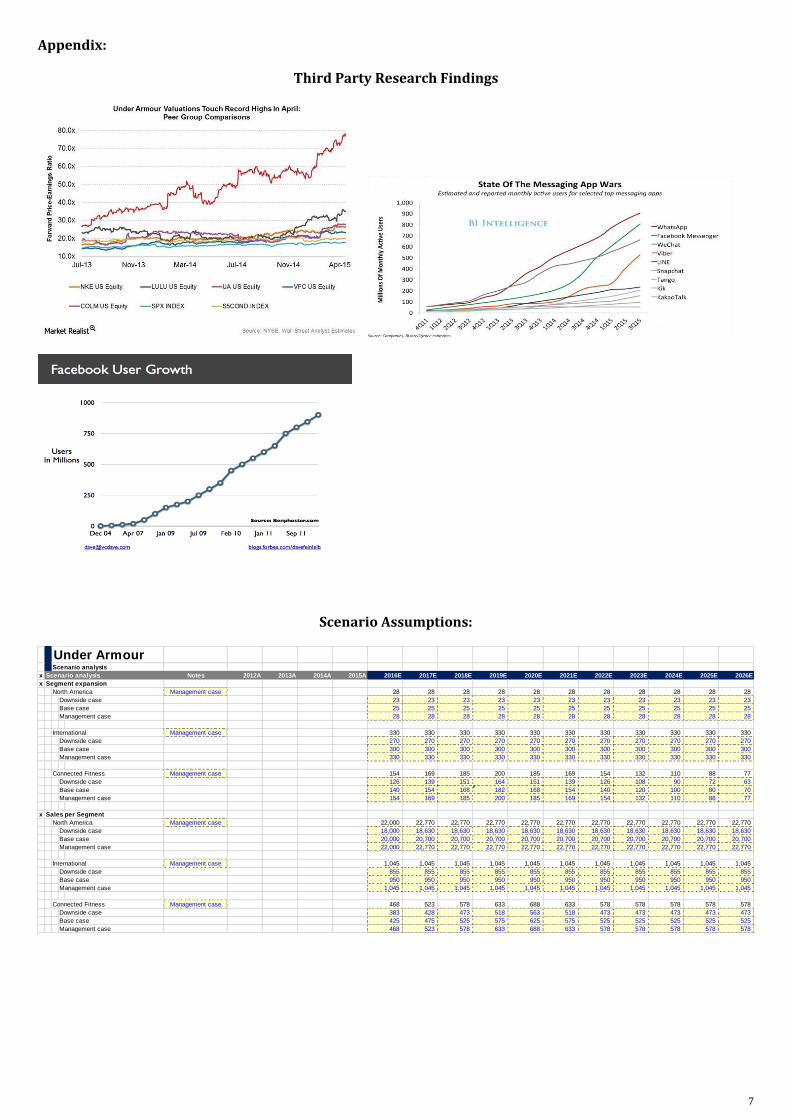
Third Party Research Findings
Scenario Assumptions:
Under ArmourScenario analysis
x Scenario analysis Notes 2012A 2013A 2014A 2015A 2016E 2017E 2018E 2019E 2020E 2021E 2022E 2023E 2024E 2025E 2026E
x Segment expansion
North America Management case 28 28 28 28 28 28 28 28 28 28 28
Downside case 23 23 23 23 23 23 23 23 23 23 23
Base case 25 25 25 25 25 25 25 25 25 25 25
Management case 28 28 28 28 28 28 28 28 28 28 28
International Management case 330 330 330 330 330 330 330 330 330 330 330
Downside case 270 270 270 270 270 270 270 270 270 270 270
Base case 300 300 300 300 300 300 300 300 300 300 300
Management case 330 330 330 330 330 330 330 330 330 330 330
Connected Fitness Management case 154 169 185 200 185 169 154 132 110 88 77
Downside case 126 139 151 164 151 139 126 108 90 72 63
Base case 140 154 168 182 168 154 140 120 100 80 70
Management case 154 169 185 200 185 169 154 132 110 88 77
x Sales per Segment
North America Management case 22,000 22,770 22,770 22,770 22,770 22,770 22,770 22,770 22,770 22,770 22,770
Downside case 18,000 18,630 18,630 18,630 18,630 18,630 18,630 18,630 18,630 18,630 18,630
Base case 20,000 20,700 20,700 20,700 20,700 20,700 20,700 20,700 20,700 20,700 20,700
Management case 22,000 22,770 22,770 22,770 22,770 22,770 22,770 22,770 22,770 22,770 22,770
International Management case 1,045 1,045 1,045 1,045 1,045 1,045 1,045 1,045 1,045 1,045 1,045
Downside case 855 855 855 855 855 855 855 855 855 855 855
Base case 950 950 950 950 950 950 950 950 950 950 950
Management case 1,045 1,045 1,045 1,045 1,045 1,045 1,045 1,045 1,045 1,045 1,045
Connected Fitness Management case 468 523 578 633 688 633 578 578 578 578 578
Downside case 383 428 473 518 563 518 473 473 473 473 473
Base case 425 475 525 575 625 575 525 525 525 525 525
Management case 468 523 578 633 688 633 578 578 578 578 578

8
Pro Forma Financial Statements
x Same Store Sales Growth(SSSG)
North America Management case 15% 15% 15% 15% 15% 15% 15% 15% 15% 15% 15%
Downside case 5.0% 5.0% 5.0% 5.0% 5.0% 5.0% 5.0% 5.0% 5.0% 5.0% 5.0%
Base case 5.0% 5.0% 5.0% 5.0% 5.0% 5.0% 5.0% 5.0% 5.0% 5.0% 5.0%
Management case 15.0% 15.0% 15.0% 15.0% 15.0% 15.0% 15.0% 15.0% 15.0% 15.0% 15.0%
International Management case 15.0% 15.0% 15.0% 15.0% 15.0% 15.0% 15.0% 15.0% 15.0% 15.0% 15.0%
Downside case 5.0% 5.0% 5.0% 5.0% 5.0% 5.0% 5.0% 5.0% 5.0% 5.0% 5.0%
Base case 10.0% 10.0% 10.0% 10.0% 10.0% 10.0% 10.0% 10.0% 10.0% 10.0% 10.0%
Management case 15.0% 15.0% 15.0% 15.0% 15.0% 15.0% 15.0% 15.0% 15.0% 15.0% 15.0%
Connected Fitness Management case 20.0% 20.0% 20.0% 20.0% 20.0% 20.0% 20.0% 20.0% 20.0% 20.0% 20.0%
Downside case 10.0% 10.0% 10.0% 10.0% 10.0% 10.0% 10.0% 10.0% 10.0% 10.0% 10.0%
Base case 15.0% 15.0% 15.0% 15.0% 15.0% 15.0% 15.0% 15.0% 15.0% 15.0% 15.0%
Management case 20.0% 20.0% 20.0% 20.0% 20.0% 20.0% 20.0% 20.0% 20.0% 20.0% 20.0%
x Expansion capex per Segment
North America Management case 8,100 7,200 6,300 5,400 4,500 3,600 3,600 3,600 3,600 3,600 3,600
Downside case 9,900 8,800 7,700 6,600 5,500 4,400 4,400 4,400 4,400 4,400 4,400
Base case 9,000 8,000 7,000 6,000 5,000 4,000 4,000 4,000 4,000 4,000 4,000
Management case 8,100 7,200 6,300 5,400 4,500 3,600 3,600 3,600 3,600 3,600 3,600
International Management case 90 90 90 90 90 90 90 90 90 90 90
Downside case 110 110 110 110 110 110 110 110 110 110 110
Base case 100 100 100 100 100 100 100 100 100 100 100
Management case 90 90 90 90 90 90 90 90 90 90 90
Connected Fitness Management case 36 36 36 36 36 36 36 36 36 36 36
Downside case 44 44 44 44 44 44 44 44 44 44 44
Base case 40 40 40 40 40 40 40 40 40 40 40
Management case 36 36 36 36 36 36 36 36 36 36 36
x Maintenance capex per Segment
North America Management case 900 900 900 900 900 900 900 900 900 900 900
Downside case 1,100 1,100 1,100 1,100 1,100 1,100 1,100 1,100 1,100 1,100 1,100
Base case 1,000 1,000 1,000 1,000 1,000 1,000 1,000 1,000 1,000 1,000 1,000
Management case 900 900 900 900 900 900 900 900 900 900 900
International Management case 18 18 18 18 18 18 18 18 18 18 18
Downside case 22 22 22 22 22 22 22 22 22 22 22
Base case 20 20 20 20 20 20 20 20 20 20 20
Management case 18 18 18 18 18 18 18 18 18 18 18
Connected Fitness Management case 9 9 9 9 9 9 9 9 9 9 9
Downside case 11 11 11 11 11 11 11 11 11 11 11
Base case 10 10 10 10 10 10 10 10 10 10 10
Management case 9 9 9 9 9 9 9 9 9 9 9
Under Armour3 Financial statements
32.3% 28.5%
Income statement (S$ '000) Page 2013A 2014A 2015A 2016E 2017E 2018E 2019E 2020E 2021E 2022E 2023E 2024E 2025E 2026E
Revenue 32 2,332,051 3,084,370 3,963,313 5,668,949 7,071,078 8,346,408 9,657,820 10,982,953 12,160,015 13,304,044 14,512,199 15,705,108 16,882,770 18,052,810
Cost of sales 52 (1,195,381) (1,572,164) (2,057,766) (2,943,338) (3,671,329) (4,333,484) (5,014,374) (5,702,388) (6,313,522) (6,907,506) (7,534,784) (8,154,147) (8,765,594) (9,373,082)
Gross profit 1,136,670 1,512,206 1,905,547 2,725,611 3,399,750 4,012,924 4,643,446 5,280,565 5,846,493 6,396,538 6,977,414 7,550,961 8,117,177 8,679,728
Other operating income - - - - - - - - - - - - - -
Interest income 56 - - - 260 340 424 501 579 659 873 2,059 3,417 4,874 6,463
SG&A Expense 52 (871,572) (1,158,251) (1,497,000) (2,141,243) (2,670,847) (3,152,558) (3,647,897) (4,148,418) (4,593,012) (5,025,128) (5,481,465) (5,932,044) (6,376,864) (6,818,805)
Other Expense 52 (1,172) (6,410) (7,234) (10,347) (12,906) (15,234) (17,628) (20,047) (22,195) (24,283) (26,488) (28,666) (30,815) (32,951)
Interest expense 52 (2,933) (5,335) (14,628) (12,301) (14,418) (15,191) (9,667) (9,491) (5,201) - - - - -
Profit before tax and share of results of associates and joint ventures 260,993 342,210 386,685 561,979 701,918 830,365 968,756 1,103,189 1,226,744 1,348,000 1,471,520 1,593,668 1,714,372 1,834,436
Profit before tax 260,993 342,210 386,685 561,979 701,918 830,365 968,756 1,103,189 1,226,744 1,348,000 1,471,520 1,593,668 1,714,372 1,834,436
Income tax expense (98,663) (134,168) (154,112) (224,792) (280,767) (332,146) (387,502) (441,275) (490,698) (539,200) (588,608) (637,467) (685,749) (733,774)
Tax rate 37.8% 39.2% 39.9% 40.0% 40.0% 40.0% 40.0% 40.0% 40.0% 40.0% 40.0% 40.0% 40.0% 40.0%
Profit for the year 162,330 208,042 232,573 337,187 421,151 498,219 581,253 661,913 736,046 808,800 882,912 956,201 1,028,623 1,100,662
Profit Attributable to NCI - - - - - - - - - - - - - -
EPS (cents) 6.7% 5.9%
Basic 52 0.39 0.49 0.54 0.78 0.96 1.12 1.30 1.46 1.61 1.75 1.90 2.03 2.17 2.29
Diluted 52 0.39 0.48 0.53 0.76 0.94 1.10 1.27 1.44 1.58 1.72 1.86 1.99 2.12 2.25
EBIT (GP + other OI + SG&A expenses) 263,926 347,545 401,313 574,021 715,996 845,132 977,921 1,112,100 1,231,286 1,347,127 1,469,461 1,590,251 1,709,498 1,827,973
EBITDA 314,475 419,638 502,253 726,261 920,534 1,101,166 1,288,180 1,476,925 1,630,533 1,783,952 1,963,200 2,087,507 2,226,320 2,357,514
Cash flow statement (S$ '000) Notes 2013A 2014A 2015A 2016E 2017E 2018E 2019E 2020E 2021E 2022E 2023E 2024E 2025E 2026E
Cash flows from operating activities
Net income 162,330 208,042 232,573 337,187 421,151 498,219 581,253 661,913 736,046 808,800 882,912 956,201 1,028,623 1,100,662
Adjustments for:
Depreciation of PP&E + Amortization 50,549 72,093 100,940 152,240 204,538 256,034 310,259 364,825 399,246 436,825 493,739 497,255 516,822 529,542
Unrealized FX rate losses 1,905 11,739 33,359 - - - - - - - - - - -
(Gain)/ Loss on disposal of PP&E 332 261 549 - - - - - - - - - - -
Stock based compensation 43,184 50,812 60,376 - - - - - - - - - - -
Deferred income taxes (18,832) (17,584) (4,426) - - - - - - - - - - -
Changes in reserves & allowances 13,945 31,350 40,391 - - - - - - - - - - -
Operating cash flows before working capital changes 253,413 356,713 463,762 489,427 625,689 754,252 891,512 1,026,738 1,135,293 1,245,625 1,376,651 1,453,456 1,545,446 1,630,203
Changes in WC:
Accounts Receivable (35,960) (101,057) (191,876) (186,619) (153,411) (139,538) (143,486) (144,987) (128,786) (125,172) (132,188) (130,520) (128,852) (128,018)
Inventories (156,900) (84,658) (278,524) (336,982) (277,018) (251,967) (259,095) (261,806) (232,552) (226,026) (238,695) (235,683) (232,671) (231,165)
Prepaid Expenses & Other assets (19,049) (33,345) (76,476) (65,518) (53,860) (48,989) (50,375) (50,902) (45,214) (43,945) (46,409) (45,823) (45,237) (44,945)
Accounts Payable 14,642 49,137 (22,583) 86,269 70,918 64,505 66,330 67,024 59,535 57,864 61,107 60,336 59,565 59,179
Accrued Expenses & other liabilities 56,481 28,856 64,126 101,715 83,615 76,054 78,205 79,024 70,193 68,224 72,048 71,138 70,229 69,775
Income taxes payable & receivable 7,443 3,387 (2,533) - - - - - - - - - - -
Cash flows generated from operations 120,070 219,033 (44,104) 88,292 295,933 454,318 583,091 715,090 858,469 976,570 1,092,514 1,172,905 1,268,480 1,355,031
Cash flows from investing activities
Purchase of property, plant and equipment (87,830) (140,528) (298,928) (405,054) (412,934) (420,953) (429,111) (436,298) (443,347) (475,007) (506,291) (537,377) (568,265) (599,351)
Purchase of businesses, net of cash acquired (148,097) (10,924) (539,460) - - - - - - - - - - -
Purchase of available-for-sale securities - - (103,144) - - - - - - - - - - -
Sales available-for-sale securities - - 96,610 - - - - - - - - - - -
Purchases of other assets (475) (860) (2,553) - - - - - - - - - - -
Change in loan receivable (1,700) - - - - - - - - - - - - -
Net cash flows used in investing activities 38 (238,102) (152,312) (847,475) (405,054) (412,934) (420,953) (429,111) (436,298) (443,347) (475,007) (506,291) (537,377) (568,265) (599,351)
Cash flows from financing activities
Proceeds from revolving credit facility 100,000 - 500,000 37,781 114,006 - 341,545 - - - - - - -
Payments on revolving credit facility - (100,000) (225,000) - - (41,034) - (328,737) (398,561) - - - - -
Proceeds from LT loan - 250,000 150,000 275,000 - - - - - - - - - -
Payments on term loan - (13,750) (36,250) (2) (2) (2) (43,994) - - - - - - -
Payments on LT debt (5,471) (4,972) (3,952) (42,000) (42,000) (42,000) (501,000) - - - - - - -
Excess tax benefits from stock based comp (SBC) 17,163 36,965 45,917 - - - - - - - - - - -
Proceeds from exercise of stock options & other stock issuances 15,103 15,776 10,310 172,000 173,720 175,457 177,212 178,984 180,774 182,581 184,407 186,251 188,114 189,995
Payments of debt financing cost - (1,713) (947) - - - - - - - - - - -
Net cash flows from financing activities 126,795 182,306 440,078 442,779 245,724 92,421 (26,237) (149,753) (217,788) 182,581 184,407 186,251 188,114 189,995
Net increase/(decrease) in cash and cash equivalents 8,763 249,027 (451,501) 126,017 128,723 125,785 127,743 129,039 197,334 684,144 770,630 821,779 888,329 945,674
Effect of exchange rate changes on cash and cash equivalents (3,115) (3,341) (11,822) - - - - - - - - - - -
Cash and cash equivalents at the beginning of the year 341,841 347,489 593,175 129,852 255,869 384,592 510,377 638,120 767,159 964,493 1,648,636 2,419,267 3,241,046 4,129,375
Cash and cash equivalents at the end of the year 347,489 593,175 129,852 255,869 384,592 510,377 638,120 767,159 964,493 1,648,636 2,419,267 3,241,046 4,129,375 5,075,049
9
Revenue
Expenses
Balance sheet (S$ '000) Page 2013A 2014A 2015A 2016E 2017E 2018E 2019E 2020E 2021E 2022E 2023E 2024E 2025E 2026E
Inventories 51 469,006 536,714 783,031 1,120,013 1,397,032 1,648,998 1,908,094 2,169,900 2,402,452 2,628,477 2,867,172 3,102,855 3,335,526 3,566,690
Account Receivable 51 209,952 279,835 433,638 620,257 773,668 913,206 1,056,691 1,201,678 1,330,464 1,455,635 1,587,823 1,718,343 1,847,195 1,975,212
Prepayments 51 63,987 87,177 152,242 217,760 271,620 320,609 370,984 421,886 467,100 511,046 557,454 603,277 648,515 693,459
Deferred income taxes 51 38,377 52,498 - - - - - - - - - - - -
Due from related corporations 51 - - - - - - - - - - - - - -
Amounts due from minority shareholders of subsidiaries51 - - - - - - - - - - - - - -
Cash and cash equivalents 51 347,489 593,175 129,852 255,869 384,592 510,377 638,120 767,159 964,493 1,648,636 2,419,267 3,241,046 4,129,375 5,075,049
Current assets 51 1,128,811 1,549,399 1,498,763 2,213,899 2,826,912 3,393,190 3,973,889 4,560,623 5,164,509 6,243,795 7,431,717 8,665,522 9,960,610 11,310,411
51
Property, plant and equipment 51 223,952 305,564 538,531 791,345 999,741 1,164,661 1,283,513 1,354,987 1,399,088 1,437,270 1,449,823 1,489,945 1,541,388 1,611,198
Intangible assets 51 24,097 26,230 75,686 75,686 75,686 75,686 75,686 75,686 75,686 75,686 75,686 75,686 75,686 75,686
Goodwill 51 122,244 123,256 585,181 585,181 585,181 585,181 585,181 585,181 585,181 585,181 585,181 585,181 585,181 585,181
Investment in associates 51 - - - - - - - - - - - - - -
Investment in joint ventures 51 - - - - - - - - - - - - - -
Other receivables 51 - - - - - - - - - - - - - -
Other LT assets 51 47,543 57,064 78,582 78,582 78,582 78,582 78,582 78,582 78,582 78,582 78,582 78,582 78,582 78,582
Deferred income taxes 51 31,094 33,570 92,157 92,157 92,157 92,157 92,157 92,157 92,157 92,157 92,157 92,157 92,157 92,157
Non-current assets 51 448,930 545,684 1,370,137 1,622,951 1,831,347 1,996,267 2,115,119 2,186,593 2,230,694 2,268,876 2,281,429 2,321,551 2,372,994 2,442,804
Total assets 51 1,577,741 2,095,083 2,868,900 3,836,850 4,658,259 5,389,457 6,089,008 6,747,216 7,395,202 8,512,671 9,713,146 10,987,072 12,333,604 13,753,214
Accounts Payable 51 165,456 210,432 200,460 286,729 357,647 422,152 488,482 555,506 615,040 672,904 734,011 794,347 853,912 913,091
Accrued Expenses 51 133,729 147,681 192,935 275,966 344,222 406,305 470,145 534,653 591,952 647,644 706,457 764,528 821,857 878,815
Other Current Liabilities 51 22,473 34,563 43,415 62,099 77,458 91,428 105,794 120,310 133,203 145,735 158,970 172,037 184,938 197,754
Short-term loans 51 100,000 - - - - - - - - - - - -
Current maturities of long-term loans 51 4,972 28,951 42,000 42,000 42,000 42,000 42,000 42,000 42,000 42,000 42,000 42,000 42,000 42,000
Tax payable 51 - - - - - - - - - - - - - -
Current liabilities 51 426,630 421,627 478,810 666,794 821,327 961,886 1,106,421 1,252,468 1,382,196 1,508,283 1,641,438 1,772,913 1,902,707 2,031,661
51
Other LT liabilities 51 49,806 67,906 94,868 94,866 94,864 94,862 50,868 50,868 50,868 50,868 50,868 50,868 50,868 50,868
Long-term debts, net of current maturities 51 47,951 255,250 352,000 585,000 543,000 501,000 - - - - - - - -
Revolving Credit facility 51 - - 275,000 312,781 426,787 385,753 727,298 398,561 - - - - - -
Deferred tax liabilities 51 - - - - - - - - - - - - - -
Non-current liabilities 51 97,757 323,156 721,868 992,647 1,064,651 981,615 778,166 449,429 50,868 50,868 50,868 50,868 50,868 50,868
Total Liabilities 51 524,387 744,783 1,200,678 1,659,441 1,885,979 1,943,501 1,884,587 1,701,897 1,433,064 1,559,151 1,692,306 1,823,781 1,953,575 2,082,529
Share capital 51 35 71 72 72 72 72 72 72 72 72 72 72 72 72
Additional PIC 51 397,283 508,350 636,630 808,630 982,350 1,157,807 1,335,019 1,514,003 1,694,777 1,877,358 2,061,765 2,248,017 2,436,131 2,626,126
Retained Earnings 51 653,842 856,687 1,076,533 1,413,720 1,834,871 2,333,090 2,914,343 3,576,257 4,312,303 5,121,103 6,004,015 6,960,216 7,988,840 9,089,501
Accumulated other comprehensive income/(loss)51 2,194 (14,808) (45,013) (45,013) (45,013) (45,013) (45,013) (45,013) (45,013) (45,013) (45,013) (45,013) (45,013) (45,013)
Equity attributable to owners of the Company 51 1,053,354 1,350,300 1,668,222 2,177,409 2,772,280 3,445,956 4,204,421 5,045,318 5,962,138 6,953,520 8,020,840 9,163,292 10,380,029 11,670,686
Non-controlling interests 51 - - - - - - - - - - - - - -
Total equity 1,053,354 1,350,300 1,668,222 2,177,409 2,772,280 3,445,956 4,204,421 5,045,318 5,962,138 6,953,520 8,020,840 9,163,292 10,380,029 11,670,686
Total liabilities and equity 1,577,741 2,095,083 2,868,900 3,836,850 4,658,259 5,389,457 6,089,008 6,747,216 7,395,202 8,512,671 9,713,146 10,987,072 12,333,604 13,753,214
Check Yes Yes Yes Yes Yes Yes Yes Yes Yes Yes Yes Yes Yes Yes
Total Shares Outstanding ( Basic) 416,230 424,571 430,000 434,300 438,643 443,029 447,460 451,934 456,454 461,018 465,628 470,285 474,988 479,737
Total Shares Outstanding ( Diluted) 416,232 433,416 438,800 443,188 447,620 452,096 456,617 461,183 465,795 470,453 475,158 479,909 484,708 489,555
Growth rate (Basic) 2.0% 1.3% 1% 1% 1% 1% 1% 1% 1% 1% 1% 1% 1%
Growth rate (Diluted) 4.1% 1.2% 1% 1% 1% 1% 1% 1% 1% 1% 1% 1% 1%
Additional shares issued basic 4,300 4,343 4,386 4,430 4,475 4,519 4,565 4,610 4,656 4,703 4,750
Additional PIC $40.00 172,000 173,720 175,457 177,212 178,984 180,774 182,581 184,407 186,251 188,114 189,995
Market Cap 17,897,976 18,636,888 18,868,400 19,057,084 19,247,655 19,440,131 19,634,533 19,830,878 20,029,187 20,229,479 20,431,773 20,636,091 20,842,452 21,050,877
Under ArmourRevenue
x Revenue (S$ '000) Page 2012A 2013A 2014A 2015A 2016E 2017E 2018E 2019E 2020E 2021E 2022E 2023E 2024E 2025E 2026E
Growth 27% 32% 28% 43% 25% 18% 16% 14% 11% 9% 9% 8% 7% 7%
x Total revenue
North America Operations 1,726,661 2,193,739 2,796,374 3,455,737 4,566,650 5,446,584 6,166,685 6,886,787 7,606,888 8,326,989 9,047,090 9,767,192 10,487,293 11,207,394 11,927,495
International Operations 108,260 137,244 268,771 454,161 937,365 1,333,943 1,730,520 2,127,098 2,523,675 2,920,253 3,316,830 3,713,408 4,109,985 4,506,563 4,903,140
Connected Fitness Operations - 1,068 19,225 53,415 164,934 290,552 449,203 643,936 852,390 912,773 940,124 1,031,600 1,107,830 1,168,814 1,222,175
Total 1,834,921 2,332,051 3,084,370 3,963,313 5,668,949 7,071,078 8,346,408 9,657,820 10,982,953 12,160,015 13,304,044 14,512,199 15,705,108 16,882,770 18,052,810
Contribution to revenue
North America Operations as % of total revenue 94.1% 94.1% 90.7% 87.2% 80.6% 77.0% 73.9% 71.3% 69.3% 68.5% 68.0% 67.3% 66.8% 66.4% 66.1%
International Operations as % of total revenue 5.9% 5.9% 8.7% 11.5% 16.5% 18.9% 20.7% 22.0% 23.0% 24.0% 24.9% 25.6% 26.2% 26.7% 27.2%
Connected Fitness Operations % of total revenue 0.0% 0.0% 0.6% 1.3% 2.9% 4.1% 5.4% 6.7% 7.8% 7.5% 7.1% 7.1% 7.1% 6.9% 6.8%
x Operating profit
North America Operations 271,338 379,814 460,961 614,703 733,148 830,078 927,009 1,023,940 1,120,870 1,217,801 1,314,731 1,411,662 1,508,593 1,605,523
International Operations (5,706) (5,190) 8,887 18,747 26,679 34,610 42,542 50,474 58,405 66,337 74,268 82,200 90,131 98,063
Connected Fitness Operations (534) (20,669) (61,301) (164,934) (232,441) (224,601) (64,394) 42,620 91,277 188,025 361,060 387,740 409,085 427,761
Investment 60 - - - - - - - - - - - - - -
Others - - - - - - - - - - - - - -
Total 265,098 353,955 408,547 468,516 527,385 640,088 905,157 1,117,033 1,270,553 1,472,162 1,750,060 1,881,602 2,007,809 2,131,347
Operating margin
North America Operations 12.4% 13.6% 13.3% 13.5% 13.5% 13.5% 13.5% 13.5% 13.5% 13.5% 13.5% 13.5% 13.5% 13.5%
International Operations -4.2% -1.9% 2.0% 2.0% 2.0% 2.0% 2.0% 2.0% 2.0% 2.0% 2.0% 2.0% 2.0% 2.0%
Connected Fitness Operations -50.0% -107.5% -114.8% (100.0%) (80.0%) (50.0%) (10.0%) 5.0% 10.0% 20.0% 35.0% 35.0% 35.0% 35.0%
x 1. North America Operations
Total revenue 80 2,193,739 2,796,374 3,455,737
Profit from operations (EBIT) 80 271,338 379,814 460,961
Interest Expense - - -
Other Expense - - -
Segment profit/(loss) 271,338 379,814 460,961
x 2. International Operations
Total revenue 80 137,244 268,771 454,161
Profit from operations (EBIT) 80 (5,706) (5,190) 8,887
Interest Expense - - -
Other Expense - - -
Segment profit/(loss) (5,706) (5,190) 8,887
x 3. Connected Fitness Operations
Total revenue 80 1,068 19,225 53,415
Profit from operations (EBIT) 80 (534) (20,669) (61,301)
Interest Expense - - -
Other Expense - - -
x Segment profit/(loss) (534) (20,669) (61,301)
No. of Entities Investor Day Presentation
North America Operations Stores (4) 80 117 140 153 181 208 236 263 291 318 346 373 401 428 456
International Operations Partners 10 50 226 450 780 1,110 1,440 1,770 2,100 2,430 2,760 3,090 3,420 3,750 4,080
Connected Fitness Operations Users (Million) - 40 60 140 294 463 648 848 1,033 1,203 1,357 1,489 1,599 1,687 1,764
*wholesale & direct retail ratio
Segment expansion
North America Operations 37 23 13 28 28 28 28 28 28 28 28 28 28 28
International Operations 40 176 224 330 330 330 330 330 330 330 330 330 330 330
Connected Fitness Operations 40 20 80 154 169 185 200 185 169 154 132 110 88 77
Sales per outlet
North America Operations Take average 21,583 18,750 19,974 22,587 22,000 22,770 22,770 22,770 22,770 22,770 22,770 22,770 22,770 22,770 22,770
International Operations Decreasing 10,826 2,745 1,189 1,009 1,045 1,045 1,045 1,045 1,045 1,045 1,045 1,045 1,045 1,045 1,045
Connected Fitness Operations Increasing rapidly NA 27 320 382 468 523 578 633 688 633 578 578 578 578 578
SSSG
North America Operations Maintain (13.1%) 6.5% 13.1% 15.0% 15.0% 15.0% 15.0% 15.0% 15.0% 15.0% 15.0% 15.0% 15.0% 15.0%
International Operations Decrease (74.6%) (56.7%) (15.1%) 15.0% 15.0% 15.0% 15.0% 15.0% 15.0% 15.0% 15.0% 15.0% 15.0% 15.0%
Connected Fitness Operations Increase #VALUE! 1,100.1% 19.1% 20.0% 20.0% 20.0% 20.0% 20.0% 20.0% 20.0% 20.0% 20.0% 20.0% 20.0%
10
NWC
Fixed Assets:
Under ArmourExpenses
x Operating expenses (S$ '000) 2013A 2014A 2015A 2016E 2017E 2018E 2019E 2020E 2021E 2022E 2023E 2024E 2025E 2026E
x Total revenue
North America Operations 2,193,739 2,796,374 3,455,737 4,566,650 5,446,584 6,166,685 6,886,787 7,606,888 8,326,989 9,047,090 9,767,192 10,487,293 11,207,394 11,927,495
International Operations 137,244 268,771 454,161 937,365 1,333,943 1,730,520 2,127,098 2,523,675 2,920,253 3,316,830 3,713,408 4,109,985 4,506,563 4,903,140
Connected Fitness Operations 1,068 19,225 53,415 164,934 290,552 449,203 643,936 852,390 912,773 940,124 1,031,600 1,107,830 1,168,814 1,222,175
Total 2,332,051 3,084,370 3,963,313 5,668,949 7,071,078 8,346,408 9,657,820 10,982,953 12,160,015 13,304,044 14,512,199 15,705,108 16,882,770 18,052,810
x Operating profit
North America Operations 271,338 379,814 460,961 614,703 733,148 830,078 927,009 1,023,940 1,120,870 1,217,801 1,314,731 1,411,662 1,508,593 1,605,523
International Operations (5,706) (5,190) 8,887 18,747 26,679 34,610 42,542 50,474 58,405 66,337 74,268 82,200 90,131 98,063
Connected Fitness Operations (534) (20,669) (61,301) (164,934) (232,441) (224,601) (64,394) 42,620 91,277 188,025 361,060 387,740 409,085 427,761
Investment - - - - - - - - - - - - - -
Others - - - - - - - - - - - - - -
Total 265,098 353,955 408,547 468,516 527,385 640,088 905,157 1,117,033 1,270,553 1,472,162 1,750,060 1,881,602 2,007,809 2,131,347
Net operating expenses (incl. COGS) (2,066,953) (2,730,415) (3,554,766) (5,200,433) (6,543,693) (7,706,320) (8,752,662) (9,865,920) (10,889,462) (11,831,882) (12,762,139) (13,823,505) (14,874,962) (15,921,463)
COGS (1,195,381) (1,572,164) (2,057,766) (2,943,338) (3,671,329) (4,333,484) (5,014,374) (5,702,388) (6,313,522) (6,907,506) (7,534,784) (8,154,147) (8,765,594) (9,373,082)
Other operating income - - - - - - - - - - - - - -
SG&A Expenses (871,572) (1,158,251) (1,497,000) (2,141,243) (2,670,847) (3,152,558) (3,647,897) (4,148,418) (4,593,012) (5,025,128) (5,481,465) (5,932,044) (6,376,864) (6,818,805)
Other expense (1,172) (6,410) (7,234) (10,347) (12,906) (15,234) (17,628) (20,047) (22,195) (24,283) (26,488) (28,666) (30,815) (32,951)
Total (2,068,125) (2,736,825) (3,562,000) (5,094,928) (6,355,082) (7,501,276) (8,679,898) (9,870,852) (10,928,729) (11,956,917) (13,042,738) (14,114,856) (15,173,272) (16,224,838)
% Margin
COGS (51.3%) (51.0%) (51.9%) (51.9%) (51.9%) (51.9%) (51.9%) (51.9%) (51.9%) (51.9%) (51.9%) (51.9%) (51.9%) (51.9%)
Other operating income 0.0% 0.0% 0.0% - - - - - - - - - - -
SG&A Expenses (37.4%) (37.6%) (37.8%) (37.8%) (37.8%) (37.8%) (37.8%) (37.8%) (37.8%) (37.8%) (37.8%) (37.8%) (37.8%) (37.8%)
Other expense (0.1%) (0.2%) (0.2%) (0.2%) (0.2%) (0.2%) (0.2%) (0.2%) (0.2%) (0.2%) (0.2%) (0.2%) (0.2%) (0.2%)
% Of net operating expense
COGS 57.8% 57.6% 57.9% 57.8% 57.8% 57.8% 57.8% 57.8% 57.8% 57.8% 57.8% 57.8% 57.8% 57.8%
Other operating income 0.0% 0.0% 0.0% - - - - - - - - - - -
SG&A 42.2% 42.4% 42.1% 42.2% 42.2% 42.2% 42.2% 42.2% 42.2% 42.2% 42.2% 42.2% 42.2% 42.2%
Other expense 0.1% 0.2% 0.2% 0.2% 0.2% 0.2% 0.2% 0.2% 0.2% 0.2% 0.2% 0.2% 0.2% 0.2%
Under ArmourWorking capital
x Working capital (S$ '000) 2012A 2013A 2014A 2015A 2016E 2017E 2018E 2019E 2020E 2021E 2022E 2023E 2024E 2025E 2026E
Revenue - 2,332,051 3,084,370 3,963,313 5,668,949 7,071,078 8,346,408 9,657,820 10,982,953 12,160,015 13,304,044 14,512,199 15,705,108 16,882,770 18,052,810
COGS - (1,195,381) (1,572,164) (2,057,766) (2,943,338) (3,671,329) (4,333,484) (5,014,374) (5,702,388) (6,313,522) (6,907,506) (7,534,784) (8,154,147) (8,765,594) (9,373,082)
Current assets *Drastic increase in inventories is not ideal, from operations management POV, leads to inefficiencies and reduced productivity
Inventories 319,286 469,006 536,714 783,031 1,120,013 1,397,032 1,648,998 1,908,094 2,169,900 2,402,452 2,628,477 2,867,172 3,102,855 3,335,526 3,566,690
Account Receivables 175,524 209,952 279,835 433,638 620,257 773,668 913,206 1,056,691 1,201,678 1,330,464 1,455,635 1,587,823 1,718,343 1,847,195 1,975,212
Prepayments 43,896 63,987 87,177 152,242 217,760 271,620 320,609 370,984 421,886 467,100 511,046 557,454 603,277 648,515 693,459
Current liabilities
Account Payables 143,689 165,456 210,432 200,460 286,729 357,647 422,152 488,482 555,506 615,040 672,904 734,011 794,347 853,912 913,091
Accrued Expenses 85,077 133,729 147,681 192,935 275,966 344,222 406,305 470,145 534,653 591,952 647,644 706,457 764,528 821,857 878,815
Other Current Liabilities 14,330 22,473 34,563 43,415 62,099 77,458 91,428 105,794 120,310 133,203 145,735 158,970 172,037 184,938 197,754
Days
Inventories (days) 143 125 139 139 139 139 139 139 139 139 139 139 139 139
Account Receivables (days) 33 33 40 40 40 40 40 40 40 40 40 40 40 40
Prepayments (days) 10 10 14 14 14 14 14 14 14 14 14 14 14 14
Account Payables (days) 51 49 36 36 36 36 36 36 36 36 36 36 36 36
Accrued Expenses (days) 41 34 34 34 34 34 34 34 34 34 34 34 34 34
Other Current Liabilities (days) 7 8 8 8 8 8 8 8 8 8 8 8 8 8
Cash conversion cycle 88 77 115 115 115 115 115 115 115 115 115 115 115 115
- Change in NWC (125,677) (89,763) (421,051) (401,135) (329,756) (299,935) (308,421) (311,648) (276,824) (269,055) (284,137) (280,551) (276,965) (275,173)
Under ArmourFixed asset
x Fixed asset (S$ '000) Page 2012A 2013A 2014A 2015A 2016E 2017E 2018E 2019E 2020E 2021E 2022E 2023E 2024E 2025E 2026E
Revenue 2,332,051 3,084,370 3,963,313 5,668,949 7,071,078 8,346,408 9,657,820 10,982,953 12,160,015 13,304,044 14,512,199 15,705,108 16,882,770 18,052,810
x Capex 39
North America Operations 59,095 86,196 131,878 283,836 360,450 360,450 360,450 360,450 360,450 360,450 385,200 409,950 434,700 459,450 484,200
International Operations 3,705 5,404 12,650 37,433 37,800 43,740 49,680 55,620 61,560 67,500 73,440 79,380 85,320 91,260 97,200
Connected Fitness Operations - - 872 4,232 6,804 8,744 10,823 13,041 14,288 15,397 16,367 16,961 17,357 17,555 17,951
Others - - - - - - - - - - - - - - -
Total 62,800 91,600 145,400 325,500 405,054 412,934 420,953 429,111 436,298 443,347 475,007 506,291 537,377 568,265 599,351
59% 124%
Other capex as % of revenue 0.0% 0.0% 0.0% 0.0% 0.0% 0.0% 0.0% 0.0% 0.0% 0.0% 0.0% 0.0% 0.0% 0.0%
Capex as % of revenue 3.9% 4.7% 8.2% 7.1% 5.8% 5.0% 4.4% 4.0% 3.6% 3.6% 3.5% 3.4% 3.4% 3.3%
x 1. Expansion capex
North America Operations 222,750 198,000 173,250 148,500 123,750 99,000 99,000 99,000 99,000 99,000 99,000
International Operations 29,700 29,700 29,700 29,700 29,700 29,700 29,700 29,700 29,700 29,700 29,700
Connected Fitness Operations 5,544 6,098 6,653 7,207 6,653 6,098 5,544 4,752 3,960 3,168 2,772
No. of additional stores
North America Operations 37 23 13 28 28 28 28 28 28 28 28 28 28 28
International Operations 40 176 224 330 330 330 330 330 330 330 330 330 330 330
Connected Fitness Operations 40 20 80 154 169 185 200 185 169 154 132 110 88 77
Expansion capex per store
North America Operations 732 1,986 11,689 8,100 7,200 6,300 5,400 4,500 3,600 3,600 3,600 3,600 3,600 3,600
International Operations 42 41 111 90 90 90 90 90 90 90 90 90 90 90
Connected Fitness Operations - 44 42 36 36 36 36 36 36 36 36 36 36 36
11
Debt:
x 2. Maintenance capex
North America Operations 137,700 162,450 187,200 211,950 236,700 261,450 286,200 310,950 335,700 360,450 385,200
International Operations 8,100 14,040 19,980 25,920 31,860 37,800 43,740 49,680 55,620 61,560 67,500
Connected Fitness Operations 1,260 2,646 4,171 5,834 7,636 9,299 10,823 12,209 13,397 14,387 15,179
No. of stores
North America Operations 80 117 140 153 180.5 208 235.5 263 290.5 318 345.5 373 400.5 428 455.5
International Operations 10 50 226 450 780 1110 1440 1770 2100 2430 2760 3090 3420 3750 4080
Connected Fitness Operations 0 40 60 140 294 463.4 648.2 848.4 1033.2 1202.6 1356.6 1488.6 1598.6 1686.6 1763.6
Maintenance capex per store
North America Operations 739 737 942 900 900 900 900 900 900 900 900 900 900 900
International Operations 371 108 56 18 18 18 18 18 18 18 18 18 18 18
Connected Fitness Operations #DIV/0! - 15 9 9 9 9 9 9 9 9 9 9 9
x Depreciation schedule 58,65
Implied useful life Stated useful life
Existing PPE Gross BV Net BV Dep (2015) New FA Existing FA
Leasehold & Tenant Improvement 214,834 214,834 20,000 11 11 10-35 years *Existing fixed assets vs new fixed assets
Furniture, fixtures & displays 132,736 132,736 10,000 13 13 10-35 years
Buildings 47,137 47,137 4,000 12 12 10-35 years
Software 99,309 99,309 20,000 5 5 3 -10 years
Office equipment 50,399 50,399 5,000 10 10 3 -10 years
Plant equipment 118,138 118,138 15,000 8 8 3 -10 years
Construction in progress 147,581 147,581 25,000 6 6 3 -10 years
Others 4,002 4,002 1,940 2 2 3 -10 years
Land 17,628 17,628
Total 831,764 831,764 100,940
Useful life for new capex 8
x Depreciation of existing fixed assets
Leasehold & Tenant Improvement 20,000 20,000 20,000 20,000 20,000 20,000 20,000 20,000 20,000 20,000 14,834
Furniture, fixtures & displays 10,000 10,000 10,000 10,000 10,000 10,000 10,000 10,000 10,000 10,000 10,000
Buildings 4,000 4,000 4,000 4,000 4,000 4,000 4,000 4,000 4,000 4,000 4,000
Software 20,000 20,000 20,000 20,000 19,309 - - - - - -
Office equipment 5,000 5,000 5,000 5,000 5,000 5,000 5,000 5,000 5,000 5,000 399
Plant equipment 15,000 15,000 15,000 15,000 15,000 15,000 15,000 13,138 - - -
Construction in progress 25,000 25,000 25,000 25,000 25,000 22,581 - - - - -
Others 1,940 1,940 122 - - - - - - - -
Total 100,940 100,940 99,122 99,000 98,309 76,581 54,000 52,138 39,000 39,000 29,233
x Depreciation of new fixed assets
Capex year Capex spent
2016E 405,054 51,300 51,300 51,300 51,300 51,300 51,300 51,300 45,954 - - -
2017E 412,934 - 52,298 52,298 52,298 52,298 52,298 52,298 52,298 46,848 - -
2018E 420,953 - - 53,314 53,314 53,314 53,314 53,314 53,314 53,314 47,758 -
2019E 429,111 - - - 54,347 54,347 54,347 54,347 54,347 54,347 54,347 48,683
2020E 436,298 - - - - 55,257 55,257 55,257 55,257 55,257 55,257 55,257
2021E 443,347 - - - - - 56,150 56,150 56,150 56,150 56,150 56,150
2022E 475,007 - - - - - - 60,160 60,160 60,160 60,160 60,160
2023E 506,291 - - - - - - - 64,122 64,122 64,122 64,122
2024E 537,377 - - - - - - - - 68,059 68,059 68,059
2025E 568,265 - - - - - - - - - 71,971 71,971
2026E 599,351 - - - - - - - - - - 75,908
x Total 51,300 103,598 156,912 211,259 266,516 322,665 382,825 441,601 458,255 477,822 500,309
x Total depreciation 50,549 72,093 100,940 152,240 204,538 256,034 310,259 364,825 399,246 436,825 493,739 497,255 516,822 529,542
Depreciation as % of capex 55.2% 49.6% 31.0% 37.6% 49.5% 60.8% 72.3% 83.6% 90.1% 92.0% 97.5% 92.5% 90.9% 88.4%
Depreciation as % of revenue 2.2% 2.3% 2.5% 2.7% 2.9% 3.1% 3.2% 3.3% 3.3% 3.3% 3.4% 3.2% 3.1% 2.9%
Beginning fixed assets 223,952 305,564 538,531 791,345 999,741 1,164,661 1,283,513 1,354,987 1,399,088 1,437,270 1,449,823 1,489,945 1,541,388
Ending fixed assets 223,952 305,564 538,531 791,345 999,741 1,164,661 1,283,513 1,354,987 1,399,088 1,437,270 1,449,823 1,489,945 1,541,388 1,611,198
Under ArmourRetained earnings
x Retained earnings (S$ '000) Notes 2012A 2013A 2014A 2015A 2016E 2017E 2018E 2019E 2020E 2021E 2022E 2023E 2024E 2025E 2026E
x Parent company
Beginning retained earnings 1,076,533 1,413,720 1,834,871 2,333,090 2,914,343 3,576,257 4,312,303 5,121,103 6,004,015 6,960,216 7,988,840
Net income 162,330 208,042 232,573 337,187 421,151 498,219 581,253 661,913 736,046 808,800 882,912 956,201 1,028,623 1,100,662
Dividends paid - - - - - - - - - - - - - -
Ending retained earnings 653,842 856,687 1,076,533 1,413,720 1,834,871 2,333,090 2,914,343 3,576,257 4,312,303 5,121,103 6,004,015 6,960,216 7,988,840 9,089,501
Dividend payout ratio *zero dividend policy - - - - - - - - - - - - - -
x NCI
Beginning retained earnings *no non controlling interests - - - - - - - - - - -
Net income - - - - - - - - - - - - - -
Dividends paid - - - - - - - - - - - - - -
Ending retained earnings - - - - - - - - - - - - - -
Dividend payout ratio NA NA NA - - - - - - - - - - -
Under ArmourDebt
x Debt (S$ '000) Page 2012A 2013A 2014A 2015A 2016E 2017E 2018E 2019E 2020E 2021E 2022E 2023E 2024E 2025E 2026E
Revenue 2,332,051 3,084,370 3,963,313 5,668,949 7,071,078 8,346,408 9,657,820 10,982,953 12,160,015 13,304,044 14,512,199 15,705,108 16,882,770 18,052,810
Cash 347,489 593,175 129,852 170,068 212,132 250,392 289,735 329,489 436,645 1,029,709 1,708,350 2,437,219 3,231,708 4,082,605
Cash as % of revenue 14.9% 19.2% 3.3% 3.0% 3.0% 3.0% 3.0% 3.0% 3.0% 3.0% 3.0% 3.0% 3.0% 3.0%
Target min cash balance 170,068 212,132 250,392 289,735 329,489 364,800 399,121 435,366 471,153 506,483 541,584
x Cash flow before revolver borrowings
CF from operating activities 38 120,070 219,033 (44,104) 88,292 295,933 454,318 583,091 715,090 858,469 976,570 1,092,514 1,172,905 1,268,480 1,355,031
CF from investing activities (238,102) (152,312) (847,475) (405,054) (412,934) (420,953) (429,111) (436,298) (443,347) (475,007) (506,291) (537,377) (568,265) (599,351)
CF from financing activities (excluding revolver) 126,795 182,306 440,078 319,197 45,059 45,930 (456,183) 89,699 90,596 91,502 92,417 93,341 94,275 95,218
Add: Beginning cash balance 593,175 129,852 170,068 212,132 250,392 289,735 329,489 436,645 1,029,709 1,708,350 2,437,219 3,231,708
Less: Target min cash balance - (170,068) (212,132) (250,392) (289,735) (329,489) (364,800) (399,121) (435,366) (471,153) (506,483) (541,584)
Cash balance before revolver borrowings (37,781) (114,006) 41,034 (341,545) 328,737 470,406 630,588 1,272,984 1,966,066 2,725,225 3,541,021
x 1. Short-term loans/ REVOLVER
Beginning balance 275,000 275,000 312,781 426,787 385,753 727,298 398,561 - - - - -
Additions 37,781 114,006 0 341,545 0 0 0 0 0 0 0
Repayments - - (41,034) - (328,737) (398,561) - - - - -
Ending balance 275,000 275,000 312,781 426,787 385,753 727,298 398,561 - - - - - -
Interest expense 3,589 4,082 5,570 5,034 9,491 5,201 - - - - -
Interest rate 1.29%-1.32% 1.3% 1.3% 1.3% 1.3% 1.3% 1.3% 1.3% 1.3% 1.3% 1.3% 1.3%
Amortization rate
12
x 2. Long-term loans 69
Term loans Maturity Ending balance Page
a US Dollar 2020 42,000 69
b US Dollar 2019 42,000 69
c US Dollar 2019 42,000 69
Total 126,000
x 2b. USD (2012 - 2019) Scheduled LT debts
Beginning balance 275,000 352,000 585,000 543,000 501,000 - - - - - - -
Additions 275,000 - - - - - - - - - -
Repayments (42,000) (42,000) (42,000) (501,000) - - - - - - -
Ending balance 352,000 585,000 543,000 501,000 - - - - - - - -
Interest expense 7,965 9,588 8,874 4,259 - - - - - - -
Interest rate 1.7% 1.7% 1.7% 1.7% 1.7% 1.7% 1.7% 1.7% 1.7% 1.7% 1.7% 1.7%
Amortization rate - - - 100.0% - - - - - - -
x 2c. USD (2012-2019) Term Loan
Beginning balance 44,000 43,998 43,996 43,994 - - - - - - -
Additions - - - - - - - - - - -
Repayments (2) (2) (2) (43,994) - - - - - - -
Ending balance 44,000 43,998 43,996 43,994 - - - - - - - -
Interest expense 748 748 748 374 - - - - - - -
Interest rate 1.7% 1.7% 1.7% 1.7% 1.7% 1.7% 1.7% 1.7% 1.7% 1.7% 1.7% 1.7%
Amortization rate - - - 100.0% - - - - - - -
Current portion 42,002 42,002 544,994 - - - - - - - -
Non-current portion 15,156 50,613 138,216 586,996 544,994 - - - - - - - - -
Total debt 628,998 586,996 544,994 - - - - - - - -
Interest expense 2,900 5,300 14,600 12,301 14,418 15,191 9,667 9,491 5,201 - - - - -
Proceeds from long-term loans 275,000 - - - - - - - - - -
Repayment of long-term loans (42,002) (42,002) (42,002) (544,994) - - - - - - -
x Interest income
Interest income - - - 260 340 424 501 579 659 873 2,059 3,417 4,874 6,463
Interest rate - - - 0.2% 0.2% 0.2% 0.2% 0.2% 0.2% 0.2% 0.2% 0.2% 0.2% 0.2%
Under ArmourDCF Valuation
x WACC assumptions (S$ '000) Notes 2012A 2013A 2014A 2015A 2016E 2017E 2018E 2019E 2020E 2021E 2022E 2023E 2024E 2025E 2026E
Cost of equity 8.1%
Risk free rate 1.58% *10 yr US treasury bond yield as of 20/07/16
Beta 1.08 *Bloomberg
Equity risk premium 6.0% *Bloomberg
Cost of debt 2.4%
Risk Free Yield 1.3%
BBB- Corporate Rating 6.9%
Tax rate 40.0%
Market cap ( USD '000 ) 17,802,086
Total debt (USD '000) 1,015,100
WACC 7.7%
x DCF assumptions (S$ '000) Notes 2012A 2013A 2014A 2015A 2016E 2017E 2018E 2019E 2020E 2021E 2022E 2023E 2024E 2025E 2026E
Valuation date 10-Sep-2016 Sensitivity table ends
Financial year end 31-Dec-2016 WACC 1.0%
Mid year discounting Yes Exit multiple 1.0x
Year frac 31% LTGR 0.5%
x DCF valuation (S$ '000) Notes 2012A 2013A 2014A 2015A 2016E 2017E 2018E 2019E 2020E 2021E 2022E 2023E 2024E 2025E 2026E
Revenue 2,332,051 3,084,370 3,963,313 5,668,949 7,071,078 8,346,408 9,657,820 10,982,953 12,160,015 13,304,044 14,512,199 15,705,108 16,882,770 18,052,810
% growth 32.3% 28.5% 43.0% 24.7% 18.0% 15.7% 13.7% 10.7% 9.4% 9.1% 8.2% 7.5% 6.9%
EBITDA 314,475 419,638 502,253 726,261 920,534 1,101,166 1,288,180 1,476,925 1,630,533 1,783,952 1,963,200 2,087,507 2,226,320 2,357,514
% margin 13.5% 13.6% 12.7% 12.8% 13.0% 13.2% 13.3% 13.4% 13.4% 13.4% 13.5% 13.3% 13.2% 13.1%
EBIT 263,926 347,545 401,313 574,021 715,996 845,132 977,921 1,112,100 1,231,286 1,347,127 1,469,461 1,590,251 1,709,498 1,827,973
% margin 11.3% 11.3% 10.1% 10.1% 10.1% 10.1% 10.1% 10.1% 10.1% 10.1% 10.1% 10.1% 10.1% 10.1%
x NOPAT 344,412 429,598 507,079 586,753 667,260 738,772 808,276 881,677 954,151 1,025,699 1,096,784
% tax 40.0% 40.0% 40.0% 40.0% 40.0% 40.0% 40.0% 40.0% 40.0% 40.0% 40.0%
+ D&A 152,240 204,538 256,034 310,259 364,825 399,246 436,825 493,739 497,255 516,822 529,542
- Capex (405,054) (412,934) (420,953) (429,111) (436,298) (443,347) (475,007) (506,291) (537,377) (568,265) (599,351)
- Change in NWC (401,135) (329,756) (299,935) (308,421) (311,648) (276,824) (269,055) (284,137) (280,551) (276,965) (275,173)
FCFF (309,537) (108,555) 42,225 159,480 284,139 417,847 501,038 584,987 633,478 697,290 751,801
x FCFF (adjusted for valuation date) (95,441) (108,555) 42,225 159,480 284,139 417,847 501,038 584,987 633,478 697,290 751,801
Discount period 0.19 0.81 1.81 2.81 3.81 4.81 5.81 6.81 7.81 8.81 9.81
Discount factor 1.0 0.9 0.9 0.8 0.8 0.7 0.6 0.6 0.6 0.5 0.5
x PV of FCFF (94,093) (102,234) 36,921 129,475 214,180 292,437 325,578 352,937 354,854 362,660 363,042
x Method Exit multiple method Weightage WACC
Total PV of FCFF (USD '000) 2,235,758 15.1% 32 6.1% 7.1% 8.1% 9.1% 10.1%
Chosen PV of terminal value (SGD mm) 12,522,780 84.9% 2.5% 37.2 33.9 31.0 28.3 25.9
Enterprise value 14,758,538 2.0% 37.2 33.9 31.0 28.3 25.9
Net debt (539,000) 1.5% 37.2 33.9 31.0 28.3 25.9
Minority interest - 1.0% 37.2 33.9 31.0 28.3 25.9
Associates - 0.5% 37.2 33.9 31.0 28.3 25.9
Implied equity value 14,219,538
Diluted NOSH 443,188
Implied stock price 32.1 WACC
32 6.1% 7.1% 8.1% 9.1% 10.1%
13.0x 43.1 39.3 35.9 32.8 30.0
12.0x 46.1 42.0 38.4 35.1 32.1
1. Gordon growth method 11.0x 46.1 42.0 38.4 35.1 32.1
Long term growth rate 2.0% 10.0x 43.1 39.3 35.9 32.8 30.0
Final year FCF 751,801 9.0x 37.2 33.9 31.0 28.3 25.9
Terminal value 13,443,510
Present value of terminal value 6,491,819
Implied 2016E EV/ EBITDA 5.9x
Enterprise value 8,727,577
2. Exit multiple method
2016E EV/ EBITDA 11.0x
Exit EBITDA 2,357,514
Terminal value 25,932,656
Present value of terminal value 12,522,780
Implied long term growth rate 4.6%
Enterprise value 14,758,538
Long term growth rate
Exit multiple

13
Ratios:
Extended Du Pont Analysis:
Financial Ratios 2014A 2015A 2016E 2017E 2018E 2019E 2020E 2021E
Profitability
Net Profit Margin 6.7% 5.9% 5.9% 6.0% 6.0% 6.0% 6.0% 6.1%
Return on Asset 9.9% 8.1% 8.8% 9.0% 9.2% 9.5% 9.8% 10.0%
Return on Equity 15.4% 13.9% 15.5% 15.2% 14.5% 13.8% 13.1% 12.3%
Liquidity
Current Ratio 3.7 3.1 3.3 3.4 3.5 3.6 3.6 3.7
Cash Ratio 1.4 0.3 0.4 0.5 0.5 0.6 0.6 0.7
Asset Utilization
Total Asset Turnover 1.5 1.4 1.5 1.5 1.5 1.6 1.6 1.6
Inventory Turnover 2.9 2.6 2.6 2.6 2.6 2.6 2.6 2.6
Receivables Turnover 11.0 9.1 9.1 9.1 9.1 9.1 9.1 9.1
Financial Leverage
LT Debt to Assets 12.2% 21.9% 23.4% 20.8% 16.5% 11.9% 5.9% 0.0%
LT Debt to Equity 18.9% 37.6% 41.2% 35.0% 25.7% 17.3% 7.9% 0.0%
Debt to Equity 21.0% 40.1% 43.2% 36.5% 27.0% 18.3% 8.7% 0.7%
Debt to Asset 14% 23% 24% 22% 17% 13% 7% 1%
Interest Coverage 65 27 47 50 56 101 117 237
Debt Service Coverage 39 16 27 29 33 60 70 142
Market Value
Price to Earnings 90 81 57 46 39 34 30 27
EV/EBITDA 44 39 27 22 18 15 13 12
Du Pont Analysis 2014A 2015A 2016E 2017E 2018E 2019E 2020E 2021E
Tax Burden
Earnings Before Taxes 342,210 386,685 561,979 701,918 830,365 968,756 1,103,189 1,226,744
Net Income 208,042 232,573 337,187 421,151 498,219 581,253 661,913 736,046
Tax Burden Ratio 60.8% 60.1% 60.0% 60.0% 60.0% 60.0% 60.0% 60.0%
Interest Burden
Earnings Before Taxes 342,210 386,685 561,979 701,918 830,365 968,756 1,103,189 1,226,744
EBIT 347,545 401,313 574,021 715,996 845,132 977,921 1,112,100 1,231,286
Interest Burden Ratio 98.5% 96.4% 97.9% 98.0% 98.3% 99.1% 99.2% 99.6%
Profitability
Revenue 3,084,370 3,963,313 5,668,949 7,071,078 8,346,408 9,657,820 10,982,953 12,160,015
EBIT 347,545 401,313 574,021 715,996 845,132 977,921 1,112,100 1,231,286
Operating Profit Margin 11.3% 10.1% 10.1% 10.1% 10.1% 10.1% 10.1% 10.1%
Asset Turnovers
Revenue 3,084,370 3,963,313 5,668,949 7,071,078 8,346,408 9,657,820 10,982,953 12,160,015
Total Assets 2,095,083 2,868,900 3,836,850 4,658,259 5,389,457 6,089,008 6,747,216 7,395,202
Total Asset Turnover 1.5 1.4 1.5 1.5 1.5 1.6 1.6 1.6
Financial Leverage
Total Assets 2,095,083 2,868,900 3,836,850 4,658,259 5,389,457 6,089,008 6,747,216 7,395,202
Total Equity 1,350,300 1,668,222 2,177,409 2,772,280 3,445,956 4,204,421 5,045,318 5,962,138
Asset/Equity Ratio 1.6 1.7 1.8 1.7 1.6 1.4 1.3 1.2
ROE 15.4% 13.9% 15.5% 15.2% 14.5% 13.8% 13.1% 12.3%