Uncovering Large Groups of Active Malicious Accounts in Online ...
12
Uncovering Large Groups of Active Malicious Accounts in Online Social Networks Qiang Cao Xiaowei Yang Duke University {qiangcao, xwy}@cs.duke.edu Jieqi Yu Christopher Palow Facebook Inc. {jieqi, cpalow}@fb.com ABSTRACT The success of online social networks has attracted a constant in- terest in attacking and exploiting them. Attackers usually control malicious accounts, including both fake and compromised real user accounts, to launch attack campaigns such as social spam, malware distribution, and online rating distortion. To defend against these attacks, we design and implement a ma- licious account detection system called SynchroTrap. We observe that malicious accounts usually perform loosely synchronized ac- tions in a variety of social network context. Our system clusters user accounts according to the similarity of their actions and uncov- ers large groups of malicious accounts that act similarly at around the same time for a sustained period of time. We implement Syn- chroTrap as an incremental processing system on Hadoop and Gi- raph so that it can process the massive user activity data in a large online social network efficiently. We have deployed our system in five applications at Facebook and Instagram. SynchroTrap was able to unveil more than two million malicious accounts and 1156 large attack campaigns within one month. Categories and Subject Descriptors C.2.0 [Computer-Communication Networks]: General—Secu- rity and protection; K.6.5 [Management of Computing and In- formation Systems]: Security and protection General Terms Security, Design Keywords Malicious account detection; scalable clustering system; online so- cial networks 1. INTRODUCTION Online social networks (OSNs) such as Facebook, Google+, Twit- ter, or Instagram are popular targets for cyber attacks. By creating fake accounts [19, 44] or compromising existing user accounts [10, Permission to make digital or hard copies of part or all of this work for personal or classroom use is granted without fee provided that copies are not made or distributed for profit or commercial advantage, and that copies bear this notice and the full ci- tation on the first page. Copyrights for third-party components of this work must be honored. For all other uses, contact the owner/author(s). Copyright is held by the author/owner(s). CCS’14, November 3–7, 2014, Scottsdale, Arizona, USA. ACM 978-1-4503-2957-6/14/11. http://dx.doi.org/10.1145/2660267.2660269. 25], attackers can use online social networks to propagate spam messages, spread malware, launch social engineering attacks, or manipulate online voting results. Much of the previous work in defending against these attacks [1– 3, 35] aims to directly identify the fake or compromised accounts an attacker controls. There exist two broad approaches. One approach is to use an account’s social network connectivity [19, 41, 45, 46] to infer whether it is fake or not. This approach can help un- cover fake accounts that have few connections to the real social network, but cannot reliably identify compromised real user ac- counts or well-maintained fake accounts that have acquired many social connections [44]. Another approach, widely adopted in prac- tice [20, 35, 47], is to build machine learning classifiers to infer malicious (fake or compromised) accounts. This approach can ef- fectively classify those malicious accounts with a set of known ma- licious features, but may miss many malicious accounts with un- known features. Motivated by the above challenges, Wang et al. [42] and Beutel et al. [16] have explored a new approach to uncover malicious ac- counts. They analyzed the aggregate behavioral patterns of social network accounts to distinguish malicious accounts from legitimate ones. In particular, Wang et al. analyzed how the http requests from fake accounts differ from those from real user accounts and used this feature to identify fake accounts. Beutel et al. showed that malicious accounts tend to post fake likes to fraudulent Facebook pages at roughly the same time, and designed CopyCatch to detect such synchronized posts. This work advances the state of the art of using aggregate behav- ioral patterns to uncover malicious accounts. Motivated by Copy- Catch, we show that malicious accounts tend to act together in a variety of social network context. In addition to posting fake likes, they may log on, install social network applications, upload spam photos, and so on in a loosely synchronized manner (§ 2). We then present SynchroTrap, a system that can uncover large groups of malicious accounts that act in loose synchrony. We face a number of unique challenges in designing SynchroTrap (§ 3) and these challenges set SynchroTrap apart from previous work in this area, i.e., CopyCatch and Clickstream [42]. First, unlike Copy- Catch, we aim to detect loosely synchronized behavior for a broad range of social network applications. Therefore, we cannot make the assumption that a user can perform a malicious action only once, i.e., a user can like a specific page only once. This differ- ence in goals has greatly increased the algorithmic complexity of SynchroTrap (§ 4 and § 9). Second, detecting the actions from malicious accounts is a chal- lenging anomaly detection problem. Malicious actions constitute only a small fraction of the total user actions. For instance, Face- book has more than 600 million daily active users [8] and they per-
Transcript of Uncovering Large Groups of Active Malicious Accounts in Online ...

Uncovering Large Groups of Active Malicious Accounts inOnline Social Networks
Qiang Cao Xiaowei YangDuke University
{qiangcao, xwy}@cs.duke.edu
Jieqi Yu Christopher PalowFacebook Inc.
{jieqi, cpalow}@fb.com
ABSTRACT
The success of online social networks has attracted a constant in-
terest in attacking and exploiting them. Attackers usually control
malicious accounts, including both fake and compromised real user
accounts, to launch attack campaigns such as social spam, malware
distribution, and online rating distortion.
To defend against these attacks, we design and implement a ma-
licious account detection system called SynchroTrap. We observe
that malicious accounts usually perform loosely synchronized ac-
tions in a variety of social network context. Our system clusters
user accounts according to the similarity of their actions and uncov-
ers large groups of malicious accounts that act similarly at around
the same time for a sustained period of time. We implement Syn-
chroTrap as an incremental processing system on Hadoop and Gi-
raph so that it can process the massive user activity data in a large
online social network efficiently. We have deployed our system in
five applications at Facebook and Instagram. SynchroTrap was able
to unveil more than two million malicious accounts and 1156 large
attack campaigns within one month.
Categories and Subject Descriptors
C.2.0 [Computer-Communication Networks]: General—Secu-
rity and protection; K.6.5 [Management of Computing and In-
formation Systems]: Security and protection
General Terms
Security, Design
Keywords
Malicious account detection; scalable clustering system; online so-
cial networks
1. INTRODUCTIONOnline social networks (OSNs) such as Facebook, Google+, Twit-
ter, or Instagram are popular targets for cyber attacks. By creating
fake accounts [19,44] or compromising existing user accounts [10,
Permission to make digital or hard copies of part or all of this work for personal or
classroom use is granted without fee provided that copies are not made or distributed
for profit or commercial advantage, and that copies bear this notice and the full ci-
tation on the first page. Copyrights for third-party components of this work must be
honored. For all other uses, contact the owner/author(s). Copyright is held by the
author/owner(s).
CCS’14, November 3–7, 2014, Scottsdale, Arizona, USA.
ACM 978-1-4503-2957-6/14/11.
http://dx.doi.org/10.1145/2660267.2660269.
25], attackers can use online social networks to propagate spam
messages, spread malware, launch social engineering attacks, or
manipulate online voting results.
Much of the previous work in defending against these attacks [1–
3,35] aims to directly identify the fake or compromised accounts an
attacker controls. There exist two broad approaches. One approach
is to use an account’s social network connectivity [19, 41, 45, 46]
to infer whether it is fake or not. This approach can help un-
cover fake accounts that have few connections to the real social
network, but cannot reliably identify compromised real user ac-
counts or well-maintained fake accounts that have acquired many
social connections [44]. Another approach, widely adopted in prac-
tice [20, 35, 47], is to build machine learning classifiers to infer
malicious (fake or compromised) accounts. This approach can ef-
fectively classify those malicious accounts with a set of known ma-
licious features, but may miss many malicious accounts with un-
known features.
Motivated by the above challenges, Wang et al. [42] and Beutel
et al. [16] have explored a new approach to uncover malicious ac-
counts. They analyzed the aggregate behavioral patterns of social
network accounts to distinguish malicious accounts from legitimate
ones. In particular, Wang et al. analyzed how the http requests from
fake accounts differ from those from real user accounts and used
this feature to identify fake accounts. Beutel et al. showed that
malicious accounts tend to post fake likes to fraudulent Facebook
pages at roughly the same time, and designed CopyCatch to detect
such synchronized posts.
This work advances the state of the art of using aggregate behav-
ioral patterns to uncover malicious accounts. Motivated by Copy-
Catch, we show that malicious accounts tend to act together in a
variety of social network context. In addition to posting fake likes,
they may log on, install social network applications, upload spam
photos, and so on in a loosely synchronized manner (§ 2).
We then present SynchroTrap, a system that can uncover large
groups of malicious accounts that act in loose synchrony. We face
a number of unique challenges in designing SynchroTrap (§ 3) and
these challenges set SynchroTrap apart from previous work in this
area, i.e., CopyCatch and Clickstream [42]. First, unlike Copy-
Catch, we aim to detect loosely synchronized behavior for a broad
range of social network applications. Therefore, we cannot make
the assumption that a user can perform a malicious action only
once, i.e., a user can like a specific page only once. This differ-
ence in goals has greatly increased the algorithmic complexity of
SynchroTrap (§ 4 and § 9).
Second, detecting the actions from malicious accounts is a chal-
lenging anomaly detection problem. Malicious actions constitute
only a small fraction of the total user actions. For instance, Face-
book has more than 600 million daily active users [8] and they per-

form billions of actions everyday [34]. In contrast, the number of
malicious accounts involved in an attack campaign is often on the
order of thousands. How can we accurately detect such a weak sig-
nal from a large amount of noisy data? Third, we aim to deploy
our system on real-world online social networks such as Facebook.
Therefore, our detection algorithm must be able to process a few
terabytes of data on a daily basis, while many of the off-the-shelf
anomaly detection algorithms [26] or previous work, such as Click-
stream, do not scale to data of this size.
We have developed several simple but pragmatic techniques to
address the above design challenges. First, we model the malicious
account detection problem as a clustering problem (§ 3.1). We
compare pairwise user actions over a certain time period and group
those users who take similar actions at roughly the same time into
clusters, and mark a cluster whose size exceeds a tunable thresh-
old as malicious. This is because we observe from a real social
network that legitimate social network users take diverse actions
over time (§ 2). Second, to make the clustering algorithm compu-
tationally tractable, we further use an attacker’s network resource
constraint, e.g., the number of IP addresses under his control, or the
attacker’s target, e.g., a fraudulent Instagram account, to reduce the
pairwise comparison to be per IP address and/or per targeted object,
depending on the specific application context. Finally, we partition
user action data into small daily or hourly chunks. We design al-
gorithms to aggregate the comparison results between those small
chunks to detect malicious actions over a longer period such as a
week (§ 4.5). This technique enables us to implement SynchroTrap
in an incremental-processing fashion, making it practically deploy-
able at large online social networks.
We have deployed SynchroTrap at Facebook and Instagram for
over ten months (§ 7). In a detailed study of one-month data (§ 8.1),
we observe that it uncovered more than two million malicious ac-
counts and 1156 malicious campaigns. We have randomly sampled
a subset of malicious accounts SynchroTrap caught, and asked se-
curity specialists to inspect the accuracy of the results. The manual
inspection suggests that our system achieves a precision higher than
99%. During the course of its deployment, SynchroTrap on aver-
age catches ∼274K malicious accounts per week. We have also
evaluated the performance of SynchroTrap on a 200-machine clus-
ter at Facebook. The performance results show that our system is
able to process Facebook and Instagram’s user data. It takes a few
hours for SynchroTrap to process the daily data and ∼15 hours to
process a weekly aggregation job.
Admittedly, strategic attackers may attempt to spread the actions
of malicious accounts to evade SynchroTrap’s detection. We ana-
lyze SynchroTrap’s security guarantee and show that SynchroTrap
can effectively limit the rate of malicious actions an attacker per-
forms, even if the attacker controls an unlimited number of ma-
licious accounts (§ 6). In addition, we provide a set of parame-
ters that operators can tune to achieve a desirable trade-off between
false positives and false negatives. With a strict setting, Synchro-
Trap yields a near-zero false positive rate.
In summary, this work makes the following main contributions:
•We observe that malicious accounts tend to act together in a vari-
ety of social network context (§ 2).
•We have designed, implemented, and deployed SynchroTrap. Our
design addresses several practical challenges of using loosely syn-
chronized actions to uncover malicious social network accounts,
including how to detect such behavior in a variety of social net-
work applications, and among large and noisy data sets (§ 4).
• We present a preliminary analysis of the characteristics of the
detected malicious accounts. This analysis may provide insight for
other feature-based malicious account detection systems (§ 8).
0 24 48 72 96 120 144 1680
100
200
300
400
Time (hours)
Account ID
(a) Synchronized attack
0 24 48 72 96 120 144 1680
100
200
300
400
Time (hours)
Account ID
(b) Normal
Figure 1: An example of malicious photo uploads in Facebook.The x-axis shows the time when an account uploads a photo,and the y-axis is the account’s ID. A dot (x, y) in the figureshows that an account with ID y uploads a photo at time x.The color of a dot encodes the IP address of the action. Photouploads of the same color come from the same IP address.
2. MOTIVATING EXAMPLESIn this section, we examine two real-world attack examples that
motivate SynchroTrap’s design. Beutel et al. [16] observe that ma-
licious accounts post fake likes at around the same time. These two
additional examples show that: a) this attack pattern also appears in
other social network applications such as Instagram following, and
b) malicious accounts not only act together but often from a limited
set of IP addresses.
2.1 Malicious Facebook photo uploadsFigure 1 compares the photo-uploading activities of malicious
users to those of normal users at Facebook. Figure 1(a) plots the
photo uploads with timestamps from a group of 450 malicious ac-
counts over a week. Facebook caught those accounts because they
promoted diet pills by uploading spam photos. We can see that
those accounts use a few IP addresses to upload many spam pho-
tos. The horizontal color stripes indicate that they switch among a
small set of IP addresses during the one-week period.
Figure 1(b) shows the photo uploads of 450 randomly chosen
accounts which have never been flagged as malicious. We refer to
those users as normal users. As can be seen, the actions are much
more spread out in time and come from a much more diverse set of
IP addresses.
2.2 Inflating followers on InstagramMalicious users in Instagram follow target users to inflate the
number of their followers. Figure 2 compares user-following activ-
ities between 1,000 malicious users and 1,000 normal users. The
malicious accounts are sampled from an attack campaign involving
7K accounts.

We can see in Figure 2(a) that those malicious accounts are coor-
dinated to follow a target set of users in batches. The entire group
of accounts show a salient on-off action pattern. During the active
periods, they follow the same set of users at around the same time.
In contrast, normal users exhibit diverse user-following behavior.
As shown in Figure 2(b), little perceivable correlation can be found
among the user-following sequences of normal users.
0 24 48 72 96 120 144 1680
200
400
600
800
1000
Time (hours)
Account ID
(a) Synchronized attack
0 24 48 72 96 120 144 1680
200
400
600
800
1000
Time (hours)
Account ID
(b) Normal
Figure 2: An example in Instagram user following. The x-axisis the timestamp of an account’s following action and the y-axis is an account’s ID. A dot (x, y) shows that an account yfollows a targeted account at time x. The color of a dot encodesthe followed account’s ID. Actions of the same color follow thesame account.
2.3 Economic constraints of attackersIn this subsection, we speculate why various social network at-
tacks tend to happen in loose synchrony. We believe that this is
partly due to the economic constraints on the attacker side.
Cost on computing and operating resources. Attackers have
limited physical computing resources. Although they can purchase
or compromise machines (e.g., botnets), or even rent from cloud
computing services, such resources incur financial cost. Further-
more, those computing resources have limited operating time. This
is because an infected machine may go offline, recover, or even be
quarantined at any time [32, 48], and that a machine rental is usu-
ally charged based on the consumed computing utility [4]. Another
operating cost is the human labor to fabricate fake or compromise
real accounts, and to maintain and manage the accounts. Under
these operating constraints, an attacker often controls his malicious
accounts from a set of machines within a limited time.
Revenue frommissions with strict requirements. OSN attackers
are often deeply rooted in the underground markets, e.g., BlackHat-
World and Freelancer [33,36,37]. Most of their missions are driven
by customer demands with specific requirements. Usually the ob-
jective of a campaign is to achieve prevalence in OSNs. There-
fore, the mission requirements often include the level of prevalence
that a customer pursues and a strict deadline by which the mission
must be accomplished. For example, many social-networking tasks
in Freelancer solicit X Facebook friends/likes within Y days [33].
Similar tasks target other social network missions, such as follow-
ings, posts, reviews, etc. These underground tasks with strict time
requirements force attackers to target certain aspects of a victim’s
service and to act in advance of the mission deadlines.
We call the constraints of limited computing and operating re-
sources as resource constraints, and the constraints of strict re-
quirements on an attacker’s missions as mission constraints. Our
understanding of these economic constraints and their subsequent
manifestation on the activities of controlled accounts helps us di-
rectly attack the weak spot of attackers, making it hard for them to
evade detection.
3. SYSTEM OVERVIEW
3.1 High-level system architectureSynchroTrap is a generic and scalable framework that can ef-
fectively throttle large groups of malicious accounts in OSNs. The
main idea of SynchroTrap is to use clustering analysis [26] to detect
the loosely synchronized actions from malicious accounts at scale.
In particular, it measures pairwise user behavior similarity and then
uses a hierarchical clustering algorithm [26] to group users with
similar behavior over an extended period of time together.
3.2 ChallengesWe face a number of challenges in making SynchroTrap a prac-
tical solution for large-scale OSNs.
Scalability: A main challenge originates from the enormous scale
of today’s OSNs. First, the large volume of user activity data leads
to a low signal-to-noise ratio, making it hard to achieve high detec-
tion accuracy. For example, Facebook has more than 600 million
daily active users [8], while the number of malicious accounts in-
volved in an attack campaign is often on the order of thousands.
As a result, approaches (e.g., clickstream analysis [42]) that use
holistic comparison of all user activities may yield low accuracy.
In response to this challenge, we partition user actions by OSN ap-
plications and detect on a per-application basis (§ 4.1). We further
partition user actions by their associated target or source objects,
such as IP addresses, followee IDs, and page IDs, to capture the
constraints of an attacker (§ 4.2).
Second, the sheer volume of activity data prohibits a practical
implementation that can cope with generic actions. Large and com-
plex batch computations at Facebook-scale services are prohibitive
due to their requirements on hardware capacity (e.g., memory).
Such computations make resource sharing difficult and failure re-
covery costly. To handle massive user activities at Facebook-scale
OSNs, we apply divide-and-conquer. We slice the computation of
user comparison into smaller jobs along the time dimension and use
parallelism to scale (§ 4.5). We then aggregate the results of multi-
ple smaller computations to obtain period-long user similarity.
Accuracy: The diversity of normal user behavior and the stealthi-
ness of malicious activity hinder high accurate detection. Anomaly
detection schemes inevitably incur false positives and negatives. As
a result, the goal of an automated detection system is often to re-
duce both the false positive and negative rates. In order to achieve
high accuracy, we design SynchroTrap based on our understanding
of an attacker’s economic constraints. Moreover, as the false posi-
tive and false negative rates are usually inversely related, Synchro-
Trap provides a set of tunable parameters in its design and enables
operators to tune these parameters (§ 4.6) for a desired trade-off.
Adaptability to new applications: Attack campaigns can target
distinct OSN applications. Because the properties of a user’s ac-
tions, such as the association between the user and other OSN ob-
jects, can vary in different applications, a detection scheme opti-
mized for one application may not be applicable to others. There-
fore, it is challenging to develop a generic solution that can adapt
to new applications. For example, CopyCatch [16] detects fraudu-
lent page likes (once-only actions), but cannot be used to uncover
repeated spam-photo uploads from the same IP addresses. Unlike
CopyCatch, in our design we decouple the similarity metrics (§ 4.3)
from the clustering algorithm (§ 4.4), which enables us to handle
both once-only and other generic actions. Furthermore, we rep-
resent an action with a tuple abstraction (§ 4.2), including a times-
tamp dimension and an attacker constraint dimension. This abstrac-
tion makes the system design independent of the OSN applications
that SynchroTrap protects.
4. SYSTEM DESIGNIn this section, we describe the design of our system in detail. We
categorize user actions according to OSN applications (§ 4.1) and
perform detection on a per-application basis. We define a generic
matching metric for time-stamped user actions (§ 4.2) and quan-
tify the similarity of a user pair using the fraction of their matched
actions (§ 4.3). We use a single-linkage hierarchical clustering al-
gorithm to group users based on the pairwise user similarity (§ 4.4).
In § 4.5, we parallelize the computation of user-pair comparison to
address the large-data challenge.
4.1 Partitioning activity data by applicationsOSNs usually provide many features and functions in the form
of OSN applications, such as photo uploading, page like, messag-
ing, etc. Malicious accounts are not necessarily coordinated across
all types of actions allowed by the platforms. To reduce operational
cost, an attacker can focus his missions and target only partial di-
mensions of the user action space, e.g., uploading spam photos,
promoting rogue apps, etc. As a result, a scheme using holistic
comparison of user activities may miss malicious users that target
only particular OSN functions. This problem is reminiscent of the
“curse of dimensionality” in clustering high-dimensional data [29].
Tomitigate the impact of irrelevant actions, we categorize a user’s
actions into subsets according to the applications they belong to,
which we call application contexts. We then detect malicious ac-
counts within each application context. For example, we separate
the photo upload and page like applications to suppress spam pho-
tos and fraudulent page likes, respectively. Next, we describe how
we cluster user actions for an OSN application.
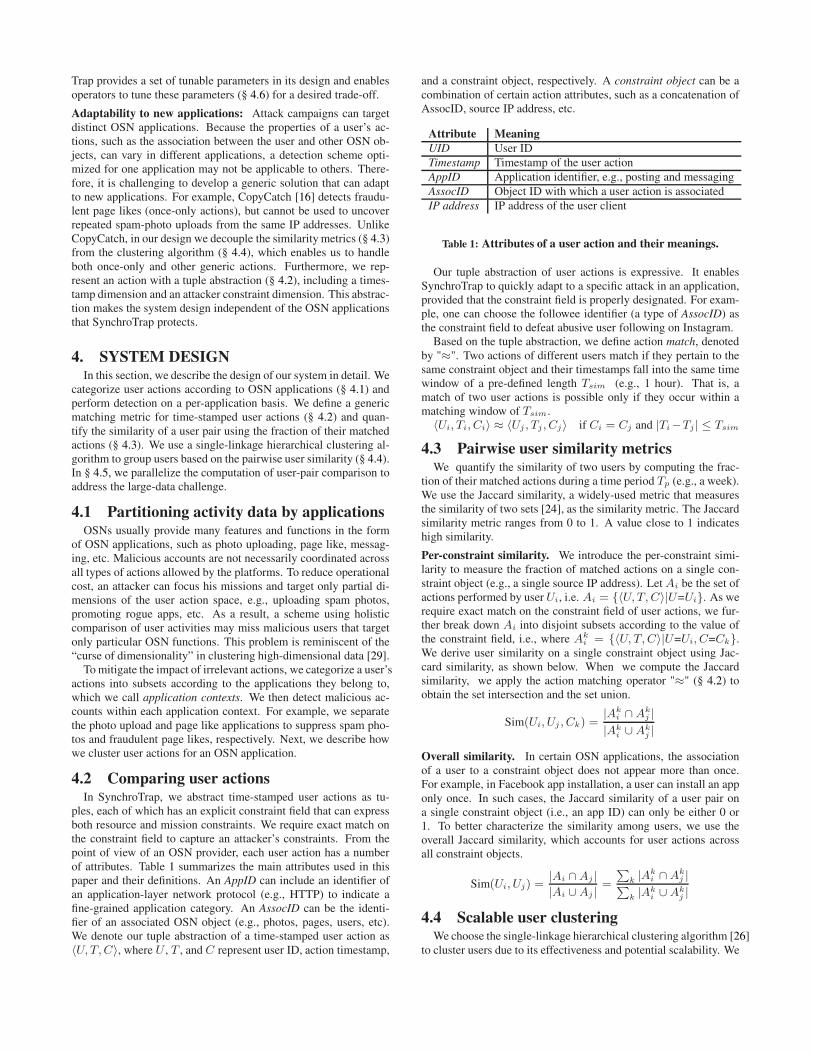
4.2 Comparing user actionsIn SynchroTrap, we abstract time-stamped user actions as tu-
ples, each of which has an explicit constraint field that can express
both resource and mission constraints. We require exact match on
the constraint field to capture an attacker’s constraints. From the
point of view of an OSN provider, each user action has a number
of attributes. Table 1 summarizes the main attributes used in this
paper and their definitions. An AppID can include an identifier of
an application-layer network protocol (e.g., HTTP) to indicate a
fine-grained application category. An AssocID can be the identi-
fier of an associated OSN object (e.g., photos, pages, users, etc).
We denote our tuple abstraction of a time-stamped user action as
〈U, T,C〉, where U , T , and C represent user ID, action timestamp,
and a constraint object, respectively. A constraint object can be a
combination of certain action attributes, such as a concatenation of
AssocID, source IP address, etc.
Attribute Meaning
UID User ID
Timestamp Timestamp of the user action
AppID Application identifier, e.g., posting and messaging
AssocID Object ID with which a user action is associated
IP address IP address of the user client
Table 1: Attributes of a user action and their meanings.
Our tuple abstraction of user actions is expressive. It enables
SynchroTrap to quickly adapt to a specific attack in an application,
provided that the constraint field is properly designated. For exam-
ple, one can choose the followee identifier (a type of AssocID) as
the constraint field to defeat abusive user following on Instagram.
Based on the tuple abstraction, we define action match, denoted
by "≈". Two actions of different users match if they pertain to the
same constraint object and their timestamps fall into the same time
window of a pre-defined length Tsim (e.g., 1 hour). That is, a
match of two user actions is possible only if they occur within a
matching window of Tsim.
〈Ui, Ti, Ci〉 ≈ 〈Uj , Tj , Cj〉 if Ci = Cj and |Ti−Tj | ≤ Tsim
4.3 Pairwise user similarity metricsWe quantify the similarity of two users by computing the frac-
tion of their matched actions during a time period Tp (e.g., a week).
We use the Jaccard similarity, a widely-used metric that measures
the similarity of two sets [24], as the similarity metric. The Jaccard
similarity metric ranges from 0 to 1. A value close to 1 indicates
high similarity.
Per-constraint similarity. We introduce the per-constraint simi-
larity to measure the fraction of matched actions on a single con-
straint object (e.g., a single source IP address). LetAi be the set of
actions performed by userUi, i.e. Ai = {〈U, T, C〉|U=Ui}. As werequire exact match on the constraint field of user actions, we fur-
ther break down Ai into disjoint subsets according to the value of
the constraint field, i.e., where Aki = {〈U, T,C〉|U=Ui, C=Ck}.
We derive user similarity on a single constraint object using Jac-
card similarity, as shown below. When we compute the Jaccard
similarity, we apply the action matching operator "≈" (§ 4.2) to
obtain the set intersection and the set union.
Sim(Ui, Uj , Ck) =|Ak
i ∩ Akj |
|Aki ∪ Ak
j |
Overall similarity. In certain OSN applications, the association
of a user to a constraint object does not appear more than once.
For example, in Facebook app installation, a user can install an app
only once. In such cases, the Jaccard similarity of a user pair on
a single constraint object (i.e., an app ID) can only be either 0 or
1. To better characterize the similarity among users, we use the
overall Jaccard similarity, which accounts for user actions across
all constraint objects.
Sim(Ui, Uj) =|Ai ∩Aj |
|Ai ∪Aj |=
∑
k |Aki ∩Ak
j |∑
k |Aki ∪Ak
j |
4.4 Scalable user clusteringWe choose the single-linkage hierarchical clustering algorithm [26]
to cluster users due to its effectiveness and potential scalability. We

Edge similarity threshold
1 2
Figure 3: Transforming the single-linkage hierarchical cluster-ing algorithm to the algorithm of connected components in twosteps. Edges represent similarity between users. A user pairconnected by a thicker edge has a higher similarity.
do not use other off-the-shelf clustering schemes because they ei-
ther rely on a special distance metric (e.g., Euclidean distance in
k-means), or are not scalable. We refer readers to [26] for a com-
plete review of the clustering techniques. In addition, we do not
seek to use graph partitioning algorithms for clustering users, be-
cause even widely-used graph partitioning tools like METIS [28]
take many hours to process a graph with only multiple millions
of nodes [40]. Instead, our objective is to transform our detection
scheme to a clustering algorithm that can scale up to large OSNs.
Single-linkage hierarchical clustering. The single-linkage hier-
archical clustering algorithm uses an agglomerative approach that
begins with each user as a different cluster, and iteratively merges
clusters with high similarity and produces larger clusters. This al-
gorithm generates a cluster-merging dendrogram that shows the
merging hierarchy of clusters and the degree of similarity on each
level. By breaking the dendrogram at a desired level, one obtains
a set of clusters in which intra-cluster user similarity exceeds a
certain threshold. A detailed description of the algorithm is doc-
umented in [26]. Because this algorithm relies on a sequential pro-
cess to construct the entire dendrogram in a bottom-up fashion, a
straightforward implementation is difficult to scale.
Making the algorithm suitable for parallel implementation. The
key property of single-linkage hierarchical clustering is that the
similarity of two clusters is determined by the maximum similar-
ity among all pairs of users drawn from each different cluster. The
cluster-similarity metric merges a group of close clusters in each
iteration into a larger connected component in a user similarity
graph, where nodes are users and an undirected edge exists be-
tween a pair of users if their similarity is above a certain threshold.
Using this property we adapt the single-linkage hierarchical clus-
tering algorithm to a parallel version. Our idea is that if we set the
similarity threshold first and filter out user pairs below that, the
desired user clusters are exactly the connected components in the
pruned user similarity graph. Therefore, we can employ an efficient
graph algorithm [27] to search for connected components. Figure 3
illustrates our two-step adaptation of the single-linkage clustering
algorithm. We choose to adapt to the connected components al-
gorithm because it is highly scalable on massive graphs due to its
inherent parallelism [27].
User-pair filtering function. We use a filtering function to select
user pairs with action similarity above a certain degree. We intro-
duce two criteria to choose a user pair according to their similarity
at different granularities (§ 4.3).
• F1: There exists at least one constraint object, for which users
have a per-constraint similarity above a certain threshold.
• F2: Their overall similarity is above a certain threshold.
The first filtering criterion uncovers malicious user pairs that
manifest loosely synchronized behavior on a set of single constraint
User activities Daily usercomparison
Aggregation& Clustering
t
t+1
t+2
t+3
t+4
t+5
Figure 4: SynchroTrap’s processing pipeline at Facebook. Anew aggregation job (dashed) does not incur re-execution ofdaily jobs. Arrows indicate the data flow.
objects (e.g., IP addresses). In some cases, malicious accounts may
even spread their actions over a number of constraint objects. We
use criterion F2 to compare user similarity for applications where a
user can carry out a certain action only once per constraint object.
4.5 Parallelizing user-pair comparisonTo process continuous user-activity data stream at scale, we use
incremental processing. In particular, we divide the large compu-
tation of user-pair comparison on a bulk data set into a series of
smaller ones in the time dimension. We store the intermediate re-
sults and aggregate them over a certain time period. This process-
ing pipeline greatly reduces the size of a single job and thus its
hardware consumption, making SynchroTrap a more scalable and
manageable solution in practice.
4.5.1 Daily comparison
Figure 4 shows the data flow of SynchroTrap’s processing pipeline
at Facebook. We slice the computation of user comparison and des-
ignate daily jobs to generate similar user pairs based on the user-
activity log. Because SynchroTrap detects consistently loosely syn-
chronized activities over a sustained period of time, we aggregate
daily similarity metrics and perform user clustering periodically
(e.g., weekly). As shown in Figure 4, because aggregation jobs
can reuse the results of daily jobs, a new aggregation job does not
incur re-execution of daily jobs.
We design an aggregatable data interface between daily jobs and
aggregation jobs by decomposing the period-long user similarity
(§ 4.3) over days, as shown below. Let Aki,t denote the set of ac-
tions on constraint object Ck that user Ui performs on day t, i.e.
Aki,t = {〈U, T, C〉|U=Ui, C=Ck, T is within day t}. For a user
pair (Ui, Uj) and a constraint object Ck, we generate and store the
number of their daily action matches, |Aki,t∩Ak
j,t|, and the number
of daily total actions that each of them has carried out, i.e., |Aki,t|
and |Akj,t|.
Sim(Ui, Uj , Ck) =|Ak
i ∩Akj |
|Aki ∪Ak
j |=
|Aki ∩Ak
j |
|Aki |+ |Ak
j | − |Aki ∩Ak
j |
=
∑
t |Aki,t ∩Ak
j,t|∑
t |Aki,t|+
∑
t |Akj,t| −
∑
t |Aki,t ∩Ak
j,t|
By aggregating the daily results, we derive user similarity over a
course of time. The last equality holds because user-action matches
across days are rare, as the size of a matching window we choose
is on the order of minutes or a few hours.

100
101
102
103
104
105
106
10−8
100
10−2
10−4
10−6
Active user population
Fra
ctio
n o
f IP
ad
dre
sse
s
Figure 5: Distribution of user population over IP addresses atFacebook login. We depict the fraction of IP addresses withrespect to the number of active users per IP address.
4.5.2 Hourly comparison with sliding windows
Stragglers in daily jobs. A straightforward MapReduce imple-
mentation of the daily user comparison yields jobs whose comple-
tion time could be prolonged by straggler reducers. This strag-
gler issue is caused by the highly skewed distribution of user ac-
tions over constraint objects. Even on a daily basis, there exist hot
objects that are associated with an extremely large number of ac-
tions/users. Figure 5 shows the distribution of the number of login
users over IP addresses on one day at Facebook. As we can see,
while most of IP addresses are not used by many users (less than
100), the user population distribution per IP is heavy-tailed. These
few popular IP addresses used by more than 100K daily active
users can lead to straggler reducers that might run for days.
Mitigation with overlapping sliding windows. We mitigate this
issue by further partitioning users with their actions on large con-
straint objects. If the number of users in a partition is reduced by a
factor of 1
f(f > 1), the execution time can be reduced by 1
f2 , as we
perform a quadratic number of user-user similarity computations.
The challenge is to effectively partition the user activity data, while
retaining the capability of accurately capturing action matches. Our
insight is to divide the user actions into overlapping sliding win-
dows in the time dimension and to process different sliding win-
dows in parallel. This method not only mitigates the straggler issue
by feeding each individual worker smaller chunks of data, but also
effectively filters out unmatched actions that reside in different slid-
ing windows before the pairwise comparison.
Figure 6 illustrates how we partition by overlapping sliding win-
dows to precisely capture all possible user-action matches with a
matching window set to Tsim. In principle, a sliding window size
>Tsim and an overlapping period ≥ Tsim can guarantee the full
coverage of user-action matches. This is because a sliding window
size >Tsim ensures that any user-action match with a maximum
spanning period Tsim can be covered by a sliding window; an over-
lapping period ≥ Tsim ensures that the sliding windows are dense
enough to cover the all user-action matches across windows.
Sliding window setup. Counting in each overlapping sliding win-
dow entails duplicates of user-action matches that appear in the
overlapping area. The de-duplication of action matches could be
complicated if the sliding window size and the overlapping period
are not properly set. To strike an appropriate balance between the
effectiveness of cutting the data volume within each sliding window
and the complexity of de-duplicating action matches, we choose to
use a sliding window size of 2Tsim and an overlapping period of
length Tsim (Figure 6). With such a setting, we achieve single
counting by simply discarding the user action matches within the
second (or the first) half of each sliding window.
Time Tsim
U1
U2
SWi
SWi+1
2Tsim
Figure 6: Settings of the overlapping sliding windows inSynchroTrap. Action matches within the overlapping area(shaded) are exactly double counted. We depict actions fromdifferent users using different markers.
We now discuss our parallel counting scheme’s guarantee that
one can exactly single count all user-action matches by indepen-
dently counting in each sliding window only. Suppose we have a
sequence of sliding windows SWi = [iTsim, (i+2)Tsim) (i ≥ 0).Without loss of generality, let t1 and t2 be the timestamps of two
matched user actions, where t2 ∈ [t1, t1 + Tsim]. Suppose t1 ∈[jTsim, (j + 1)Tsim) (j ≥ 0). We have t2 < (j + 2)Tsim. Two
cases exist regarding the location of the action pair: a) t2 < (j +1)Tsim. Both t1 and t2 belong to the interval [jTsim, (j+1)Tsim),which is the overlapping area of two consecutive sliding windows
SWj−1 and SWj . Because we discard action matches within each
second-half window, the action pair is only single counted in SWj ;
b) t2 ∈ [(j+1)Tsim, (j+2)Tsim). Only SWj covers both t1 and
t2, because t1 ∈ [jTsim, (j + 1)Tsim). Hence the action pair is
single counted in SWj . We always append an empty half window
after the last sliding window in order to cope with the extreme case
at the end of the data stream.
4.6 Improving accuracyIt is challenging for a detection system, such as SynchroTrap,
to achieve desired accuracy for several reasons. First, the volumes
and synchronization levels of malicious actions vary in different
OSN applications. In extreme cases, attackers may change their
strategies over time to evade an existing detection scheme. Sec-
ond, as a system that influences user experience on an OSN, Syn-
chroTrap must use conservative parameters to minimize the false
positive rate, i.e., not flagging any legitimate user as malicious.
SynchroTrap allows OSN operators to tune a set of parameters
to achieve the desired trade-off between false positives and false
negatives. The main parameters include the action-matching win-
dow size Tsim and the filtering thresholds for per-constraint sim-
ilarity (Simpc) and overall similarity (Simoverall). The settings of
these parameters have monotonic effects on false rates: a larger
action-matching window enables SynchroTrap to find a larger set
of matched actions for two users, and hence increases their similar-
ity on a constraint object; on the other hand, a larger user similarity
threshold decreases the number of user pairs considered similar and
reduces the likelihood that two users are clustered together. These
monotonic effects simplify the process of setting parameters and
reduce the need for human intervention. The operators of our sys-
tem can choose to tune parameter values up or down according to
the false positive rate with the current settings. At Facebook we
set parameters equal to the values that meet the internal production
requirements. We do not reveal the specific parameter settings due
to confidentiality agreements.

4.7 Computational costIn theory, SynchroTrap’s computational cost is O(rn2), where
n is the number of daily active users per application and r is the
number of daily actions per user. In practice, we can significantly
reduce this computational cost because we only need to compare
user actions pertaining to the same target object or coming from
the same source object. Therefore, in our implementation, the daily
computational cost is the O(rm2), wherem is the number of daily
active users per application per target or source object (i.e., per
campaign target or per IP address). The cost for weekly aggregation
is linear to the number of user pairs generated by daily jobs. The
cost for searching connected components in a user similarity graph
is O(n). Thus the overall computational cost is O(rm2 + n).
5. IMPLEMENTATIONWe built SynchroTrap on top of the Hadoop MapReduce stack [38]
at Facebook. We implemented the daily user comparison module
and the weekly aggregation module on Hadoop [6], and the cluster-
ing module on Giraph [5], a large-graph processing platform based
on the Bulk Synchronous Parallel (BSP) model [30]. Giraph pro-
vides a parallel implementation of the connected components algo-
rithm. Apart from the basic functions supported by Facebook’s in-
frastructure, our implementation of SynchroTrap consists of 2,500
lines of Java code and 1,500 lines of Python code.
6. SECURITY ANALYSISIn this section we provide a security analysis of our approach
under various adversarial strategies.
Spread-spectrum attacks. Attackers could attempt to hide the
synchronization signal that SynchroTrap detects, which we call the
spread-spectrum attacks. Given a target amount of abusive actions,
attackers can statistically spread actions over either a longer time
period or more constraint objects (e.g., IP addresses and campaign
targets). Due to the increased resource cost and the reduced cam-
paign revenue, such attacks are less profitable. We now show that
SynchroTrap limits the damage of attack campaigns, even if at-
tackers control an unlimited number of accounts. We provide an
upper-bound analysis on the total number of actions that attackers
can perform on a constraint object during a certain period of time.
Suppose our detection window Tp (e.g., one week) contains w
action-matching windows of length Tm (e.g., 1 hour). Because
per-account rate-limiting is widely used in OSNs such as Face-
book [13, 14], we assume that an account can perform at most L
actions within each action-matching window. Although the number
of each account’s actions is bounded by wL, without SynchroTrap
the total malicious actions remain unlimited if attackers can control
an extremely large number of malicious accounts.
In contrast, SynchroTrap limits the total number of abusive ac-
tions on a constraint object (e.g., an IP address), irrespective of the
number of malicious accounts an attacker controls. The intuition is
that under SynchroTrap an attacker has to spread out the actions of
his accounts over matching windows so that a pair of accounts do
not have many matched actions. Therefore, given w matching win-
dows, the number of malicious accounts that can simultaneously
act on a constraint object is bounded.
Specifically, SynchroTrap uses the Jaccard similarity to evaluate
the action sets of two users. In order to evade the detection, the
fraction of matched actions of malicious accounts Ui and Uj must
be below a certain threshold p (0 < p < 1): |Ai ∩Aj | ≤ p× |Ai|and |Ai∩Aj | ≤ p×|Aj |. An optimal attack strategy is to schedule
a group of accounts according to the set of such action sets {Ai}that has the maximum cardinality so as to minimize the chances
two malicious accounts are caught in the same cluster. Finding
{Ai} with the maximum cardinality is still an open problem in in-
tersection set theory [18], which poses a challenge to attackers.
We give an upper bound on the cardinality of such a set {Ai}by computing the maximum size of its superset. We find such a
superset {Bi} in whichBi ⊆ Bj only ifBi = Bj . That is, in {Bi}none of the sets is contained in another. Because set {Bi} does notrequire a threshold on |Bi ∩ Bj |, it relaxes the conditions of set
{Ai} and hence {Ai} ⊂ {Bi}. Set {Bi} approximates set {Ai}if the matched fraction threshold p is set close to 1. In set theory,
{Bi} is called an antichain of sets in which none of the sets is a
subset of another. According to the Sperner’s theorem [15], given
that the detection window contains w matching windows, the size
of the maximum antichain satisfies |{Bi}| ≤(
w⌊w/2⌋
)
. Therefore,
we have |{Ai}| <(
w⌊w/2⌋
)
, which specifies the upper bound of the
number of active malicious accounts per constraint object. Thus,
the total number of actions from this malicious account group is
further bounded by(
w⌊w/2⌋
)
wL, assuming all of the accounts are
kept active during the detection window Tp.
Aggressive attacks. Aggressive attacks could be launched by con-
trolling accounts to perform bulk actions within a short time period.
SynchroTrap may miss such attacks if the user action-set size or
the user-pair similarity does not meet the criteria of SynchroTrap’s
user-pair filtering function. However, such attacks have been the
focus of existing countermeasures [35], which look for the abrupt
changes in user activity. Our system works together with existing
anomaly detection schemes and complements them by targeting the
stealthier attacks.
7. DEPLOYMENTWe deployed SynchroTrap at Facebook and Instagram to un-
cover malicious accounts and integrated it into the site-protecting
stack at Facebook. In this section, we present five use cases (§ 7.1)
and describe how the findings of SynchroTrap can be used to better
monitor and protect OSN services (§ 7.2).
7.1 Use cases at Facebook and InstagramWe present SynchroTrap’s use cases according to the constraint
by which an attack campaign is bound. For each type of attacker-
side constraint, we present a couple of use cases at Facebook and
Instagram.
Resource-constrained synchronization. The resource constraint
we use is the source IP addresses from which the attacks origi-
nate. We deployed SynchroTrap with this configuration at Face-
book user login and photo upload. An OSN provider could also in-
clude certain security cookies [7,12] into SynchroTrap’s constraint
field, which enables the detection of resource-constrained attacks
at a finer granularity.
Mission-constrained synchronization. The mission constraints
we use are target object IDs, which include Facebook app ID, Face-
book page ID, and Instagram followee ID as the constraint field, re-
spectively. We deployed SynchroTrap at Facebook app installation
and page like, and at Instagram user following context. We used
the overall similarity in these cases.
7.2 Signatures and responseAs an unsupervised detection scheme, SynchroTrap automati-
cally discovers large groups of malicious accounts after its deploy-
ment. This malicious account corpus can be used as high-quality
training data to build accurate classifiers. We now describe how

we fingerprint attacks and take actions on detected accounts and
user-created content.
Attack signatures. SynchroTrap extracts the common constraint
objects on which groups of suspicious accounts act together. The
OSN entities pointed by those constraint objects can be abusive,
and thus can be used as attack signatures. They include rogue Face-
book apps, Facebook pages with inappropriate content, abusive In-
stagram accounts soliciting excessive followers, etc. By tracking
back to the complete user action log, SynchroTrap can even provide
the fingerprints of an attacker’s machines, including IP addresses,
user agents, browser cookies, etc. All of the above signatures can
be used to build fast classifiers to suppress future attacks in nearly
real time [35], and to decide on proper responses.
Response. The response to attacks in SynchroTrap is multifold:
large groups of detected accounts are challenged with CAPTCHAs;
actions performed in attack campaigns are invalidated in retrospect;
and user-created content, such as photos, is sent for automated san-
ity check (e.g., photoDNA [9]) or manual inspection.
8. EVALUATIONWe evaluate SynchroTrap using a one-month execution log at
Facebook in August 2013. We answer the following questions to
show that SynchroTrap provides a practical solution for large on-
line social networks:
• Can SynchroTrap accurately detect malicious accounts while
yielding low false positives?
• How effective is SynchroTrap in uncovering new attacks?
• Can SynchroTrap scale up to Facebook-size OSNs?
We obtain SynchroTrap’s detection accuracy by manually in-
specting sampled accounts and activities it uncovered. We then
study the new findings through cross-validation against existing
approaches that run at Facebook. We examine the social connec-
tivity of the identified accounts by using SybilRank [19], a scal-
able social-graph-based fake account detection system. We also
share the operation experience to shed light on how SynchroTrap
works in practice over time. Lastly, we demonstrate the scalability
of SynchroTrap using performance measurements obtained from a
200-machine cluster.
8.1 Validation of identified accountsWe first validate the malicious accounts with support from the
Facebook security team. We proceed with investigation of the con-
firmed accounts to understand how adversaries managed to take
control of them. Furthermore, we study the network-level charac-
teristics of the detected attacks, including the email domains and IP
addresses used by malicious accounts.
ApplicationPage Instagram App Photo
Loginlike follow install upload
Campaigns 201 531 74 29 321
Accounts 730K 589K 164K 120K 564K
Actions 357M 65M 4M 48M 29M
Precision 99.0% 99.7% 100% 100% 100%
Table 2: Identified accounts and precision. Precision is the portion of
identified accounts that are confirmed malicious. We derived precision
from manual inspection of randomly sampled accounts by the Face-
book security team.
Methodology. A main challenge to validate the detected accounts
and their actions is their large number. During the month of our
0
0.2
0.4
0.6
0.8
1
102
103
104
105
CD
F o
f ca
mp
aig
ns
Number of users in a campaign
Figure 7: CDF of campaigns with respect to the number of in-volved users. In a large campaign, an attacker manipulatesmultiple thousands of malicious accounts.
study, SynchroTrap uncovers millions of accounts. Manually re-
viewing all those accounts imposes prohibitive human workload.
Furthermore, cross validating the detected accounts with other ex-
isting Facebook countermeasures is not possible because a large
fraction of detected accounts are not caught by other methods (§ 8.2).
Therefore, our approach is to inspect representative samples of the
detected accounts with manual assistance from the security spe-
cialists. We randomly sample subsets of the detected accounts for
inspection and obtain the false rates.
Precision. Table 2 shows the numbers of suspicious accounts Syn-
chroTrap caught and attack campaigns uncovered by SynchroTrap,
and the precision in each application. In total, SynchroTrap de-
tected 1156 large campaigns that involve more than 2 million ma-
licious accounts, with a precision higher than 99%. Table 2 also
shows that the large attack campaigns are comprised of millions of
user actions. Among the five deployed applications, attackers were
more active in page like and user following, presumably because
campaigns in these applications are more lucrative. By uncovering
large campaigns, SynchroTrap allows Facebook and Instagram to
identify and properly invalidate millions of malicious user actions
in each application.
Post-processing to deal with false positives. False positives are
detrimental to OSN user experience. Besides adding human efforts
into the process of setting parameters (§ 4.6), we further reduce
false positives through post-processing. First, we discard small user
clusters and screen out only large clusters, which are more likely to
result from large attacks. Based on the experience with the system,
the Facebook security team sets a threshold of 200, above which
almost all users in each cluster are found malicious. Second, we
do not invalidate all actions that a malicious account has performed
during a detection window Tp, but conservatively focus on those
that match at least one action of each of the other accounts in the
same cluster. This post processing step helps rule out valid actions
that a user account may have delivered while being compromised.
Scale of campaigns. Figure 7 shows the CDF of the scale of the
attack campaigns after post-processing, in terms of the number of
involved malicious accounts. While 80% of the campaigns involve
fewer than 1,000 accounts, we also find a few very large campaigns,
in which attackers manipulate a few thousands of accounts.
How are the malicious accounts taken under control? Because
attackers have to use accounts to perform malicious activities in
OSNs, it is critical for them to own or hijack a large number of
accounts before launching their campaigns. To understand how
adversaries take control of accounts, the Facebook security team
classifies the reviewed accounts into categories based on how they
were involved in campaigns. The means by which attackers harness

0
0.2
0.4
0.6
0.8
1
Page like
Instagram follow
Application install
Photo upload
Login
Fra
ction o
f accounts
YahooHotmailGmail*.ruAOLOthers
Figure 8: Breakdown of top email domains associated to the ma-licious accounts in each application.
accounts include creating fake accounts with fraudulent user in-
formation [19, 44], compromising user accounts via malware [10],
stealing user credentials by social engineering [17, 25], etc. A
breakdown of the malicious accounts in app installation is shown
in Table 3. In this application, attackers manipulate malicious ac-
counts to promote rogue Facebook apps that can later be used to
send out spam, to steal user personal information, etc. Clearly,
fake accounts, social engineering, and malware are the dominant
malicious account sources, accounting for more than 90% of the
detected accounts.
Fake accounts Social Engineering Malware Others
28.6% 21.4% 42.9% 7.1%
Table 3: Classification of the malicious accounts detected atFacebook app install.
Network-level characteristics. We study the email domains and
IP addresses used by malicious users to shed light on the network-
level characteristics of attacks.
An OSN account usually associates to a contact email address.
Figure 8 shows the distribution of the email domains of the iden-
tified accounts in each application. As we can see, the email cre-
dentials used by the controlled accounts are mainly from five do-
mains, including those major email domains Yahoo, Hotmail, and
Gmail. Email domains with accounts that can be obtained from un-
derground markets (e.g., Yahoo, Hotmail, and AOL) are likely to be
used to provide fraudulent contact email addresses for controlled
accounts. Whereas Gmail accounts incur higher cost to attackers
according to an underground market survey [37], a fraction of the
identified accounts are found to use Gmail addresses. In addition,
a non-negligible fraction of the contact email addresses are from
the domain *.ru, which is dominated by mail.ru and yandex.ru. Be-
cause the identified accounts used a diverse set of email addresses,
this result suggests that the email domain alone is not a reliable
criterion to detect malicious accounts.
We further study the source IP addresses of the detected mali-
cious activities. We found that the two million detected accounts
have used ∼1.2 million IP addresses in total. Figure 9 shows the
distribution of the IPv4 addresses used by attackers in each appli-
cation. As can be seen, the threats are initiated from three major
regions of the IPv4 address space: 36.67.* – 44.99.*, 77.246.*–
125.226.*, and 170.226.* – 207.78.*. The distributions of IP ad-
dresses in different applications are close to each other, except that
attackers in app install use more intensively the IP addresses from
the region 77.246.*–125.226.*. We investigate a random sample
set of those IP addresses via queries to WHOIS servers, which pro-
vide the registration information of the domain names. Many IP ad-
0
0.2
0.4
0.6
0.8
1
IP address
CD
F o
f IP
ad
dre
ss
0.0.0.0
32.0.0.0
64.0.0.0
96.0.0.0
128.0.0.0
160.0.0.0
192.0.0.0
224.0.0.0
App install
Page like
Login
Instagram follow
Photo upload
Figure 9: Distribution of the IPv4 addresses used for identifiedattack campaigns in each application.
dresses are administrated by large regional ISPs around the world
(e.g., Global Village Telecom in Brazil and Saudi Telecom in Saudi
Arabia). Some of those IP addresses are used to provide shared In-
ternet access (e.g., for network proxies or public Internet access
points). We also observed that a non-trivial fraction of the IP ad-
dresses are from hosting services such as GoDaddy and Singlehop,
as well as from large cloud computing services such as Amazon
AWS. This observation indicates that cloud-based services open up
another avenue for threats to break into the Internet, which is in
contrast to traditional botnet-based attacks [43].
ApplicationOverlap with New findings
existing approaches by SynchroTrap
Page like 175K 555K
Instagram follow 66K 523K
App install N/A 164K
Photo upload N/A 120K
Login 12K 552K
Total 253K 1,914K
Table 4: New findings of SynchroTrap. It uncovers a significantfraction of malicious accounts that were undetected previously.SynchroTrap is the first dedicated countermeasure in app in-stall and photo upload at Facebook. So there is no data avail-able from previous work to compare with.
8.2 New findings on malicious accountsTo evaluate SynchroTrap’s capability to find malicious activities
that were previously undetectable, we compare the malicious ac-
counts detected by SynchroTrap against those detected by existing
approaches inside Facebook. At Facebook, a large set of exist-
ing approaches cope with aggressive attacks by monitoring abrupt
changes in certain types of user activities [35]. In each deployed ap-
plication, the accounts detected by SynchroTrap in August 2013 are
compared to those detected by other approaches during the same
period. Table 4 shows the overlap of the malicious accounts that
SynchroTrap and other approaches identified, as well as Synchro-
Trap’s new findings. As we can see, SynchroTrap identified a large
number of previously unknown malicious accounts. Specifically,
in each application at least 70% of the identified accounts were
not discovered by existing approaches. We investigated the exact
number of accounts detected by each existing approach. We can-
not report them due to confidentiality, but SynchroTrap detects a
fairly large portion of those accounts. We believe that full-fledged
deployment of SynchroTrap in each application on more OSN ob-

0 0.2 0.4 0.6 0.8 10
0.2
0.4
0.6
0.8
1
Ranking percentile
CD
F o
f accounts
App install
Page like
Login
Photo upload
Figure 10: CDF of the detected accounts with respect to theranking percentile generated by SybilRank. The percentilesare calculated from the bottom of the ranked list.
jects (e.g., certain fields of browser cookies) could yield more new
findings and achieve higher recall of malicious accounts.
In particular, the large number of previously undiscovered mali-
cious accounts indicates that the loosely synchronized attacks have
been underestimated in existing countermeasures. SynchroTrap
complements existing OSN countermeasures by effectively uncov-
ering such attacks.
8.3 Social connectivity of malicious accountsSocial-graph-based defense mechanisms have attracted much at-
tention from the research community [19,39,41,45,46]. We exam-
ine the social connectivity of the identified accounts by comparing
them against the ranked list generated by SybilRank [19]. Sybil-
Rank discerns bulk accounts created at a low per-account cost. It
ranks users based on connectivity in the social graph. Suspicious
users with limited connections to legitimate users are ranked low.
We run SybilRank on a snapshot of the Facebook friendship
graph obtained in August 2013. This social graph contains all Face-
book users that have been perceived as benign by existing counter-
measures [35] until this study. We do not include the users already
stopped by existing countermeasures before the graph snapshot.
Figure 10 shows the CDF of the ranking percentile of the mali-
cious accounts that SynchroTrap detects in each Facebook applica-
tion. As can be seen, a certain fraction of malicious users (∼40%
in login and ∼15% in each of other applications) are ranked at the
bottom. That portion of users are comprised of fake accounts that
have little engagement on the social graph. Whereas SybilRank
gives low rankings to a large portion of the identified malicious
users (e.g., 80% of the detected users in app install are among the
lowest 25% rankings), a non-negligible fraction of the users appear
in the middle or even the top intervals of the ranked list. This in-
dicates that attackers manipulate accounts with a variety degree of
social connectivity to legitimate users. For example, a part of the
accounts caught in photo upload are ranked high, presumably be-
cause attackers tend to use well-connected accounts to spread spam
photos to many of their friends. As described in § 8.1, these well-
connected accounts can be obtained via malware, social engineer-
ing, etc. The potential influence on the social graph and the high
cost to get such accounts make them more valuable to attackers.
8.4 Operation experienceWe perform a longitudinal study on the number of users caught
by SynchroTrap for the first 11 weeks after SynchroTrap’s deploy-
ment (Figure 11). From the beginning, the variation is small in
Facebook login, app install, and photo upload. In contrast, the
number of detected users decreases after the first month in Face-
book page like and Instagram user following. It then stabilizes at
around 100K per week. We suspect that this drop may be caused
0 2 4 6 8 10 120
100
200
300
400
Time (week)
Dete
cte
d u
sers
(K
)
Page like
Instagram follow
Login
App install
Photo upload
Figure 11: Number of users detected by SynchroTrap per weekover a course of 11 weeks.
2 4 6 8 10 120
0.05
0.1
0.15
Times of being caught by SynchroTrap
Fra
ction o
f users
Page likeApp installLoginPhoto uploadInstagram follow
Figure 12: Distribution of the users repeatedly caught by Syn-chroTrap. We depict the fraction of detected users with respectto the number of times they have been repeatedly caught.
by SynchroTrap’s deployment. Either the attackers are not able to
obtain new controlled accounts to launch attacks or they stop the
attacks temporarily to prevent their controlled accounts from being
caught. The stabilized number of detected accounts in each ap-
plication suggests that SynchroTrap continued to effectively detect
malicious accounts over time.
Although most of the detected accounts were being caught for
the first time by SynchroTrap, we observed that a non-negligible
fraction of them were repeatedly caught. Figure 12 shows the frac-
tion of these users (who were caught at least twice). As we can see,
in each application 5%∼15% of the detected users are caught twice
by SynchroTrap; the fraction of users caught more than five times
is less than 1%. Some accounts are caught repeatedly because they
are able to clear the challenges sent to them. When a malicious
account is detected, Facebook’s security system sends challenges
such as CAPTCHAs or SMS to it. Either the attackers or the own-
ers of the compromised accounts could have cleared the challenges
so that the accounts were used to launch new attacks.
8.5 System performanceWe evaluate the performance of SynchroTrap on a 200-machine
cluster at Facebook. The daily activity data in each application is
on the order of terabytes. We measure the execution time of each
stage of SynchroTrap’s pipeline under different parameter settings.
Daily jobs. In a daily job, the action-matching window Tsim de-
termines the size of the sliding comparison windows (§ 4.5.2). To
examine its impact, we vary the value of Tsim from 10 minutes to 5
hours. Figure 13 shows that the execution time of daily jobs grows
as we set Tsim to higher values. This is because a higher compar-
ison window Tsim causes more user pairs to be compared. As we
partition data using overlapping sliding windows, each daily job in
an application finishes within a few hours.
Aggregation jobs. Figure 14 shows the execution time of aggre-
gation jobs in each application with Tsim set to different values.

0
2
4
6
8
10
Photo upload
Instagram follow
Application install
Page like
Login
Execution tim
e (
hours
)Tsim=10 minsTsim=1 hourTsim=5 hours
Figure 13: The execution time of SynchroTrap’s daily jobs ineach deployed application. We set Tsim to 10 mins, 1 hour, and5 hours. Error bars represent 95% confident intervals.
0 2 4 6 8
10 12 14 16
Photo upload
Instagram follow
Application install
Page like
Login
Execution tim
e (
hours
)
Tsim=10 minsTsim=1 hourTsim=5 hours
Figure 14: The execution time of aggregation jobs in each appli-cation. The input data volume varies as we generate daily userpairs using different Tsim values (10 mins, 1 hour, and 5 hours).Error bars represent 95% confident intervals.
0
20
40
60
80
100
Photo upload
Instagram follow
Application install
Page like
Login
Execution tim
e (
min
s)
Thresh=0.8Thresh=0.6Thresh=0.4Thresh=0.2
Figure 15: Execution time of finding connected components ineach application. We set the similarity thresholds in our user-pair filtering function to 0.2, 0.4, 0.6, and 0.8. Error bars rep-resent 95% confident intervals.
As can be seen, an aggregation job takes longer time when we in-
crease Tsim in the daily jobs. This is because a daily job with a
larger Tsim value generates more user pairs with matched actions,
and hence increases the aggregation time. In all applications, each
set of aggregation jobs completes execution within∼15 hours.
Single-linkage hierarchical clustering onGiraph. SynchroTrap’s
user-pair filtering function (§ 4.4) allows distinct similarity thresh-
olds on different granularities. We use a one-week data set to ex-
amine the execution time of clustering under varying similarity
thresholds. For simplicity we assign the same value to all simi-
larity thresholds and set this value to 0.2, 0.4, 0.6, and 0.8, respec-
tively. Figure 15 shows that the execution time in each application
increases as we set the thresholds to lower values. This is because
a smaller threshold value leads to fewer user pairs to be filtered,
and hence makes the user similarity graph denser. A Synchro-
Trap’s clustering job finishes within ∼100 minutes as Giraph [11]
is highly efficient.
9. RELATED WORKIn this section, we briefly describe previous OSN defense pro-
posals and compare them with this work. We classify prior work
into three broad categories: social-graph-based approaches, feature-
based account classification, and aggregate behavior clustering. This
work belongs to the category of aggregate behavior clustering.
The social-graph-based approaches [19, 46] use social connec-
tivity to infer fake accounts that have limited social connections to
legitimate users. They can detect a significant fraction of fake ac-
counts that are created in bulk, but can miss well-maintained fake
accounts and compromised accounts.
Feature-based account classification uses various account fea-
tures to train classifiers to detect malicious accounts [20,35,42,44].
For example, the Facebook Immune System provides system sup-
port to manage many Facebook attack classifiers [35]. COMPA [20]
identifies compromised accounts using statistical models that catch
sudden changes in a user’s behavior, i.e., message sending.
Clickstream [42] and CopyCatch [16] pioneered the work in ag-
gregate behavior clustering for online social network users. Click-
stream compares the pairwise similarity of the http requests from
social network accounts, and clusters accounts with similar http re-
quest patterns together. It uses pre-labeled data to classify a cluster
as fake or legitimate. If the number of pre-labeled fake accounts
in a cluster is larger than a certain threshold, then the cluster is
classified as fake; otherwise, it is legitimate. Although Clickstream
achieved good detection results on a data set of 16K RenRen net-
work users, we cannot directly borrow this approach mainly be-
cause we aim to deploy SynchroTrap at much larger online social
networks. First, it is practically challenging to compare all clicks
from every pair of users at a large social network with hundreds of
millions of active users. Second, it is difficult to obtain large vol-
umes of training data at a large social network because it requires
expensive manual labeling. Thus, many clusters may not contain
any labeled data, leaving them unclassified.
CopyCatch [16], a Facebook internal system, detects fake likes
casted in loose synchrony. SynchroTrap’s design is based on a sim-
ilar insight that malicious accounts tend to act together. However,
CopyCatch assumes that a user can perform a malicious action only
once (e.g., like a page at most once) and models the detection prob-
lem as a co-clustering problem [31]. When a user can repeat the
same malicious action multiple times, such as log on from the same
IP address repeatedly, the computational complexity of CopyCatch
grows exponentially with the number of repeated actions.
In contrast, SynchroTrap assumes malicious accounts can repeat
any action many times, and adopts a clustering algorithm whose
computational complexity grows linearly with the number of ac-
tions an account performs (§ 4.7). Moreover, SynchroTrap uses the
source IP addresses and campaign targets to further reduce its com-
putational complexity, making it deployable at a large-scale social
network such as Facebook.
In addition to social network defense systems, SynchroTrap also
borrows insight from previous work on botnet detection [21–23,43,
47], as some attackers use botnets to control malicious accounts. In
particular, BotMiner [21] and BotSniffer [22] detect the bots that
respond to commands in a similar way. BotGraph [47] detects bot-
net IP addresses that are shared by a large number of spamming
email accounts. SynchroTrap also uses shared IP addresses as a
signal to detect groups of malicious accounts, but uses the times-
tamps of user actions to further improve detection accuracy.

10. CONCLUSIONThis work aims to detect large groups of active malicious ac-
counts in OSNs, including both fake accounts and compromised
real user accounts. We designed a generic and scalable detection
system, SynchroTrap, that uses clustering analysis to detect large
groups of malicious users that act in loose synchrony. To cope
with the enormous volume of user activity data in a large OSN, we
implemented SynchroTrap as an incremental processing system on
top of Hadoop and Giraph. We further optimize it by partitioning
user activity data by time and only comparing pair-wise user ac-
tions that fall into overlapping sliding windows. We deployed Syn-
chroTrap in five applications at Facebook and Instagram. During
one month of deployment, SynchroTrap unveiled 1156 large cam-
paigns and more than two million malicious accounts that involved
in the campaigns.
Although we designed SynchroTrap for OSNs, we believe that
the approach of detecting loosely synchronized actions can also
uncover large attacks in other online services, such as web email
and electronic commerce, at the present time. Furthermore, the in-
cremental processing and data partitioning techniques we have ex-
plored may benefit other applications that analyze large volume of
time-independent data by reducing the requirements on their com-
puting infrastructure.
Finally, we note that SynchroTrap’s design uses unsupervised
learning and does not detect malicious actions in real time. In the
future, we can extract attack signatures from the malicious cam-
paigns and accounts it detects and use supervised learning to de-
velop fast classifiers that can detect attacks in real time.
11. ACKNOWLEDGMENTSWe thank Yuchun Tang and the anonymous reviewers for their
valuable suggestions. We are grateful to Matt Jones, Benjamin
Yang, Abe Land, Ioannis Papagiannis, and many other members
from the Facebook Site Integrity team for their help during this
project. We are particularly thankful to Michael Sirivianos for his
extensive feedback. We also thank the Facebook Digraph team for
providing the graph processing infrastructure. This work was sup-
ported in part by NSF Awards CNS-0845858 and CNS-1017858.
12. REFERENCES[1] Better Security through Software. http://www.facebook.com/notes/
facebook/better-security-through-software/248766257130, 2010.
[2] Staying in Control of Your Facebook Logins. http://www.facebook.com/notes/facebook/staying-in-control-of-your-facebook-logins/
389991097130, 2010.[3] Working Together to Keep You Secure. http://www.facebook.com/notes/
facebook/working-together-to-keep-you-secure/68886667130,
2010.
[4] Amazon EC2 Pricing. http://aws.amazon.com/ec2/pricing/, 2013.
[5] Apache Giraph. http://giraph.apache.org/, 2013.[6] Apache Hadoop. http://hadoop.apache.org/, 2013.[7] Cookies, Pixels & Similar Technologies. https://www.facebook.com/
help/cookies, 2013.[8] Facebook Reports Fourth Quarter and Full Year 2012 Results. http://
investor.fb.com/releasedetail.cfm?ReleaseID=736911, 2013.[9] Facebook’s New Way to Combat Child Pornography. http://gadgetwise.
blogs.nytimes.com/2011/05/19/facebook-to-combat-child-porn-using-microsofts-technology, 2013.
[10] Malicious Chrome extensions on the rise. http://www.zdnet.com/
malicious-chrome-extensions-on-the-rise-7000019913/, 2013.[11] Scaling Apache Giraph to a trillion edges. https://www.facebook.com/
notes/facebook-engineering/scaling-apache-giraph-to-a-trillion-edges/10151617006153920, 2013.
[12] Types of cookies used by Google. http://www.google.com/policies/
technologies/types/, 2013.[13] Rate Limiting at Facebook. https://developers.facebook.com/docs/
reference/ads-api/api-rate-limiting, 2014.[14] Rate Limiting at Google+. https://developers.google.com/+/
domains/faq, 2014.
[15] I. Anderson. Combinatorics of finite sets. Clarendon Press, 1987.
[16] A. Beutel, W. Xu, V. Guruswami, C. Palow, and C. Faloutsos. CopyCatch:
Stopping Group Attacks by Spotting Lockstep Behavior in Social Networks. In
Proceedings of the 22nd International Conference on World Wide Web (WWW),
2013.
[17] L. Bilge, T. Strufe, D. Balzarotti, and E. Kirda. All Your Contacts Are Belong
to Us: Automated Identity Theft Attacks on Social Networks. In WWW, 2009.
[18] F. Brunk. Intersection Problems in Combinatorics. University of St Andrews
thesis. University of St Andrews, 2009.
[19] Q. Cao, M. Sirivianos, X. Yang, and T. Pregueiro. Aiding the Detection of Fake
Accounts in Large Scale Social Online Services. In NSDI, 2012.
[20] M. Egele, G. Stringhini, C. Krügel, and G. Vigna. COMPA: Detecting
Compromised Accounts on Social Networks. In NDSS, 2013.
[21] G. Gu, R. Perdisci, J. Zhang, and W. Lee. BotMiner: Clustering Analysis of
Network Traffic for Protocol- and Structure-Independent Botnet Detection. In
USENIX SECURITY, 2008.
[22] G. Gu, J. Zhang, and W. Lee. BotSniffer: Detecting Botnet Command and
Control Channels in Network Traffic. In NDSS, 2008.
[23] S. Hao, N. A. Syed, N. Feamster, A. G. Gray, and S. Krasser. Detecting
Spammers with SNARE: Spatio-Temporal Network-Level Automatic
Reputation Engine. In USENIX SECURITY, 2009.
[24] P. Jaccard. The Distribution of the Flora in the Alpine Zone. New Phytologist,
11(2), 1912.
[25] T. N. Jagatic, N. A. Johnson, M. Jakobsson, and F. Menczer. Social Phishing.
Communications of the ACM, 50(10), 2007.
[26] A. K. Jain, M. N. Murty, and P. J. Flynn. Data Clustering: a Review. ACM
Computing Surveys, 31(3), 1999.
[27] U. Kang, C. E. Tsourakakis, and C. Faloutsos. PEGASUS: Mining Peta-Scale
Graphs. Knowl. Inf. Syst., 27(2), 2011.
[28] G. Karypis and V. Kumar. Multilevel Algorithms for Multi-Constraint Graph
Partitioning. In Proceedings of the 1998 ACM/IEEE conference on
Supercomputing, 1998.
[29] H.-P. Kriegel, P. Kröger, and A. Zimek. Clustering High-Dimensional Data: A
Survey on Subspace Clustering, Pattern-Based Clustering, and Correlation
Clustering. ACM Trans. Knowl. Discov. Data, 3(1), 2009.
[30] G. Malewicz, M. H. Austern, A. J. Bik, J. C. Dehnert, I. Horn, N. Leiser, and
G. Czajkowski. Pregel: a System for Large-Scale Graph Processing. In
SIGMOD, 2010.
[31] I. V. Mechelen, H. H. Bock, and P. D. Boeck. Two-mode clustering methods: a
structured overview. Statistical Methods in Medical Research, 13:363–394,
2004.
[32] D. Moore, C. Shannon, G. M. Voelker, and S. Savage. Internet Quarantine:
Requirements for Containing Self-Propagating Code. In INFOCOM, 2003.
[33] M. Motoyama, D. McCoy, K. Levchenko, S. Savage, and G. M. Voelker. Dirty
Jobs: the Role of Freelance Labor in Web Service Abuse. In USENIX
SECURITY, 2011.
[34] R. Nishtala, H. Fugal, S. Grimm, M. Kwiatkowski, H. Lee, H. C. Li,
R. McElroy, M. Paleczny, D. Peek, P. Saab, D. Stafford, T. Tung, and
V. Venkataramani. Scaling Memcache at Facebook. In NSDI, 2013.
[35] T. Stein, E. Chen, and K. Mangla. Facebook Immune System. In Proceedings of
the 4th Workshop on Social Network Systems (SNS), 2011.
[36] K. Thomas, C. Grier, D. Song, and V. Paxson. Suspended accounts in
retrospect: An analysis of twitter spam. In IMC, 2011.
[37] K. Thomas, D. McCoy, C. Grier, A. Kolcz, and V. Paxson. Trafficking
Fraudulent Accounts: The Role of the Underground Market in Twitter Spam
and Abuse. In USENIX SECURITY, 2013.
[38] A. Thusoo, Z. Shao, S. Anthony, D. Borthakur, N. Jain, J. Sen Sarma,
R. Murthy, and H. Liu. Data Warehousing and Analytics Infrastructure at
Facebook. In SIGMOD, 2010.
[39] D. N. Tran, B. Min, J. Li, and L. Subramanian. Sybil-Resilient Online Content
Rating. In NSDI, 2009.
[40] C. E. Tsourakakis, C. Gkantsidis, B. Radunovic, and M. Vojnovic. Fennel:
Streaming Graph Partitioning for Massive Scale Graphs. Microsoft Technical
Report MSR-TR-2012-113, 2012.
[41] B. Viswanath, A. Post, K. P. Gummadi, and A. Mislove. An Analysis of Social
Network-based Sybil Defenses. In SIGCOMM, 2010.
[42] G. Wang, T. Konolige, C. Wilson, X. Wang, H. Zheng, and B. Y. Zhao. You are
How You Click: Clickstream Analysis for Sybil Detection. In USENIX
SECURITY, 2013.
[43] Y. Xie, F. Yu, K. Achan, R. Panigrahy, G. Hulten, and I. Osipkov. Spamming
Botnets: Signatures and Characteristics. In SIGCOMM, 2008.
[44] Z. Yang, C. Wilson, X. Wang, T. Gao, B. Y. Zhao, and Y. Dai. Uncovering
Social Network Sybils in the Wild. In IMC, 2011.
[45] H. Yu, P. Gibbons, M. Kaminsky, and F. Xiao. SybilLimit: A Near-Optimal
Social Network Defense Against Sybil Attacks. In IEEE S&P, 2008.
[46] H. Yu, M. Kaminsky, P. B. Gibbons, and A. Flaxman. SybilGuard: Defending
Against Sybil Attacks via Social Networks. In SIGCOMM, 2006.
[47] Y. Zhao, Y. Xie, F. Yu, Q. Ke, Y. Yu, Y. Chen, and E. Gillum. BotGraph: Large
Scale Spamming Botnet Detection. In NSDI, 2009.
[48] C. C. Zou, W. Gong, and D. Towsley. Worm Propagation Modeling and
Analysis Under Dynamic Quarantine Defense. In Proceedings of the 2003 ACM
Workshop on Rapid Malcode (WORM), 2003.