UNCORRECTED The normal distribution - Oxford...
20
The normal distribution This chapter deals with the application of the properties of the standard normal distribution to the solution of real problems. The main mathematical ideas investigated are: ▶ determining standardised scores (z-scores) ▶ using z-scores to compare data sets ▶ drawing frequency graphs ▶ identifying normal distributions ▶ using the properties of normally distributed data. DATA AND STATISTICS Syllabus references: DS5 Outcomes: MG2H-1, MG2H-2, MG2H-7, MG2H-9, MG2H-10 UNCORRECTED PAGE PROOFS
Transcript of UNCORRECTED The normal distribution - Oxford...

The normal distribution
This chapter deals with the application of the properties of the standard normal distribution to the solution of real problems.
The main mathematical ideas investigated are:▶ determining standardised scores (z-scores)▶ using z-scores to compare data sets▶ drawing frequency graphs▶ identifying normal distributions▶ using the properties of normally distributed data.
DATA AND STATISTICSSyllabus references: DS5
Outcomes: MG2H-1, MG2H-2, MG2H-7, MG2H-9, MG2H-10
06_LEY_IM12_HSC2_SB_23782_SI.indd 19906_LEY_IM12_HSC2_SB_23782_SI.indd 199 8/08/13 11:34 AM8/08/13 11:34 AM
UNCORRECTED PAGE PROOFS

DAT
A A
ND
STA
TIST
ICS
Insight Mathematics General 12 HSC Course 2200
6A Standardised score Standardised scoreAn important consideration when analysing sets of data is the relative signifi cance of each score. For example,
suppose Kim scores 40 marks in a Mathematics test. If the mark is out of a total of 50 then it is likely that it is a
good mark; however, if it is out of 100 then it is probably a poor mark.
These conclusions are by no means certain. If the test was out of 50 and most students in the class scored more than
40 out of 50 then it is a relatively poor mark. Similarly, if the test was out of 100 and most students scored less than
40 then it is a relatively good mark: it is the relative value of a score in a data set that indicates its signifi cance.
There are a number of ways in which the relative signifi cance of a score can be indicated. The rank position of the
score, or the decile or quartile in which the score lies could be given. A convenient method, which is also useful for
comparing scores from diff erent data sets, is to indicate the distance of the score from the mean of the data in terms
of the standard deviation of the data. For example, suppose the mean score in the Mathematics test above was 56
and the standard deviation was 8.
The diff erence between Kim’s score and the mean is 16, which is two times the standard deviation; that is, the
distance of Kim’s score from the mean is twice that of the ‘typical’ distance of all the scores from the mean.
Further, as Kim’s mark is below the mean, the relative signifi cance of her mark could be given as a score −2.
This is known as the standardised score or z-score for Kim’s mark on this test.
Remember, the standard deviation is the ‘typical’ distance of all the scores from the mean.
Standardised score = raw score − mean
_______________ standard deviation
or z = x − x
_____ s
where s is the standard deviation (s = σn for population standard deviation).
Standardised scores from diff erent tests can be compared to fi nd the better relative performance, or added to fi nd the
better total performance.
WORKED EXAMPLE 1In an English examination the mean was 60 and the standard deviation was 10.
a Calculate the z-score (standardised scores) for marks of:
i 50 ii 58 iii 60 iv 64 v 83
b Explain the meaning of these scores.
Solve Think Apply
a i z = 50 − 60
_______ 10
= −1 Subtract the mean of 60 from
the score. Divide the answer by
the standard deviation of 10.
If the score is less than the
mean, the z-score will be
negative.
If the score is greater than
the mean, the z-score will be
positive.
ii z = 58 − 60
_______ 10
= −0.2
iii z = 60 − 60
_______ 10
= 0
iv z = 64 − 60
_______ 10
= 0.4
v z = 83 − 60
_______ 10
= 2.3
06_LEY_IM12_HSC2_SB_23782_SI.indd 20006_LEY_IM12_HSC2_SB_23782_SI.indd 200 8/08/13 11:34 AM8/08/13 11:34 AM
UNCORRECTED PAGE PROOFS

DAT
A A
ND
STA
TIST
ICS
201Chapter 6 The normal distribution
WORKED EXAMPLE 1 CONTINUED
Solve/Think Apply
b i z-score =−1. This mark is 1 standard deviation below
the mean.
Positive z-scores are above the mean,
negative z-scores are below the mean.
A z-score of 0 is equal to the mean.
The larger the magnitude of the z-score,
the greater the distance from the mean.
ii z-score =−0.2. This mark is 0.2 standard deviations
below the mean.
iii z-score =0. This mark is equal to the mean.
iv z-score =0.4. This mark is 0.4 standard deviations
above the mean.
v z-score =2.3. This mark is 2.3 standard deviations
above the mean.
EXERCISE 6A1 In a Science test the mean was 63 and the standard deviation 10.
a Calculate the standardised scores for these marks.
i 43 ii 53 iii 60 iv 63
v 69 vi 73 vii 78 viii 85
b Explain the meaning of these scores.
2 In a History examination the mean was 56 and the
standard deviation 8. Complete the table, which
shows the marks scored by some students.
WORKED EXAMPLE 2Write down the z-score corresponding to a raw score that is:
a 0.8 standard deviations above the mean
b equal to the mean
c 1.3 standard deviations below the mean.
Solve Think Apply
a 0.8 Above the mean is positive. The sign of the z-score is very important as it
describes whether the score is above (+) or below
(−) the mean.b 0 Equal to the mean is zero.
c −1.3 Below the mean is negative.
Student Mark Standardised score
Julie 65
Imran 48
Sevvy 72
Brad 52
Katrina 71
Sam 40
Megumi 56
Sasha 38
06_LEY_IM12_HSC2_SB_23782_SI.indd 20106_LEY_IM12_HSC2_SB_23782_SI.indd 201 8/08/13 11:34 AM8/08/13 11:34 AM
UNCORRECTED PAGE PROOFS
DAT
A A
ND
STA
TIST
ICS
Insight Mathematics General 12 HSC Course 2202
3 Write the standardised score corresponding to a score that is:a 1 standard deviation above the mean b 1 standard deviation below the meanc 2 standard deviations above the mean d 2 standard deviations below the meane 3 standard deviations above the mean f 3 standard deviations below the meang equal to the mean h 1.5 standard deviations above the meani 0.8 standard deviations below the mean j 2.6 standard deviations below the mean.
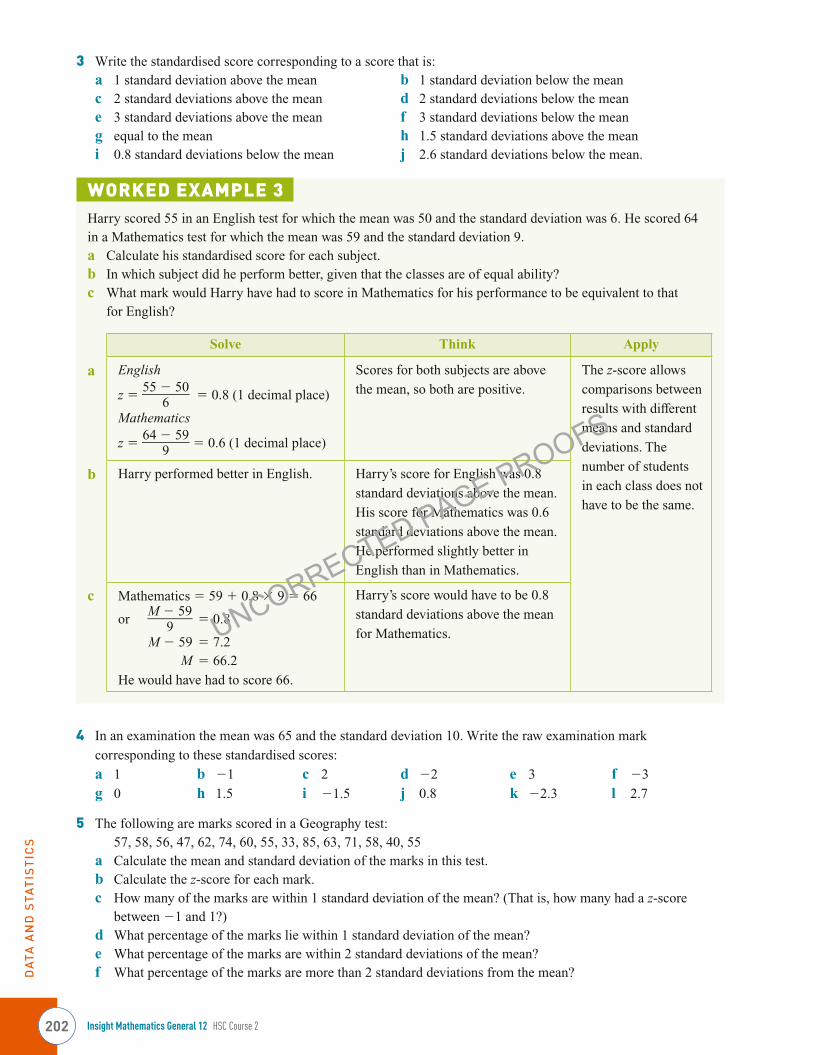
WORKED EXAMPLE 3Harry scored 55 in an English test for which the mean was 50 and the standard deviation was 6. He scored 64 in a Mathematics test for which the mean was 59 and the standard deviation 9.a Calculate his standardised score for each subject.b In which subject did he perform better, given that the classes are of equal ability?c What mark would Harry have had to score in Mathematics for his performance to be equivalent to that
for English?
Solve Think Apply
a English
z = 55 − 50
_______ 6 = 0.8 (1 decimal place)
Mathematics
z = 64 − 59
_______ 9 = 0.6 (1 decimal place)
Scores for both subjects are above
the mean, so both are positive.
The z-score allows
comparisons between
results with diff erent
means and standard
deviations. The
number of students
in each class does not
have to be the same.
b Harry performed better in English. Harry’s score for English was 0.8
standard deviations above the mean.
His score for Mathematics was 0.6
standard deviations above the mean.
He performed slightly better in
English than in Mathematics.
c Mathematics = 59 + 0.8 × 9 = 66
or M − 59
_______ 9 = 0.8
M − 59 = 7.2 M = 66.2
He would have had to score 66.
Harry’s score would have to be 0.8
standard deviations above the mean
for Mathematics.
4 In an examination the mean was 65 and the standard deviation 10. Write the raw examination mark
corresponding to these standardised scores:
a 1 b −1 c 2 d −2 e 3 f −3
g 0 h 1.5 i −1.5 j 0.8 k −2.3 l 2.7
5 The following are marks scored in a Geography test: 57, 58, 56, 47, 62, 74, 60, 55, 33, 85, 63, 71, 58, 40, 55
a Calculate the mean and standard deviation of the marks in this test.b Calculate the z-score for each mark.c How many of the marks are within 1 standard deviation of the mean? (That is, how many had a z-score
between −1 and 1?)d What percentage of the marks lie within 1 standard deviation of the mean?e What percentage of the marks are within 2 standard deviations of the mean?f What percentage of the marks are more than 2 standard deviations from the mean?
06_LEY_IM12_HSC2_SB_23782_SI.indd 20206_LEY_IM12_HSC2_SB_23782_SI.indd 202 8/08/13 11:34 AM8/08/13 11:34 AM
UNCORRECTED PAGE PROOFS
DAT
A A
ND
STA
TIST
ICS
203Chapter 6 The normal distribution
6 Jenny scored 62 in a History test for which the mean was 52 and the standard deviation was 8. She scored 67 in
a Geography test for which the mean was 55 and the standard deviation 12.
a Calculate her standardised score in each subject.
b In which subject did she perform better, given that the classes are of equal ability?
c What mark would Jenny have to have scored in Geography for her performance to be equivalent to that
for History?
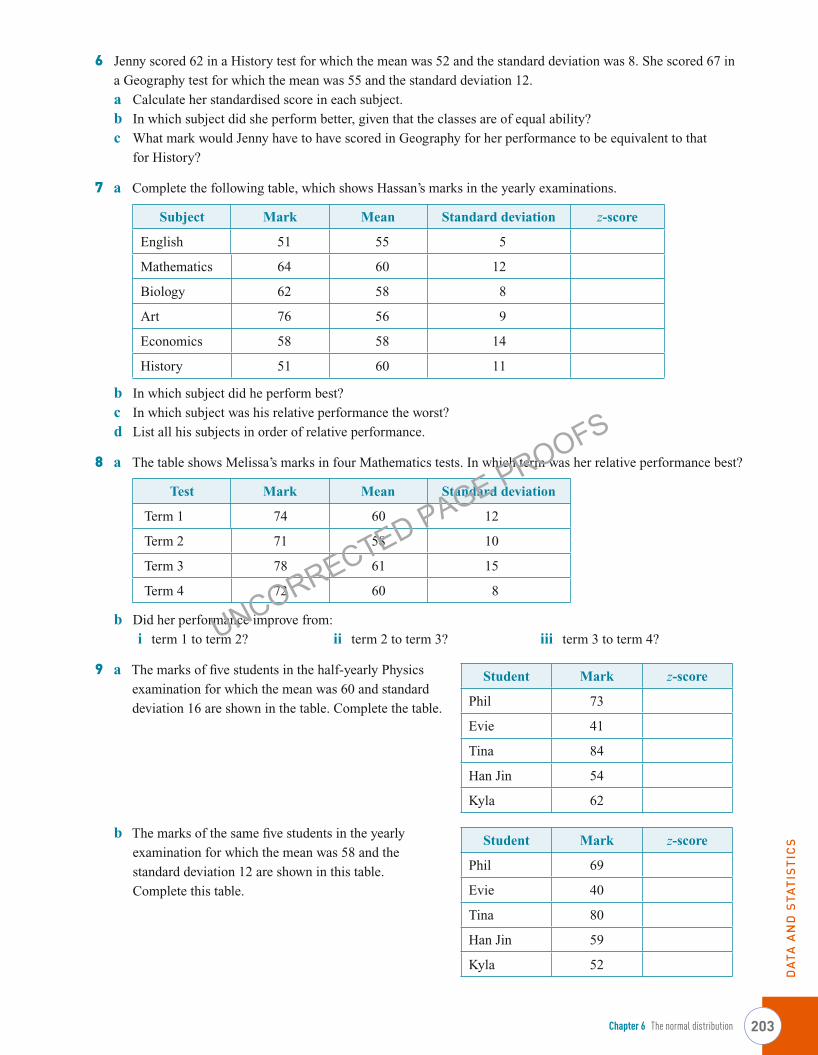
7 a Complete the following table, which shows Hassan’s marks in the yearly examinations.
Subject Mark Mean Standard deviation z-score
English 51 55 5
Mathematics 64 60 12
Biology 62 58 8
Art 76 56 9
Economics 58 58 14
History 51 60 11
b In which subject did he perform best?
c In which subject was his relative performance the worst?
d List all his subjects in order of relative performance.
8 a The table shows Melissa’s marks in four Mathematics tests. In which term was her relative performance best?
Test Mark Mean Standard deviation
Term 1 74 60 12
Term 2 71 58 10
Term 3 78 61 15
Term 4 72 60 8
b Did her performance improve from:
i term 1 to term 2? ii term 2 to term 3? iii term 3 to term 4?
9 a The marks of fi ve students in the half-yearly Physics
examination for which the mean was 60 and standard
deviation 16 are shown in the table. Complete the table.
b The marks of the same fi ve students in the yearly
examination for which the mean was 58 and the
standard deviation 12 are shown in this table.
Complete this table.
Student Mark z-score
Phil 73
Evie 41
Tina 84
Han Jin 54
Kyla 62
Student Mark z-score
Phil 69
Evie 40
Tina 80
Han Jin 59
Kyla 52
06_LEY_IM12_HSC2_SB_23782_SI.indd 20306_LEY_IM12_HSC2_SB_23782_SI.indd 203 8/08/13 11:34 AM8/08/13 11:34 AM
UNCORRECTED PAGE PROOFS
DAT
A A
ND
STA
TIST
ICS
Insight Mathematics General 12 HSC Course 2204
c Which student(s) improved their
relative performance from the fi rst to
the second examination?
d Which student improved the most?
e Which students’ performances
decreased in the second examination?
f Which student’s performance
decreased the most?
g Which student’s performance was
the most consistent over the two
examinations?
WORKED EXAMPLE 4In the yearly examination Kylie scored 60 in Mathematics and 71 in Science. Elena scored 68 in Mathematics
and 63 in Science. If the mean and standard deviation for Mathematics were 50 and 8 respectively and 58 and
10 for Science, which student had the better total performance in these subjects?
Solve Apply
Student
Mathematics Science Total
Mark z-score Mark z-score Mark z-score
Kylie 60 1.25 71 1.3 131 2.55
Elena 68 2.25 63 0.5 131 2.75
z-scores can be
added to obtain an
overall result.
The higher the
total z-score, the
better the result.Think
By completing the above table, we see that both students had the same total number
of raw marks. However, by totalling the standardised scores for each subject, we can
conclude that Elena’s total performance was better than Kylie’s.
In an examination, Brian scored 65 in English and 71 in Mathematics. Trevor scored 72 in English and 64
in Mathematics. If the mean and standard deviation for English were 60 and 6 respectively and 65 and 8 for
Mathematics, which student had the better total performance in these subjects?
The marks scored by fi ve students in English, Mathematics, Science and Art are shown in the table below.
Place the students in order of merit on the basis of their performance in all subjects.
Student English Mathematics Science Art
Melanie 74 71 84 52
Josh 67 70 75 76
Ming 53 85 83 64
Vera 76 67 64 78
Jake 71 70 71 69
Mean 64 66 59 64
Standard deviation 10 15 12 13
10
11
06_LEY_IM12_HSC2_SB_23782_SI.indd 20406_LEY_IM12_HSC2_SB_23782_SI.indd 204 8/08/13 11:34 AM8/08/13 11:34 AM
UNCORRECTED PAGE PROOFS
DAT
A A
ND
STA
TIST
ICS
205Chapter 6 The normal distribution
6B Frequency graphs Frequency graphsFrequency distributions may be displayed using histograms and polygons. If instead of a frequency polygon
we draw a smooth curve, we get a frequency graph whose general shape and properties can be used to make
judgements about the data.
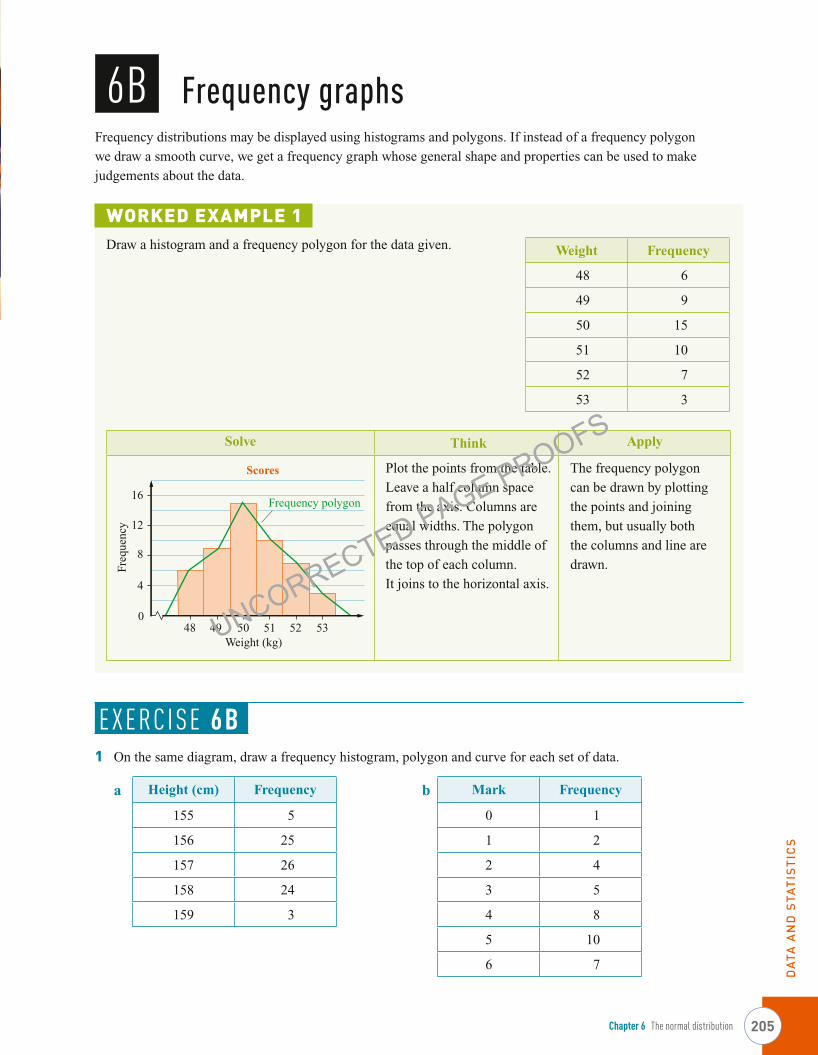
WORKED EXAMPLE 1Draw a histogram and a frequency polygon for the data given.
Solve Think Apply
Plot the points from the table.
Leave a half column space
from the axis. Columns are
equal widths. The polygon
passes through the middle of
the top of each column.
It joins to the horizontal axis.
The frequency polygon
can be drawn by plotting
the points and joining
them, but usually both
the columns and line are
drawn.
EXERCISE 6B1 On the same diagram, draw a frequency histogram, polygon and curve for each set of data.
a Height (cm) Frequency b Mark Frequency
155 5 0 1
156 25 1 2
157 26 2 4
158 24 3 5
159 3 4 8
5 10
6 7
Weight Frequency
48 6
49 9
50 15
51 10
52 7
53 3
Weight (kg)
Freq
uenc
y
Scores
48 49 50 51 52 53
12
16
8
4
0
Frequency polygon
06_LEY_IM12_HSC2_SB_23782_SI.indd 20506_LEY_IM12_HSC2_SB_23782_SI.indd 205 8/08/13 11:34 AM8/08/13 11:34 AM
UNCORRECTED PAGE PROOFS
DAT
A A
ND
STA
TIST
ICS
Insight Mathematics General 12 HSC Course 2206
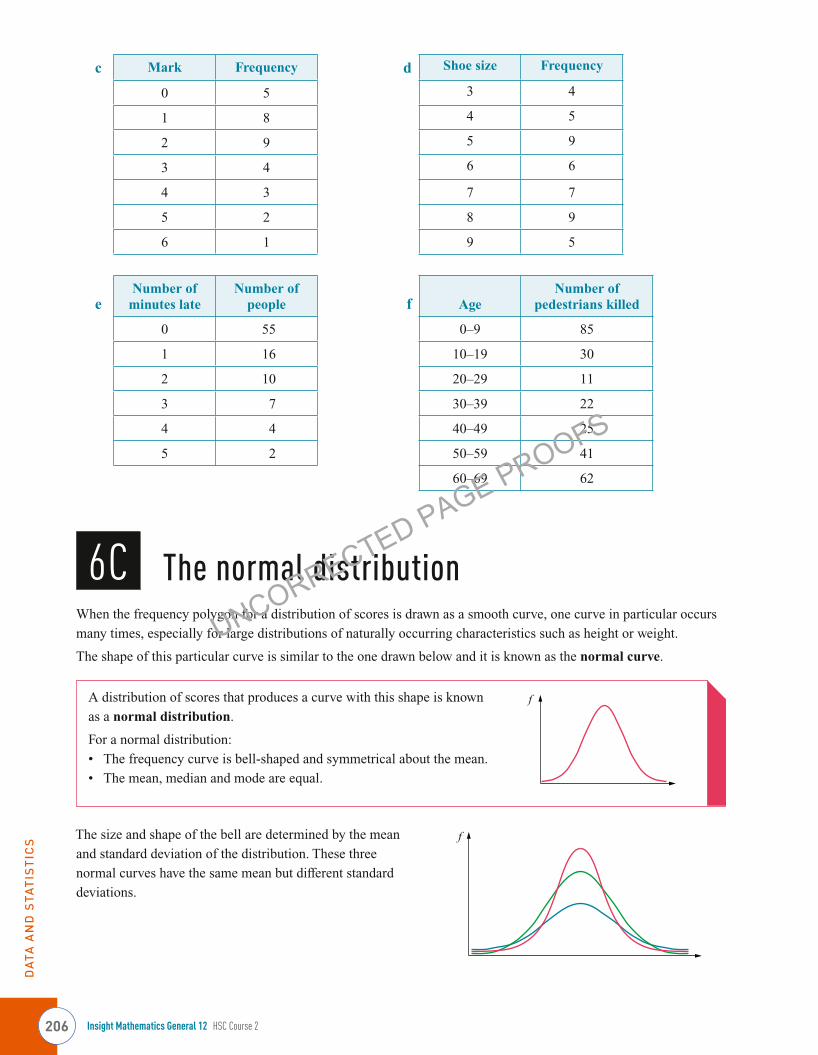
c Mark Frequency d Shoe size Frequency
0 5 3 4
1 8 4 5
2 9 5 9
3 4 6 6
4 3 7 7
5 2 8 9
6 1 9 5
eNumber of
minutes lateNumber of
people f AgeNumber of
pedestrians killed
0 55 0–9 85
1 16 10–19 30
2 10 20–29 11
3 7 30–39 22
4 4 40–49 25
5 2 50–59 41
60–69 62
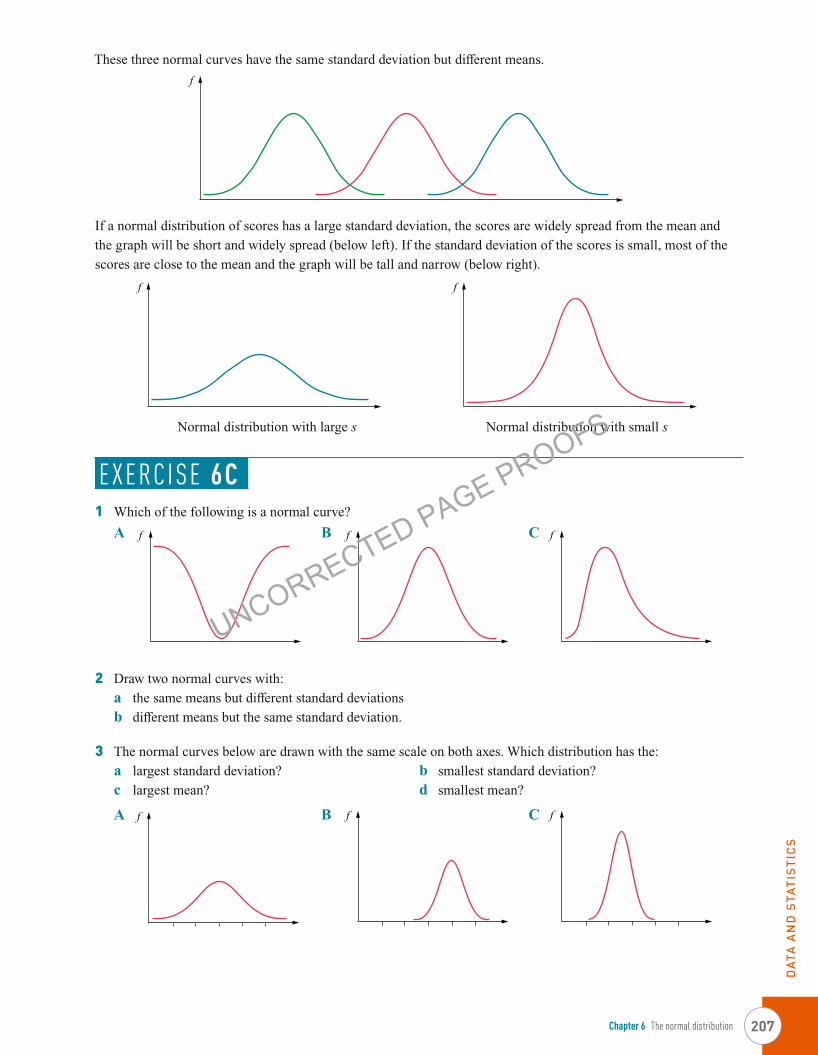
6C The normal distribution The normal distributionWhen the frequency polygon for a distribution of scores is drawn as a smooth curve, one curve in particular occurs
many times, especially for large distributions of naturally occurring characteristics such as height or weight.
The shape of this particular curve is similar to the one drawn below and it is known as the normal curve.
A distribution of scores that produces a curve with this shape is known
as a normal distribution.
For a normal distribution:
• The frequency curve is bell-shaped and symmetrical about the mean.
• The mean, median and mode are equal.
The size and shape of the bell are determined by the mean
and standard deviation of the distribution. These three
normal curves have the same mean but diff erent standard
deviations.
f
f
06_LEY_IM12_HSC2_SB_23782_SI.indd 20606_LEY_IM12_HSC2_SB_23782_SI.indd 206 9/08/13 11:52 AM9/08/13 11:52 AM
UNCORRECTED PAGE PROOFS
DAT
A A
ND
STA
TIST
ICS
207Chapter 6 The normal distribution
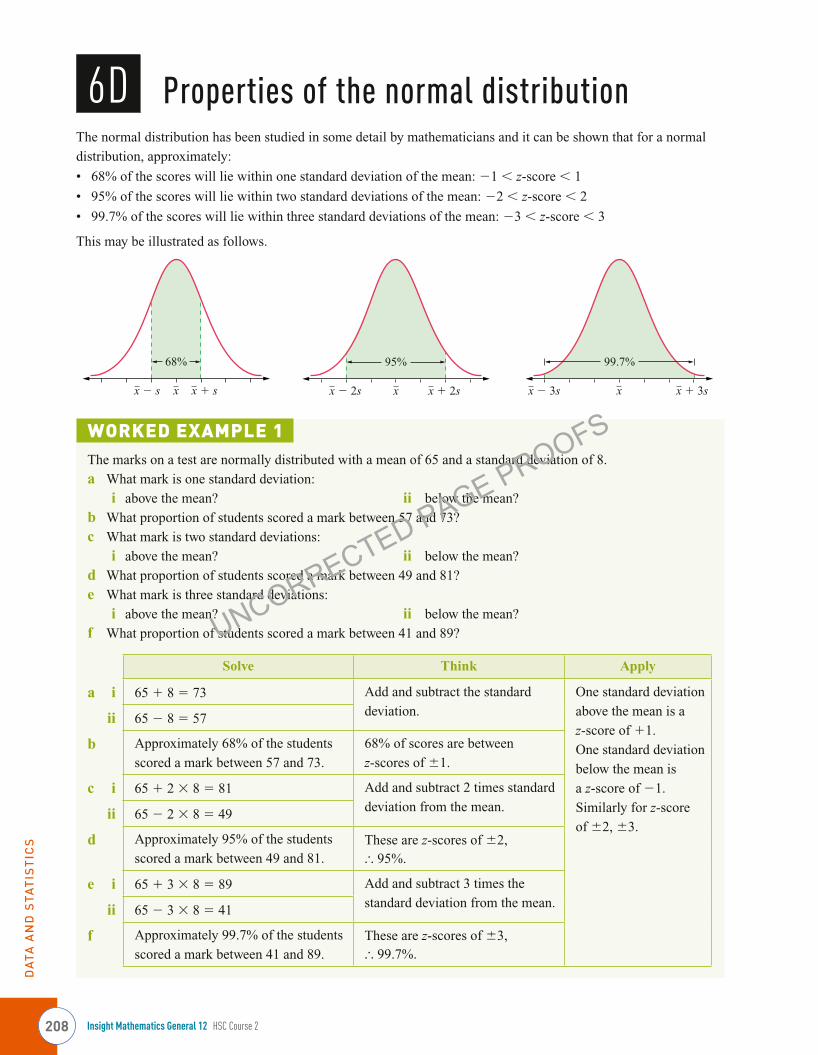
These three normal curves have the same standard deviation but diff erent means.
If a normal distribution of scores has a large standard deviation, the scores are widely spread from the mean and
the graph will be short and widely spread (below left). If the standard deviation of the scores is small, most of the
scores are close to the mean and the graph will be tall and narrow (below right).
Normal distribution with large s Normal distribution with small s
EXERCISE 6C1 Which of the following is a normal curve?
A B C
2 Draw two normal curves with:
a the same means but diff erent standard deviations
b diff erent means but the same standard deviation.
3 The normal curves below are drawn with the same scale on both axes. Which distribution has the:
a largest standard deviation? b smallest standard deviation?
c largest mean? d smallest mean?
A B C
f
ff
f f f
f f f
06_LEY_IM12_HSC2_SB_23782_SI.indd 20706_LEY_IM12_HSC2_SB_23782_SI.indd 207 8/08/13 11:34 AM8/08/13 11:34 AM
UNCORRECTED PAGE PROOFS
DAT
A A
ND
STA
TIST
ICS
Insight Mathematics General 12 HSC Course 2208
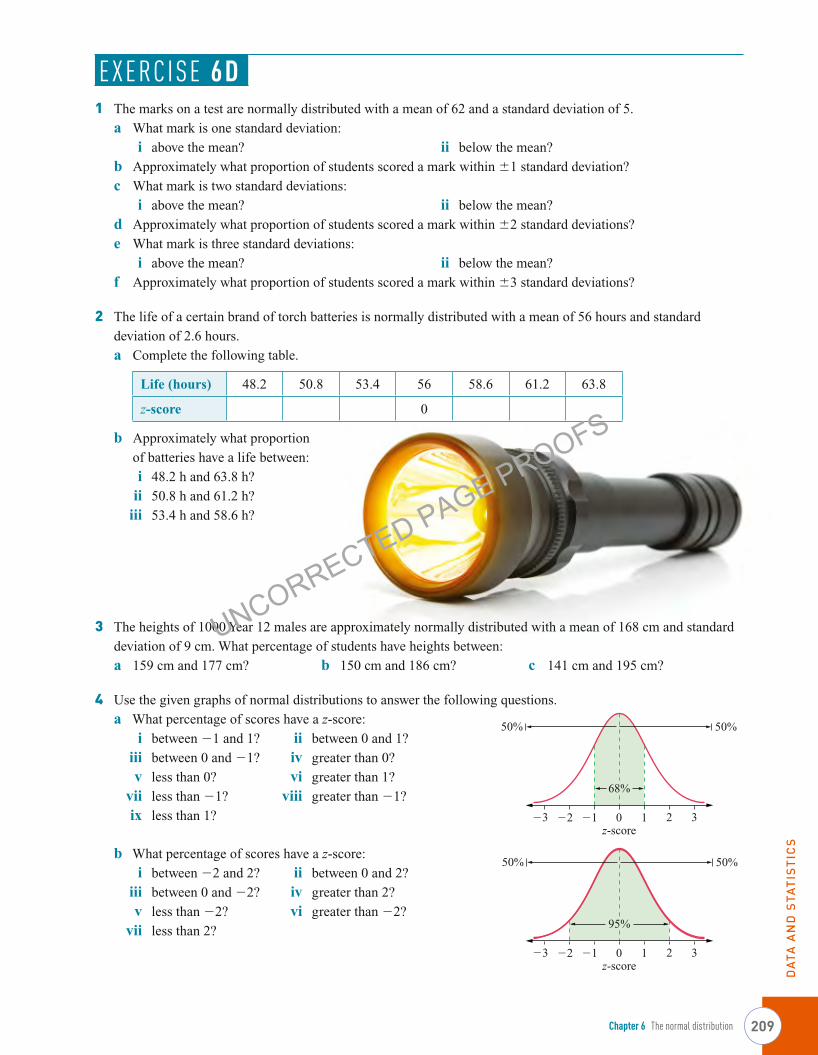
6D Properties of the normal distribution Properties of the normal distributionThe normal distribution has been studied in some detail by mathematicians and it can be shown that for a normal
distribution, approximately:
• 68% of the scores will lie within one standard deviation of the mean: −1 < z-score < 1
• 95% of the scores will lie within two standard deviations of the mean: −2 < z-score < 2
• 99.7% of the scores will lie within three standard deviations of the mean: −3 < z-score < 3
This may be illustrated as follows.
WORKED EXAMPLE 1The marks on a test are normally distributed with a mean of 65 and a standard deviation of 8.
a What mark is one standard deviation:
i above the mean? ii below the mean?
b What proportion of students scored a mark between 57 and 73?
c What mark is two standard deviations:
i above the mean? ii below the mean?
d What proportion of students scored a mark between 49 and 81?
e What mark is three standard deviations:
i above the mean? ii below the mean?
f What proportion of students scored a mark between 41 and 89?
Solve Think Apply
a i 65 + 8 = 73 Add and subtract the standard
deviation.
One standard deviation
above the mean is a
z-score of +1.
One standard deviation
below the mean is
a z-score of −1.
Similarly for z-score
of ±2, ±3.
ii 65 − 8 = 57
b Approximately 68% of the students
scored a mark between 57 and 73.
68% of scores are between
z-scores of ±1.
c i 65 + 2 × 8 = 81 Add and subtract 2 times standard
deviation from the mean. ii 65 − 2 × 8 = 49
d Approximately 95% of the students
scored a mark between 49 and 81.These are z-scores of ±2, ∴ 95%.
e i 65 + 3 × 8 = 89 Add and subtract 3 times the
standard deviation from the mean. ii 65 − 3 × 8 = 41
f Approximately 99.7% of the students
scored a mark between 41 and 89.These are z-scores of ±3, ∴ 99.7%.
x x + sx − s
68%
x x + 2sx − 2s
95%
x x + 3sx − 3s
99.7%
06_LEY_IM12_HSC2_SB_23782_SI.indd 20806_LEY_IM12_HSC2_SB_23782_SI.indd 208 8/08/13 11:34 AM8/08/13 11:34 AM
UNCORRECTED PAGE PROOFS
DAT
A A
ND
STA
TIST
ICS
209Chapter 6 The normal distribution
EXERCISE 6D1 The marks on a test are normally distributed with a mean of 62 and a standard deviation of 5.
a What mark is one standard deviation:
i above the mean? ii below the mean?
b Approximately what proportion of students scored a mark within ±1 standard deviation?
c What mark is two standard deviations:
i above the mean? ii below the mean?
d Approximately what proportion of students scored a mark within ±2 standard deviations?
e What mark is three standard deviations:
i above the mean? ii below the mean?
f Approximately what proportion of students scored a mark within ±3 standard deviations?
2 The life of a certain brand of torch batteries is normally distributed with a mean of 56 hours and standard
deviation of 2.6 hours.
a Complete the following table.
Life (hours) 48.2 50.8 53.4 56 58.6 61.2 63.8
z-score 0
b Approximately what proportion
of batteries have a life between:
i 48.2 h and 63.8 h?
ii 50.8 h and 61.2 h?
iii 53.4 h and 58.6 h?
3 The heights of 1000 Year 12 males are approximately normally distributed with a mean of 168 cm and standard
deviation of 9 cm. What percentage of students have heights between:
a 159 cm and 177 cm? b 150 cm and 186 cm? c 141 cm and 195 cm?
4 Use the given graphs of normal distributions to answer the following questions.
a What percentage of scores have a z-score:
i between −1 and 1? ii between 0 and 1?
iii between 0 and −1? iv greater than 0?
v less than 0? vi greater than 1?
vii less than −1? viii greater than −1?
ix less than 1?
b What percentage of scores have a z-score:
i between −2 and 2? ii between 0 and 2?
iii between 0 and −2? iv greater than 2?
v less than −2? vi greater than −2?
vii less than 2?
68%
z-score−1 10 3−3 −2 2
50% 50%
95%
z-score−2 −1 10 2
50% 50%
−3 3
06_LEY_IM12_HSC2_SB_23782_SI.indd 20906_LEY_IM12_HSC2_SB_23782_SI.indd 209 8/08/13 11:34 AM8/08/13 11:34 AM
UNCORRECTED PAGE PROOFS

DAT
A A
ND
STA
TIST
ICS
Insight Mathematics General 12 HSC Course 2210
c What percentage of scores have a z-score:
i between −3 and 3? ii between 0 and 3?
iii between 0 and −3? iv greater than 3?
v less than −3? vi greater than −3?
vii less than 3?
d What percentage of scores have a z-score between:
i 1 and 2? ii 1 and 3?
iii 2 and 3? iv −1 and 2?
v −1 and 3? vi −2 and 1?
vii −2 and 3? viii −3 and 1?
ix −3 and 2?
5 Packets of rice are fi lled and labelled as having a weight of
1 kg. The weight of these packets is normally distributed
with a mean of 1.02 kg and a standard deviation of 0.01 kg.
a Complete the following table.
Weight (kg) 1.00 1.01 1.02 1.03 1.04
z-score 0
b What percentage of packets will have a weight less than 1.02 kg?
c What percentage of packets will have a weight between 1.01
kg and 1.03 kg?
d What percentage of packets will have a weight between
1.02 and 1.03 kg?
e What percentage of packets will have a weight between
1.00 kg and 1.04 kg?
f What percentage of packets will have a weight greater
than 1.03 kg?
g What percentage of packets will have a weight less than the labelled weight?
6 Tim scored 53 in a test for which the marks were normally distributed with a mean of 65 and a standard
deviation of 12. What percentage of students scored higher marks than Tim?
7 The average life of a particular brand of car battery is 4 years and 4 months with a standard deviation of
8 months. The manufacturer guarantees to replace any battery that does not last 3 years. If the life of these
batteries is normally distributed, approximately what percentage could the manufacturer expect to replace?
8 The heights of a large group of female university students is found to be normally distributed with a mean of
160 cm and a standard deviation of 6 cm. Between what limits would you expect the heights of:
a the middle 68% of these students to lie?
b the middle 95% of these students to lie?
c almost all, 99.7%, of these students to lie?
9 A machine is set to produce metal cylinders with a mean diameter of 5.00 cm and a standard deviation of 0.02 cm.
a If the diameters are normally distributed, within what interval will 99.7% of the diameters lie?
b A cylinder is chosen at random and its diameter measured to be 5.07 cm. Discuss what conclusions could
be drawn.
99.7%
z-score−3 −2 −1 10 2 3
50% 50%
z-score−3 −2 −1 10 2 3
06_LEY_IM12_HSC2_SB_23782_SI.indd 21006_LEY_IM12_HSC2_SB_23782_SI.indd 210 8/08/13 11:34 AM8/08/13 11:34 AM
UNCORRECTED PAGE PROOFS

DAT
A A
ND
STA
TIST
ICS
211Chapter 6 The normal distribution
A machine fi lls packets of lollies. The mean
number of lollies in each packet is 40 with
a standard deviation of 1.5 lollies. The
number of lollies is normally distributed.
Rory claims that he bought a packet that
had 48 lollies in it. Discuss Rory’s claim.
WORKED EXAMPLE 2Given the frequency tables below, determine whether or not the distributions are normal.
a Score 5 6 7 8 9 10 11
Frequency 1 7 14 18 13 5 2
b Score 0 1 2 3 4 5 6
Frequency 3 8 15 10 16 6 2
Solve Think Apply
a Draw a frequency histogram and sketch the
frequency curve for this distribution. The curve
appears to be symmetrical and bell-shaped, but
not perfectly so.
Calculate the mean,
mode and median for the
distribution.
Mean = 7.97
(2 decimal places)
Mode = 8
Median = 8
As the mean, mode
and median are all
almost exactly the
same, the distribution is
approximately normally
distributed.
A normal
distribution is
symmetrical with
mean, mode and
median equal.
In this case all three
measures equal 8,
so it is a normal
distribution.
b Draw a frequency histogram and sketch the
frequency curve for this distribution.
The graph is not bell-
shaped so the distribution
is not normal. (There is no
need to fi nd the mean, mode
and median.)
This distribution is
bimodal and not a
normal distribution.
10
Score
Freq
uenc
y
5 6 7 8 9
8
4
010 11
12
16
20
Score
Freq
uenc
y
0 1 2 3 4
8
4
05 6
16
12
06_LEY_IM12_HSC2_SB_23782_SI.indd 21106_LEY_IM12_HSC2_SB_23782_SI.indd 211 8/08/13 11:34 AM8/08/13 11:34 AM
UNCORRECTED PAGE PROOFS

212
Given the frequency distributions below, determine whether or not each is normally distributed by:
i fi rst drawing a frequency graph
ii then, if necessary, fi nd the mean, mode and median.
a
b
c
d
11
Score 4 5 7 6 8 9 10
Frequency 7 9 21 14 20 2 1
Score 8 9 10 11 12 13 14
Frequency 2 9 14 25 16 7 2
Score 30 31 32 33 34 34
Frequency 10 28 6 4 2 1
Score 24 25 26 27 28 29 30 31
Frequency 3 12 18 31 30 19 13 1
The number of peas in each pod of a large
sample of a particular species of pea is shown
in the table below.
a Determine whether or not the distribution
is normal.
b Find the standard deviation.
c What percentage of the pods in this sample
lie within:
i one standard deviation of the mean?
ii two standard deviations of the mean?
iii three standard deviations of the mean?
12
Number of peas/pod Number of pods
2 10
3 16
4 38
5 71
6 80
7 73
8 35
9 19
10 8
06_LEY_IM12_HSC2_SB_23782_SI.indd 21206_LEY_IM12_HSC2_SB_23782_SI.indd 212 8/08/13 11:34 AM8/08/13 11:34 AM
UNCORRECTED PAGE PROOFS
FIN
AN
CIA
L M
ATH
EMAT
ICS
DAT
A A
ND
STA
TIST
ICS
Chapter 6 The normal distribution 213
REVIEW 6 THE NORMAL D ISTRIBUTION
Language and terminologyHere is a list of terms used in this chapter. Explain each term in a sentence.
frequency curve, normal curve, normal distribution, standardised score, z-score
Having completed this chapter you should be able to:• determine z-scores
• use z-scores to compare diff erent data sets
• draw frequency graphs
• make judgements about the nature of data based on the shape of the display
• identify and use the properties of normally distributed data.
6 REVIEW TEST1 The z-score for a mark of 56 in a test with a mean of 60 and standard deviation of 8 is:
A 4 B −4 C 0.5 D −0.5
2 In an examination the mean was 65 and the standard deviation 15. The raw examination mark corresponding to
a standardised score of 1.4 is:
A 86 B 79 C 80 D 66.4
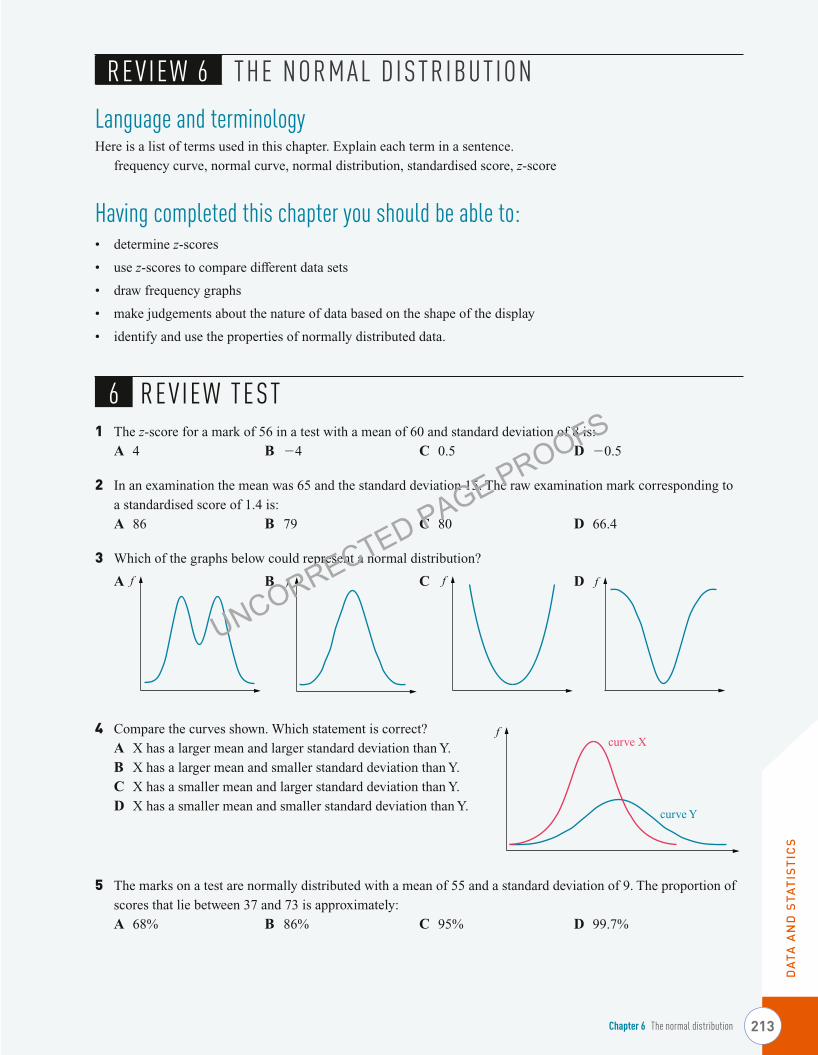
3 Which of the graphs below could represent a normal distribution?
A B C D
4 Compare the curves shown. Which statement is correct?
A X has a larger mean and larger standard deviation than Y.
B X has a larger mean and smaller standard deviation than Y.
C X has a smaller mean and larger standard deviation than Y.
D X has a smaller mean and smaller standard deviation than Y.
5 The marks on a test are normally distributed with a mean of 55 and a standard deviation of 9. The proportion of
scores that lie between 37 and 73 is approximately:
A 68% B 86% C 95% D 99.7%
f ff f
fcurve X
curve Y
06_LEY_IM12_HSC2_SB_23782_SI.indd 21306_LEY_IM12_HSC2_SB_23782_SI.indd 213 8/08/13 11:34 AM8/08/13 11:34 AM
UNCORRECTED PAGE PROOFS
DAT
A A
ND
STA
TIST
ICS
Insight Mathematics General 12 HSC Course 2214
6 The number of matches in a box is approximately normally distributed with a mean of 50 and a standard
deviation of 1. Approximately 95% of boxes will have between:
A 49 and 51 matches B 48 and 52 matches
C 47 and 53 matches D 46 and 54 matches
7 For a normal distribution, the percentage of scores between z = −2 and z = −1 is:
A 27 B 34 C 13.5 D 2.35
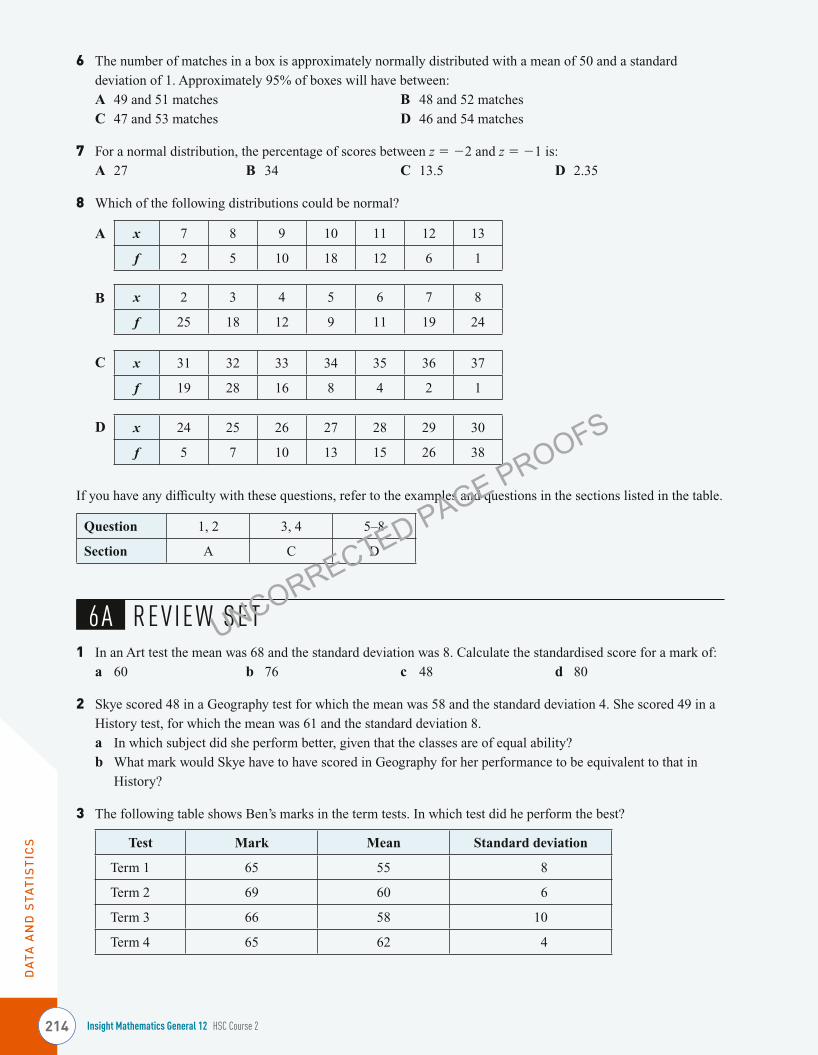
8 Which of the following distributions could be normal?
A x 7 8 9 10 11 12 13
f 2 5 10 18 12 6 1
B x 2 3 4 5 6 7 8
f 25 18 12 9 11 19 24
C x 31 32 33 34 35 36 37
f 19 28 16 8 4 2 1
D x 24 25 26 27 28 29 30
f 5 7 10 13 15 26 38
If you have any diffi culty with these questions, refer to the examples and questions in the sections listed in the table.
Question 1, 2 3, 4 5–8
Section A C D
6A REVIEW SET1 In an Art test the mean was 68 and the standard deviation was 8. Calculate the standardised score for a mark of:
a 60 b 76 c 48 d 80
2 Skye scored 48 in a Geography test for which the mean was 58 and the standard deviation 4. She scored 49 in a
History test, for which the mean was 61 and the standard deviation 8.
a In which subject did she perform better, given that the classes are of equal ability?
b What mark would Skye have to have scored in Geography for her performance to be equivalent to that in
History?
3 The following table shows Ben’s marks in the term tests. In which test did he perform the best?
Test Mark Mean Standard deviation
Term 1 65 55 8
Term 2 69 60 6
Term 3 66 58 10
Term 4 65 62 4
06_LEY_IM12_HSC2_SB_23782_SI.indd 21406_LEY_IM12_HSC2_SB_23782_SI.indd 214 8/08/13 11:34 AM8/08/13 11:34 AM
UNCORRECTED PAGE PROOFS

FIN
AN
CIA
L M
ATH
EMAT
ICS
DAT
A A
ND
STA
TIST
ICS
Chapter 6 The normal distribution 215
4 Draw a frequency histogram, polygon and curve for the height data given in the table.
Height (cm) 16 17 18 19 20 21 22
Frequency 4 9 15 21 16 10 3
5 Draw three normal curves with diff erent means but the same standard deviation.
6 For a normal distribution, which of the following is true?
A the median < the mean < the mode B the median = the mean = the mode
C the median > the mean > the mode D none of the above
7 The marks on a test are normally distributed with a mean of 63 and a standard deviation of 5.
a What mark is one standard deviation:
i above the mean? ii below the mean?
b What percentage of scores lie between 58 and 68?
c What percentage of scores lie between 53 and 73?
d What percentage of scores lie between 48 and 78?
8 For a normal distribution, what percentage of scores have a z-score:
a between z = 0 and z = 1? b between z = −1 and z = 0?
c greater than 0? d greater than 1?
9 a Determine whether the frequency distribution given below is normal by fi rst drawing a frequency graph.
b Then, if necessary, fi nd the mean, mode and median to confi rm your answer.
x 10 11 12 13 14 15 16 17 18
f 2 6 12 19 25 18 11 6 3
6B REVIEW SET1 In an examination the mean mark was 70 and the standard deviation was 10. Write down the examination mark
corresponding to a z-score of:
a 2 b −1 c 1.3 d −2.6
2 Matthew scored 62 in a Science test for which the mean was 50 and the standard deviation 12. He scored 58 in
an English test for which the mean was 51 and the standard deviation 8.
a In which subject did he perform better, given that the classes are of equal ability?
b What mark would Matthew have to have scored in English for his performance to be equivalent to that in
Science?
3 Rebecca scored 72 in Mathematics and 69 in Science. Serena scored 66 in Mathematics and 75 in Science. The
mean in Mathematics was 60 and the standard deviation was 8. In Science the mean was 65 and the standard
deviation was 10. By completing the table below, determine who had the better overall performance.
Mathematics Science Total
Mark z-score Mark z-score Mark z-score
Rebecca 72 69
Serena 66 75
06_LEY_IM12_HSC2_SB_23782_SI.indd 21506_LEY_IM12_HSC2_SB_23782_SI.indd 215 8/08/13 11:34 AM8/08/13 11:34 AM
UNCORRECTED PAGE PROOFS

DAT
A A
ND
STA
TIST
ICS
Insight Mathematics General 12 HSC Course 2216
4 Draw two normal curves with the same mean but diff erent standard deviations.
5 Toothpicks are packaged in boxes with a mean of 98 and standard deviation of 4 toothpicks. What proportion of
boxes will contain between:
a 94 and 102 toothpicks? b 90 and 106 toothpicks? c 86 and 110 toothpicks?
6 A machine produces bolts with a mean length of 25 mm and standard deviation 0.6 mm. Any bolts shorter than
23.2 m or longer than 26.8 mm are rejected. What percentage of bolts made by this machine will be rejected?
7 The weights of a large sample of 18-year-old males is normally distributed with a mean of 74 kg and standard
deviation of 6.5 kg. Between what limits would you expect the weights of:
a the middle 68% of these males to lie? b the middle 95% of these males to lie?
c almost all, 99.7%, of these males to lie?
8 For a normal distribution state the percentage of scores that have a z-score:
a between z = −2 and z = 2 b greater than z = 2 c less than z = 2
d less than z = −2 e greater than z = −2
6C REVIEW SET1 In a Commerce test the mean was 63 and the standard deviation was 12. Calculate the standardised scores for
test marks of:
a 81 b 39 c 66 d 58
2 The results for an examination had a mean score of 55 and a standard deviation of 10. Write the raw examination
mark corresponding to a standardised score of:
a 0.6 b 1.3 c −0.9 d −2.1
3 The following are the scores in a Language test:
60 61 59 50 65 77 63 58 36 88 66 74, 61 43 58
a Calculate the mean and standard deviation of these marks.
b How many scores lie within 1 standard deviation of the mean?
c How many scores are more than 2 standard deviations above the mean?
4 Francis scored 52 in the half-yearly English test for which the mean was 68 and the standard deviation 11. In the
yearly examination for which the mean was 60 and the standard deviation 6, she scored 56. Determine whether
or not Francis improved her performance in English over the year. Justify your answer.
5 Which of the following is a normal curve?
A B C
6 The life of a brand of electric light globe is normally distributed with a mean of 1400 hours and a standard
deviation of 120 hours. Within what limits would you expect:
a the middle 68% of globes to last? b the middle 95% of globes to last?
c nearly all, 99.7%, of globes to last?
f ff
06_LEY_IM12_HSC2_SB_23782_SI.indd 21606_LEY_IM12_HSC2_SB_23782_SI.indd 216 8/08/13 11:34 AM8/08/13 11:34 AM
UNCORRECTED PAGE PROOFS

FIN
AN
CIA
L M
ATH
EMAT
ICS
DAT
A A
ND
STA
TIST
ICS
Chapter 6 The normal distribution 217
7 a Packets of sugar are labelled as having a weight of 500 g. The weight of these packets is normally distributed
with a mean of 510 g and standard deviation of 10 g. Complete the following table.
z-score −3 −2 −1 0 1 2 3
Weight (g) 510
b What percentage of packets have a weight that lies between:
i 500 g and 520 g? ii 490 g and 530 g? iii 480 g and 540 g?
c A packet is chosen at random and its weight is 450 g. What conclusion could be drawn?
8 a Determine whether the frequency distribution given below is normal by fi rst drawing a frequency graph.
b Then, if necessary, fi nd the mean, mode and median to confi rm your answer.
x 7 8 9 10 11 12 13
f 21 16 8 5 9 15 19
6D REVIEW SET1 In a test the mean was 64 and the standard deviation was 6. Calculate the standardised score for a mark of:
a 60 b 76 c 48 d 80
2 Melanie scored 67 in a Science test for which the mean was 56 and the standard deviation 11. In an English test,
for which the mean was 54 and the standard deviation 8, she scored 60.
a In which subject did she perform better, given that the classes are of equal ability?
b What mark would Melanie have to have scored in English for her performance to be equivalent to that in
Science?
3 The mean score for an examination was 50 and the standard deviation was 15. Write the raw examination mark
corresponding to a standardised score of:
a 0.6 b 1.4 c −0.8 d −2.2
4 The marks scored by three students in tests in English, Mathematics, Science and Art are shown in the table
below. List the students in order of merit on the basis of their total performance in all subjects.
Student English Mathematics Science Art
Michael 74 71 84 52
Janelle 67 70 75 76
Melissa 53 85 83 64
Mean 65 62 60 65
Standard deviation 12 15 14 12
5 Jelly babies are produced in monster packs with a mean of 50 and a standard deviation of 2. What proportion of
packets will contain between:
a 48 and 52 jelly babies? b 46 and 54 jelly babies? c 44 and 56 jelly babies?
6 The life of a brand of torch battery is normally distributed with a mean of 42 hours and a standard deviation of
3.2 hours. Within what limits would you expect:
a the middle 68% of batteries to last? b the middle 95% of batteries to last?
c nearly all, 99.7%, of batteries to last?
06_LEY_IM12_HSC2_SB_23782_SI.indd 21706_LEY_IM12_HSC2_SB_23782_SI.indd 217 8/08/13 11:34 AM8/08/13 11:34 AM
UNCORRECTED PAGE PROOFS
DAT
A A
ND
STA
TIST
ICS
Insight Mathematics General 12 HSC Course 2218
7 For a normal distribution, state the percentage of scores that have a z-score between:
a z = 0 and z = 1 b z = 0 and z = 2
c z = 1 and z = 2 d z = 2 and z = 3.
8 The average life of a particular brand of car battery is 4 years and 6 months with a standard deviation of
9 months. The manufacturer guarantees to replace any battery that does not last 3 years. If the life of these
batteries is normally distributed, approximately what percentage could the manufacturer expect to replace?
9 Packets of rice are fi lled and labelled as having a weight of 1 kg. The weight of these packets is normally
distributed with a mean of 1.05 kg and a standard deviation of 0.02 kg.
a Complete the following table.
Weight (kg) 0.99 1.01 1.03 1.05 1.07 1.09 1.11
z-score 0 1
b What percentage of packets will have a weight of less than 1.05 kg?
c What percentage of packets will have a weight between 1.03 kg and 1.07 kg?
d What percentage of packets will have a weight between 1.05 and 1.07 kg?
e What percentage of packets will have a weight between 1.01 kg and 1.09 kg?
f What percentage of packets will have a weight greater than 1.07 kg?
g What percentage of packets will have a weight less than the labelled weight?
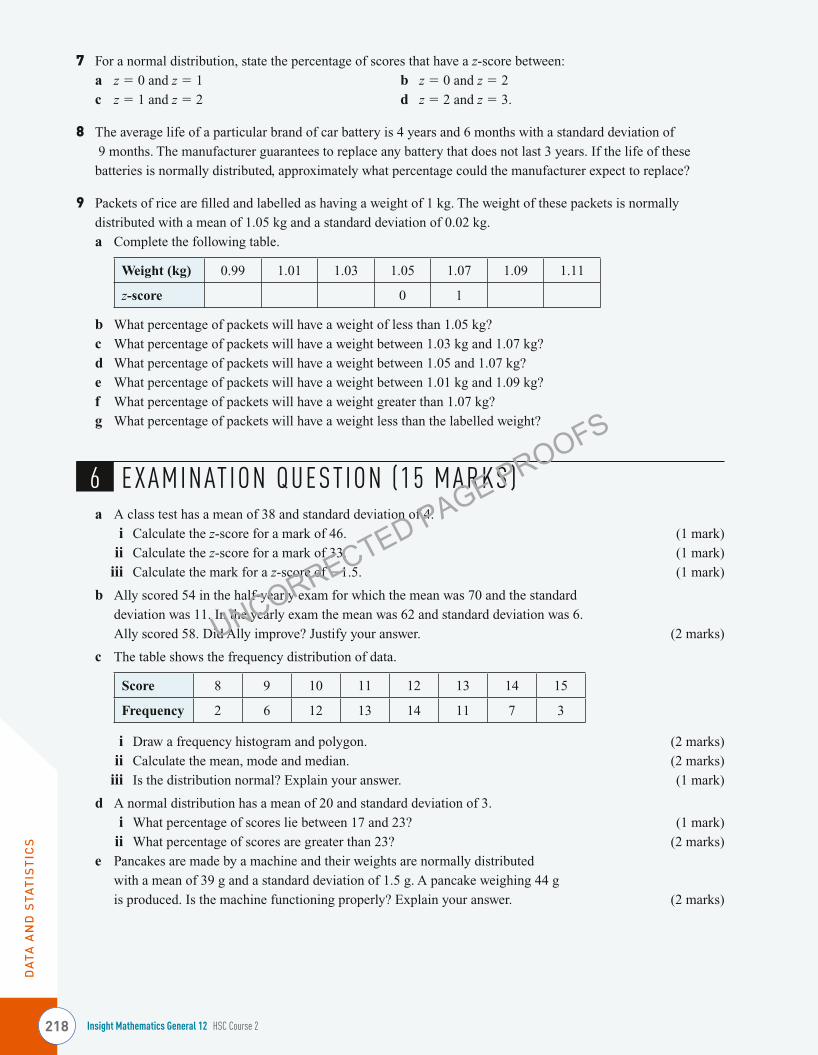
6 EXAMINAT ION QUEST ION (15 MARKS)a A class test has a mean of 38 and standard deviation of 4.
i Calculate the z-score for a mark of 46. (1 mark)
ii Calculate the z-score for a mark of 33. (1 mark)
iii Calculate the mark for a z-score of −1.5. (1 mark)
b Ally scored 54 in the half-yearly exam for which the mean was 70 and the standard
deviation was 11. In the yearly exam the mean was 62 and standard deviation was 6.
Ally scored 58. Did Ally improve? Justify your answer. (2 marks)
c The table shows the frequency distribution of data.
Score 8 9 10 11 12 13 14 15
Frequency 2 6 12 13 14 11 7 3
i Draw a frequency histogram and polygon. (2 marks)
ii Calculate the mean, mode and median. (2 marks)
iii Is the distribution normal? Explain your answer. (1 mark)
d A normal distribution has a mean of 20 and standard deviation of 3.
i What percentage of scores lie between 17 and 23? (1 mark)
ii What percentage of scores are greater than 23? (2 marks)
e Pancakes are made by a machine and their weights are normally distributed
with a mean of 39 g and a standard deviation of 1.5 g. A pancake weighing 44 g
is produced. Is the machine functioning properly? Explain your answer. (2 marks)
06_LEY_IM12_HSC2_SB_23782_SI.indd 21806_LEY_IM12_HSC2_SB_23782_SI.indd 218 8/08/13 11:34 AM8/08/13 11:34 AM
UNCORRECTED PAGE PROOFS