
Uncorrected Proof - research.engineering.uiowa.edu · an ANN model to estimate missing rain-gauge...
13
Assessment of different methods for estimation of missing data in precipitation studies Mohammad-Taghi Sattari, Ali Rezazadeh-Joudi and Andrew Kusiak ABSTRACT The outcome of data analysis depends on the quality and completeness of data. This paper considers various techniques for filling in missing precipitation data. To assess suitability of the different methods for filling in missing data, monthly precipitation data collected at six different stations was considered. The complete sets (with no missing values) are used to predict monthly precipitation. The arithmetic averaging method, the multiple linear regression method, and the non-linear iterative partial least squares algorithm perform best. The multiple regression method provided a successful estimation of the missing precipitation data, which is supported by the results published in the literature. The multiple imputation method produced the most accurate results for precipitation data from five dependent stations. The decision-tree algorithm is explicit, and therefore it is used when insights into the decision making are needed. Comprehensive error analysis is presented. Mohammad-Taghi Sattari Department of Water Engineering, Agriculture Faculty, University of Tabriz, Iran Ali Rezazadeh-Joudi (corresponding author) Islamic Azad University, Maragheh, Iran E-mail: [email protected] Andrew Kusiak Department of Mechanical and Industrial Engineering, University of Iowa, Iowa City, IA, USA Key words | arid areas, arithmetic averaging, decision tree, missing precipitation data, multiple regression, partial least squares INTRODUCTION Rainfall is an important part of the hydrological cycle. One of the first steps in any hydrological and meteorological study is accessing reliable data. However, precipitation data is frequently incomplete. The incompleteness of pre- cipitation data may be due to damaged measuring instruments, measurement errors and geographical paucity of data (data gaps) or changes to instrumentation over time, a change in the measurement site, a change in data col- lectors, the irregularity of measurement, or severe topical changes in the climate of a zone. The accurate planning and management of water resources depends on the presence of consistent and exact precipitation data in meteorology stations. In countries where it has not been possible to accurately and consistently record precipitation data in a particular time section, it is necessary to use methods to estimate the missing precipi- tation data and apply it in hydrological models. Those in climate studies also face this issue, and measurements in the ocean share similar data problems in regard to missing precipitation data (Lyman & Johnson ; Abraham et al. ; Cheng et al. a, b). The estimation of missing data in hydrological studies is necessary for timely implementation of projects such as dam or canal construction. This information is extremely valu- able in areas that deal with heavy precipitation events and floods. The accurate estimation of the missing data makes a great contribution in accurately assessing the capacity of flood control structures in rivers and also dam spillovers. It reduces the risk of floods in the downstream of these structures. Abraham et al. () observed precipitation changes in the United States and stated that observations and projections of precipitation changes can be useful in designing and constructing infrastructure to be more resist- ant to both heavy precipitation and flooding. 1 © IWA Publishing 2016 Hydrology Research | in press | 2016 doi: 10.2166/nh.2016.364 Uncorrected Proof
Transcript of Uncorrected Proof - research.engineering.uiowa.edu · an ANN model to estimate missing rain-gauge...
1 © IWA Publishing 2016 Hydrology Research | in press | 2016
Uncorrected Proof
Assessment of different methods for estimation of
missing data in precipitation studies
Mohammad-Taghi Sattari, Ali Rezazadeh-Joudi and Andrew Kusiak
ABSTRACT
The outcome of data analysis depends on the quality and completeness of data. This paper considers
various techniques for filling in missing precipitation data. To assess suitability of the different
methods for filling in missing data, monthly precipitation data collected at six different stations was
considered. The complete sets (with no missing values) are used to predict monthly precipitation.
The arithmetic averaging method, the multiple linear regression method, and the non-linear iterative
partial least squares algorithm perform best. The multiple regression method provided a successful
estimation of the missing precipitation data, which is supported by the results published in the
literature. The multiple imputation method produced the most accurate results for precipitation data
from five dependent stations. The decision-tree algorithm is explicit, and therefore it is used when
insights into the decision making are needed. Comprehensive error analysis is presented.
doi: 10.2166/nh.2016.364
Mohammad-Taghi SattariDepartment of Water Engineering, Agriculture
Faculty,University of Tabriz,Iran
Ali Rezazadeh-Joudi (corresponding author)Islamic Azad University,Maragheh,IranE-mail: [email protected]
Andrew KusiakDepartment of Mechanical and Industrial
Engineering,University of Iowa,Iowa City,IA,USA
Key words | arid areas, arithmetic averaging, decision tree, missing precipitation data, multipleregression, partial least squares
INTRODUCTION
Rainfall is an important part of the hydrological cycle. One
of the first steps in any hydrological and meteorological
study is accessing reliable data. However, precipitation
data is frequently incomplete. The incompleteness of pre-
cipitation data may be due to damaged measuring
instruments, measurement errors and geographical paucity
of data (data gaps) or changes to instrumentation over
time, a change in the measurement site, a change in data col-
lectors, the irregularity of measurement, or severe topical
changes in the climate of a zone.
The accurate planning and management of water
resources depends on the presence of consistent and exact
precipitation data in meteorology stations. In countries
where it has not been possible to accurately and consistently
record precipitation data in a particular time section, it is
necessary to use methods to estimate the missing precipi-
tation data and apply it in hydrological models. Those in
climate studies also face this issue, and measurements in
the ocean share similar data problems in regard to missing
precipitation data (Lyman & Johnson ; Abraham et al.
; Cheng et al. a, b).
The estimation of missing data in hydrological studies is
necessary for timely implementation of projects such as dam
or canal construction. This information is extremely valu-
able in areas that deal with heavy precipitation events and
floods. The accurate estimation of the missing data makes
a great contribution in accurately assessing the capacity of
flood control structures in rivers and also dam spillovers.
It reduces the risk of floods in the downstream of these
structures. Abraham et al. () observed precipitation
changes in the United States and stated that observations
and projections of precipitation changes can be useful in
designing and constructing infrastructure to be more resist-
ant to both heavy precipitation and flooding.
2 M.-T. Sattari et al. | Assessment of methods for estimating missing data in precipitation studies Hydrology Research | in press | 2016
Uncorrected Proof
Homogeneity and trend tests of data used in hydrologi-
cal modeling or water resource analysis are essential.
Numerous methods have been introduced for estimating
and reconstructing missing data. They can be categorized
as empirical methods, statistical methods, and function fit-
ting approaches (Xia et al. ). Most of these methods
derive the missing values using observations from neighbor-
ing stations. Selecting appropriate methods for estimating
missing precipitation data may improve the accuracy of
hydrological models. The literature points to rather arbitrary
selection methods for estimating and reconstructing missing
data (Hasanpur Kashani & Dinpashoh ). Some of the
most significant studies involving estimation and reconstruc-
tion of missing rainfall data are discussed next.
Xia et al. () estimated the missing data of daily maxi-
mum temperature, minimum temperature, mean air
temperature, water vapor pressure, wind speed, and precipi-
tation with six methods. They determined that the multiple
regression analysis method was most effective in estimating
missing data in the study area of Bavaria, Germany. Teega-
varapu & Chandramouli () applied a neural network,
the Kriging method and the inverse distance weighting
method (IDWM) for estimation of missing precipitation
data. They demonstrated that a better definition of weighting
parameters and a surrogate measure for distances could
improve the accuracy of the IDWM. De Silva et al. ()
used the aerial precipitation ratio method, the arithmetic
mean method, the normal ratio (NR) method, and the
inverse distance method to estimate missing rainfall data.
The NR method was found to be most accurate. The arith-
metic mean method and the aerial precipitation ratio
method were most appropriate for the wet zone. You et al.
() compared methods for spatial estimation of tempera-
tures. The spatial regression approach was found to be
superior over the IDWM, especially in coastal and mountai-
nous regions. Dastorani et al. () predicted the missing
data using the NR method, the correlation method, an arti-
ficial neural network (ANN), and an adaptive neuro-fuzzy
inference system (ANFIS). The ANFIS approach performed
best for the missing flow data. ANN was found to be more
efficient in predicting missing data than traditional
approaches. Teegaravapu () estimated missing precipi-
tation records by combining a surface interpolation
technique and spatial and temporal association rules. The
results suggested that this integrated approach improved
the precipitation estimates. Teegavarapu et al. () applied
a genetic algorithm and a distance weighting method for
estimating missing precipitation data. The genetic algorithm
provided more accurate estimates over the distance weight-
ing method. Kim & Pachepsky () reconstructed missing
daily precipitation data with a regression tree and an ANN.
Better accuracy was accomplished with the combined
regression tree and ANN rather than using them indepen-
dently. Hosseini Baghanam & Nourani () developed
an ANN model to estimate missing rain-gauge data. The
resulting feed-forward network was found to be accurate.
Nkuna & Odiyo () confirmed accuracy of the ANN in
estimating the missing rainfall data. Hasanpur Kashani &
Dinpashoh () assessed accuracy of different methods of
estimating missing climatological data. They concluded
that although the ANN approach is more complex and
time consuming, it outperformed the classical methods.
Also, the multiple regression analysis method was found to
be most suitable among the classical methods. Choge & Reg-
ulwar () applied ANN to estimate the missing
precipitation data. Che Ghani et al. () estimated the
missing rainfall data with the gene expression programming
(GEP) method. The GEP approach was used to determine
the most suitable replacement station for the principal rain-
fall station. Teegaravapu () attempted to achieve
statistical corrections for spatially interpolated missing pre-
cipitation data estimations.
The literature review indicates that there are no signifi-
cant studies that evaluate various methods for estimating
missing precipitation data in arid regions, such as southern
parts of Iran and most of them have been performed in
countries with almost mild or wet climates such as the
studies of Xia et al. (), Teegavarapu & Chandramouli
(), De Silva et al. (), You et al. (), Teegaravapu
(), Teegavarapu et al. (), Kim & Pachepsky (),
Che Ghani et al. (), and Teegavarapu (2014). Also
most of the previous research is about the application of
ANN and GEP methods in comparing classic methods,
but there is not any remarkable study that evaluates the effi-
ciency of the M5 model tree, which is one of the new and
modern data mining methods.
The purpose of this study is to investigate the ability of
10 different traditional and data-driven methods to estimate

3 M.-T. Sattari et al. | Assessment of methods for estimating missing data in precipitation studies Hydrology Research | in press | 2016
Uncorrected Proof
missing precipitation data in arid areas of southern Iran and
to identify the most appropriate method. The 10 examined
methods include arithmetic averaging (AA), inverse distance
interpolation, linear regression (LR), multiple imputations
(MI), multiple regression analysis (MLR), non-linear itera-
tive partial least squares (NIPALS) algorithm, NR, single
best estimator (SIB), UK traditional (UK) and M5 model
tree.
MATERIALS AND METHODS
Study area and data analysis
The studied region encompasses a spacious part of southern
Iran and includes an area more than seventy thousand
square kilometers. The studied region includes hot and dry
areas and is impacted by arid and semi-arid climates. The
weather of the coastal zone is extremely hot and humid in
the summer, as the temperature occasionally exceeds 52 WC.
Figure 1 | Study area and location of stations.
The average annual temperature in this region is approxi-
mately 27 WC. The amounts of monthly precipitation at the
six rain-gauge stations located in southern Iran, namely
Bandar Abbas, Bandar Lengeh, Jask, Minab, Kish Island
and Abomoosa Island between 1986 and 2014 are used in
this investigation. There is no significant difference between
the elevations of the studied areas (5 to 30 meters above the
sea level). The climate at each station was determined using
the De Martonne () aridity index shown in Equation (1).
I ¼ PT þ 10
(1)
where P and T are the average annual precipitation (mm)
and temperature (WC), respectively. Figure 1 shows the geo-
graphical area of the studied region. Table 1 includes
geographic coordinates of the examined weather stations,
their elevations, and characteristics of the monthly precipi-
tation data.
Normally, there are no particular issues regarding
recording data at meteorology stations. However, the

Table 1 | Statistics of precipitation data and geographic position of selected rain gauge stations
Abomoosa Island Bandar Abbas Jask Bandar Lengeh Kish Island Minab
Geographic position Latitude (N) 25 W500 27 W130 25 W380 26 W320 26 W300 27 W60
Longitude (E) 54 W500 56 W220 57 W460 54 W500 53 W590 57 W50
Elevation (m) 6.6 9.8 5.2 22.7 30.0 29.6
Statistics of precipitation data Index of aridity 0.280 0.383 0.272 0.276 0.364 0.436Climate type Dry Dry Dry Dry Dry DryMin Rainfall (mm) 0 0 0 0 0 0Max Rainfall (mm) 205 194.7 312 184.4 209.6 195.3Mean Rainfall (mm) 10.653 14.128 10.181 10.435 12.805 16.804Standard deviation 28.037 33.402 29.876 27.126 30.78 35.979
4 M.-T. Sattari et al. | Assessment of methods for estimating missing data in precipitation studies Hydrology Research | in press | 2016
Uncorrected Proof
inconsistency of the data record may happen in certain time
sections per se. Hence, in this study we have hypothesized
that 10% of data might not be measured. It may need to
be estimated.
In this study, the Bandar Lengeh and Bandar Abbas
stations were considered the target stations. The Bandar
Abbas station is likely to have a precipitation regime differ-
ent from other stations because it is affected by the elevation
of Hormozgan Province. Thus, this station was not taken to
be a target one. On the other hand, Bandar Lengeh is
located almost in the middle of the zone regarding its lati-
tude and longitude.
After statistical analysis and quality control of the avail-
able data, including homogeneity and trend tests, an attempt
has been made to evaluate the efficiency of different classic
statistical methods and a decision-tree model to estimate
missing data.
Simple AA
This is the simplest method commonly used to fill in missing
meteorological data in meteorology and climatology. Miss-
ing data is obtained by computing the arithmetic average
of the data corresponding to the nearest weather stations,
as shown in (2),
V0 ¼Pn
i¼1 Vi
N(2)
where V0 is the estimated value of the missing data, Vi is the
value of same parameter at ith nearest weather station, and
N is the number of the nearest stations. The AA method is
satisfactory if the gauges are uniformly distributed over the
area and the individual gauge measurements do not vary
greatly about the mean (Te Chow et al. ).
IDWM
The inverse distance (reciprocal-distance) weighting method
(IDWM) (Wei &McGuinness ) is the method most com-
monly used for estimating missing data. This weighting
distance method for estimating the missing value of an
observation, which uses the observed values at other
stations, is determined by
V0 ¼Pn
i¼1 Vi=Dið ÞPni¼1 1=Dið Þ (3)
where Di is the distance between the station with missing
data and the ith nearest weather station. The remaining par-
ameters are defined in Equation (2).
NR method
The NR method which first proposed by Paulhus & Kohler
(), and later modified by Young () is a common
method for estimation of rainfall missing data. This method
is used if any surrounding gauges have normal annual precipi-
tation exceeding 10% of the considered gauge. This weighs the
effect of each surrounding station (Singh ). The estimated
data is considered as a combination of parameters with differ-
ent weights, as shown in Equation (4).
V0 ¼Pn
i¼1 WiViPni¼1 Wi
(4)

5 M.-T. Sattari et al. | Assessment of methods for estimating missing data in precipitation studies Hydrology Research | in press | 2016
Uncorrected Proof
whereWi is the weight of ith nearest weather station expressed
as
Wi ¼ R2i
Ni � 21� R2
i
!" #(5)
where Ri is the correlation coefficient between the target
station and the ith surrounding station, and Ni is the number
of points used to derive correlation coefficient.
SIB
In the SIB method, the closest neighbor station is used as an
estimate for a target station. The target station rainfall is esti-
mated using the same data from the neighbor station that
has the highest positive correlation with the target station
(Hasanpur Kashani & Dinpashoh ).
LR
LR is a method used for estimating climatological data at
stations with similar conditions. In statistics, LR is an
approach for modeling the relationship between scalar
dependent variable y and one independent parameter
denoted X. LR was the first type of regression analysis to
be studied rigorously and to be used extensively in practical
applications (Xin ). This is because models that depend
linearly on their unknown parameters are easier to fit than
models that are non-linearly related to their parameters
because the statistical properties of the resulting estimators
are easier to determine. In this study, the Kish island station
data was used to calculate the missing data of the target
station (Bandar Lengeh) using the LR method.
Multiple linear regression
Multiple linear regression (MLR) is a statistical method for
estimating the relationship between a dependent variable
and two or more independent, or predictor, variables.
MLR identifies the best-weighted combination of indepen-
dent variables to predict the dependent, or criterion,
variable. Eischeid et al. () highlighted many advantages
of this method in data interpolation and estimation of
missing data. The missing data (V0) is estimated from
Equation (6).
Vo ¼ a0 þXni¼1
aiVið Þ (6)
where ai, a1,…,an are the regression coefficients.
MI
A single imputation ignored the estimation of variability,
which leads to an underestimation of standard errors and
confidence intervals. To overcome the underestimation pro-
blem, multiple imputation methods are used, where each
missing value is estimated with a distribution of imputation
reflecting uncertainty about the missing data. MI lead to the
best estimation of missing values. Since the rainfall data is
skewed to the right, the data needs to be transformed by
taking the natural logarithm of the observed data before the
method is applied. In some cases, the data may not have a
normal distribution with a logarithmic transformation. In
these cases, other transformation methods such as the Box-
Cox power transformations method (Box & Cox ) or
the Johnson transformation method (Luh & Guo )
could be applied. Then, the average of imputed data is calcu-
lated to provide the missing data at the target station (Radi
et al. ). In many studies, five imputed data sets are con-
sidered sufficient. For example, Schafer & Olsen ()
suggested that in many applications, three to five imputations
are sufficient. In this study, the statistical XLSTAT software
was used to generate multiple imputations.
NIPALS algorithm for missing data
The NIPALS algorithm was first presented by Wold ()
under the name NILES. It iteratively applies the principal
component analysis to the data set with missing values.
The main idea is to calculate the slope of the least squares
line that crosses the origin of the points of the observed
data. Here eigenvalues are determined by the variance of
the NIPALS components. The same algorithm can estimate
the missing data. The rate of convergence of the algorithm
depends on the percentage of the missing data (Tenenhaus
6 M.-T. Sattari et al. | Assessment of methods for estimating missing data in precipitation studies Hydrology Research | in press | 2016
Uncorrected Proof
). In this study, the statistical XLSTAT software is used
to generate the NIPALS algorithm.
UK traditional method
This method traditionally used by the UK Meteorological
Office to estimate missing temperature and sunshine data
was based on comparison with a single neighboring station
(Hasanpur Kashani & Dinpashoh ). In this study, the
ratio between the average rainfall at the target station
(Bandar Lengeh) and the average rainfall at the station
with the highest correlation (Kish Island) was calculated.
Then, that ratio was multiplied by the rainfall at the station
with the highest correlation to the target station.
Decision tree model
TheM5decision-treemodel is amodifiedversionof theQuinlan
() model, where linear functions rather than discrete class
labels (Ajmera & Goyal ; Sattari et al. ) are used at the
leaves. The M5 model is based on a divide-and-conquer
approach, working from the top to the bottom of the tree
(Witten & Frank ). This splitting criterion is based on the
standard deviation reduction (SDR) expressed in Equation (7),
SDR ¼ sd(T )�X Tij j
Tj jsd(Ti) (7)
where T is the set of examples that reaches the node, Ti rep-
resents the subset of examples that have the ith outcome of the
potential set, and sd represents the standard deviation.Applying
this procedure results in reduction of standard deviation in child
nodes. As a result, M5 chooses the final split as the one that
Table 2 | Results of homogeneity and trend test of selected stations
SNHT M
Station p-value Risk of rejecting H0 (%) p
Abomoosa Island 0.444 44.39 0
Bandar Abbas 0.214 21.40 0
Jask 0.201 20.09 0
Bandar Lengeh 0.168 16.81 0
Kish Island 0.159 15.9 0
Minab 0.640 64.03 0
maximizes the expected error reduction (Quinlan ). The
M5 decision tree may become too large due to overfitting with
test data. Quinlan () suggested pruning the overgrown tree.
Performance metrics
In order to compare accuracy of the discussed methods for
reconstructing missing monthly rainfall data, the following
four metrics, Equations (8)–(11), are used.
E ¼ 1�Pn
i¼1 (Xi � Yi)2Pn
i¼1 (Xi � �X)2 (8)
rpearson ¼Pn
i¼1 Xi � �X� �
Yi � �Y� �
ffiffiffiffiffiffiffiffiffiffiffiffiffiffiffiffiffiffiffiffiffiffiffiffiffiffiffiffiffiffiffiffiffiffiffiffiffiffiffiffiffiffiffiffiffiffiffiffiffiffiffiffiffiffiffiffiffiffiffiffiffiffiffiffiffiffiPni¼1 Xi � �X� �2Pn
i¼1 Yi � �Y� �2q (9)
MAE ¼ 1n
Xni¼0
Xi � Yij j (10)
RMSE ¼ffiffiffiffiffiffiffiffiffiffiffiffiffiffiffiffiffiffiffiffiffiffiffiffiffiffiffiffiffiffiffiffiffiPn
i¼0 (Yi �Xi)2
N
s(11)
where X is the observed value and Y denotes the computed
value.
Computational results
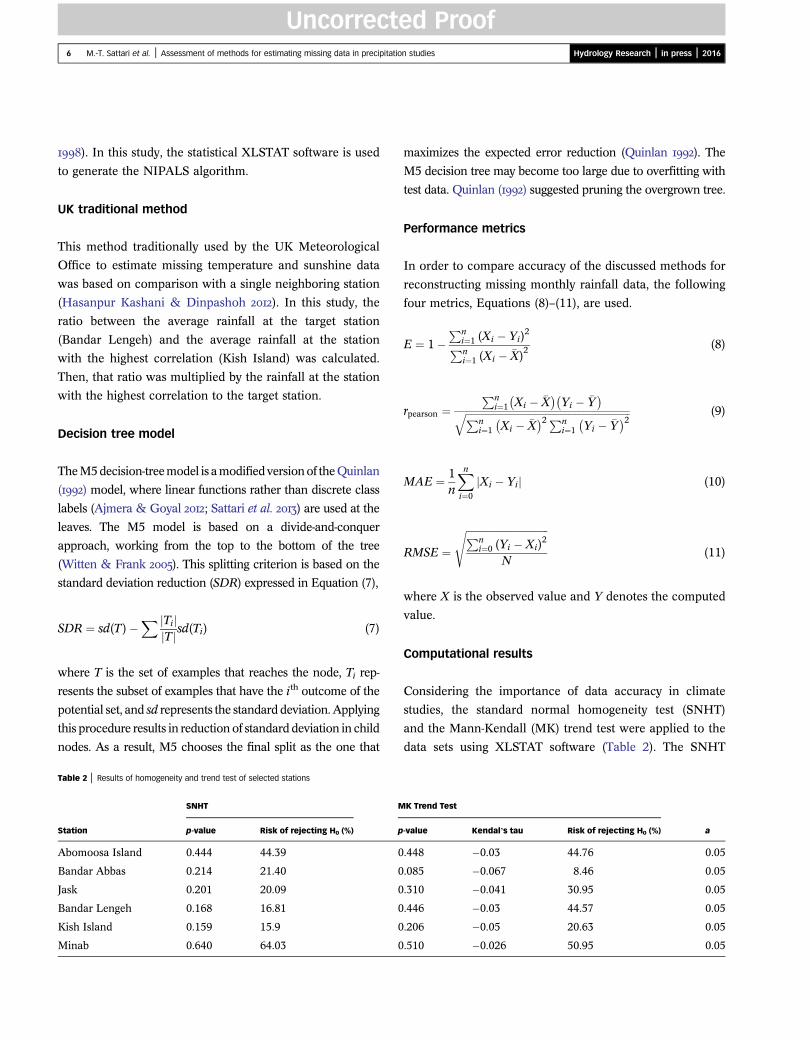
Considering the importance of data accuracy in climate
studies, the standard normal homogeneity test (SNHT)
and the Mann-Kendall (MK) trend test were applied to the
data sets using XLSTAT software (Table 2). The SNHT
K Trend Test
-value Kendal’s tau Risk of rejecting H0 (%) a
.448 �0.03 44.76 0.05
.085 �0.067 8.46 0.05
.310 �0.041 30.95 0.05
.446 �0.03 44.57 0.05
.206 �0.05 20.63 0.05
.510 �0.026 50.95 0.05
7 M.-T. Sattari et al. | Assessment of methods for estimating missing data in precipitation studies Hydrology Research | in press | 2016
Uncorrected Proof
test was developed by Alexanderson () to detect a
change in a series of rainfall data. The purpose of the MK
test (Mann ; Kendall ; Gilbert ) is to statistically
assess if there is a monotonic upward or downward trend of
the variable of interest over time.
In the SNHT, the null hypothesis (H0) was homogen-
eity of the data and the alternative hypothesis (H1) was
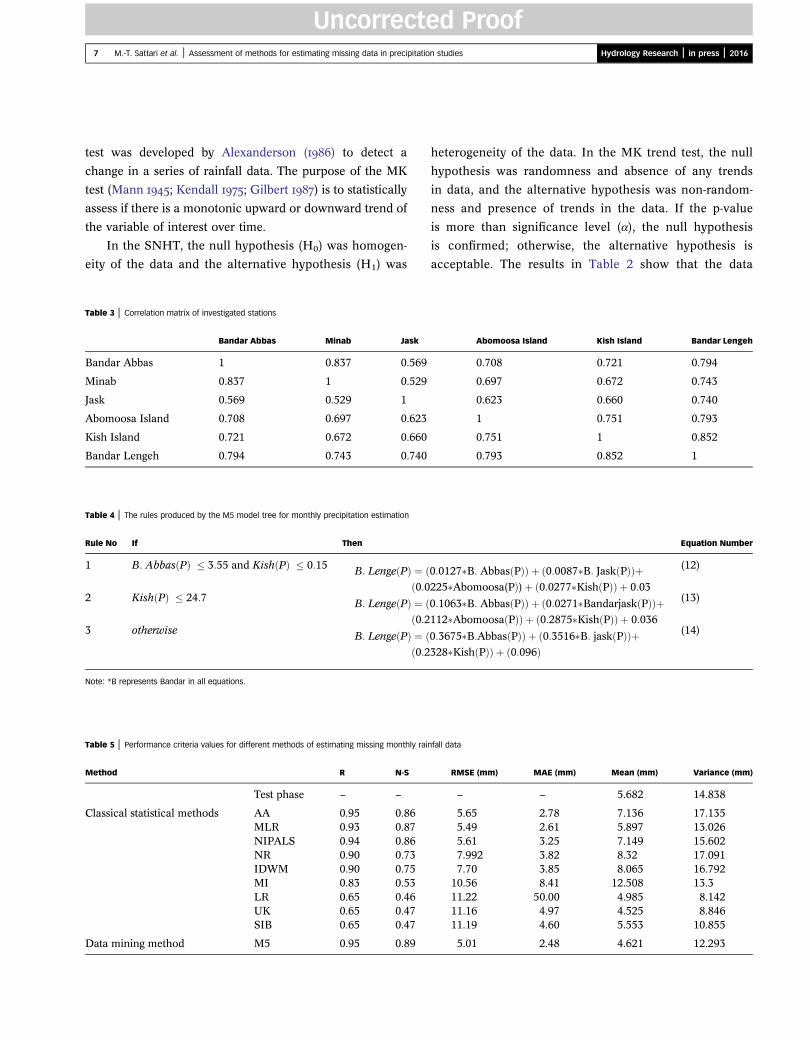
Table 3 | Correlation matrix of investigated stations
Bandar Abbas Minab Jask
Bandar Abbas 1 0.837 0.569
Minab 0.837 1 0.529
Jask 0.569 0.529 1
Abomoosa Island 0.708 0.697 0.623
Kish Island 0.721 0.672 0.660
Bandar Lengeh 0.794 0.743 0.740
Table 4 | The rules produced by the M5 model tree for monthly precipitation estimation
Rule No If Then
1 B: Abbas Pð Þ � 3:55 and Kish Pð Þ � 0:15 B: Lenge Pð Þ ¼ ð0:0ð
2 Kish Pð Þ � 24:7 B: Lenge Pð Þ ¼ ð0:2ð
3 otherwise B: Lenge Pð Þ ¼ ð0:2ð
Note: *B represents Bandar in all equations.
Table 5 | Performance criteria values for different methods of estimating missing monthly rai
Method R N-S
Test phase – –
Classical statistical methods AA 0.95 0.86MLR 0.93 0.87NIPALS 0.94 0.86NR 0.90 0.73IDWM 0.90 0.75MI 0.83 0.53LR 0.65 0.46UK 0.65 0.47SIB 0.65 0.47
Data mining method M5 0.95 0.89
heterogeneity of the data. In the MK trend test, the null
hypothesis was randomness and absence of any trends
in data, and the alternative hypothesis was non-random-
ness and presence of trends in the data. If the p-value
is more than significance level (α), the null hypothesis
is confirmed; otherwise, the alternative hypothesis is
acceptable. The results in Table 2 show that the data
Abomoosa Island Kish Island Bandar Lengeh
0.708 0.721 0.794
0.697 0.672 0.743
0.623 0.660 0.740
1 0.751 0.793
0.751 1 0.852
0.793 0.852 1
Equation Number
0:0127�B: Abbas Pð ÞÞ þ 0:0087�B: Jask Pð Þð Þþ225�Abomoosa(PÞ)þ 0:0277�Kish Pð Þð Þ þ 0:03
(12)
0:1063�B: Abbas Pð ÞÞ þ 0:0271�Bandarjask Pð Þð Þþ112�Abomoosa Pð ÞÞ þ 0:2875�Kish Pð Þð Þ þ 0:036
(13)
0:3675�B:Abbas Pð ÞÞ þ 0:3516�B: jask Pð Þð Þþ328�Kish Pð ÞÞ þ 0:096ð Þ
(14)
nfall data
RMSE (mm) MAE (mm) Mean (mm) Variance (mm)
– – 5.682 14.838
5.65 2.78 7.136 17.1355.49 2.61 5.897 13.0265.61 3.25 7.149 15.6027.992 3.82 8.32 17.0917.70 3.85 8.065 16.792
10.56 8.41 12.508 13.311.22 50.00 4.985 8.14211.16 4.97 4.525 8.84611.19 4.60 5.553 10.855
5.01 2.48 4.621 12.293

8 M.-T. Sattari et al. | Assessment of methods for estimating missing data in precipitation studies Hydrology Research | in press | 2016
Uncorrected Proof
related to monthly precipitation is homogeneous and
random at all stations and can be used with confidence.
The correlation of monthly precipitation at different
stations is important and applicable in modeling.
Figure 2 | Scatter diagram of predicted and observed precipitation values generated by (a) AA
Hence, the correlation between the monthly precipitation
at different stations was investigated (Table 3). The
synoptic station of Bandar Lengeh was used as the
target station.
, (b) MLR, (c) NIPALS, (d) NR, (e) IDWM, (f) MI, (g) LR, (h) UK, (i) SIB, (j) M5.

Figure 2 | continued.
9 M.-T. Sattari et al. | Assessment of methods for estimating missing data in precipitation studies Hydrology Research | in press | 2016
Uncorrected Proof
As seen in Table 3, the precipitation at the Bandar
Lengeh station is most correlated with the Kish Island,
Bandar Abbas, and Abomoosa Island stations, respectively.
Latitude is a key factor behind varying precipitation levels
across different regions. Precipitation correlation values in
different stations are, therefore, positively correlated with
their respective latitude. As Table 3 indicates, precipitation
correlation values are greater between Bandar Lengeh and
Jask stations than between the Jask and Bandar Abbas
stations. This could be attributed to latitudinal proximity of
Bandar Abbas to Jask as well as to the evident comparability
of the two cities in terms of condition, which also applies to
other stations. Out of the total precipitation data at each
station, 10% was randomly assumed to be missing. The miss-
ing data was used as a test section and the residual one for
training. The number of neighboring stations employed in
different methods was dependent on the method. For
example, in the methods of LR, UK and SIB, only one
station’s data highly correlated with target station’s data
was employed, but in the AA, IDWM, MLR, NR and
NIPALS methods, all of neighboring stations were used.
In the M5 and MI methods, different combinations of
input parameters varying from 1 station to 5 stations were
used to see which one had better performance.
In the multiple imputation method, the best results were
obtained for data at 5 stations. In estimating the missing
values of precipitation at Bandar Lengeh, the M5 decision-
tree model was selected. The best results were obtained
when the data related to monthly precipitation at the
stations of Bandar Abbas, Jask, Abomoosa and Kish Islands
was used. The M5 model in the form of three decision rules
(involving linear Equations (12)–(14)) estimates the monthly
precipitation at the Bandar Lengeh station with relatively
acceptable accuracy. These rules are given in Table 4.

10 M.-T. Sattari et al. | Assessment of methods for estimating missing data in precipitation studies Hydrology Research | in press | 2016
Uncorrected Proof
Decision rule (1) above states that if the amount of
monthly precipitation at Bandar Abbas is equal or less
than 3.55 mm and the monthly precipitation at Kish Island
is equal or less than 0.15 mm, then monthly precipitation
in Bandar Lengeh is calculated from Equation (12). Rule 2
states that if the monthly precipitation at Kish Island is
equal to or less than 24.7, then the monthly precipitation
at Bandar Lengeh is calculated using Equation (13).
Figure 3 | Time series of predicted and observed values of precipitation generated by (a) AA,
According to rule 3, in other situations, the amount of
monthly precipitation at Bandar Lengeh is computed using
Equation (14). The results obtained from various classic stat-
istical methods and the M5 decision tree model are
presented in Table 5.
The results in Table 5 indicate that among the classical
statistical methods, simple AA, MLR, and the NIPALS
algorithm are most accurate. The accuracy of the AA
(b) MLR, (c) NIPALS, (d) NR, (e) IDWM, (f) MI, (g) LR, (h) UK, (i) SIB, (j) M5.

Figure 3 | continued.
11 M.-T. Sattari et al. | Assessment of methods for estimating missing data in precipitation studies Hydrology Research | in press | 2016
Uncorrected Proof
method could be due to the fact that the stations under study
were located at similar elevation conditions (about 5 to 30
meters above sea level) and followed a rather similar pre-
cipitation pattern. The AA and MLR methods may be used
in arid areas with similar elevation conditions. The decision
tree model provides quite accurate predictions with the cor-
relation coefficient of 0.95, N-S coefficient of 0.891, the root
mean square error of 5.066 mm, and the mean absolute
error of 2.48 mm. Scatter diagrams and time-series charts
produced by various methods are presented in Figures 2
and 3.
Figures 2 and 3 demonstrate that the decision tree algor-
ithms developed with the data preprocessed with the AA
method provided better results at the Bandar Lengeh station
compared with other approaches studied in this research.
Figure 4 illustrates the prediction results generated by the
(NIPALS) algorithm, AA, MLR, and the decision tree
(M5) algorithm. The data used by the models in Figure 4 ori-
ginated at the Bandar Lengeh station, and it contained
missing values. The examination of the results shows that
the SIB, LR, and UK methods have minimum accuracy
among all methods under the study. This can be due to the
nature of these methods, that is, only the precipitation
data from one station having maximum correlation with
the target station is used.
CONCLUSION
In the study reported in this paper, the monthly precipi-
tation data at six stations located in arid areas was
considered. The data collected was homogeneous, and no
trends were found. However, numerous values were miss-
ing. Different methods were applied to fill in the missing
data. The computational results demonstrated that among
classical statistical methods, AA, MLR, and the NIPALS
algorithm performed best. The high performance of AA
might be related to the location of research stations at a

Figure 4 | Time series of values predicted with four models with missing precipitation data.
12 M.-T. Sattari et al. | Assessment of methods for estimating missing data in precipitation studies Hydrology Research | in press | 2016
Uncorrected Proof
similar elevation (between 5 to 30 meters above sea level).
Therefore, using the AA method in arid areas with similar
elevation is suggested. The results indicated that the MLR
method was found to be suitable for estimating missing pre-
cipitation data. This result supports the findings of Eischeid
et al. (); Xia et al. (), and Hasanpur Kashani &
Dinpashoh (). Furthermore, Shih & Cheng ()
stated that the regression technique and the regional aver-
age can be applied to generate missing monthly solar
radiation data. They found the regression technique and
AA satisfactory in interpolating missing values. The mul-
tiple imputation method performed best when
precipitation data from five dependent stations was used.
This finding was supported by the results reported in
Radi et al. (). The research reported in this paper has
demonstrated that the results if-then rules produced by
the decision-tree algorithm provided high accuracy results
with the correlation coefficient of 0.95, Nash-Sutcliffe coef-
ficient of 0.89, root mean square error of 5.07 mm, and the
mean absolute error of 2.48 mm. Due to its simplicity and
high accuracy, the decision-tree model was suggested for
estimating the missing values of precipitation in non-arid
climates. Although the results reported in this paper were
derived from regions in a single country, the results
would be applicable to arid and semi-arid regions in
other countries. This is due to the fact that all arid and
semi-arid regions share the same or similar climate
conditions.
REFERENCES
Abraham, J. P., Baringer, M., Bindoff, N. L., Boyer, T., Cheng, L. J.,Church, J. A., Conroy, J. L., Domingues, C. M., Fasullo, J. T.,Gilson, J., Goni, G., Good, S. A., Gorman, J. M., Gouretski,V., Ishii, M., Johnson, G. C., Kizu, S., Lyman, J. M.,Macdonald, A. M., Minkowycz, W. J., Moffitt, S. E., Palmer,M. D., Piola, A. R., Reseghetti, F., Schuckmann, K.,Trenberth, K. E., Velicogna, I. & Willis, J. K. A review ofglobal ocean temperature observations: implications forocean heat content estimates and climate change. Reviews ofGeophysics 51, 450–483.
Abraham, J. P., Stark, J. R. & Minkowycz, W. J. Extremeweather: observations of precipitation changes in the USA,forensic engineering. Proceedings of the Institution of CivilEngineers 168, 68–70.
Ajmera, T. K. & Goyal, M. K. Development of stage–dischargerating curve using model tree and neural networks: anapplication to Peachtree creek in Atlanta. Expert Systemswith Applications 39, 5702–5710.
Alexanderson, H. A homogeneity test applied to precipitationdata. International Journal of Climatology 6, 661–675.
Box, G. E. P. & Cox, D. R. An analysis of transformations.Journal of Royal Statistical Society, Series B (Methodological)26, 211–252.
Che Ghani, N., Abuhasan, Z. & Tze Liang, L. Estimation ofmissing rainfall data using GEP: case study of raja river, AlorSetar, Kedah. Advances in Artificial Intelligence. http://dx.doi.org/10.1155/2014/716398, p. 5.
Cheng, L., Abraham, J., Goni, G., Boyer, T., Wijffels, S., Cowley,R., Gouretski, V., Reseghetti, F., Kizu, S., Dong, S., Bringas,F., Goes, F., Houpert, L., Sprintall, J. & Zhu, J. a XBTscience: assessment of XBT biases and errors. Bulletin of theAmerican Meteorological Society. Doi: 10.1175/BAMS-D-15-00031.1.

13 M.-T. Sattari et al. | Assessment of methods for estimating missing data in precipitation studies Hydrology Research | in press | 2016
Uncorrected Proof
Cheng, L., Zhu, J. & Abraham, J. P. b Global upper ocean heatcontent estimation: recent progresses and the remainingchallenges.Atmospheric andOceanic ScienceLetters8, 333–338.
Choge, H. K. & Regulwar, D. G. Artificial neural networkmethod for estimation of missing data. International Journalof Advanced Technology in Civil Engineering 2, 1–4.
Dastorani, M. T., Moghadamnia, A., Piri, J. & Rico-Ramirez, M. Application of ANN and ANFIS models forreconstructing missing flow data. Environment MonitoringAssessment. doi:10.1007/s10661-009-1012-8.
De Martonne, E. Aridité et Indices D’Aridité. Académie DesSciences. Comptes Rendus 182, 1935–1938.
De silva, R. P., Dayawansa, N. D. K. & Ratnasiri, M. D. Acomparison of methods used in estimating missing rainfalldata. Journal of Agricultural Sciences 3, 101–108.
Eischeid, J. K., Baker, C. B., Karl, T. R. & Diaz, H. F. Thequality control of long-term climatological data usingobjective data analysis. Journal of Applied Meteorology andClimatology 34, 2787–2795.
Gilbert, R. O. Statistical Methods for EnvironmentalPollution Monitoring. Wiley, NY.
Hasanpur Kashani, M. & Dinpashoh, Y. Evaluation ofefficiency of different estimation methods for missingclimatological data. Journal of Stochastic EnvironmentResearch Risk Assessment 26, 59–71.
Hosseini Baghanam, A. & Nourani, V. Investigating theability of artificial neural network (ANN) models to estimatemissing rain-gauge data. Journal of Recent Research inChemistry, Biology, Environment and Culture 19, 38–50.
Kendall, M. G. Rank Correlation Methods, 4th edn. CharlesGriffin, London.
Kim, J. & Pachepsky, A. Y. Reconstructing missing dailyprecipitation data using regression trees and artificial neuralnetworks for SWAT streamflow simulation. Journal ofHydrology 394, 305–314.
Luh, W. M. & Guo, J. H. Johnson’s transformation two-sample trimmed t and its bootstrap method for heterogeneityand non-normality. Journal of Applied Statistics 27, 965–973.
Lyman, J. & Johnson, G. Estimating annual global upper-ocean heat content anomalies despite irregular in situ oceansampling. J. Climate 21, 5629–5641.
Mann, H. B. Non-parametric tests against trend.Econometrica 13, 163–171.
Nkuna, T. R. & Odiyo, J. O. Filling of missing rainfall data inLuvuvhu river catchment using artificial neural networks.Journal of Physics and Chemistry of Earth 36, 830–835.
Paulhus, J. L. H. & Kohler, M. A. Interpolation of missingprecipitation records. Monthly Weather Review 80, 129–133.
Quinlan, J. R. Learning with Continuous Classes. In:Proceedings AI,92 (Adams & Sterling, eds), World Scientific,Singapore, pp. 343–348.
Radi, N., Zakaria, R. & Azman, M. Estimation of missingrainfall data using spatial interpolation and imputation
methods. AIP Conference Proceedings 1643, 42–48. DOI: 10.1063/1.4907423.
Sattari, M. T., Pal, M., Apaydin, H. & Ozturk, F. M5 modeltree application in daily river flow forecasting in Sohustream, Turkey. Water Resources 40, 233–242.
Schafer, J. L. & Olsen, M. K. Multiple imputations formultivariate missing-data problems: a data analysisperspective. Multivariate Behavioral Research 33, 545–571.
Shih, S. F. & Cheng, K. S. Generation of synthetic andmissing climatic data for Puerto Rico. Water ResourcesBulletin 25, 829–836.
Singh, V. P. Elementary Hydrology. Prentice Hall of India,New Delhi.
Te Chow, V., Maidment, D. R. & Mays, L. W. AppliedHydrology. McGraw-Hill, New York, ISBN-13: 978-0070108103.
Teegaravapu, R. S. V. Estimation of missing precipitationrecords integrating surface interpolation techniques andspatio-temporal association rules. Journal ofHydroinformatics 11, 133–146.
Teegaravapu, R. S. V. Statistical corrections of spatiallyinterpolated missing precipitation data estimates.Hydrological Process 28, 3789–3808.
Teegavarapu, R. S. V. & Chandramouli, V. Improvedweighting methods, deterministic and stochastic data-drivenmodels for estimation of missing precipitation records.Journal of Hydrology 312, 191–206.
Teegavarapu, R. S. V., Tufail, M. & Ormsbee, L. Optimalfunctional forms for estimation of missing precipitation data.Journal of Hydrology 374, 106–115.
Tenenhaus, M. La Régression PLS Théorie et Pratique.Editions Technip, Paris.
Wei, T. C. & McGuinness, J. L. Reciprocal Distance SquaredMethod: A Computer Technique for Estimating AreaPrecipitation. Technical Report ARS-Nc-8. US AgriculturalResearch Service, North Central Region, OH, USA.
Witten, I. H. & Frank, E. Data Mining: Practical MachineLearning Tools and Techniques with Java Implementations.Morgan Kaufmann, San Francisco.
Wold, H. Nonlinear Estimation by Iterative Least SquareProcedures. In: Research Papers in Statistics (F. David, ed.).Wiley, New York, pp. 411–444.
Xia, Y., Fabian, P., Stohl, A. & Winterhalter, M. Forestclimatology: estimation of missing values for Bavaria,Germany. Agricultural and Forest Meteorology 96, 131–144.
Xin, Y. Linear Regression Analysis: Theory and Computing.World Scientific, Vol. 1–2, ISBN 9789812834119.
You, J., Hubbard, K. G. & Goddard, S. Comparison ofmethods for spatially estimating station temperatures in aquality control system. International Journal of Climatology28, 777–787.
Young, K. C. A three-way model for interpolating monthlyprecipitation values.MonthlyWeather Review 120, 2561–2569.
First received 10 February 2016; accepted in revised form 3 August 2016. Available online 30 September 2016


![srep30175] Uncorrected proof](https://static.fdocuments.us/doc/165x107/625b0c1933f4415b212ded18/srep30175-uncorrected-proof.jpg)


