Unconventional Monetary Policy and Covered Interest Rate ...

Unc
onve
ntio
nal M
onet
ary
Polic
y
Unconventional Monetary Policies, Bank Lending and Sovereign Debt Holdings
Marco Pagano U. Naples Federico II, CSEF & EIEF
with Carlo Altavilla, ECB
Saverio Simonelli, U. Mannheim, U. Naples Federico II & CSEF
Conference on Monetary policy pass-through and credit markets
ECB, 27 October 2016
The opinions in this presentation are those of the authors and do not necessarily reflect the views of the European Central Bank and the Eurosystem.

Unc
onve
ntio
nal M
onet
ary
Polic
y
Outline
1. Unconventional monetary policies (UMP): US vs. EA
2. Do UMPs affect bank lending? Taxonomy and evidence so far
3. Novel contribution: • evaluate the impact of UMP on lending via a panel
VAR, using bank-level data • assess the role of sovereign debt holdings in the
transmission of UMP to bank lending • compare policies: LTRO vs. TLTRO & APP
4. Conclusions 2

Unc
onve
ntio
nal M
onet
ary
Polic
y
1. Unconventional monetary policies
Conventional monetary policies: conducted primarily by controlling short-term interest rates
Unconventional monetary policies (UMP): 1. Large-scale asset purchase programs: QE (US), SMP & APP (EA)
2. Liquidity provision programs: LTRO, VLTRO, TLTRO (EA)
3. Pure announcements: “whatever it takes” & OMT (EA)
Rationale: ineffectiveness of conventional monetary policy
Policy transmission channels broken: MBS market freeze (US), interbank market freeze (EA), sovereign-bank diabolic loop (EA)
Interest rates close to (zero) lower bound
3

Unc
onve
ntio
nal M
onet
ary
Polic
y
Official interest rates: a blunt weapon
0
1
2
3
4
5
6
Jan-07 Jan-08 Jan-09 Jan-10 Jan-11 Jan-12 Jan-13 Jan-14 Jan-15 Jan-16US FFR
U.S. Federal Fund rate
-1,00
0,00
1,00
2,00
3,00
4,00
5,00
6,00
Jan-07 Jan-08 Jan-09 Jan-10 Jan-11 Jan-12 Jan-13 Jan-14 Jan-15 Jan-16MLR DR MRO
ECB Marginal Lending, Marginal Refinancing and Deposit rates
4

Unc
onve
ntio
nal M
onet
ary
Polic
y
UMP timeline: program inception dates QE1
QE2
MEP QE3
SMP
VLTRO
OMT TLTRO1
APP
APP Extension
APP Enlargement & TLTRO2 Euro Area
United States
Asset purchase Liquidity provision Pure announcement 5

Unc
onve
ntio
nal M
onet
ary
Polic
y
Asset side of central bank balance sheet
0,0
0,5
1,0
1,5
2,0
2,5
3,0
3,5
4,0
4,5
Jan-07 Jan-09 Jan-11 Jan-13 Jan-15
Mortgage-backed securities held by the Federal Reserve U.S. Treasury securities held by the Federal Reserve
Trill
ion
USD
QE1 (MBS)
QE2 (TS)
QE3 (MBS & TS)
MEP
0
0,5
1
1,5
2
2,5
Jan-07 Jan-09 Jan-11 Jan-13 Jan-15
Longer-term refinancing operations, Euro trillion Securities held for monetary policy purposes, Euro trillion
Trill
ion
Euro
VLTRO SMP (start)
TLTRO1 APP &TLTRO2
Fed
ECB
6

Unc
onve
ntio
nal M
onet
ary
Polic
y
Emperor Tiberius tapped the imperial treasury “distributing throughout the banks a hundred million sesterces, and Credit was thus restored, and gradually private lenders were
found” (Tacitus, Annales, VI, 17, 1-3).
Not just a thing of the 21st century
UMPs date at least back to the 1st century AD
In 33 AD, the Roman empire – a highly integrated economic, monetary and financial area – faced a widespread panic, with massive deleveraging, real estate price deflation and bank closures
7
• allowing freedom to borrow without interest • for three years, • provided the borrower gave collateral to the
State in land for twice the amount.

Unc
onve
ntio
nal M
onet
ary
Polic
y
EA experience: natural testing ground
Which ECB policies had a larger effect on bank lending? Which role have banks’ sovereign holdings played in the
transmission of UMPs to bank lending? Corollary: would early adoption of APP and TLTRO
(instead of VLTRO) have made a difference?
Pro: rich variety of ECB programs to be compared
Con: not a clean experiment Sequential adoption: response to later programs may partly
be affected by adoption of prior ones
Programs adopted at different levels of stress & interest rates
8

Unc
onve
ntio
nal M
onet
ary
Polic
y
2. UMPs: which effects on bank lending?
Benchmark: irrelevance/neutrality of UMPs under complete and perfect markets (Wallace, 1981) MM “homemade arbitrage” argument: the private sector can
“undo” any public financial policy (= change in the public sector’s liability structure, with no change in fiscal policy)
With frictions and/or incomplete markets, UMPs can affect interest rates and lending via 3 channels: Expectation/signaling: signal of future monetary policies, e.g.
purchase of LT debt lowers CB’s incentive to raise interest rates
Portfolio substitution: change relative asset supplies ⇒ may affect yields of assets, including bank bonds and loans
Refinancing channel: increase supply and/or lower cost of CB’s liquidity for banks ⇒ if constrained, may expand lending
9

Unc
onve
ntio
nal M
onet
ary
Polic
y
2.1 QE/APP: yield-mediated effects
10
Expectation channel + portfolio substitution channel
LT public debt yields drop (Krishnamurti & Vissing-Jorgensen 2012 for US; Krishnamurti et al 2014, Altavilla, Carboni & Motto 2015, Andrade et al 2016, Koijen et al 2016 for EA)
Example: CB buys LT public debt
Banks make capital gain on public debt holdings ⇒ marked-to-market equity rises (“backdoor recap”)
Yields on bank bonds drop (if substitutes for LT public debt) ⇒ cost of bank capital drops
Banks want to reduce ratio of LT public debt to loans (if good substitutes)
Banks expand balance sheet Banks increase loans, lower rates
Evidence for EA: • Albertazzi, Becker & Boucinha (2016): APP-induced portfolio revaluation raises
purchase of low-priced securities in stressed countries, lending in non-stressed ones. • Altavilla, Canova & Ciccarelli (2016): in response to APP, banks lower lending rates.

Unc
onve
ntio
nal M
onet
ary
Polic
y
2.2 QE/APP: refinancing effects
11
Direct bank refinancing channel
Bank uses fresh cash to issue more MBS or covered bonds
Case #1: CB buys MBS or covered bond from bank
Bank expands balance sheet: possibly increases loans, lowers lending rates
Evidence for EA:
• Altavilla, Canova & Ciccarelli (2016): in respose to APP, banks lower lending rates.
• On indirect bank refinancing channel: self-reported evidence from Bank Lending Survey.
But: (i) “flypaper effect” (Di Maggio, Kermani & Palmer, 2016) or crowding out of other loans (Chakraborti, Goldstein & MacKinlay, 2016)
Case #2: CB buys public debt
Indirect bank refinancing: non-banks sell public debt to CB and deposit money at banks

Unc
onve
ntio
nal M
onet
ary
Polic
y
Bank deposit (indirect) channel
General equilibrium feedback: even if banks had not sold public debt to the ECB, the APP would have been effective…
… but in addition banks did sell public debt to the ECB: portfolio rebalancing (Koijen et al., 2016) as well. More on this below…
Sectoral contributions to M3 deposit growth (annual percentage changes, monthly)
Self-reported impact of the expanded APP on banks’ financial situation (BLS data)
12

Unc
onve
ntio
nal M
onet
ary
Polic
y
2.3 LTRO: rebalancing and/or refinancing
13
Portfolio substitution channel: use liquidity to buy public debt holdings (“indirect QE”) or hoard cash. This “leakage” is minimized for TLTRO.
LT public debt yields drop (Krishnamurti et al 2014: esp. default risk premium ↓)
Example: banks borrow from CB using public debt as collateral
Refinancing channel: use liquidity to lend more. Maximal for the TLTRO : functionally equivalent to QE purchase of MBS or covered bonds.
AND/OR
Evidence for EA:
• Andrade et al. (2015), Garcia-Posada & Marchetti (2015) and Carpinelli & Crosignani (2016): French. Spanish and Italian banks increased lending in response to the VLTRO of 2011-12.
• Crosignani, Faria-e-Castro & Fonseca (2015) and Carpinelli & Crosignani (2016): Portuguese and Italian banks used some VLTRO financing to buy domestic sovereign bonds (“leakage”). On this, see also Drechsler et al. (2016) and Altavilla et al. (2015).
Bank lending increases, bank loan rates drop

Unc
onve
ntio
nal M
onet
ary
Polic
y
TLTRO: EA bank survey responses
Functionally equivalent to APP: both TLTRO and APP have contributed to (i) bank lending and (ii) reduction of loan rates, especially to firms
But TLTRO has affected a larger number of banks: more widespread and direct refinancing effect than the APP, which consists mainly of public debt purchases
Use of liquidity from TLTRO and expanded APP (% of BLS respondents, referring to previous 6 months)
Impact of TLTRO and expanded APP on loan rates (% of BLS respondents, referring to previous 6 months)
14

Unc
onve
ntio
nal M
onet
ary
Polic
y
2.4 OMT: pure announcement effect
15
Expectation / signaling channel operating via off-equlibrium purchases of stressed debt
LT public debt yields drop (Krishnamurti et al 2014, Altavilla, Giannone & Lenza 2015: esp. default risk premium ↓)
ECB announces that in case of market distress it is ready to buy stressed public debt with some conditionality
Evidence for EA:
• Acharya et al. (2015): due to their large domestic sovereign holdings, the OMT announcement led to a “backdoor recapitalization” of stressed-country banks , which led to an increased supply of bank loans
• Altavilla, Pagano & Simonelli (2015): this backdoor recapitalization is just the “other side of the coin” of the previous amplification due to the drop in the value of banks’ sovereign holdings, which had amplified the drop in lending in stressed countries.
Bank lending increases, loan rates drop.

Unc
onve
ntio
nal M
onet
ary
Polic
y
Estimated amplification effect in stressed countries
16 Source: Altavilla, Pagano & Simonelli, 2015.

Unc
onve
ntio
nal M
onet
ary
Polic
y
3. Estimating lending responses to UMPs
Identification of UMP shocks: high-frequency event study approach Monthly EA bank-level data for (i) loans to non-financial
firms and households and (ii) sovereign holdings: • 144 (head) banks, from 2007 to 2016
Panel VAR specification: allows us to compute impulse response to shocks by different subsets of banks:
• based in different countries
• with different characteristics or initial conditions (public/private, well/poorly capitalized): to be done!
Compare responses to different types of UMP shocks
17

Unc
onve
ntio
nal M
onet
ary
Polic
y
3.1 Growth of loans & sovereign holdings
18
-0,90
-0,60
-0,30
0,00
0,30
0,60
0,90
-0,15
-0,10
-0,05
0,00
0,05
0,10
0,15
2008 2009 2010 2011 2012 2013 2014 2015 2016
GERMANY
-0,50
-0,25
0,00
0,25
0,50
-0,15
-0,10
-0,05
0,00
0,05
0,10
0,15
2008 2009 2010 2011 2012 2013 2014 2015 2016
FRANCE
-0,50
-0,25
0,00
0,25
0,50
-0,15
-0,10
-0,05
0,00
0,05
0,10
0,15
2008 2009 2010 2011 2012 2013 2014 2015 2016
ITALY
-1,00
-0,75
-0,50
-0,25
0,00
0,25
0,50
0,75
1,00
-0,15
-0,10
-0,05
0,00
0,05
0,10
0,15
2008 2009 2010 2011 2012 2013 2014 2015 2016
SPAIN
Sovereign holdings (RHS scale) Total loans (LHS scale)

Unc
onve
ntio
nal M
onet
ary
Polic
y
3.2 Identification of UMP shocks
19
Example: 22 January 2015, announcement of APP

Unc
onve
ntio
nal M
onet
ary
Polic
y
Event study methodology
20
daily change in country c’s 3-year sovereign yield
1 if t ∈ event set (with k = 25)
0 otherwise
surprise component of macro release (with m = 40)
See Altavilla & Giannone (2016), “The Effectiveness of Non-standard Monetary Policy Measures: Evidence from Survey Data,” Journal of Applied Econometrics.
, , , , ,1 1
k msovc t j c j t s s t c t
j sy D Newsα γ ε
= =∆ = + +∑ ∑
,sovc ty∆ =
,j tD =
,s tNews =

Unc
onve
ntio
nal M
onet
ary
Polic
y
3-year sovereign yield ( )
21
-2
0
2
3
5
6
8
9
-2
0
2
3
5
6
8
9
2007 2009 2011 2013 2015
Germany Spain France Italy
,sovc ty∆

Unc
onve
ntio
nal M
onet
ary
Polic
y
UMP shocks ( )
22
Germany France
Italy Spain
-30
-20
-10
0
10
20
30
-30
-20
-10
0
10
20
30
Jun-07 Jun-09 Jun-11 Jun-13 Jun-15-30
-20
-10
0
10
20
30
-30
-20
-10
0
10
20
30
Jun-07 Jun-09 Jun-11 Jun-13 Jun-15
-30
-20
-10
0
10
20
30
-30
-20
-10
0
10
20
30
Jun-07 Jun-09 Jun-11 Jun-13 Jun-15-30
-20
-10
0
10
20
30
-30
-20
-10
0
10
20
30
Jun-07 Jun-09 Jun-11 Jun-13 Jun-15
,ˆ j j tDα

Unc
onve
ntio
nal M
onet
ary
Polic
y
3.3 Panel VAR specification
23
• yearly growth of bank i’s domestic sovereign holdings
• yearly growth of bank i’s loans to non-financial firms and households in country c and month t • monetary policy shock in country c and month t
(from event study) • unemployment rate in country c and month t
0 1 1 1
1
( ) ( )( )
ict ic ic ict ci ct ict
ct c ct ct
Y A A L Y B L XX L X
ερ η
− −
−
= + + +
= +
1, ,144 1, ,8 July 2007, , August 2016i c t= … = … =
banks countries months
ictY =
ctX =

Unc
onve
ntio
nal M
onet
ary
Polic
y
Assumptions
For each bank, the dynamic interactions among endogenous variables follow an unrestricted VAR Block-recursive structure:
• country-level variables are affected only by their own lags • bank-level variables are affected both by their own lags
and by country-level variables
We want to ensure that differences in bank lending responses do not reflect differences in the country-level dynamics of sovereign yields
⇒ constrain 𝜌𝑐 to be equal to the median for all banks irrespective of country
24

Unc
onve
ntio
nal M
onet
ary
Polic
y
3.4 Estimated impact of UMP shocks
Question #1: How did UMPs affect bank lending and domestic sovereign holdings?
• Estimate VAR for each bank with Bayesian technique • Compute the IRFs for each bank • Group banks’ IRFs by stressed / non-stressed countries
Question #2: How would the lending of bank i have reacted to the UMP if it had not changed its holdings of domestic sovereign debt?
• Constrain to zero the response of its sovereign debt holdings • Compute the IRFs for each bank • Group banks’ IRFs by stressed / non-stressed countries
25
Unc
onve
ntio
nal M
onet
ary
Polic
y
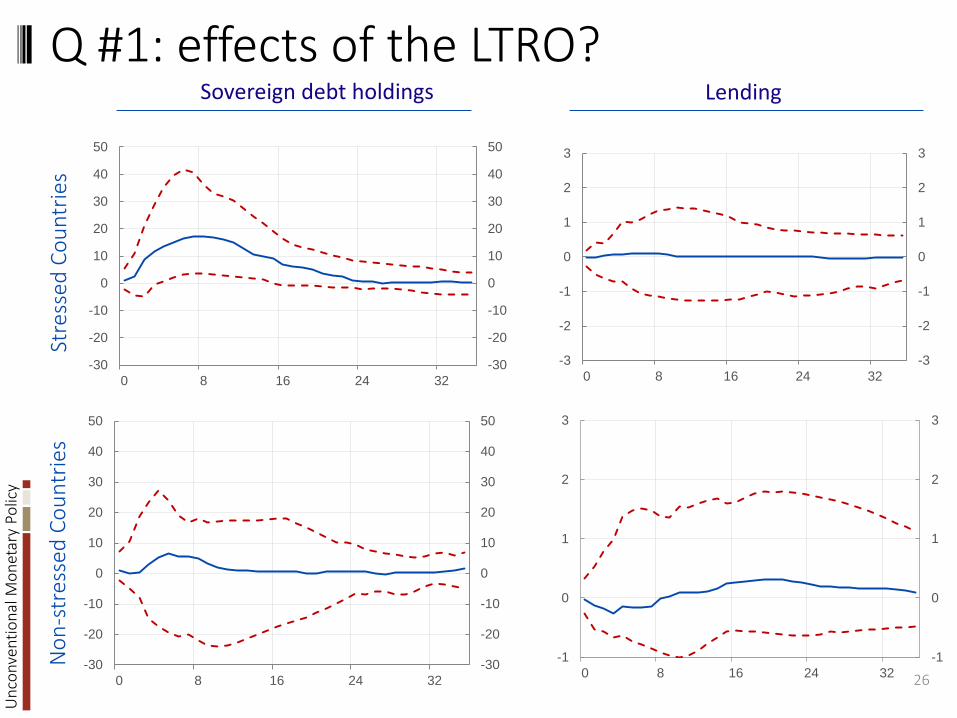
Q #1: effects of the LTRO?
26
Sovereign debt holdings Lending St
ress
ed C
ount
ries
Non
-str
esse
d Co
untr
ies
-30
-20
-10
0
10
20
30
40
50
-30
-20
-10
0
10
20
30
40
50
0 8 16 24 32-3
-2
-1
0
1
2
3
-3
-2
-1
0
1
2
3
0 8 16 24 32
-30
-20
-10
0
10
20
30
40
50
-30
-20
-10
0
10
20
30
40
50
0 8 16 24 32
-1
0
1
2
3
-1
0
1
2
3
0 8 16 24 32

Unc
onve
ntio
nal M
onet
ary
Polic
y
LTRO bank-level responses, stressed countries
27
5 10 15 20 25 30 35-4
-3
-2
-1
0
1
2
3
4
5 10 15 20 25 30 35-20
-10
0
10
20
30
40
50
60
70
80 Lending Sovereign debt holdings

Unc
onve
ntio
nal M
onet
ary
Polic
y
Q #2: LTRO with constant sov. holdings?
28
Lending with unconstrained sov. holdings
Stre
ssed
Cou
ntrie
s N
on-s
tres
sed
Coun
trie
s
Lending with constrained sov. holdings
-3
-2
-1
0
1
2
3
-3
-2
-1
0
1
2
3
0 8 16 24 32-0,5
0,0
0,5
1,0
1,5
2,0
2,5
3,0
-0,5
0,0
0,5
1,0
1,5
2,0
2,5
3,0
0 8 16 24 32
-1
0
1
2
3
-1
0
1
2
3
0 8 16 24 32-1
0
1
2
3
-1
0
1
2
3
1 9 17 25 33

Unc
onve
ntio
nal M
onet
ary
Polic
y Constrained vs. unconstrained bank-level lending responses to LTRO, stressed countries
29
Lending with constrained domestic sovereign holdings
Lending with unconstrained domestic sovereign holdings
5 10 15 20 25 30 35-4
-3
-2
-1
0
1
2
3
4
5 10 15 20 25 30 35-4
-3
-2
-1
0
1
2
3
4

Unc
onve
ntio
nal M
onet
ary
Polic
y
Re-cap: responses to LTRO
Only statistically significant response: increase in domestic sovereign holdings of stressed-country banks Great heterogeneity in the responses of stressed-country
banks – both for lending and sovereign debt holdings: • in particular, two groups of banks with sharply different
responses of sovereign holdings: one that strongly increased them, and one that did not respond or reduced them slightly
With sovereign holdings constrained to stay constant • lending by banks in stressed countries rises significantly • heterogeneity in their responses is much reduced • lending by banks in non-stressed countries is unaffected
30

Unc
onve
ntio
nal M
onet
ary
Polic
y
Q #1: effects of the APP and the TLTRO?
31
-1
0
1
2
3
-1
0
1
2
3
0 8 16 24 32
Sovereign Holdings Lending St
ress
ed C
ount
ries
Non
-str
esse
d Co
untr
ies
-30
-25
-20
-15
-10
-5
0
5
-30
-25
-20
-15
-10
-5
0
5
0 8 16 24 32
-1
0
1
2
3
-1
0
1
2
3
0 8 16 24 32-25
-15
-5
5
15
25
-35
-25
-15
-5
5
15
25
0 8 16 24 32

Unc
onve
ntio
nal M
onet
ary
Polic
y Bank-level lending responses to APP & TLTRO, stressed and non-stressed countries
32
Lending in non-stressed countries Lending in stressed countries
5 10 15 20 25 30 35-1
0
1
2
3
4
5
6
5 10 15 20 25 30 35-1
0
1
2
3
4
5
6

Unc
onve
ntio
nal M
onet
ary
Polic
y
Q #2: APP & TLTRO with constant sov. holdings?
33
-1
0
1
2
3
-1
0
1
2
3
0 8 16 24 32
Lending with unconstrained sov. holdings
Stre
ssed
Cou
ntrie
s N
on-s
tres
sed
Coun
trie
s
-1
0
1
2
3
-1
0
1
2
3
0 8 16 24 32
Lending with constrained sovereign holdings
-1
0
1
2
3
-1
0
1
2
3
0 8 16 24 32-1
0
1
2
3
-1
0
1
2
3
1 9 17 25 33

Unc
onve
ntio
nal M
onet
ary
Polic
y
Re-cap: responses to APP and TLTRO
Statistically significant reduction of domestic sovereign holdings by stressed-country banks Statistically significant increase of lending both in stressed
and non-stressed countries Much more homogeneous responses of lending in both
groups of countries than in the case of LTRO With sovereign holdings constrained to stay constant,
no appreciable difference in the response of lending • This suggests that sovereign bond sales by banks in
response to the APP had a minor role in increasing lending • The APP must have operated via other channels: yield-
reduction channel, indirect refinancing channel (see above)
34
Unc
onve
ntio
nal M
onet
ary
Polic
y
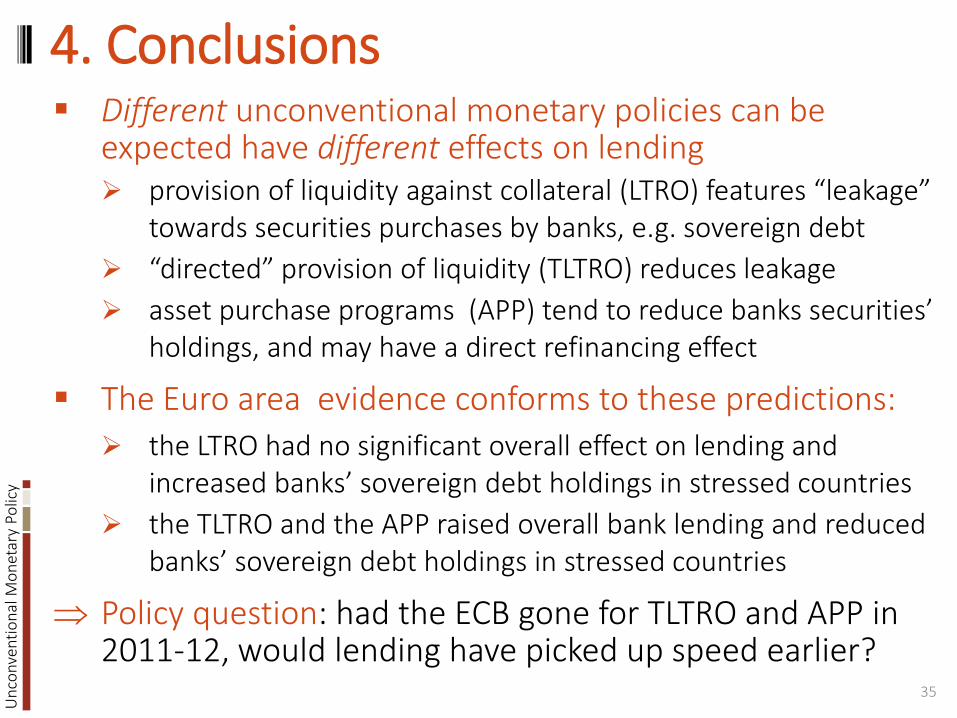
Different unconventional monetary policies can be expected have different effects on lending provision of liquidity against collateral (LTRO) features “leakage”
towards securities purchases by banks, e.g. sovereign debt “directed” provision of liquidity (TLTRO) reduces leakage asset purchase programs (APP) tend to reduce banks securities’
holdings, and may have a direct refinancing effect
The Euro area evidence conforms to these predictions: the LTRO had no significant overall effect on lending and
increased banks’ sovereign debt holdings in stressed countries the TLTRO and the APP raised overall bank lending and reduced
banks’ sovereign debt holdings in stressed countries
⇒ Policy question: had the ECB gone for TLTRO and APP in 2011-12, would lending have picked up speed earlier?
35
4. Conclusions

Unc
onve
ntio
nal M
onet
ary
Polic
y
36
Sample: 306 banks
AT BE CY DE EE ES FI FR GR IE IT LT LU LV MT NL PT SI SK0
10
20
30
40
50
60
Head institutionDomestic SubsidiaryForeign Subsidiary

Unc
onve
ntio
nal M
onet
ary
Polic
y
37
Ratio of Domestic Sov. Holdings to Main assets
2010 2012 2014 20160
2
4
6
8
10
12
14
16Stressed Countries
2010 2012 2014 20160
2
4
6
8
10
12
14
16Non-stressed Countries

Unc
onve
ntio
nal M
onet
ary
Polic
y
38
Domestic Sovereign holdings - yoy growth rate
2009 2010 2011 2012 2013 2014 2015 2016
-20
0
20
40
60
80
Stressed Countries
2009 2010 2011 2012 2013 2014 2015 2016-30
-20
-10
0
10
20
30
40
50
60
Non-stressed Countries

Unc
onve
ntio
nal M
onet
ary
Polic
y
39
Loans to NFCs – yoy growth rate
2009 2010 2011 2012 2013 2014 2015 2016-15
-10
-5
0
5
10
15
20Stressed Countries
2009 2010 2011 2012 2013 2014 2015 2016-15
-10
-5
0
5
10
15
20Non-stressed Countries