Unconfined Compressive Strength of Vermont Rock December 2015
19
Unconfined Compressive Strength of Vermont Rock December 2015 State of Vermont Agency of Transportation Construction and Materials Bureau Geotechnical Engineering Section Chris Cole, Secretary of Transportation Kevin Marshia, Director of Highway Division David Hoyne, Director of Construction and Materials Prepared by: ________________________ Ethan J. Thomas Technician Apprentice ________________________ Thomas D. Eliassen, P.G. Transportation Geologist Reviewed by: Christopher C. Benda, P.E. Geotechnical Engineering Manager Date: 12/7/2015
Transcript of Unconfined Compressive Strength of Vermont Rock December 2015

Unconfined Compressive Strength of Vermont Rock
December 2015
State of Vermont
Agency of Transportation
Construction and Materials Bureau
Geotechnical Engineering Section
Chris Cole, Secretary of Transportation
Kevin Marshia, Director of Highway Division
David Hoyne, Director of Construction and Materials
Prepared by:
________________________
Ethan J. Thomas
Technician Apprentice
________________________
Thomas D. Eliassen, P.G.
Transportation Geologist
Reviewed by:
Christopher C. Benda, P.E.
Geotechnical Engineering Manager
Date: 12/7/2015

INTRODUCTION
One of the parameters considered during the design process for bridges includes the unconfined
compressive strength (UCS) of rock supporting their foundations. On many projects, the Agency will test
rock cores to acquire this information. In some instances, rock cores may not be available and therefore
this information is not known and our engineers are left to look up typical values published in text books
or presented in professional papers. The Vermont Agency of Transportation (VTrans) has been
conducting UCS testing since 2007 and it became apparent that a cataloging of test values could be of
great benefit to our engineers for estimating purposes. The purpose of this analysis was to provide an
“in house” reference document that accurately reflects the average UCS of rocks found in Vermont.
Accurate UCS values of rock within Vermont will be a useful tool for VTrans engineering staff, in regards
to estimating compressive strengths for designs of structures. Currently VTrans engineering staff use
published values of compressive strength of rock for design purposes of structures such as bridge
footings, abutments, and piers when site specific test results are not available. Those published values
reflect strengths from rocks that may contain differing and varying mineralogies, as well as having been
formed under and subjected to different geologic processes than those in Vermont. Using published
values of compressive strength may lead to over design of projects resulting in increased project costs.
The UCS data obtained from the testing of rock cores is also used to calculate the Modulus of Elasticity
(Young’s Modulus). Young’s Modulus is a measurement of the force needed to stretch or compress a
material. The higher the Young’s Modulus, the stiffer the material is.
GEOLOGY
The bedrock of Vermont consists of north-south trending belts of metamorphic, sedimentary, and meta-
sedimentary rocks, with scattered igneous intrusions in the northeastern section of the state as well as a
few scattered intrusions in the southeastern section of the state. A generalized geologic map of
Vermont is shown in Figure 1.
The lithology of the bedrock within Vermont is highly variable. Some of the more common
metamoprhic rocks found within the state include slate, phyllite, schist, gneiss, amphibolite, marble,
hornfels, greenschist, greenstone, serpentinite, granulite, and quartzite.
Igneous rocks found within the state include granite, granodiorite, diorite, quartz-monzonite, tonalite,
andesite, and basalt.
Sedimentary rocks found within the state include shale, siltstone, limestone, dolostone, conglomerates,
and sandstones. The sedimentary rocks within Vermont are not true sedimentary rocks, meaning that
they have undergone at least some form of low grade metamorphism. However, in some cases, the
degree of metamorphism has not been great enough to turn these sedimentary rocks into true
metamorphic rocks. Hence, geologists in the Northeast commonly refer to these sedimentary rocks as
“meta-sedimentary”.

The majority of rocks within Vermont have undergone extensive tectonic deformation caused by at
most three orogenic (mountain building) events, meaning that the rocks are highly fractured and folded.
The presence of the discontinuities caused by these orogenic events can reduce the unconfined
compressive strength of the rock mass. Discontinuities within rock masses include foliation, jointing,
cleavage, healed fractures, veins, faults, and folds.
Experimental work by others has been performed in order to understand the effect of orientation of
structures within rock cores on the compressive strength of the rock. Nasseri et al. (Nasseri et al.
Anisotropic strength and deformational behavior of Himalayan schists / International Journal of Rock
Mechanics & Mining Sciences 40 (2003) p. 3-23) has shown that the UCS of schistose rock cores is
highest when the stress is applied perpendicular to the structures. This implies that the steeper the
angle of the structure, the lower the UCS will be.
METHODOLOGY
The procedure for selecting and testing rock core samples to determine UCS is beyond the scope of this
paper. The document detailing the process of selecting and testing rock core samples to determine UCS
(VT-AOT-MRD 58-12) is attached as Appendix A.
A list of past projects that rock core testing has been performed for was created. From this list
information such as project number, sample number, rock type, diameter of sample rock core, length of
sample rock core, UCS, and Young’s Modulus was compiled within a spreadsheet. Photographs of the
rock core samples were analyzed in order to determine if the rock core broke along a pre-existing
structure within the rock or if it was free of pre-existing discontinuities (Figure 2). The presence of
discontinuities were also noted in the spreadsheet.
The rock core samples were then sorted by lithology and the average UCS was calculated, as well as
average Young’s Modulus values. Charts were then made showing average UCS by lithology, as well as
charts showing average Young’s Modulus by lithology.

Figure 1: Generalized Geologic Map of Vermont

Figure 2: These rock cores tested in the VTrans laboratory are of marble (from the same source). Compressive
strengths of the rock cores were 10,800 psi and 6,360 psi respectively. The rock core depicted in (A) contained no
discontinuities. Core (B) contained a discontinuity which cut across the core at about 45°. Notice that core (B) failed
along the existing discontinuity. The force applied to this core was not transmitted uniformly through the core length
resulting in a lower UCS value.
RESULTS
A total of 162 rock cores were tested for UCS from 2007 to 2015. 106 rock cores were classified as
metamorphic, 25 rock cores were classified as meta-sedimentary / sedimentary, 14 rock cores were
classified as igneous, and 17 rock cores were classified as metamorphic & meta-sedimentary /
sedimentary. A chart depicting the number of rock cores tested sorted by lithology and rock type is
presented as Figure 3.
A B

Figure 3: The number of rock cores tested sorted by lithology and rock type. Note the majority of samples tested are metamorphic. The samples represented
by the blue color represent rock cores with a dual lithology. They are composed of both metamorphic and meta-sedimentary/sedimentary rocks.
0
1
2
3
4
5
6
7
8
9
10
11
12
13
14
15
16
17
18
19
Nu
mb
er o
f R
ock
Co
res
Rock Cores Tested sorted by Rocktype MetamorphicIgneousMeta-Sedimentary/SedimentaryMetamorphic & Meta-Sedimentary/Sedimentary

The following charts depict average UCS sorted by lithology. The first chart (Figure 4) consists of average
UCS values of all lithologies, including rock cores that did break along pre-existing discontinuities. Some
lithologies of rock cores that were tested only failed along pre-existing discontinuities.
The second chart (Figure 5) consists of average UCS values of lithologies that did not break along pre-
existing discontinuities. These values better reflect actual rock strength.
The third chart (Figure 6) compares the average UCS of rock cores that broke along pre-existing
discontinuities with the average UCS of rock cores that did not.
The fourth chart (Figure 7) shows the average UCS for rock cores with a simplified lithology. UCS values
for rock cores with differing mineralogies but having the same rock name classification were grouped
together. This was done in order to provide a simpler and more easily used chart to look up average
UCS values.
The fifth chart (Figure 8) shows the average Young’s Modulus values for rock cores with a simplified
lithology.
All the data that was analyzed can be found in an excel file in the following link:
file:///Z:\Highways\ConstructionMaterials\GeotechEngineering\Geology\UCS%20of%20Rock%20Cores\
UCS%20Rock%20Master%20List.xlsx

Figure 4: Graph of average compressive strength sorted by lithology.
0
2,000
4,000
6,000
8,000
10,000
12,000
14,000
16,000
18,000
20,000
22,000
24,000
26,000
28,000
Ave
rage
Un
con
fin
ed C
om
pre
ssiv
e St
ren
gth
(p
si)
Average Unconfined Compressive Strength* (psi) by Lithology
*Includes compressive strength data from cores that broke along pre-existing structures.
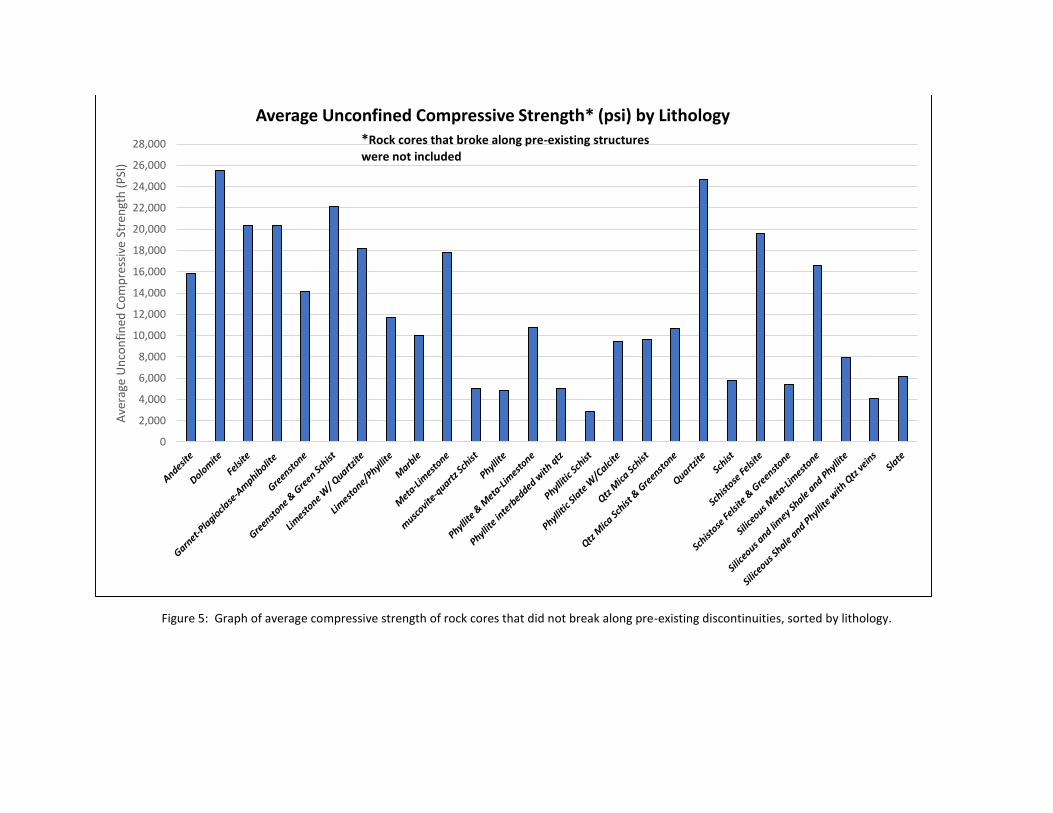
Figure 5: Graph of average compressive strength of rock cores that did not break along pre-existing discontinuities, sorted by lithology.
0
2,000
4,000
6,000
8,000
10,000
12,000
14,000
16,000
18,000
20,000
22,000
24,000
26,000
28,000
Ave
rage
Un
con
fin
ed C
om
pre
ssiv
e St
ren
gth
(P
SI)
Average Unconfined Compressive Strength* (psi) by Lithology*Rock cores that broke along pre-existing structures
were not included

Figure 6: The average compressive strength of all rock cores tested in unconfined compression versus the average compressive strength of rock cores that failed
along pre-existing discontinuities and those that did not fail along pre-existing discontinuities. Note that in all cases, the average compressive strength of rock
cores that did not break along pre-existing discontinuities is higher than those that did.
0
2,000
4,000
6,000
8,000
10,000
12,000
14,000
16,000
18,000
20,000
22,000
24,000
26,000
Ave
rage
Un
con
fin
ed C
om
pre
ssiv
e St
ren
gth
(p
si)
Average Unconfined Compressive Strength (psi) of Rock Cores by Lithology
Average Compressive Strength with Breaks along Structures Average Compressive Strength of all Samples
Average Compressive Strength with no Breaks Along Structures

Figure 7: Average UCS by simplified lithology. All UCS values used to calculate the average UCS includes rock cores that contained discontinuities and rock cores
that did not contain discontinuities.
0
2,500
5,000
7,500
10,000
12,500
15,000
17,500
20,000
22,500
25,000
27,500
Ave
rage
Un
con
fin
ed C
om
pre
ssiv
e St
ren
gth
(p
si)
Average Unconfined Compressive Strength (psi) by Lithology (Simplified)

Figure 8: Average Young’s Modulus sorted by simplified lithology.
0
1
2
3
4
5
6
7
8
9
10
11
12
13
14
Ave
rage
Yo
un
g's
Mo
du
lus
(psi
)
Mill
ion
sAverage Young's Modulus (psi) by Simplfied Lithology
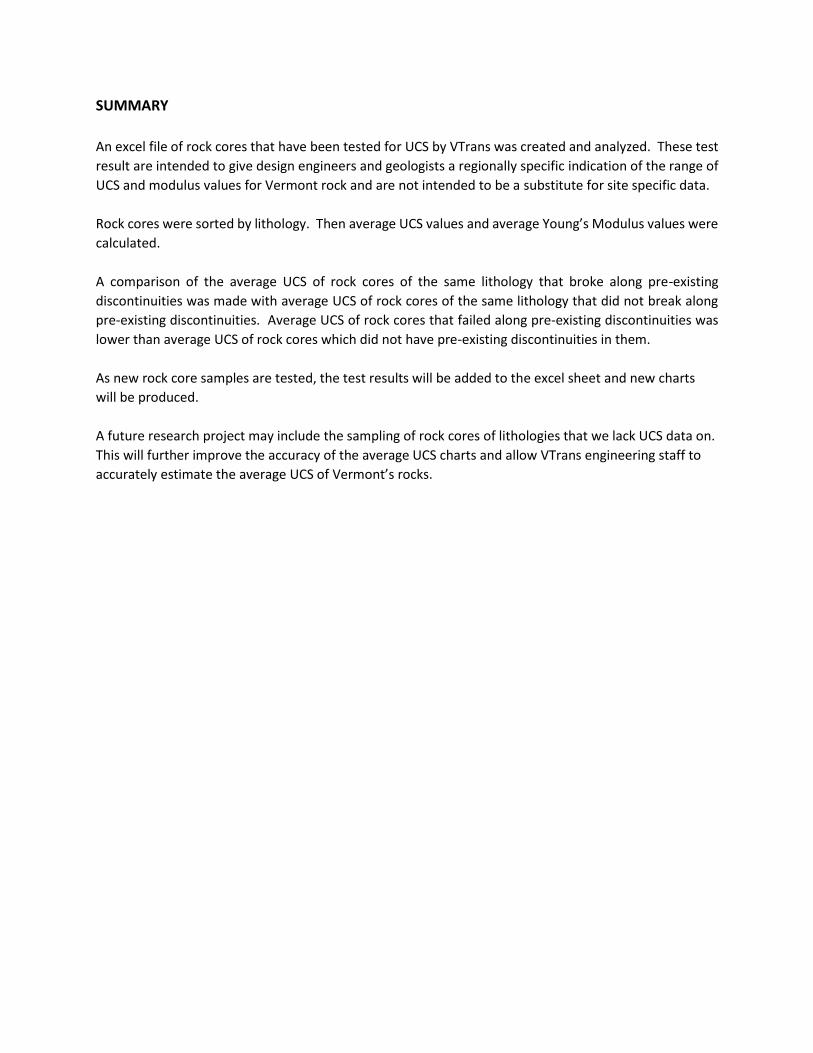
SUMMARY
An excel file of rock cores that have been tested for UCS by VTrans was created and analyzed. These test
result are intended to give design engineers and geologists a regionally specific indication of the range of
UCS and modulus values for Vermont rock and are not intended to be a substitute for site specific data.
Rock cores were sorted by lithology. Then average UCS values and average Young’s Modulus values were
calculated.
A comparison of the average UCS of rock cores of the same lithology that broke along pre-existing
discontinuities was made with average UCS of rock cores of the same lithology that did not break along
pre-existing discontinuities. Average UCS of rock cores that failed along pre-existing discontinuities was
lower than average UCS of rock cores which did not have pre-existing discontinuities in them.
As new rock core samples are tested, the test results will be added to the excel sheet and new charts
will be produced.
A future research project may include the sampling of rock cores of lithologies that we lack UCS data on.
This will further improve the accuracy of the average UCS charts and allow VTrans engineering staff to
accurately estimate the average UCS of Vermont’s rocks.

March 12, 2012 (Revised 3/12/12) Page 1 of 6
STATE OF VERMONT
AGENCY OF TRANSPORTATION MATERIALS & RESEARCH SECTION
VT-AOT-MRD 58-12
VERMONT STANDARD PROCEDURE FOR THE
DETERMINATION OF UNIXIAL COMPRESSIVE STRENGTH OF ROCK CORES
1. SCOPE
1.1. This method of test is intended for use in determining the uniaxial compressive strength of rock core samples collected from Agency projects.
2. REFERENCE DOCUMENTS
2.1. ASTM D7012 - 10 Standard Test Method for Compressive Strength and Elastic Moduli of Intact Rock Core Specimens under Varying States of Stress and Temperatures.
2.2. ASTM D4543 - 08 Standard Practices for Preparing Rock Core as Cylindrical Test Specimens and Verifying Conformance to Dimensional and Shape Tolerances.
3. APPARATUS
3.1. Apparatus shall be as described for Methods C and D in ASTM D7012 - 10. 3.2. Concrete Saw. 3.3. Disc grinder with coarse and medium coarse disks. 3.4. Strain measuring device. 3.5. Camera.
4. SAFETY PRECAUTIONS
4.1. Protective cage around sample shall be in place during test. 4.2. Safety glasses and protective foot ware must be worn during testing.
5. PROCEDURE 5.1. Sample Collection, Selection And Preparation
5.1.1. Rock core samples are to be selected from NX sized (2.154-inch diameter) rock cores. The geologist will select representative samples for testing. Each test specimen shall be between 4.5 and 5 inches in length to ensure the final specimen after preparation maintains a length to diameter ratio of 2.0 to 2.5. The specimen shall be a solid competent specimen with no visible open fractures, voids or other potential weak features that might make preparation difficult.
5.1.2. Samples should be numbered and labeled using an indelible marker while in the rock core box. The convention is as follows: B102-R1-S3 where the first part of the number represents the boring the sample was selected from, the second number is the core run the sample was selected from and the last number is the sequential sample from that core run. In addition, the depth of the specimen should be marked on the sample. The depth corresponds to the mid-point of the specimen.
March 12, 2012 (Revised 3/12/12) Page 2 of 6
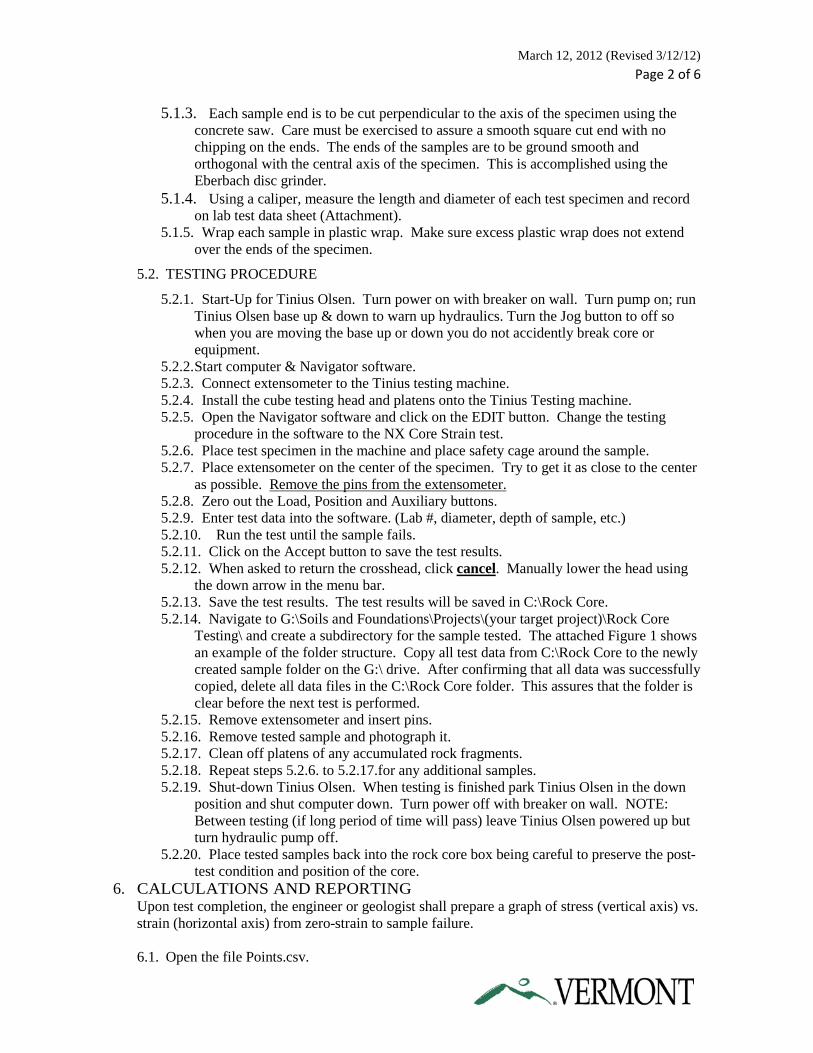
5.1.3. Each sample end is to be cut perpendicular to the axis of the specimen using the concrete saw. Care must be exercised to assure a smooth square cut end with no chipping on the ends. The ends of the samples are to be ground smooth and orthogonal with the central axis of the specimen. This is accomplished using the Eberbach disc grinder.
5.1.4. Using a caliper, measure the length and diameter of each test specimen and record on lab test data sheet (Attachment).
5.1.5. Wrap each sample in plastic wrap. Make sure excess plastic wrap does not extend over the ends of the specimen.
5.2. TESTING PROCEDURE
5.2.1. Start-Up for Tinius Olsen. Turn power on with breaker on wall. Turn pump on; run Tinius Olsen base up & down to warn up hydraulics. Turn the Jog button to off so when you are moving the base up or down you do not accidently break core or equipment.
5.2.2. Start computer & Navigator software. 5.2.3. Connect extensometer to the Tinius testing machine. 5.2.4. Install the cube testing head and platens onto the Tinius Testing machine. 5.2.5. Open the Navigator software and click on the EDIT button. Change the testing
procedure in the software to the NX Core Strain test. 5.2.6. Place test specimen in the machine and place safety cage around the sample. 5.2.7. Place extensometer on the center of the specimen. Try to get it as close to the center
as possible. Remove the pins from the extensometer. 5.2.8. Zero out the Load, Position and Auxiliary buttons. 5.2.9. Enter test data into the software. (Lab #, diameter, depth of sample, etc.) 5.2.10. Run the test until the sample fails. 5.2.11. Click on the Accept button to save the test results. 5.2.12. When asked to return the crosshead, click cancel. Manually lower the head using
the down arrow in the menu bar. 5.2.13. Save the test results. The test results will be saved in C:\Rock Core. 5.2.14. Navigate to G:\Soils and Foundations\Projects\(your target project)\Rock Core
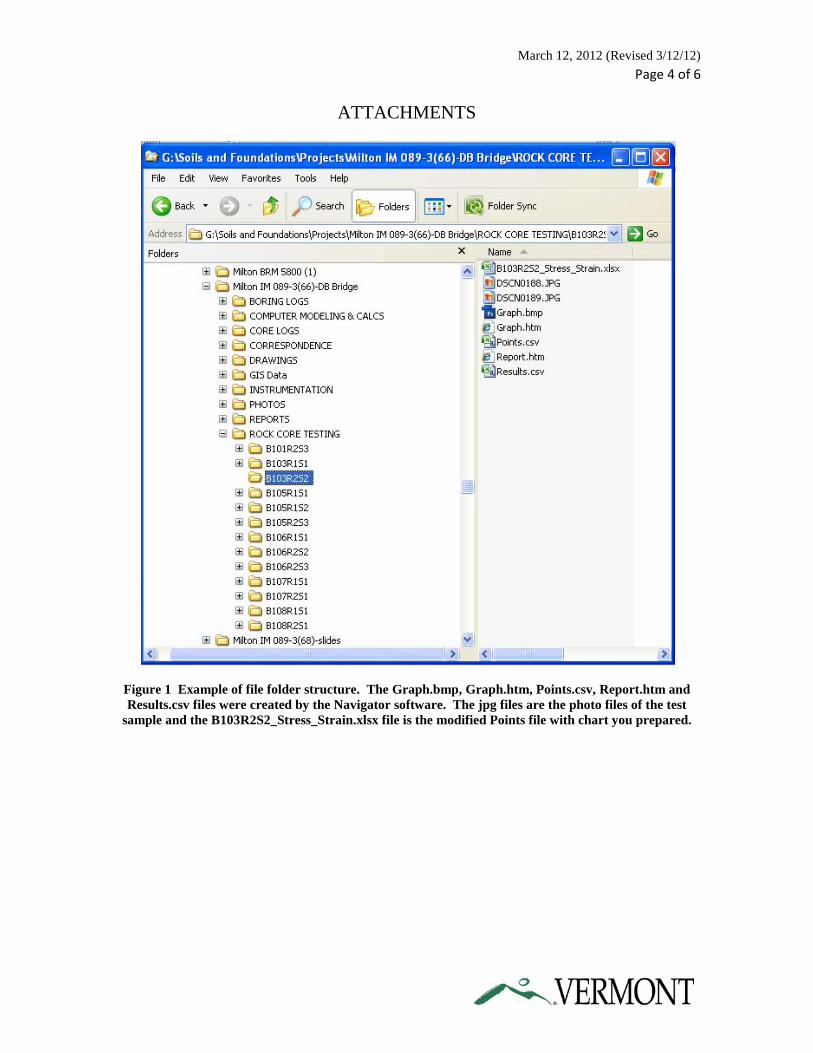
Testing\ and create a subdirectory for the sample tested. The attached Figure 1 shows an example of the folder structure. Copy all test data from C:\Rock Core to the newly created sample folder on the G:\ drive. After confirming that all data was successfully copied, delete all data files in the C:\Rock Core folder. This assures that the folder is clear before the next test is performed.
5.2.15. Remove extensometer and insert pins. 5.2.16. Remove tested sample and photograph it. 5.2.17. Clean off platens of any accumulated rock fragments. 5.2.18. Repeat steps 5.2.6. to 5.2.17.for any additional samples. 5.2.19. Shut-down Tinius Olsen. When testing is finished park Tinius Olsen in the down
position and shut computer down. Turn power off with breaker on wall. NOTE: Between testing (if long period of time will pass) leave Tinius Olsen powered up but turn hydraulic pump off.
5.2.20. Place tested samples back into the rock core box being careful to preserve the post-test condition and position of the core.
6. CALCULATIONS AND REPORTING Upon test completion, the engineer or geologist shall prepare a graph of stress (vertical axis) vs. strain (horizontal axis) from zero-strain to sample failure. 6.1. Open the file Points.csv.
March 12, 2012 (Revised 3/12/12) Page 3 of 6
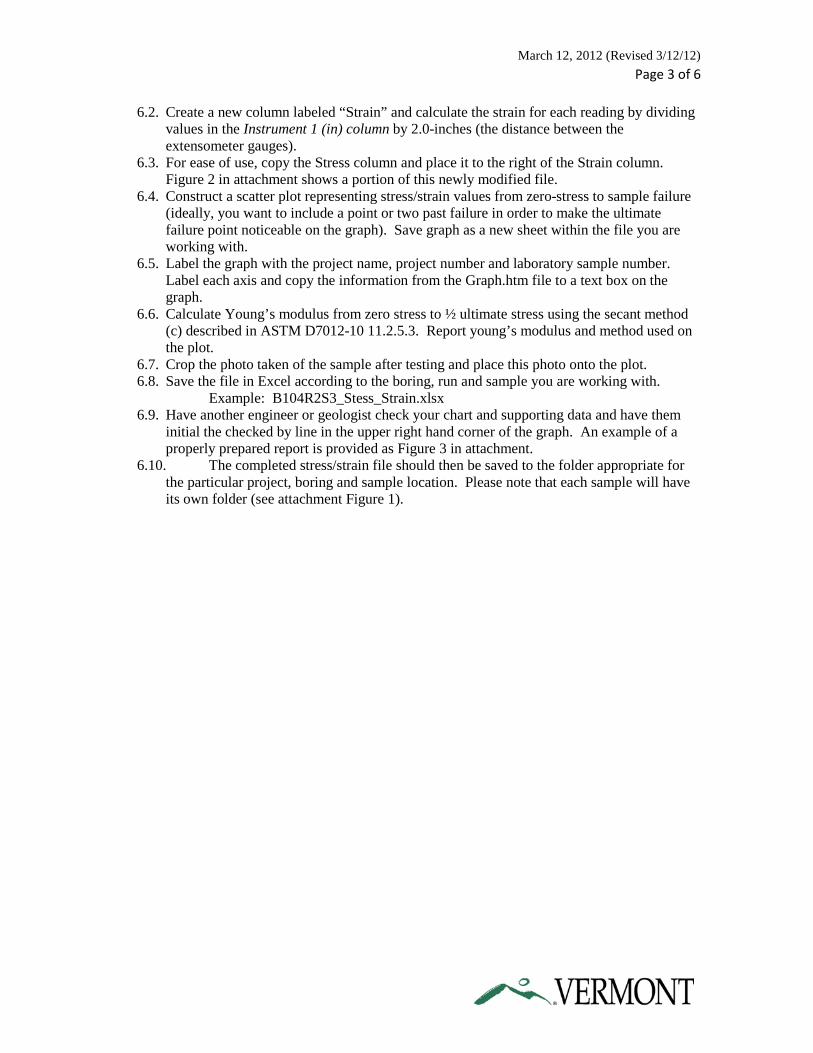
6.2. Create a new column labeled “Strain” and calculate the strain for each reading by dividing values in the Instrument 1 (in) column by 2.0-inches (the distance between the extensometer gauges).
6.3. For ease of use, copy the Stress column and place it to the right of the Strain column. Figure 2 in attachment shows a portion of this newly modified file.
6.4. Construct a scatter plot representing stress/strain values from zero-stress to sample failure (ideally, you want to include a point or two past failure in order to make the ultimate failure point noticeable on the graph). Save graph as a new sheet within the file you are working with.
6.5. Label the graph with the project name, project number and laboratory sample number. Label each axis and copy the information from the Graph.htm file to a text box on the graph.
6.6. Calculate Young’s modulus from zero stress to ½ ultimate stress using the secant method (c) described in ASTM D7012-10 11.2.5.3. Report young’s modulus and method used on the plot.
6.7. Crop the photo taken of the sample after testing and place this photo onto the plot. 6.8. Save the file in Excel according to the boring, run and sample you are working with.
Example: B104R2S3_Stess_Strain.xlsx 6.9. Have another engineer or geologist check your chart and supporting data and have them
initial the checked by line in the upper right hand corner of the graph. An example of a properly prepared report is provided as Figure 3 in attachment.
6.10. The completed stress/strain file should then be saved to the folder appropriate for the particular project, boring and sample location. Please note that each sample will have its own folder (see attachment Figure 1).
March 12, 2012 (Revised 3/12/12) Page 4 of 6
ATTACHMENTS
Figure 1 Example of file folder structure. The Graph.bmp, Graph.htm, Points.csv, Report.htm and Results.csv files were created by the Navigator software. The jpg files are the photo files of the test
sample and the B103R2S2_Stress_Strain.xlsx file is the modified Points file with chart you prepared.

March 12, 2012 (Revised 3/12/12) Page 5 of 6
ATTACHMENTS
Figure 2 Example of modified Points.csv file with Stress/Strain columns.
Figure 3 Example UCS Test report.
Force (lbf) Stress (psi) Instrument 1 (in) Strain Stress (psi)241.5 75.58 0.00028 0.00014 75.58410.8 128.57 0.00036 0.00018 128.57592.6 185.48 0.00043 0.000215 185.48750.2 234.8 0.00047 0.000235 234.8870.8 272.5 0.00051 0.000255 272.5
963 301.4 0.00053 0.000265 301.4
March 12, 2012 (Revised 3/12/12) Page 6 of 6
ATTACHMENTS
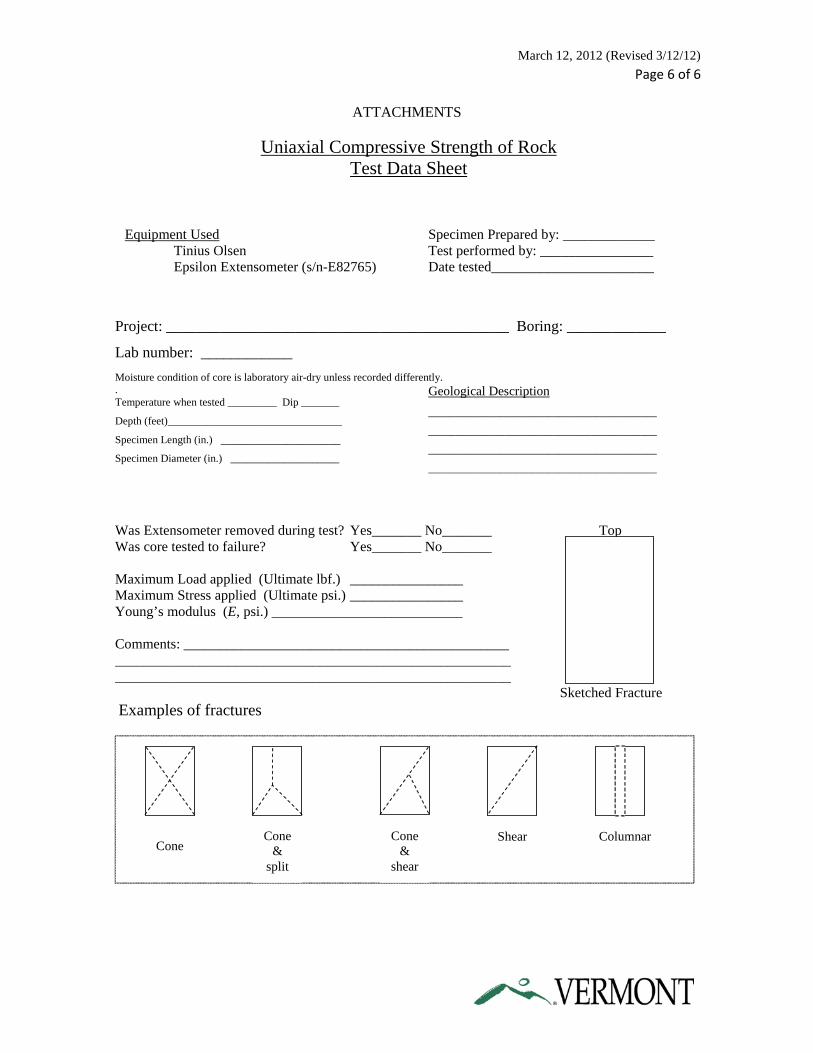
Uniaxial Compressive Strength of Rock Test Data Sheet
Equipment Used Tinius Olsen Epsilon Extensometer (s/n-E82765)
Specimen Prepared by: _____________ Test performed by: ________________ Date tested_______________________
Project: _____________________________________________ Boring: _____________
Lab number: ____________
Moisture condition of core is laboratory air-dry unless recorded differently.. Temperature when tested _________ Dip _______
Depth (feet)________________________________
Specimen Length (in.) ______________________
Specimen Diameter (in.) ____________________
Geological Description __________________________________________
__________________________________________
__________________________________________
__________________________________________
Was Extensometer removed during test? Yes_______ No_______ Top Was core tested to failure? Yes_______ No_______ Maximum Load applied (Ultimate lbf.) ________________ Maximum Stress applied (Ultimate psi.) ________________ Young’s modulus (E, psi.) ___________________________ Comments: ______________________________________________ ________________________________________________________ ________________________________________________________ Sketched Fracture Examples of fractures
Cone Cone
& split
Cone &
shear
Shear Columnar