
UNCLASSIFIED Evolving Maintenance Metrics
26
UNCLASSIFIED UNCLASSIFIED Evolving Maintenance Metrics Stu Paul OPNAV N43 13 November, 2012
Transcript of UNCLASSIFIED Evolving Maintenance Metrics
UNCLASSIFIED
UNCLASSIFIED
Evolving Maintenance Metrics
Stu Paul
OPNAV N43
13 November, 2012
2
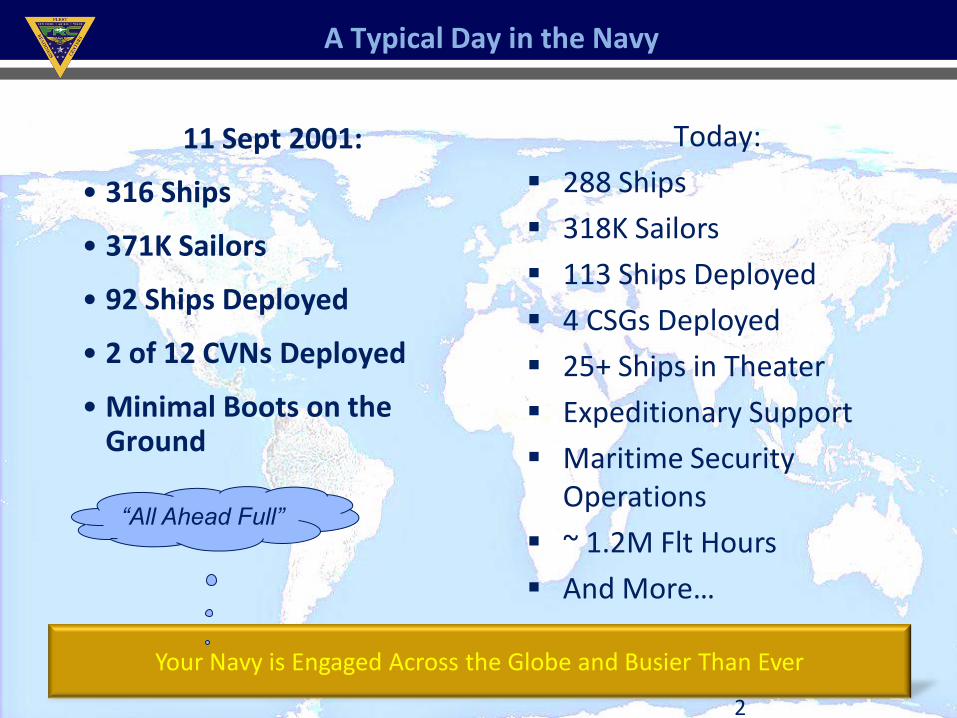
A Typical Day in the Navy
11 Sept 2001:
• 316 Ships
• 371K Sailors
• 92 Ships Deployed
• 2 of 12 CVNs Deployed
• Minimal Boots on the Ground
2
Today:
288 Ships
318K Sailors
113 Ships Deployed
4 CSGs Deployed
25+ Ships in Theater
Expeditionary Support
Maritime Security Operations
~ 1.2M Flt Hours
And More…
Your Navy is Engaged Across the Globe and Busier Than Ever
“All Ahead Full”

3
Logistics Assessment Vision (We’re swimming in metrics, but ... )
• Standardized Data Triage Process, Tools and Language
– TMS Logistics Assessment enhanced by the implementation of Integrated Logistics Support Management System (ILSMS)
• Exploit unprecedented access to maintenance and supply data
• Advanced analytical and demand forecasting capability
• Improve Visibility of T/M/S Readiness & Cost Drivers
• Root Cause Analysis of Identified Issues
• Actionable Mitigation POA&M’s with provider organizations
Unprecedented Data Availability
ILSMS Aggregates Data
in One Tool
Logistics Assessment will be a key enabler in enhancing weapons system availability and reducing O&S cost

4
•2011- AIR 6.8.2 created baseline analysis Software
Specification
•ILSMS best of breed
•Includes additional requirements provided by
12 Programs
File: NAVAIR Brief 4
•Programs historically build stove-piped analytical applications •Lack standardization in analysis •Expensive •Difficult to get to Root Cause
Need for a common Aircraft Readiness & Cost Decision Support System
•PMA-261 Success with ILSMS
•Created ability to forecast Dynamic Components Requirements
•Created standardized degrader
methods (CILR)
•Automated Analysis Handbook
•Primary readiness metrics, NAVSUP pages, APML metrics
2010 - 2012
5
ILSMS DECK PLATE
AIRRS
TDSA
OOMA
NAVSUP WSS
DLA FRC
NAE
VAMOSC
CAVTS
N42
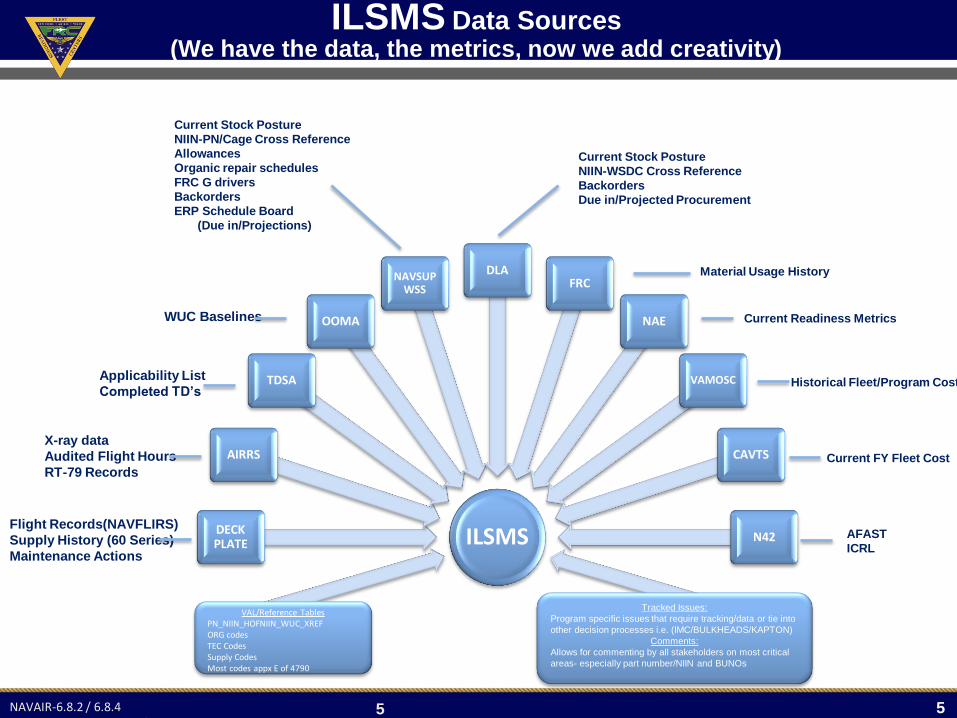
ILSMS Data Sources (We have the data, the metrics, now we add creativity)
Flight Records(NAVFLIRS)
Supply History (60 Series)
Maintenance Actions
X-ray data
Audited Flight Hours
RT-79 Records
Applicability List
Completed TD’s
WUC Baselines
Current Stock Posture
NIIN-PN/Cage Cross Reference
Allowances
Organic repair schedules
FRC G drivers
Backorders
ERP Schedule Board
(Due in/Projections)
Current Stock Posture
NIIN-WSDC Cross Reference
Backorders
Due in/Projected Procurement
Material Usage History
Current Readiness Metrics
Historical Fleet/Program Cost
Current FY Fleet Cost
AFAST
ICRL
Tracked Issues:
Program specific issues that require tracking/data or tie into
other decision processes i.e. (IMC/BULKHEADS/KAPTON)
Comments:
Allows for commenting by all stakeholders on most critical
areas- especially part number/NIIN and BUNOs
VAL/Reference Tables PN_NIIN_HOFNIIN_WUC_XREF ORG codes TEC Codes Supply Codes Most codes appx E of 4790
5 NAVAIR-6.8.2 / 6.8.4 ILSMS Analytic Module of DECKPLATE

6
Logistics Assessment
Readiness “Kill Chain” (A different perspective on what ‘we’ produce and why)
6
NAE Readiness &
Costs Metrics
Root Cause Analysis
Actionable POA&M
Issues Affecting Readiness & Cost
and more . . .
OPNAV / HQMC
Resource Sponsors
Provider Organizations
SURVEILLANCE DETECT TRACK ID/ENGAGE LAUNCH CONTROL LETHALITY ASSESS
Logistics Impacts Each Link of the “Kill Chain”
NAVSUP
T/M/S Data Driven
Analysis
CR
CFT
CURRENT READINESS & COST FUTURE READINESS: DESIGN FOR SUPPORTABILITY
Retail Supply
Support Equipment
Maintainer in Place
Execute Maintenance
Operate
Capture Data
CPI
Design for Supportability
Test
Support Concept
Wholesale Supply
Training
Tools/Tech Data
Readiness “Kill Chain”

7
ILSMS-Cost Module
FLEET COST Page
NAVAIR-6.8.2 / 6.8.4 ILSMS Analytic Module of DECKPLATE
UNDER DEVELOPMENT

8
ILSMS-Readiness Module
UTILIZATION Page
NAVAIR-6.8.2 / 6.8.4 ILSMS Analytic Module of DECKPLATE

9
ILSMS-Cost Module
TMS CPI FLEET COST Page
NAVAIR-6.8.2 / 6.8.4 ILSMS Analytic Module of DECKPLATE
UNDER DEVELOPMENT

10
NAVSUP REPAIR CALCULATOR Page
ILSMS-Supportability Module
NAVAIR-6.8.2 / 6.8.4 ILSMS Analytic Module of DECKPLATE
UNDER DEVELOPMENT

FRC WESTPAC
NAF Atsugi
Det Guam
Det Okinawa
Det Singapore
Det Korea
Det Iwakuni
FRC SEFAC
SOLOMON’S ISLAND
M (744), C (84), K (49)
M (875), C (2,560), K (695)
M (986), C (2,790), K (305)
M (0), C (25) K (528)
M (1,894), C (327), K (186)
M (124), C (3,208), K) (298)
M (27), C (109), K (7)
FRC SOUTHWEST
NORTH ISLAND
SEAOPDET
Det Point Mugu
SEAOPDET
Det NAVCAL Lab
Futenma
Det NAVCAL Lab
Iwakuni
AFFILIATION WITH: MALS-39 Pendleton
MALS-13 Yuma
FRC WEST
LEMOORE
SEAOPDET Lemoore
Det Fallon
FRCSW Det
Det Fort Worth
Det China Lake
FRC SOUTHEAST
JACKSONVILLE
SEAOPDET
P-3 OPDET
Det Mayport
Det Key West
FRC NORTHWEST WHIDBEY ISLAND
ELU Det P3 OPDET SEAOPDET VANOPDET Det Everett FRCSW Det
FRC EAST
CHERRY POINT Det McGuire
AFFLIATION WITH:
MALS-14 Cherry Point
MALS-26 & 29 New River
MALS-31 Beaufort
HMX-1 Quantico
MALS-49 Stewart
M (1,072), C (115), K (94)
M 34), C (73), FNK (83)
COMFRC HQ
FRC Totals
Military: 5,756
Civilians: 9,291
Contractors: 2,245
Total Employees: 17,292
FRC MUSTER REPORT
SEPTEMBER 2012
FRC MID-ATLANTIC
OCEANA
Det Oceana
SEAOPDET Oceana
Det Norfolk
SEAOPDET Norfolk
Det Pax River
Det New Orleans
Det Washington
Aircraft Dept
(Oceana/Norfolk)
Voyage Repair Team
(Norfolk/Mayport)
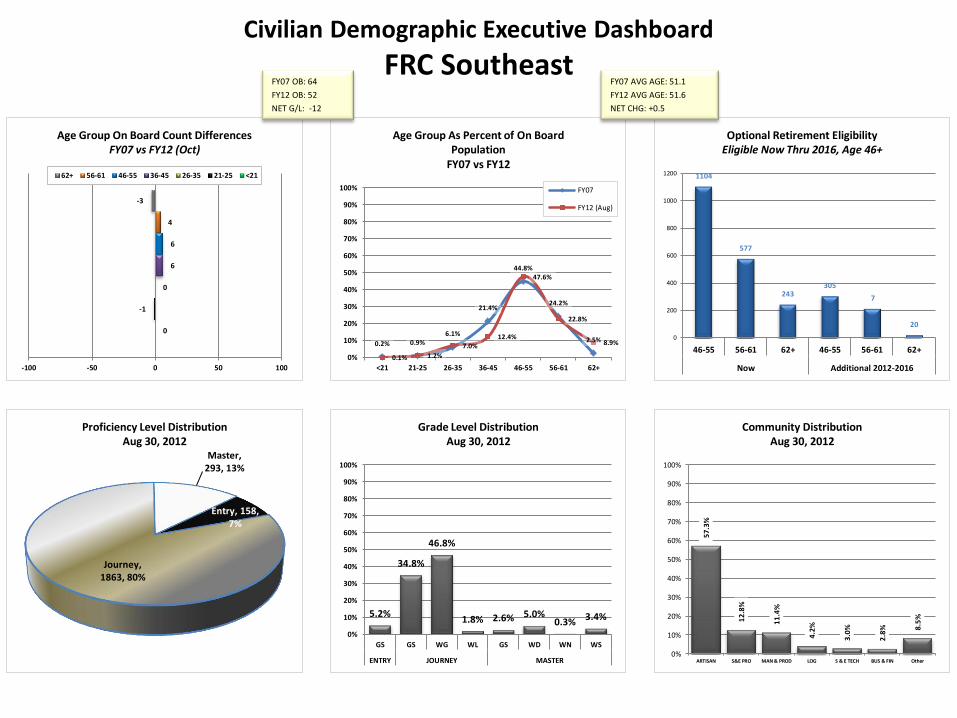
Civilian Demographic Executive Dashboard Civilian Demographic Executive Dashboard
FRC Southeast
0
-1
0
6
6
4
-3
-100 -50 0 50 100
Age Group On Board Count Differences FY07 vs FY12 (Oct)
62+ 56-61 46-55 36-45 26-35 21-25 <21
0.2% 0.9% 6.1%
21.4%
44.8%
24.2%
2.5%
0.1% 1.2%
7.0% 12.4%
47.6%
22.8%
8.9%
0%
10%
20%
30%
40%
50%
60%
70%
80%
90%
100%
<21 21-25 26-35 36-45 46-55 56-61 62+
Age Group As Percent of On Board Population
FY07 vs FY12
FY07
FY12 (Aug)
1104
577
243 305
7
20
0
200
400
600
800
1000
1200
46-55 56-61 62+ 46-55 56-61 62+
Now Additional 2012-2016
Optional Retirement Eligibility Eligible Now Thru 2016, Age 46+
Entry, 158, 7%
Journey, 1863, 80%
Master, 293, 13%
Proficiency Level Distribution Aug 30, 2012
5.2%
34.8%
46.8%
1.8% 2.6% 5.0% 0.3%
3.4%
0%
10%
20%
30%
40%
50%
60%
70%
80%
90%
100%
GS GS WG WL GS WD WN WS
ENTRY JOURNEY MASTER
Grade Level Distribution Aug 30, 2012
57
.3%
12
.8%
11
.4%
4.2
%
3.0
%
2.8
%
8.5
%
0%
10%
20%
30%
40%
50%
60%
70%
80%
90%
100%
ARTISAN S&E PRO MAN & PROD LOG S & E TECH BUS & FIN Other
Community Distribution Aug 30, 2012
FY07 AVG AGE: 51.1
FY12 AVG AGE: 51.6
NET CHG: +0.5
FY07 OB: 64
FY12 OB: 52
NET G/L: -12
0%
50%
100%
150%
AH
-1W
AH
-1Z
AV
-8B
C-2
A
CH
-46E
CH
-53E
E-2
C
FA
-18A
-D
FA
-18E
/F
EA
-18G
EA
-6B
H60 H
/F
MH
-53E
MH
-60R
MH
-60S
MV
-22B
P-3
C
SH
-60B
SH
-60F
UH
-1N
% o
f P
AA
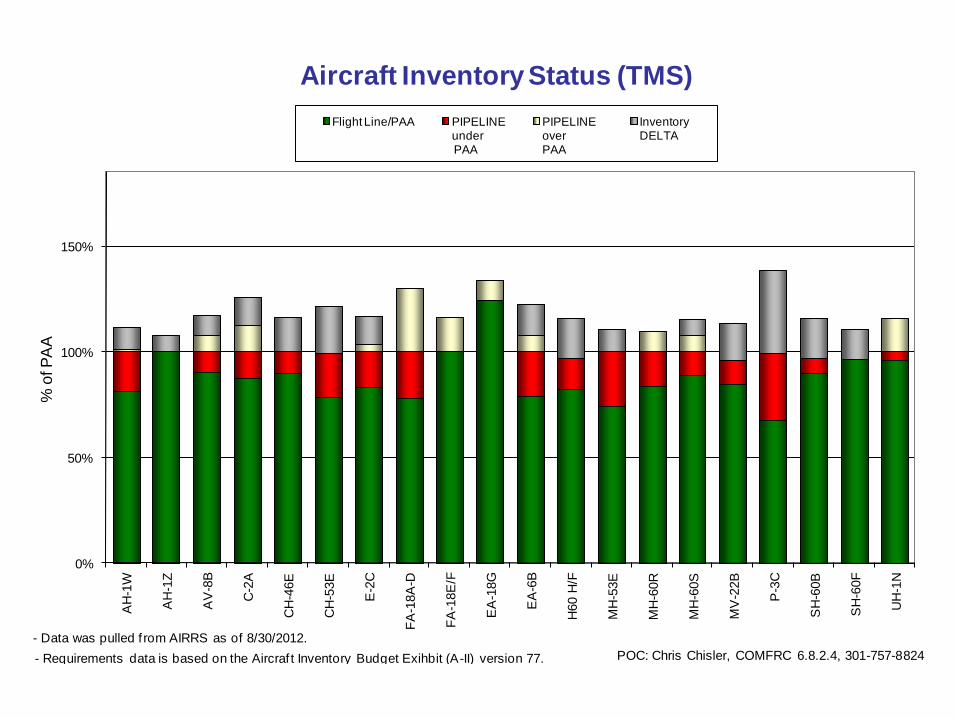
Aircraft Inventory Status (TMS)
Flight Line/PAA PIPELINE underPAA
PIPELINE over PAA
Inventory DELTA
- Requirements data is based on the Aircraf t Inventory Budget Exihbit (A-II) version 77.
- Data was pulled f rom AIRRS as of 8/30/2012.
POC: Chris Chisler, COMFRC 6.8.2.4, 301-757-8824

0%
50%
100%
150%
200%
250%
300%
AH
-1W
AH
-1Z
AV
-8B
C-2
A
CH
-46E
CH
-53E
E-2
C
EA
-18G
EA
-6B
FA
-18A
-D
FA
-18 E
-F
H-6
0 H
/F
MH
-53E
MH
-60R
MH
-60S
MV
-22B
P-3
C
SH
-60B
UH
-1N
UH
-1Y
% o
f B
AA
Pipeline Breakout (TMS)
SKD-DLM MOD ISR
SRWK TFA 1st Delivery
- Requirements data is based on the Aircraft Inventory Budget Exihbit (A-II) version 77.
- Data was pulled from AIRRS as of 8/30/2012.
POC: Chris Chisler, COMFRC 6.8.2.4, 301-757-8824
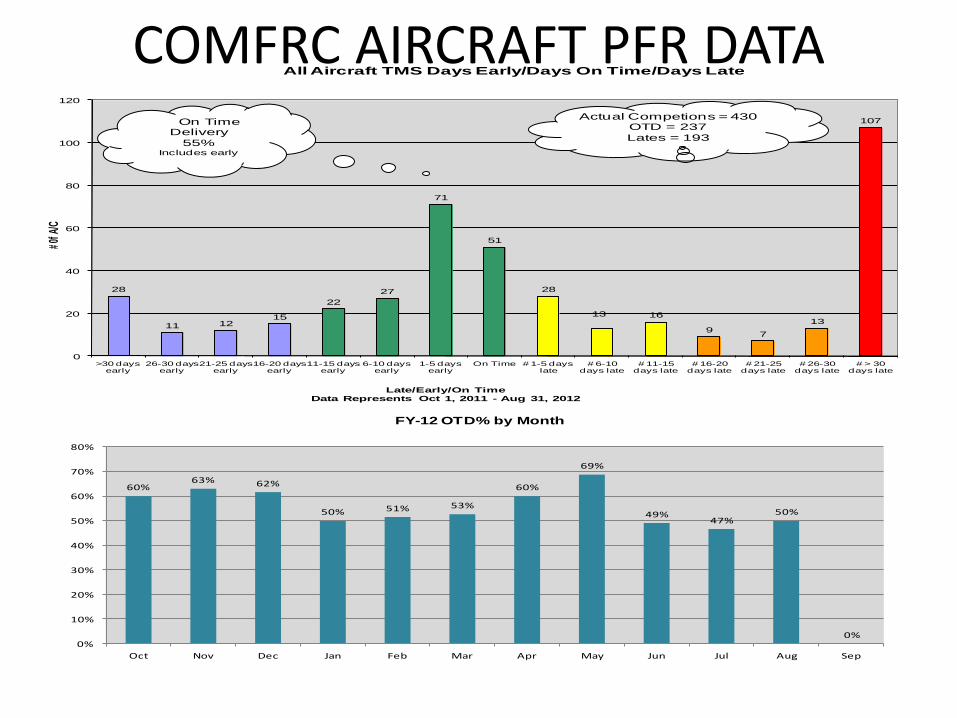
COMFRC AIRCRAFT PFR DATA
28
11 1215
22
27
71
51
28
13 16
97
13
107
0
20
40
60
80
100
120
>30 days early
26-30 days early
21-25 days early
16-20 days early
11-15 days early
6-10 days early
1-5 days early
On Time # 1-5 days late
# 6-10 days late
# 11-15 days late
# 16-20 days late
# 21-25 days late
# 26-30 days late
# > 30 days late
# 0f A
/C
Late/Early/On TimeData Represents Oct 1, 2011 - Aug 31, 2012
All Aircraft TMS Days Early/Days On Time/Days Late
Actual Competions = 430OTD = 237
Lates = 193
On Time Delivery
55%Includes early
60%63% 62%
50% 51% 53%
60%
69%
49%47%
50%
0%0%
10%
20%
30%
40%
50%
60%
70%
80%
Oct Nov Dec Jan Feb Mar Apr May Jun Jul Aug Sep
FY-12 OTD% by Month

OCT NOV DEC JAN FEB MAR APR MAY JUN JUL AUG SEP
Adj PLAN 32 64 129 177 227 240 268 357 407 415 451
ACTUAL 29 68 104 145 180 215 257 288 336 386 430
OTD% 55 63 62 59 58 57 58 58 57 56 55
0
100
200
300
400
500
600
UN
ITS
FY12 Production Plan vs Actual
Source: PSR/Open Plan
Source: PSR/Open Plan
Airframes Production • Airframes
– FA-18A-D: 50 Basic, 35 Rev A, total 85 complete; 8 of these completed by Boeing Cecil and released for 600 hour flight extension. 88 HFH IW; High variability in material and stress corrosion cracking is significantly effecting TAT. .
– H1: Working with SW, E and PMA-276 on establishing H-1 IMC field event capability at Kbay & New River.
– E-2: There has been a bi-weekly supply SYNC telecon since February 2012 to track/discuss/resolve material and production concerns. Supply SYNC successes: White boards at each cell to capture constraints and Identify leading & lagging measures. FRC and class deck working to prioritize ISR(s) to help the FRC utilize man power better.
• Engines & Modules
–F414: No change. Production continue to track ahead of get
well plan (Mar to Sep ERG improvement from -182 to -75). COMFRC TFM/Contracts working to augment AZ rating personnel at FRCW due to new heights in engine production requirements
– J52: Deficiencies on new 2nd stage shrouds & thermostats affects on-time-delivery at FRCSE
–T64: Piston Rings/Air Seal, Piston Spacer and Turbine Seals impacting production at FRCE & FRCMA. DLA & Program Office working with vendor for delivery.
OCT NOV DEC JAN FEB MAR APR MAY JUN JUL AUG SEP
Adj PLAN 116 218 309 381 480 616 774 911 1041 1,2331,426
ACTUAL 88 159 280 368 524 715 852 996 1174 1331 1532
0
200
400
600
800
1,000
1,200
1,400
1,600
1,800
UN
ITS

17
COMFRC ON-TIME DELIVERY PERFORMANCE
FY-12 On-Time-Delivery Performance • FY-12 Aircraft Completions Oct-Aug: 430
• FY-12 On-Time-Delivery Target: 70 Percent (301) • FY-12 On-Time-Delivery Actual: 55 Percent (237)
• FY-12 Late Deliveries Actual: 45 Percent (193) 193
237
FY-12 Late Delivery Drivers by TMS • F/A-18 A-D (Represents 33 percent of COMFRC Late Deliveries)
• FY-12 Units Processed: 82 • On-Time-Delivery Target: 70 Percent (58) • On-Time-Delivery Actual: 23 Percent (19) • Late Deliveries Actual: 77 Percent (63) • Impact to Flight Line Gap: 23.1
• Primary Driver: HFH Inspection Engineering/Material •F/A-18 E-G (Represents 15 percent of COMFRC Late Deliveries)
• FY-12 Units Processed: 59 • On-Time-Delivery Target: 70 Percent (41) • On-Time-Delivery Actual: 51 Percent (30) • Late Deliveries Actual: 49 Percent (29) • Impact to Flight Line Gap: 00.0
• Primary Driver: 7R Components/Flight Surfaces, Landing Gear

18
COMFRC COST AND ON-TIME DELIVERY PERFORMANCE
FY-12 Cost Performance • FY-12 Aircraft Completions Oct-Aug: 430
• FY-12 Total Planned Cost: $262.3M • FY-12 Total Actual Cost: $264.2M
• FY-12 Total Overall Cost Delta: - $1.9M 193
237
FY-12 Negative Cost Drivers by TMS • AV-8: (- $3.4M) 28 percent above plan
•Labor associated with concurrent and Stand-alone Modifications
• H-46: (- $3.3M) 12 percent above plan • Labor associated with concurrent modifications
• C-2A: (- $1.4M) 13 percent above plan • Labor associated with tail surface material condition, cannibalization costs
Aircraft Plan (M$) Actual (M$) Cost Delta ($) OTD
AV-8 12.1 15.5 -3.40 42%
C-2A 10.9 12.3 -1.40 62%
E-2C 28.2 26.9 1.30 38%
P-3 10.4 9.6 0.80 30%
EA-6B 10.9 10.7 0.20 65%
F/A-18A-D 50.5 47.5 3.00 23%
F/A-18E-G 8.6 9.3 -0.70 51%
H-1 17.3 15.6 1.70 87%
H-46 26.7 30 -3.30 50%
H-53 45.3 46 -0.70 42%
H-60 34.4 33.1 1.30 88%
MV-22 4.1 4.6 -0.50 45%
T44 2.9 3.1 -0.20 0%
Total 262.3 264.2 -1.90
Pearson r = 0.04916
FY-12 Cost VS OTD Correlation
• Pearson correlation coefficient r = .04916 • Indicates no relationship between OTD and Cost • Data shows poorest “cost” performers have better OTD than best “cost” performer (F/A-18A-D)
OCT NOV DEC JAN FEB MAR APR MAY JUN JUL AUG SEP
FY12 Pres Budget (1.42) (2.98) (4.36) (6.24) (6.12) (6.21) (6.17) (5.42) (4.86) (4.54) (3.81) (3.24)
Actual (2.39) (3.76) (3.32) (0.99) 0.22 3.49 9.47 7.52 6.88 6.58 6.99
EOY Projection (2.39) (3.76) (3.32) (1.00) 0.22 3.49 9.47 7.97 6.53 5.09 3.65 2.21
-10
-5
0
5
10
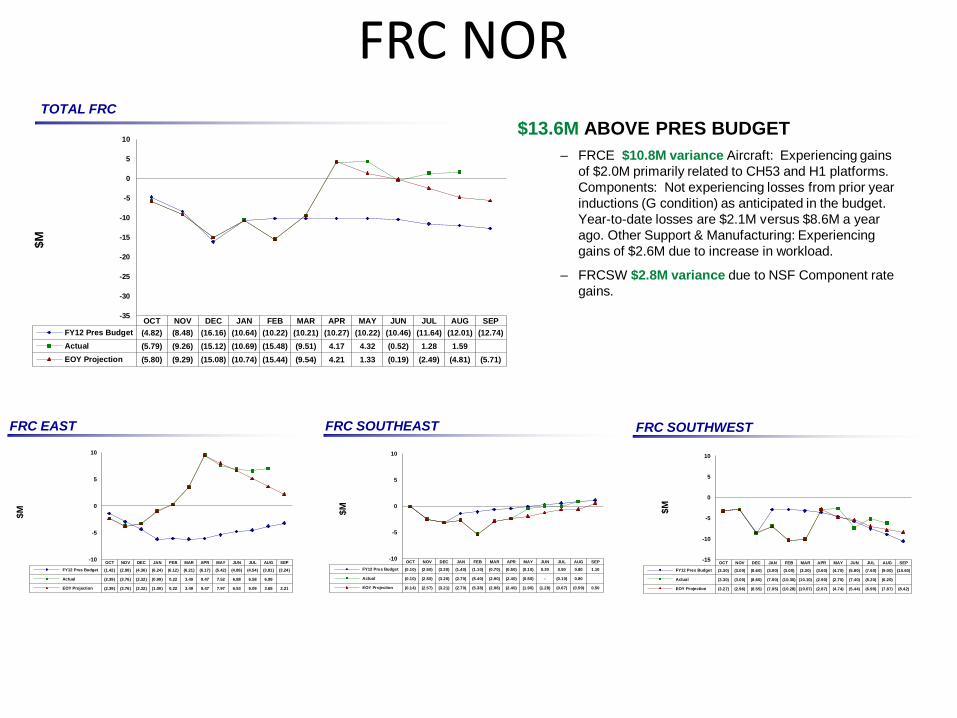
FRC NOR
OCT NOV DEC JAN FEB MAR APR MAY JUN JUL AUG SEP
FY12 Pres Budget (0.10) (2.50) (3.20) (1.40) (1.10) (0.70) (0.50) (0.10) 0.20 0.50 0.80 1.10
Actual (0.10) (2.50) (3.20) (2.70) (5.40) (2.90) (2.40) (0.50) - (0.10) 0.80
EOY Projection (0.14) (2.57) (3.21) (2.70) (5.38) (2.96) (2.40) (1.90) (1.28) (0.67) (0.59) 0.50
-10
-5
0
5
10
OCT NOV DEC JAN FEB MAR APR MAY JUN JUL AUG SEP
FY12 Pres Budget (3.30) (3.00) (8.60) (3.00) (3.00) (3.30) (3.60) (4.70) (5.80) (7.60) (9.00) (10.60)
Actual (3.30) (3.00) (8.60) (7.00) (10.30) (10.10) (2.90) (2.70) (7.40) (5.20) (6.20)
EOY Projection (3.27) (2.96) (8.55) (7.05) (10.28) (10.07) (2.87) (4.74) (5.44) (6.90) (7.87) (8.42)
-15
-10
-5
0
5
10
OCT NOV DEC JAN FEB MAR APR MAY JUN JUL AUG SEP
FY12 Pres Budget (4.82) (8.48) (16.16) (10.64) (10.22) (10.21) (10.27) (10.22) (10.46) (11.64) (12.01) (12.74)
Actual (5.79) (9.26) (15.12) (10.69) (15.48) (9.51) 4.17 4.32 (0.52) 1.28 1.59
EOY Projection (5.80) (9.29) (15.08) (10.74) (15.44) (9.54) 4.21 1.33 (0.19) (2.49) (4.81) (5.71)
-35
-30
-25
-20
-15
-10
-5
0
5
10 $13.6M ABOVE PRES BUDGET
– FRCE $10.8M variance Aircraft: Experiencing gains
of $2.0M primarily related to CH53 and H1 platforms.
Components: Not experiencing losses from prior year
inductions (G condition) as anticipated in the budget.
Year-to-date losses are $2.1M versus $8.6M a year
ago. Other Support & Manufacturing: Experiencing
gains of $2.6M due to increase in workload.
– FRCSW $2.8M variance due to NSF Component rate
gains.
FRC EAST FRC SOUTHWEST FRC SOUTHEAST
TOTAL FRC
$M
$M
$M
$M

BLUF DESCRIPTION
Fleet Green -Flight Line Gap < or = RBA Gap and Flight Line Gap < or = Late FRC WIP Yellow - One of the above criteria is not true Red - Both of the above criteria are not true Production Green -OTD > or = 70% and Late FRC WIP < or = Flight Line Gap and Year to Date Completions (Plan - Actual) < or = 0 “when Flight Line Gap is 0 then this measure would be true even if we have late WIP. If the fleet does not have a gap then why penalize the FRC if they are late”. Yellow - One of the above criteria is not true Red -Two or more of the above criteria are not true

TMS AIRCRAFT
AV-8BInventory constrained aircraft with OSD extended from 2026 to 2030. TAT increased by parts shortages, concurrent & stand
alone MOD requirements.
C-2A
Material constraints and cannibalization. Looking at black belt on Dissy/E&E phase. Bi-weekly Supply Synch telecom being
held to track/discuss/resolve material and production issues. Current OWP (Outer Wing Panel) are approaching life limit.
The fleet will purchase new OWP.
E-2C
Material constraints and cannibalization. Looking at black belt on Dissy/E&E phase. Bi-weekly Supply Synch telecom being
held to track/discuss/resolve material and production issues. Current OWP (Outer Wing Panel)are approaching life limit.
The fleet will purchase new OWP.
P-3C Concurrent MODs are driving increased TAT. Inventory constraint will continue to be a problem until P-8 comes on board.
EA-6B No production issues / Fleet: Inventory draw down. Red because flight line gap is greater than RBA.
F/A-18A-D Material shortages for HFH, standard repairs for HFH & engineering support for HFH.
F/A-18E-GShortages for 7R components (flight surface, landing gear, etc) and engineering support to deliver timely dispositions on
AEPD gripes are a concern. Not adversely affecting OTD but could be a concern if situation doesn’t improve.
H-1 Fleet: Flight line Gap on AH-1W. Production one late in WIP.
H-46 Concurrent MODS are driving increased TAT. Flight line gap due to inventory constraints.
H-53 Main gearbox shortages continue to impact production.
H-60 No issues
MV-22 MV-22: PMI & Block A to B Mod AC. FY15 WLS TAT has been increases.
T-34 Prototype still working out material contracting issues
T-44 Prototype still working out material contracting issues
CommentsFleet
Status
Prod
StatusT/M

*Percentages based on CNAF Pool Report color codes
MATERIAL EQUIPMENT SKILL SET
C1
C1 - NO MATERIAL ISSUES
- No cannibalizations
- Parts available & in system
C1C1 - NO EQUIPMENT ISSUES
- Primary Equipment in UP StatusC1
C1 - NO SKILL SET ISSUES
- Skill set in place & readily available
- Fully trained
C2
C2 - MINOR MATERIAL ISSUES
- Cannibalizations occurring
- Parts on order / enroute (with EDD)
C2
C2 - MINOR EQUIPMENT ISSUES
- Still Operational (using workaround)
- Legacy Back-up is available (in house)
C2
C2 - MINOR SKILL SET ISSUES
- Skills somewhat limited
- cross training in progress
- augmenting from other areas (in house,
same qualifications)
C3
C3 - SIGNIFICANT MATERIAL ISSUES
- Cannibalizations occuring
- iPG1
- Backorders (unknown EDD or past due)
- Engineering assistance required
- Using parts from AMARG
C3
C3 - SIGNIFICANT EQUIPMENT ISSUES
- Limited/Assisted Capability
- Utilizing alternate facilities
- Waiver submitted/approved
C3
C3 - SIGNIFICANT SKILL SET ISSUES
- Diminishing skill set
- losing skill set due to retirement
- replacements are wrong mix of talent
(different/other qualifications)
C4
C4 - MAJOR MATERIAL ISSUES
- No contracts in place to obtain parts
- No Parts available or on order
- No cannibalization opportunities
** Any C4 Rating indicates work stoppage
C4
C4 - MAJOR EQUIPMENT ISSUES
- Non-Operational
- No back-up available
** Any C4 Rating indicates work stoppage
C4
C4 - MAJOR SKILL SET ISSUES
- No one qualified
- No school house
** Any C4 Rating indicates work stoppage
FLEET RATING SCALE
PRODUCTION RATING SCALE
If any two categories are C1/C2 then overall Production color will be GREEN.
If any two categories are C3 then overall Production color will be YELLOW.
RED
** "C" Ratings adapted from Broad Arrow (BA) Reporting conditions found in NAMP Vol 5.1.2.11 The ratings focus on the sites ability to support the customer/squadrons.
If any category is C4 then overall Production color will be RED.
GREEN
CNAF POOL STATUS > 84%
YELLOW
CNAF POOL STATUS 50% - 84% CNAF POOL STATUS < 50%
ENGINE COLOR CODE METRICS
P
F
P P
F F

TMS ENGINES T/M Comments
F402-RR-408BPools are 81% filled. Delay for HPT 1 vanes for Combustion Chamber MRA, Seal for LPC MRA & diffuser blankets. Engine vibes due to
HPC anamonlies have caused several engine test cell rejects. Dano Bat has caused work delays.
F404-GE-400 Pools are 100% filled. No major issues. Delays for Stator Pins, Tube Assembly, and Actuator Assembly caused late OTD.
F404-GE-402 Pools are 100% filled. No major issues. Delays for Inner Nozzel Support caused late OTD.
F414-GE-400 Pools are 100% filled. FRCW needs AD rating personnel to accommodate new engine demand rates. CRA delays contract award.
J52-P-408BPools are 100% filled. Technical issues with newly designed 4.5 bearing is still under engineering investigation. Bearing supply being
addressed accordingly. Discovering defective 2nd stg shrouds and thermostats (new parts) at FRCSE. FRCNW's CFT request approved
by CNAP with FY13 contract award. CRA delays contract award.T400-CP-400 Pools are 100% filled. No major issues.
T56-A-14Pools are 100% filled. FRCSE: Cannibalizing Chin cowlings to sustain production. FRCNW/SE: Outstanding for RGB Nose Bearings,
NAVSUP is searching for vendor. FRCs: Manpower constraints due to ERB and sailors checking in without T56 experience.
T56-A-16Pools are 92% filled. FRCW: Several QECs require extensive structural repair for loose rivits and failed longeron cross beams &
mounts. Cannibalizing oil cooler flap actuators. FRCs: Manpower constraints, shops being augmented by non mech rates.
T56-A-425Pools are 80% filled. FRCSW & FRCMA reporting back orders of Scavenge Oil Filter Heads, QEC Propeller Harness, Engine Mount
Brackets. FRCSW: 2 outstanding reqs for Oil coolers, cannibalizations being performed to sustain production.
T56-A-427Pools are 100% filled. FRCSW & FRCMA reporting back orders of Scavenge Oil Filter Heads, QEC Propeller Harness, Engine Mount
Brackets. FRCSW: 2 outstanding reqs for Oil coolers, cannibalizations being performed to sustain production.
T58-GE-16A/400BPools are 100% filled. Primary fuel nozzles and combustion liners causing material delays. Back shop delays for the anti-ice valve which
has caused late OTD's. #1 test cell is down for load cell; EDD of Feb 2013. Dano Bat has cause work delays.
T64-GE-416/416APools are 100% filled. Kaydon carbon seals & PPC-109 parts kit (-416 to -416A Kit), air seal ring and piston spacer continue to
contribute to work delays. Dano Bat has cause work delays.
T64-GE-419Pools are 77% filled. FRCE: Kaydon Air seal ring and piston spacer continue to contribute to work delays. Dano Bat has cause work
delays. FRCMA: Metal seal causing work delays.
T700-GE-401Pools are 100% filled. No repairs this fiscal year to date. Looking to remove capability at FRCMA New Orleans. Majority production at
MALS.
T700-GE-401CPools are 100% filled. Norfolk personnel changeover required training resulting in late OTD and test cell issues. North Island and
Mayport canniblizing due to delivery delays to meet demand.
Fleet
Status
Prod
Status

H-46 Quad Chart Ending –Aug 31, 2012
T/M/S & Rework Status
$26,648,249
$20,329,662
$6,318,587
$30,008,617
$22,795,982
$7,212,635
$0
$5,000,000
$10,000,000
$15,000,000
$20,000,000
$25,000,000
$30,000,000
$35,000,000
Total Cost Labor Material
YTD CostPlan Actual
13 AIRCRAFT FINANCIALLY COMPLETED
0
5
10
15
20
25
30
# o
f A
ircra
ft
Month Ending
Oct-11 Nov-11 Dec-11 Jan-12 Feb-12 Mar-12 Apr-12 May-12 Jun-12 Jul-12 Aug-12 Sep-12
Planned Comp 2 3 5 6 8 8 9 12 13 14 16 17
Actual Comp 1 3 5 5 7 8 10 12 13 14 16
P Induct 1 1 4 7 10 14 17 19 23 24 24 24
A Induct 0 2 4 4 6 8 9 9 11 11 11
Planned vs Actual CompletionsPlanned vs Actual Inductions
0 0
4 4
6
2
00
1
2
3
4
5
6
7
>30 days early 16-30 days early 1-15 days early On Time # 1-15 days late 16-30 days late >30 days late
Nu
mb
er
of
Air
cra
ft
On Time Delivery
On Time 50 %
WIP ENT / TMS - In Process 3 3
Planned WIP Next Month
Late - In Process
Total DELIVERED
Total DEL Late / Avg Days Late 8 9
WIP DEL
SDLM 0 0
PMID 3 16
AWI 0 0
Total Required
Total Aircraft Inventory
Primary Aircraft Authorization
Primary Aircraft Inventory
Backup Aircraft Authorization
Backup Aircraft Inventory
RFT RFT GAP GOAL / RFT GAP 4.5 4.8
RBA Flight Line Gap / RBA 0.0 3.8
100A
I
R
R
S
D
A
T
A
99
Delivered16
115
11
2
89
16
WIP
R
E
P
A
I
R
0
F P

COMFRC PERFORMANCE: ML3 QUALITY
25

Take Aways
We’re swimming in data; the challenge is to construct metrics we can use to operate our Navy better. • We’ve been ‘climbing that mountain’
Readiness Kill Chain is latest focus of leadership
Intense focus on metrics that help us run our three levels of maintenance, that is O-level and ‘Off Flight Line Maint’; i.e., I-level and D-level. • Education of ALCON an ongoing priority
Questions? Stu Paul OPNAV N43 Staff
[email protected] 703.835-7558
14