
UNCLASSIFIED - digital.library.unt.edu/67531/metadc1022207/m2/1/high_res...DISCLAIMER Portions of...
33
UNCLASSIFIED X -822 OAK RIDGE NATIONAL LABORATORY ..*KfiONAL Operated By 'dibillill,IMIN,L/4472#40* UNION CARBIDE NUCLEAR COMPANY ORNL /*if- ljj, if'.... UIE 'I /1 POST OFFICE BOX X CENTRAL FILES NUMBER rvill - 39)) OAK RIDGE, TENNESSEE 1' == · ': _/ lil_ -5 7-6 - 6 7 EXTERNAL TRANSMITTAL AUTHORIZED DATE: June 13, 1957 COPY NO. 34 SUBJECT: EVALUATION OF LOOP, COMPONENTS AND ADM[XED THORIUM-3% URANIUM OXIDE SLURRY IN 20OA LOOP (Summary of Run 200A-10) TO: Distribution FROM: R. B. Gallaher, A. S. Kitzes and C. F. VandenBulck DISTRIBUTION 41 1. HRP Director's Office 18. R. L. Pearson 2. E. G. Bohlmann 19. S. A. Reed - 3. E. L. Compere ' 20. M. Richardson 4. D. E. Ferguson 21. Martin J. Skinner 5. R. B. Gallaher 22. A. N. Smith 6. C. H. Gibhon 23. D. G. Thomds 7. A. S. Kitzes 24. C. F. VaildenBulck 8. R. B. Korsmeyer 25· R. P. Wichner 9. J. A. Lane 26. ORNL Document Reference 10. R. N. Lyon Library, Y-12 11. J. P. McBride 27. Central Research Library 12. I. M. Mliler 28-29. REED Library 13 . W. R. Mixon 30-32. Laboratory Records 14. F. C. Moesel, AEC. 33· ORNLLRC 15· C. S. Morgan 34-48. TISE-Alr 4, 16. R. H. Nimmo 49-55· Westinghouse PAR Project 17, L. :F. Parsly ... . , NOTICE This document contains information of a preliminary nature and -was prepared primarily for inte.rnal use at the Oak Ridge.National Laboratory. It is subiect to revis ion or c6rrection and therefore does not represent a final report. UNCLASSIFIED
Transcript of UNCLASSIFIED - digital.library.unt.edu/67531/metadc1022207/m2/1/high_res...DISCLAIMER Portions of...

UNCLASSIFIEDX -822
OAK RIDGE NATIONAL LABORATORY
..*KfiONAL Operated By
'dibillill,IMIN,L/4472#40*UNION CARBIDE NUCLEAR COMPANY
ORNL/*if- ljj,if'.... UIE
'I /1 POST OFFICE BOX X CENTRAL FILES NUMBERrvill
- 39))OAK RIDGE, TENNESSEE
1' == ·
': _/ lil_ -5 7-6 - 6 7EXTERNAL TRANSMITTAL AUTHORIZED
DATE: June 13, 1957 COPY NO. 34SUBJECT: EVALUATION OF LOOP, COMPONENTS AND ADM[XED THORIUM-3%
URANIUM OXIDE SLURRY IN 20OA LOOP (Summary of Run 200A-10)
TO: Distribution
FROM: R. B. Gallaher, A. S. Kitzes and C. F. VandenBulck
DISTRIBUTION
411. HRP Director's Office 18. R. L. Pearson2. E. G. Bohlmann 19. S. A. Reed
- 3. E. L. Compere'
20. M. Richardson4. D. E. Ferguson 21. Martin J. Skinner5. R. B. Gallaher 22. A. N. Smith6. C. H. Gibhon 23. D. G. Thomds7. A. S. Kitzes 24. C. F. VaildenBulck8. R. B. Korsmeyer 25· R. P. Wichner9. J. A. Lane 26. ORNL Document Reference
10. R. N. Lyon Library, Y-1211. J. P. McBride 27. Central Research Library12. I. M. Mliler 28-29. REED Library13 . W. R. Mixon 30-32. Laboratory Records14. F. C. Moesel, AEC. 33· ORNLLRC15· C. S. Morgan 34-48. TISE-Alr 4, 16. R. H. Nimmo 49-55· Westinghouse PAR Project17, L. :F. Parsly
... . ,
NOTICE
This document contains information of a preliminarynature and -was prepared primarily for inte.rnal useat the Oak Ridge.National Laboratory. It is subiectto revis ion or c6rrection and therefore does notrepresent a final report.
UNCLASSIFIED

DISCLAIMER
This report was prepared as an account of work sponsored by anagency of the United States Government. Neither the United StatesGovernment nor any agency Thereof, nor any of their employees,makes any warranty, express or implied, or assumes any legalliability or responsibility for the accuracy, completeness, orusefulness of any information, apparatus, product, or processdisclosed, or represents that its use would not infringe privatelyowned rights. Reference herein to any specific commercial product,process, or service by trade name, trademark, manufacturer, orotherwise does not necessarily constitute or imply its endorsement,recommendation, or favoring by the United States Government or anyagency thereof. The views and opinions of authors expressed hereindo not necessarily state or reflect those of the United StatesGovernment or any agency thereof.

DISCLAIMER
Portions of this document may be illegible inelectronic image products. Images are producedfrom the best available original document.

LEGAL NOTICE
This report was prepared as an account of Government sponsored work. Neither the United States,nor the Commission, nor any person acting on behalf of fhe Commission:A. Makes any warranty or representation, express or implied, with respect to the accuracy,
completeness, or usefulness of the information contained in this report, or that the use of
any information, apparatus, method, or process disclosed in this repcrt may nol infringeprivately owned rights, M
B. Assumes any liabilities with respect to the use of, or for damages resulting from the use ofany information, apparatus, method, or process disclosed in this report.
-As used in the above, *'person acting on behalf of the Commission includes any employee or 14contractor of the Commission to the extent that such employee or con/ractor prepares, handles
or distributes, or provides access to, any informotion pursuant to his employment or contractwifh /he Commission.

1
UNCLASSIFIED
EVALUATION OF LOOP COMPONENTS AND ADMIXED THORIUM-3% URANIUM OXIDE SLURRY
IN 20OA LOOP (SUMMARY OF RUN 20OA-10)
-
SUMMARYI
A slurry addition system, a venturi in the circulation loop, and two types
of sampling systems were tested with 500 and 800. g Th/kg H slurries in the
200 gFm loop at 250'C and 1000 psig. The addition system worked satisfactor-
ily while the venturi gave erratic readings during part of the run. Both
the capillary and in-line sampling systems proved satisfactory with'the capil-
lary sampler being much easier and more convenient to operate. The addition
of uranium ·to- the slurry had no appreciable effect on the handling charac-
teristics, the attack rate on 347 SS, the particle size and crystallite size
of .the -thorium oxide. The attack rate was found to be 1 mpy during the first
100 hours of circulation and decreased to 0.4 mpy.at the end of the run„
1-1,
INTRODUCTION '
Run 2OOA-10 was programmed to check the operation of several new compo-
nents in the 20OA loop at 250'C and 1000 psig and to determine qualitativelyi
the handling characteristics of a sulfated thorium oxide slurry containing,
urmnium. The new components included: (a) a capillary tube sampler, (b)· an
in-line sampling system, (c) a venturi flowmeter, and (d) a slurry'addition
system. The run was terminated on January 2, 1957 after 777 hours of opera-
tion at 250'C. This repbrt summarizes.the results of the run.
UNCLASSIFIED

2
UNCLASSIFIED
Modifications to the Loop
A. In-Line.Samplir
A recirculating sample bomb, shown in Fig. 1, through which a portion
of the main stream circulates, was installed across the pump discharge and
suction as an in-line sampler. After the slurry circulates through the system
for a few minutes,.a 300 ml sample is isolated in the bomb, cooled to roam
temperature, and withdrawn into a bottle.
B. Capillary Tube Sampler
A capillary tube sampling system which could be used to sample any
one of three locations on the pressurizer and one position on the loop was
installed as shown in Fig. 2. In thts system a tube 0.060 in. ID and 30 ft
long is coiled inside a cooling water jacket to minimize flashing as the
pressura is reduced to atmospheric during withdrawal of the sample at room
temperature. The sampler was designed so that 90% of the pressure drop is
taken across the capillary tube and the remaining 10% across the throttle
valve. For 2000 psi operation, slurry with a densit9 of 2 can be withdrawn
at a rate of 6 cc/sec which is equivalent .to a maiimum velocity of 10 ft/secthr6ugh the tube.
C. Slurry Addition System
A two-liter tank was installed to permit the additibn of slurry to
the loop while the system is at operating temperature and pressure (Fig. 3) .
Water can also be removed from the system through this.tank'if the liquid
level in the pressurizer becomes too high. The operation of the addition
system is as follows:
1. Slurry is drawn into the. tank by means of a vacuum.
UNCLASSIFIED

- -C- 7
..' :, b B " .., ..i
3 P
20OApump
Discharge4
*
0-3000 1/2# Sch 80 Pipepal Fl
Stle'tien1
1 --,C>tq DO ivent Distilled- . ".'-Bofab -C<] P
67N---
Water forSEr€Or Cooling
1/4 nibing05.9
cr300 inl Ssele Z I
4%240%
Col-D<1 9./:
*72 ImfJuguson No. 23 4:
Drain Valve H,9 N
8%
ZFlg. 1
M WIN-LINE RECIRCUL NG SAMPLE SYSPEM
Fig. 1

6 4
9-.
Rressurizer
Pressure Pavducts Valve
7
3/4" TubingVent- :
-H 'Da '
- Vent S«*BlBr 1 wCooling Wate,
-+ 2 mtCapillezy Cooling WaterIatdown -«1-0<»- in
*t* TC,7-- 0
Samge Outlet 6
s * F "BG>> 8
Bed k co Cc.r) ;C
Pressure Pmancts Valve 4%M,53
Fig. 2 5 F218 FRESSURIZER CAPII,LARY TUBE SAMPLE SYSTEMre
Fig. 2...

1 .1
1 53
ORNL-LR-Dwg.-22190UNCLASSIFIED
2
i
1
f Rotameter
1 fF* am Rwge Tank 2
DO -47 0-3000 Del ZJ
--H 0 * 1__» Lapp pulsafeeder
A iTo VenturiPurge System
;6 1
2 Lita,baltienle
]-C l
3" Pune Suotion i
Mr .T
i--
5
:.
Fig. 3
ADDITION SYSTEM (200A LOOP)
I.
Fig. 3

6
2. The tank is brought to pressure by slawly opening the valves
between the purge water tank and the addition tank.
1
-
3. -The valves between the addition system and the loop are then
opened·,. and the purge water flow is adjusted to the desired rate by a throttle
valve using ''a rotemeter to deterifne the flaw rates. A Lapp pulsafeeder,
shown in Fig. 3, can be used to augment the flaw of the purge water if ad-*
ditional head is needed to move the slurry.
D. Venturi Flowmeter
A vehturi, shawn in Fig. 4, was installed in the loop to measure the·
slurry flaw through the 3 in. pipe. To retard the diffusion of slurry intq
the Barton differential pressure cell, a continuous flow of purge water ob-.
tained by condensing steam from the pressurizer is maintained through the
* - manometer lines with the pulsafeeder.
.
Run History
A preliminary oxygenated water run was made for 63 hours at 250'C and
1000 psig to check the operation of the pump. Since the run was being made
at 1000 psig, the main pump flanges were not seal-welded.
After the water run, the loop was drained and charged (time meter
reading - TM 1616.6) with 32.7 kg. of thorium oxide, batch LO-10, 220 g
Th(S04)2' 71 liters of water, and 75 liters of oxygen to give a circulating
concentration of.500 g Th/kg I O containing 3400 ppm of sulfate based on the
thorium oxide and 500 ppm of oxygen, Chemical data for the oxide are listed
in Table I.
After 72 hours of circulation at 250'C and 1000 psig, the loop was
cooled to room temperature (TM 1688.6), to repair a valve which failed

1 .:
:
e- 47 . .
To Mdition Lapp PulsafeederSystem
3 CD = 6 Pt:xm a'rae Th,ak
A==1 tor 1 3arm ZOOA
1/4" mbiDg Instrument AirFump
SupplyBarton 100 inch +
. I
Rotameter 1 dP cell-lit - m
R==der .-7
F X8 D
« Yi « »A Ll«4 1 L I J --
Venturi 3" pipe <W
F t=2IO rgr
Rig. 4 . 231-Zi •
M roVEFURI SYSTEM WITH PORGE 1ZATER FaR MAN{ZI'rER LINES C 1\3
W llH
*-
Fid 4

8
TABLE I.
CHEMIqAL COMPOSITION OF THORIUM OXIDE USED IN 2OOA-10
ORNL
Batch No. Specifications LO-10
Source of Nitrate Lindsay
Calcination Temp. IC -- - 8000
18.4 m/gSpecific Surface Area : ..,. ,
Chemical Composition Ing/g
Th 872 min. 872
Fel <0.005Ni > 0.05 max. <0:005.
crJ <0.005
Al 0.04
S04 0.50max. <0.10
.
co 3.00 max. 2.33
C]1 0.01 max. <0.01
F j 4.01
NO · 0.0 1 mak.. <D.0053
P04 0.01:max.1.
<0.02
Fb 0.01 max. <0.01
Si 0.01 max. 0.02
ca) 0.37
Ba 0·10 max.mj 647*7 0.01 max... O.08
Na 0.01max. 0.26
.

9-Ill.-/0
during sampling. The slurry was not drained from the system. A vacuum was
therefore maintained on the system to prevent the slurry from draining from
the loop while the valve stem was replaced. Operating conditions were restored
and the run continued for 40 hours before the. circulating concentration was
increased from 500 to 800 g Th/kg H20 (TM 1728.6) over the next 116 heur
interval by adding 24.8 kg of unpumped, sulfated thorium oxide, batch LO-10,
stepwise in 7 kg increments. Approximately 1.5 kg of oxide were added per
charge. 1
During one of the additions (TM 1776,3) a drip was noticed at a 1/4-in.
Parker tubing connecter located in the purge water line downstream of the
condenser. As the loop and pressurizer were cooled, the leak was investi-
gated when the pressure was approximately 400 psig and found to be due to
a crack in the purge water condenser jacket. Since the location of the leak
·' was not considered hazardous to the operation of the condenser,. the jacket
was not repaired at this time and the loop was reheated to 250'C. The run
was. continued for 181 hours at the increased thorium level. -
To determine-the effect of uranium on the handling characteristics.of
the slurry, 2080 g of UO · H20 -were added in three steps over a 51 hour
period to give a final uranium concentration of 3% based on the thorium oxide
in the system. The first addition of uranium started at TM 2009.5. With
the last addition of UO ·22O' 2.28 kg of unpumped, sulfated, thorium oxide
- were added to partially replace the solids which had been withdrawn during
sampling. The admited·-thorium-uranium oxide slurry was circulated at 2500c
for 308 hours without incident.
Approximately 100 hours before the scheduled shutdowh (TM 2317:7), a
high presspre water leak was found in the head of the purge water pulsafeeder

10
which could not be repaired while the loop was at pressure. The pulsafeeder
was therefore isolated from the high pressure system for the remainder of
- the run, stopping.the purge water flow to the manometer lines.
The run was terminated at Th 2393.1 for scheduled inspection of the leop '
and the pump after a total of 777 hours of operation at 250'C, and 1000 psig.
Results
A. Capillary Sampler
The capillary tube sampling system proved very satisfactory and no
difficulties were encountered in its operation. The samples were, cool when
collected and the rate of sample withdrawal could be easily controlled by
the throttle valve·with no tendency toward plugging even with slurry of a
- concentration of 1500 g Th/kg H2Oo
1 B. In-Line Sampler
After the first sample was taken, leaky block valves hindered the
operation of the in-line sampling system from then on. To continue testing of
the sampler, freeze plugs were established when sampling to back-up the leaky.. \
3.
valves and to isolate the bomb from the high pressure system. Approximately
30 mimrtes wer.e required to form the freeze plugs with dry ice. Since th'e
sample remained in the isolation bomb during this pdriod, the solids tended
to settle to the bottom of the bomb, which often plugged the outlet valve.
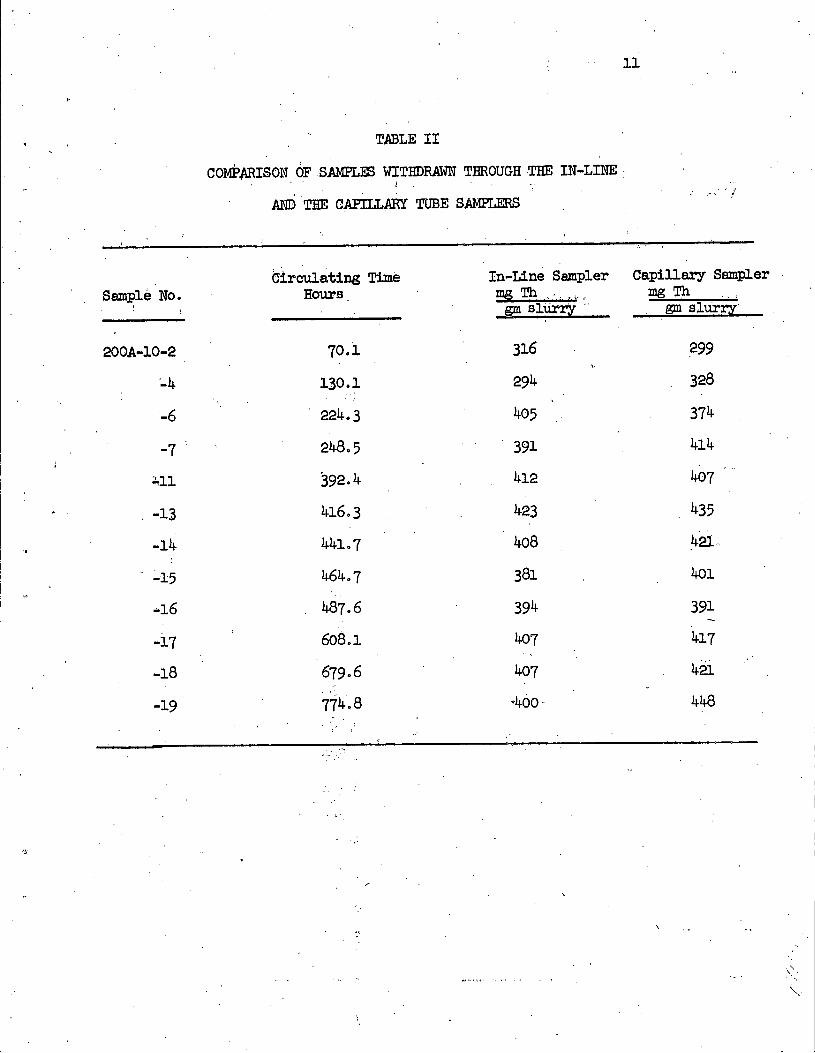
A comparison. of the capillary tube and in-line samplers is shown in
Table II. Referring to Table II it can be seen that the concentration of
the samples taken by the two methods check within f 10% which is good agree-
ment considering that there is a f 2% error in the chemical analysis for
thorium and a 10% error in obtaining a representative aliquot of the sample
for the chemical analysis.
11
TABLE II
COMPARISON OF SAMPLES WITHDRAWN THROUGH THE IN-LINE ·l
iAND THE CAPIILARY TUBE SAMPT.ERS
Circulating Time In-Line Sampler Capillary Sampler
Sample No. Hours. mg Th -. .i·r mg Thgm slurry gn slurry
20OA-10-2 70.1 316 299
L4 130.1 294 328
-6 224.3 405 374
-7 248.5 391 414' '
*11 392.4 412 407
-13 416.3 423 435
-14 441.7 408 421.
-15 464.7 381 401
-16 487.6 394 391-
-17 608.1 407 417
-18 679.6 407 42:L
-19 774.8 ·400 448
'3
\

12
Pump power vs density of the circulating slurry is shawn in Fig. 5 and
Table III. The solid line shown in Fig. 5 was determined from water data
and slurry run 200A-11 using the method of least squares t6 determine the
best line. These points are shown as solid circles.. Comparing these data
with the data obtained by sampling it can be seen that the slurry concentra-
tion indicated by the pump power is consistently 10 to 15% higher than that
determined by sampling and chemical analysis. This bias is probably due to
the unC.ertainties in sampling two phase how.
Venturi System
The ·venturi . flow,meter appeared to function satisfactorily during part
of this run. Purge flow through the manometer lihes was maintained without
.
difficulty as long as the pulsafeeder operated. At the beginning of the run
' the flow meter indicated a flaw of 208 gpm assuming a circulating concentra-
tion of 585 gm Tb/kg H 0(sample 20OA-10-1R). The d/p cell responded propor-
tionately to the first addition of thorium oxide. However the readings
became erratic with subsequent additions of slurry as seen in Table IV for
samples 200A-10-6 through 11. After the first uranium addition was made, the
readihgs increased to 96% of full scale, or to a value corresponding to a flaw
of 220 gpm for a slurry containing 810 gm Th/kg H20 at 250'C (sample 20OA-10-12).
The flaw meter readings remained relatively constant for the rest of the run,
responding to the concentration changes as indicated in Table IV. No satis-
factory explanation has been found for the unexpectedly erratic behavior of
the venturi.
1

KOE 23,2£2 ZZAE,IS. H 311, 23.
I 3$1
-Tr-:Tr-ZZ- -----3-3,--r-r-r- -------rz-----rz----------rzr--T----r----r---7--7--T--T--T--T--T--T--T--T--T--T--T-c --, ,-- . ' . --r - ; / 1 -- 1 ' 1 1-- ,--
------------+--+--4---+--+----1.---+----1----+---+--+--+---+--+--+--+I-+--
-----------z--- ---------- ----+---+------I------------ -------------------- -Z--- -------------:- *-------------+---+---+---+---+---+---+---+---+---+---+---+---+-,7+---+---+---+---C , I-- 1 1 - .- -- \- --- 1.-- ."'::,;.:a; , --,
--------------- --------------+---+--------- ----- ----- - ------- --- ----- --- --------2- --.r:,--z -- -- -.--. --IZ+---+ z=+z:-4----+---+ - -:+- -».Z-+ ---+---+---4---+---+---+---+---+ -I -- 1- - , - -, - , . . . .----1- --1-- --1--- ' , 1- -1 --1. - ' 1 1.,2 '- 1- ;, --- , 6 - 1--- , 5 - - : -=I, - 1 1 ---- - - - -- - 1. .- :.- - - : 1 ; ---1 9- - ,---- ; 1.-3.0--2 -- -1-
, 1. 6 ; ; ; ----1-----6 -- ;· --i./--,----r-- -,- ,----... . . 1
I.1
1- - - , - -1 2 -12,- 1- : - -1. 1- -:----- ----------- -------------4----4------------------------------------------------------------ ---------- -----1----1----4----+---4-----1----*6-.--+---+---+---+-- -+---f---42----i:---q----+---
.. ,1II ...
........... ..... 1 ' 1 1 1 1 : -1 ' 1.. -, I .. , . ' .
1 1 1 -M- :1. : :, 1 : 5/
- - I r, 1 1- i, -1 _1 8 1- - -... , I. ... ..Ii'.--• • · 9 0 3• . • , • ' ' , • , · •' -, 1 1 ,-__-_,_____,____-ir_-_.5__r-_1___23-_-__1___i
---v-----13-- --------------t---t------------------- -------------------- ---«2'---,I.-4 ----- 1,--6,-------- -- * --4 = =*=== ===*= 24==: * =:- -:'t-- i--- + ---t---t:--tz:-t---t--. . . * - 1 - -- 1- - i - 4 - - 1 - 4 - -Z -' - - --' r -'- - - ' - --1 -1 .... - ,- -4 - --, .... --,
'-,11 ---2------ 1:r -----" 1"-t, fiE---- --- r---1=---- --- --1-------------- -P------------':---------.-2<-T---1.--1---tr - r--t---1:m-t--r frat---t :- t-rrtr-- ----t--- t : Tr----1 3 -4-- 1 : 1- - : ... - 9 1-2 :
1
--EU-=__1-Z-_- =-EZE-r=Z----- t,--22-ZE_--_---_E-EE_-E-Z-==EE-_-.---i=_2..=-_EE-i=-- r=fE::c--2-----==-1--,2- f --rt=-Z,r.Z-+--..---t--:.----F2=..---+---+---+---+---t---t---t---t---... '...
-- 1-- -1- - ./ 1 / 1 1-
1 -· · ; n - · - - - - 4 1- -|- - 1 I l- | | I: - 9:IM.. 1 | - - ' M- , 2:-T|: 1 T I L , • , -- , .- - - - - - - - - - r- - - ,
---- -- -- - - - - - ...-0. ..---- ---- -- - --,- -,---;- 1 ; 5 --- : : - - 17-1 1. . . . . .6 - - J - - - - - - -1- , --, , - - 64---3-----------------------irt---t----zz-----:-45.....2:....--"bst-33--:z---------------z-----z--2--1----t---t-- t---t---t---t---tii"*'Iwif --t---t---t---t---t---t---t----14«;Mi -- ... - - .- - . - .
1 1 1 _• 1--- - -- - - - - - ----- 1-1 1 1 1 ... .1.- •• 1 - 1.-• - • • i i N-----------z--- ------------33+---+----------2 ------- -_£--------------<-----Z-2 ------------Z---------t-Z-+---+---+---+---+----184-**ki.*imw¥-2, Spw @4 '.r+---t---t---t-ii-Pil--... -- -- 1 1 --1 1 1 ' 1 ' 1 1 1 1 1 1 l2 i i i iii:.. '-- 1 .L...., -.,, 1:
.
·- - ----1 --r---c-- ; ' -- 1 -1 - 1..........., 4........4 ; L 72 -.--9--2- ---3-:- --=-: -------.2-i---:i-22=:,Ezz.1..--2221=:Er=====--22.22:---2 Ez-z-:E--E-E--Z----E-r--EE:z.---zi--r-f=-Z+Z---1-----i----i-----p,-:4:'I'*.«.'r*'W'r 6·-1-1 ·*'a'T-----1----t-2- +F-2
... . . . . . . . . . .-- ------ - -- - ; .4-'-- ------ -- - --- ------- --- --- - - ----- ;2- I - 0- .-- . ......., ...,p I . - . .... . . . , , '' I
-----------=9-----------------3.0-t------2--------------------=2.-----------=------- ------------------------t---t---t---t---t---t---t---ta,nlp=-7FQ21ti;-t---t--ft---t---t-Fr -72r--... ....
C- .....- ...
--
:-L-------+--+I -----------------.----- - - - . - --- ---- tri-+---+---+---+ --+---+---+-.-+- -+ --+---+...+- +-:-+---+---+--1 --r - '-- , ' ' 'i' -1 -1 ; ; 1- ; : L:1 1 ' '
i ; 1 -r .' i -_,. -_ 1 , 1. , --r iii8- :24---F-Z-FI--+---+---+-1--1---=+---+---+---+---+---+---+---+---+---+---
af --- -- I ------- -- -- --- ----- -z: IE,ii;12,:Iii I EIi-zzz:- F • ' . • ' ' '
. i.
- - -* -- - - - -* - - ---- - *9
4.- --1- _ .1 1 1- - f K 1 1-- 1. -
\.A ..·) r.·1 .2..3 Tir,-7..r- 11. r,731 ir,--1-4... ...,........ ... „.... ,1. il
- 1 11
Fig. 5

14
TABLE III -
DENSITY OF SAMPLES AT 250'C
In Line Sampler Capillary Sampler
Circulating Concentration Density* Concentration Density* Runp
Sample Time mg Th 2 - mg Th ' :21 Power
No.hr · 'en slu Y ml
san slurryml· kw
20OA-10-0 17,3 255.5 1..090 ' -- .... 11.7 ,
-1 ..35.0 .250 1.262 --': -- 11.7-2 70.1 316
·
1.187 299 1.159 11.6
-3 87.7 -- -- 306.5, 1.177 11.5-4 . 130.1 293r5 1.150 327.5 : 1.212 11.7
-5 153.0 360 1.282 12.4
-6 ·224.3 404.5 1.382 373.5 1.310 12.7-7 248.5 391 1.350 414 1.417 13.1
18 255:8 *- 13.0-- --
-9 278.6 -- "- 410 1.405 13·0-10 296.7 421 1.425 5;68..5 1,978 13·0
-11 392.4 412 1.41 . 406.5 1.387 12.8-12 398.3 -- -- 450 1.514 13·4-13 416.3 423 1.433 435 1.463 13.4-14 , 441.7 407.5 1.391 420.5 1.423 13.2-15 464.7 380.5 1.323 400.5 1.372 13.0
-16 487.6 393,5 1.354 391 1.35 12.9-17 608.1 407 1.389 416.5 1.417 13·4-18 679.6 406.5. 1;387 421 1.425 13·5-19 774.8
;
400 1.370 448 1.503 .14.0
* At 2500C.
\

15
TABLE IV
LOOPFLOW
Slurry Concentration Indicated flow*
Avg. of Indicated, using slurry
Chemical by concentration based. on
Analysis Pump Power Venturi Chemical
Sample ma Th mg Th Reading Analysis Pump PowerNumber gm slurry gm slurry % grm gF[n
20OA-10-0 255.5 358 73 226 207-1 350 358 73 208 207-2 307.5 350 74 218 210
-3 306.5 345 74 218 211-4 310.5 358 78 224 214
-5 360 406 78 214 205
-6 389 427 65·5 188 180
- -7 402.5 450 75 201 198-8 -- 445 56 -- 163-9 410 .445 46 153 148
-10 421 445 44 148 144
-11 409 404 64 182 178-12 450 463 88 208 204
-13 429 463 88 ,213 204-14 414 455 92 - 221 211
-15 390.5: 445 96 234 218
-16 392 438 95 230 220
-17 412 463 99 230 218· r-18 4i4 472 >100-19 424 495 >100
* A flow of 208 gFm was measured with water at room temperature
using a calibrated orifice.
I.'.

16
Additien System
- With the addition system, slurry could be added to the loop at a rate
of approximately 1-1/2 kg of thorium oxide per 40 minutes without difficulty
while at operating conditiens. At higher concentrations than 800 g Th/kg H 0,
the lines connecting the addition tank to the loop tended to plug and the
pulsafeeder was needed to develop sufficient head to move the settled bed.
Generalized Attack
The total iron contamination in the slurry, a measure of the attack
on stainless steel, is shawn in Fig. 6. Samples were taken according to the
schedule shown in Table V.
Referring to Fig. 6, the iron build-up showed the characteristic rapid
initidl attack follawed by a much lower attack. For the first 95 hours of
; circulation, the attack rate was 1 mpy. The attack rate decreased slightly
during the period the slurry concentration was increased from 500 to 800 g/kg
and appeared to be leveling off at 0.5 mpy when the uranium additions were
made. The addition of uranium had little effect on the attack rate--the rate
was 0.4 mpy for the 325 hour:;interval in which the thorium-uranium slurry
was circulated at 250'C. Similar results were reported for a thorium-
uranium slurry circulated in a 100A loop. 1
A greater localized attack,occurred in areas of high velocity, as evi-
denced by the rates of attack listed in Table VI for the stainless steel
orifice flates and the titanium impeller; however, these localized rates
are comparable to those obtained with the pure thorium oxide slurry. 2

M*E 20 X 20 TO THE INCH 359-1 OgGKEUFFEL C ESSER CO. MADE IN U.S.A.
IT
11:
447-
TIT
, 111 .9
5. III Lt
1
,- -- '«...
- 5-
.... ''
- ·.' "- · -- -- 7-*,A - TTA :-3- -1 --- - rr'k #T -. I --- ..'..I ...... ....-.-
lt. ) -10 + .iLL _.
-11 Ji f. 11 13= R -0--- ... --. I.- . . . „ - - / ---1.-I.--- ...-----
0:111 5,
.'. 1..I .
i 1.,1811 1 6 4' ..4.1:1 'P:d-,/ 3
9
/.
.t 1:.t 'Ch·--.3..
. 2.:11.-r,1:.' 3,1 - i-4-- '. ..
--1.1-*r--
4.--- -----
1 1,3'1.h L.: 2
- 1-, 19 -9 1 -
1/ -/4,
U
.:/C: .../. -4...: ..'.
/J/. - -- ..A, 5- 1-'
/5 - ..T .- . 1........
0\I
./
44-; i ;. ; -; 4 r 11 ; . 4 1- - r 1 -1 .. -, . . ......... ......'. I ....... . . . - . . . .
Fig. 6
L.

IgTABLE V-
CHEN[[CAL DATA, PUMP POWER REQUIREMENTS AND VENTURI READINGS FOR RUN 200A-10
· SOLIDS (based on slurry) FILTRATE PUMP POWER
Sample Time, ' Th..Th U Fe Ni Cr Ti ..'·- : SO16 PH PH SO - U4Number hr mg/g g/kg 4-0 mg/g mg/g mg/g - mg/g.:-.-mg/g · mg/g.. · · ... · . « Ppm ppm Amps. kw
O R 17.3 ' 255.5 360 0.018 <0.005 <0.905 <0.02 3 0.9 7 6.7 6.2 8 16.8 11.70 BP 5.7 6 -- -- -- -- -- 5.4 -6.2 70 TP'. -- --'. 6.8 <5
1 R /35.0 350 585 0.036 0.006 0.008 <0.02 1.30 7.3 6.2 10 16.8 11.71 BP --- 5.1 <51 TP 6.5 <5
2 R -:70.1 · 316 496 -- 0.045 0.008 0.008 <0.02 1.04 6.1 6.1 6 -- 16.8 11.62 L 299 455 O.053 0.008 0.010 <0.02 1.19 5.9 6.1 82 BP -- 5.1 <52 TP - -- 6.7 <5
3 L 87.7 1 306.5 472 0.050 0.007 O.009 <0.02 1.20 5.6. 6.9 6 -- 16.7 11.5112
Added 3. 2 kg Th02
4R 130.1 293.5 443 - 0.053 0.005 0.009 <0.02 1.15 5.9 6.2 6 17.0 11.74 L 327.5 525 0.056 0.008 0.013 <0.02 1.25 6.0 6.4 64 BP 1. ...: -- 5.1 <54 TP -- -- 5.6 5
133 Added 7.8 kg Th02S
i. - . . .5L 153·0 »- 614+ .4 - -0.077 --0.01:4 ··0:·013· ·--0.02 . 1.53 6.0 5.1 6 - 17.8 12.45 Tp __ __ -- -- -- -- -- -- -- --
165 Added 7.0 kg Th02
6 R 224.3 404.5 755 0.084 0.012 O.018 0.03 1.35 6.0 6.3· <5 18.1 12.76 L 373.5 654 0.083 0.013 0.010 0.02 I.25 5.7 6.2 <5 -- --
6 TP -- -- -- --
228 Added 6.8 kg Th02

.Table V (continued)
19
SOLIDS (based on slurry) FILTRATE PUMP POWER
Sample Time, Th Th U. Fe-- Ni Cr Ti SOi. PH PH S04 UNumber hr mg/ g/kg -fo mg/g mg/g mg/g mg/g mg/g mgyg P: 11 Ppm Amps. kw
7 R 248.5 39* 710 0.071 0.014 0.020 0.02 1.26 6.0 6.3 <5 18.8 13.17 L 414 790 -- 0.089 0.014 0.020 0.03 1.46 5.9 6.1 <5 --7 Bp 5,6 <5 -- --
7 Tp .-- 5.3 <5 · --
8 L 255·8 Sample Lost -- -- 18.8 13.0
9 L 278.6 4io 776 0.091 0.013 0.019 0.02 1.56 5.9 6.5 .5 - 18.8 13.09 TP -- ' -- --
10 R 296.7 421 816 -- 0.099 <0.005 0.012 0.03 1.57 5.9 6.2 6 -- 18.3 13·010 L -- 568.5 1640 0.138 <0.005 0.026 0.04 . 1.47 5.6 6.2 7 --10 BP -- -- -- 4.5 <5 -- =-
10 TP -- -- -- -- 5,1 8 --
11 R 392.4 412 783 0.130 0.012 0.024 0.03 1.59 5.8 7.1 9 18.5 12.811 L -- 406.5 766 0.122 0.007 0.026 O.04 1.63 5.8 6.4 10 -- --
11 BP -- -- -- -- 4.7 <511 TP -- -- -- -- 5.9 13 --
393 Added 300 gm UO3'H20 -
12 L 398,3 450 932 2.8 0.128 0.028 0.020 1.55 5.2. 6.0 10 19.4- 13·4
13 R 416.3 423. 823 2.6 0.124 0.015 0.015 0,04 1.53 5.2 6.1 8 19.2 13·413 L -- 435 870 2.8 0.134 0.026 0.026 0.05 1.60 5.2 5.7 1013 BP -- .9... -- -4, e. - d. - b. 4.6 <5 p4...1 » .13 TP -- -- -- -- -- -- -- 4.8 16 -- 90
420 Added 740 gm uo3 ' H20
14 R 441.7 407.5 768 7.47 0.123 0.032 0.033 0.04, 1.37 4.5 4.9 17'. 19.0 13·214 L -- 420.5 815 7.60 0.129 0.025 0.036 0:03 1.53 4.5 5.0 16 --14 BP -- -- -- -- 4.2 5 --14 TP 6- -- -- -- -- -- -- 4.5 11 -- --
444 Added 1000 gm U03•820 and 2.28 kg Th02

Table V (continued)
LUL. I.
SOLIDS (based on slurry) FILTRATE.. PUMP POWER
Sample Time, Th Th Fe Ni Ti SOh pH PH SO U4Number hr
,
mg/€ .- g/kg HCO mg/g mg/g ' mg/g /g - mg/g * mg/g ppm ppm Amps. kw -
15 R -464.7 380.5 617 14.9 0.130 0.036 0.016 O.03 1.35 4.2 4.3 105 234 18.5 13.015 L 400.5 744 14.9 0,125 0.039 0.019 0..05 1.43 4.W 4.3 102 219 -=
15 BP 541.5 1441 10.2 0.150 0.039 0.020 0.07 1.90 4.6 5.0 11 5 -- --
15 TP -- -- -- 3.5 33 17 --
16 R 487.6 393,5- 718 1105 0.130 0.036 0,030· <0,02 1.50 4.0 3.9 84 137 18.7 12.916 L 391 710 11o 5 0.122 0.035 0.032 O.06 1.56 4.0 4.3, .-56 100 :
--
16 BP 554.5 1528 17.8 0.174 0.050 0.027 0.06 1.90 4.1 4.2 48 71:
- 17 R 608.1 407 76 1207 9.135 0.037 0.033 0.06 1.91 3.7 3.8 65 =- 19.2 13.417 L -- 416.5 800 12.4 0.155 0.045 - 0.036 0.0 6 -0.79 - ·3.6 -4.0 56 -- --
17 BP -- -- -- -- 3.9 19 19 ----
17 TP -- -- -- -- 2,4 199 52
18 R 679.6 406.5 764 12.9 0.196 0.064 0.031 0.04 1.69 4.0 . 4.3. 53 55 : 19.5 13.518 L 421 816 14.2 0.192 0.039 0.036 0,05 1.57 3.9 4.1 43 47 --
18 BP -- -- -- -- 3.5 23 24=- -- --
18 TP --, fee -- - -- -- -= - 2.6 199 90 --
19 R 774.8 400 741 12.2 0.180 O.051 ' '-0.037 Q.05 1.88 4,4 4.2 53 -- 20.1 14.019 L 448 923 14.4 0.202 0.955 ' 0.044 0.06 1.34 4.5 4.1 51 · -=19 BP -- -- -- -- -- -- -- -- 4.1' 8 <2 -- --
19 TP -- -- -- -- -- -- 2.7314 ]35,5
-- --
R In line recirculating sampler SL Loop sample station &BP Bottom pressurizer sample pointTP Top pressurizer sample point

19
/ DITABLE VI
LOCALIZED ATTACK ON COMPONENTS
Component Slurry Velocity Attack Rate, mpy(fps) Th-U Slurry ThO--2
Stainless steel erifice plate 1 37 36 30
Stainless steel orifice plate 2 65 246 132
Titanium i eller 5
3
-

20
011Handling Characteristics
There was no difficulty in handling the admixed thorium-uranium oxide
slurry. It pumped well and no cakes or accumulations were found upon draining
the loop at the end of the run. Approximately· 97% of the thorium oxide charged
to the loop was. recovered., If spheres were present in the pure or admixed
slurries they .were too small to be clearly identified within the resolution
of the microscope used. Particle size data determined by sedimentation in
xylene with olelc acid as the dispersant are shown in Table VII. According
to these data, the particles were degraded so that 70% of them were less than
2 microns in diameter after 17 hours of circulation at 250'C. The addition of
uranium oxide to the slurry did not affect the particle size distribution;
approximately 70% of the ddmixed solids were still less than 2 microns in
-
diameter.
. Surface area and X-ray crystallite size. data, shown in Table VIII, indi-V
cate no changes occurred in the crystallite dimensions. However, there was
an increase in the surface area 6f the pure oxide, determined byN2
absorp-
tion, as the particles were degraded during the first 88 hours of the run;
the surface area increased from 18.0 to 25.0 square meters per gram. Also,
there-appears to be a slight decrease in surface area with the addition of
uranium. However, additional data are needed to corroborate these ebserva-
tions.
Pump History
When the pump was opened, the impeller and thermal barrier appeared
-, to have sustained very little. wear as seen in Figures 1 and 8, however, the
surfaces exposed to high turbulance.:acquired a minor polish. The titanium

21
fi3
TABLE VII
PARTICLE SIZE AS DETERMINED ·IN SEDIMENTATION IN
XYLENE AND OLEIC ACID WITHOUT WARING BLENDING
Sample No. Time <7 <5 9 <2 <1.5br It 11 11 11 p
O R 17.3 94 92 84 75 32
1R 35.0 100 99 95 83 41
2 R 70.1 99 98 93 87 822 L 97 95 94 87 57
3 L 87.7 94 93 90 77 ·61
4 R 130.1 93 91 82 72 6344 L 95 92 86 78 --
5 L 154.0 96 93 90 73
6 R 224.3 98 97 95 90 536L -- 96 96 91 88 75
7 R 248.5 98 96 92 92 74T-L. 100 93 93 90 78
8L 255.8 98 94 88 81 70
9L 278.6 99 97 96 90 87
10 R 296.7 100 99 97 91 8510 L -- 100 100 100 . 87 84-11 R 392.4 97 98 96 95 6811 L -- 99 98 96 93 8i
12 L 398.3 99 98 98 79 47
13 R 416.3 98 98 95 94 5813 L 100 98 96 95 9313 BP 97 95 94 65 31
14 R 441.7 95 94 92 89 4114 L 94 92 90 80 54
-

21-a
2*Table VII (continued)
Sample No. Time <7 <5 9 <2 <105hr Itt 11 11 11 11
15 R 464.7 97 96 94 76 4515 L -- 97 94 91 78 51
16 R 487.6 99 98 · 95 80 4416 L -- 98 97 95 71 4116 Bp 98 -97 94 41 1816 BP (re-run) t 98 96 91 83 36
17 R 608.1 99 98 96 54 2317 L 98 96 92 78 45
18 R 679.6 96 : 95 89 74 2518 L -* 98 95 89 58 32
19 R 774.8 98 96 92 87 6119 R (re.run) -- 94 90 88- 69 3419 L 96 96 96 91 7719 L (re-run) -- 89 89 87 82 45
R In line recirculating sampleL Loop sample pointBP Bott6m pressurizer sample point

22
&-6-TABLE VIII
SURFACE AREA AND X-RAY CRYSTAILITE SIZE DATA
Circulating Time , SBrface Area Crystallite SizeSample No. Hours M-/fin. A
Original oxide 0 18 220
0 R 17 22.8 218
3 L 88 25.0 - 227
11 R 392 23.5 239
13 L 416 23.0 228
14 L 442 22.5 232
17 L 6o8 21.6 2304
19 L 775 . 22.1 230
"*'S
J
.
'I
.

4, 8
(77 1:"< riPhoto-27820
UNCLASSIFIED--
'*
·4 - 4, fl·
..4. ....A.f 'G. S0. 2 .AR
*.4 *92
-
1 2419<. ... ,
.*1 .•4·t ., .
Aft. 3 1,..di· i ·t
r., I,/, 0.
:t ./.'I .. : . . ..4:(';.>. 6.- . . /'14
1... -. S , 1,:tist»e 1
- 1.I .1 ,.,11,1 7
I .2 - 74...:
9. » *...... .'..
1.11. --1 -- 1- I I 'Wkitaj k.:. f.yl :22.1, '.
., .2,- 'I ..'.-....
I.
c. :.. . 4 ..-r:..r.,i .4 ,·.\ . . .t .... I\.& i . " .--In:·<74 f... .. .:
•> E M . d ., t. ; I * . ; ' . ' i:- 1.,• -. . , I=.:f:,1." e - s '11,1 ., I 1.12&.:I. 1,·- . - .:.41 f
40. - '.- rfirA+9'.4 H. 39- - --*-
,//1,1, ,1/1/1, 11/1,11 /1,1/1, '1,1,1, '111'1' 0 1 2 3 4 5 6
INCHES
Fig. 7 Run 20OA-10 Impeller

4
Photo-27821UNCLASSIFIED
-il· t, "L.
4-, ·.: . - V ff ...:..- *.7 ,. . 4....'.4 4/ MA.P.:... ,5....". ·:.r-le I.«-,F ··*".6·41<4 ··r "·71-, ·'· 3.· fit'v 1<·:I.-p#3457·t:*&4·U, X. '. ··· i., ':. 0. . . . . .... .. ... ...... .,-:.d'...P „1:.' .,1'..S'.-'. . . . . ... '. .
-·6 ''I'- / - -·',;·.).. 00:. ··- I' ,li'. . *,11#.il..... ...-/*
... ...'· ' r.i, '.:.., . . . . . :r. . .
-* . . . . -: 5.S'. &.:4.9... . . 3.. -...': St/4*.--/..
.ilbs'<.6.:r..
. . 6ii.
· r ...·4 4 '......k.-1 ...
-
f ..S1 .
./
I & 45 3 - ...:
E--b. .
..... 34...........'....Hi 2./. *.,.7%.*14.-.... -.*. :Eck, .
. %"'I. * I . '1/. :/ I /
• • ' 4 'll'
' .... .-'<*. ........ .. . .,·...... ., 1,· . .\'..,S I .<... ' M .,. AA. -2 4.... 5- ..'....
. i t. ' . ...'... . 5. 5 .. v . . . . ,.. :
:-'p:.:. *. :.,4....5... ·$ S
;. 4 . 7 . le..71....,.„ .: ..; . , .'...t:'.. .*.. „ . „ .. , ,. ......1 .. I
.·. - ·,.... ·1·,·1..,A·:.2 *.3..49 - *-, ..4 1. K..U...t. i,.i, ,,:.i,. - ,
'. ,- ..:1 '.:it, 42 0":13.:••u-:-44..... Pt .43 .
-9. '••..7 't ..6 4. 3- -,S,VE.4-9 I ...r /
.-4.
1 1'''''''1'''''''L''''''' ''L'' 5 .1,11INCHES
Fig. 8 Run 20OA-10 Thermal Barrier

UNCLASSIFIED 25tgimpeller was not pitted although it lost 3.5 g in weight and was highly
polished. The front hub was worn 0.001". The stainless steel seal rings
• in the thermal barrier were not worn whereas the titanium seal rings in the
volute liner wore 0.018 inches..
Several small cracks were found in the upper stellite 19 journal of
the rotor in a 1/4-in. band which extended· around the journal 3/4 inches
from its upper end. This 13;&#d was discolored, indicating overheating as the
possible cause for the cracking. The upper graphitar radial bearing failed
in a ring corresponding to the area of failure for the j6urnal. The' ldwer
graphitar radial bearing showed a tapered wear of 0.004 inches maximum with
the wear occurring at the lawer end; the lower stellite 19 journal showed no
wear. The Kingsbury graphitar thrust runner and stellite 19 shoes 'appeared
to be in good condition.
..
g
*
.
UNCLASSIFIED

UNa,ASSIFtip 26.j
17.1REFERENCFS
r 1. A. S. Kitzes and C. A. MbLaughlin, Evaluation of Admixed Thorium-2%-
Uranium Oxide Slurry in 10OA Loop, ORNL CF-57-2 83 (Feb. 11, 1957)·
2. R. B. Gallaher, HRP Quar, Frog. Rep. July 1, 12 S ORNL-2148, P 58-62..
-
-
'
4
1/
UNCLASSIFIED


