UNCLASSI FLIED AD I 10 - Defense Technical Information Center · UNCLASSI FLIED AD I 10 ... two...
48
UNCLASSI FLIED AD I 10 DEFENSE DOCUMENTATION CENTER FOR SCIENTIFIC AND TECHNICAL INFORMATION CAMERON STATION. ALEXANDRIA. VIIGINIA UNCLASSIFIED
Transcript of UNCLASSI FLIED AD I 10 - Defense Technical Information Center · UNCLASSI FLIED AD I 10 ... two...
UNCLASSI FLIED
AD I 10
DEFENSE DOCUMENTATION CENTERFOR
SCIENTIFIC AND TECHNICAL INFORMATION
CAMERON STATION. ALEXANDRIA. VIIGINIA
UNCLASSIFIED
NOTIC:. When governnt or other drawings, speci-fications or other data are used for any purposeother than in connection with a definitely relatedgoverment procurement operation, the U. S.Goverment thereby incurs no responsibility nor anyobligation vhatsoever; and the fact that the Govern-ment my have fomulated, furnished, or in any waysupplied the said drawings, specifications, or otherdata is not to be regarded by implication or other-wise as in any -aner licensing the holder or anyother person or corporation, or conveying any rigtsor permisson to snnufacture, use or sell anypatented. invention that wLv In any way be relatedthereto.
1374i11U/
m/
4 3 7
A- 356 TYPE ALUMINUM CAST ALLOY, PART 7XEFFECT OF BERYLLIUM CONCENTRATION
RESEARCH & DEVELOPMENT REPORT SM-44658
MISSILE & SPACE S-YST*E-MS DIVISION-DOUGLAS AIRCRAFT COMPAMNY, INC.SANTA MON 1CACALl FOR.-.4-A-
oo,,o- , ./
~~G1~ 4NO. S14k4658
L TYPE ALUMINUM CAST ALLOY,PART II,I EFFECT OF BERYLLIUM CONCENTRATION)
I -
I METALS-CERAMICS BRANCH
I,IiIi
IPrepared under the Sponsorship ofThe Douglas Aircraft Company
Independent Research and DevelopmentProgram. Account No. 1 -030.5.0
Approved by
II I-Ce~i cs BranchMaterlals Research & Production Methods
Catalog No. PDL 36073
I
!2
I SM-44658
I,This investigation was conducted to determine the effect of variations of
beryllium content on the mechanical properties and part strengths of "high
purity" 356-T6 type aluminum alloys. Results are reported that were
obtained from a series of similar "Tee" - shaped test castings, poured by
two foundries in both sand and permanent mold, using metal of six.different
compositions. The Wee's0 of all chemistries were solution heat treated
similarly and were aged for various times at two temperatures.
Both in sand castings and in chilled castings, at any aging temperature or
I time used experimentally, ultimate strength and yield strength increased
from five to ten percent with a 0.20 weight percent increase in beryllium
concentration. Elongation was not affected by beryllium additions. Part
strength, as tested in bending, was increased by this increase in beryllium
content approximately five percent when aluminum chills were used, three
percent when iron chills were used and ten percent when unchilled.
I
SM-44658
Page: I
I
The majority of high strength, high integrity, light metal alloy castings
are currently poured in a multiplicity of chemical combinations within a
relatively restricted analytical range of the aluminum-silicon-magnesium
system. These numerous 356-360 type aluminum alloys differ from each
other only in the independent amounts of silicon, magnesium and beryllium
present and in the level of iron impurity permitted. The mechanical
properties of each of these alloys have been described. The strength
data reported, however, are usually for a single, specific chemistry.
They are usually obtained from dissected segments of a given production
casting, repetitively poured by one foundry.( I) Such data are not
directly comparative with the published values for other similar all.oys,
poured in other configurations and produced by other foundry sources.
The evaIlable date .ave not demonstrated the individual and col lective
effect of the four chemical variables on relative alloy strength. The
present study is an exploration of the effects of each of these variables.
The current chemical limits of this family of alloys are relatively
narrow. The specified range of allowables vary by weight percent from
6.5 to 10.0 for silicon, from 0.2 to 0.7 for magnesium, from 0.0 to 0.30
for beryllium and maxima for iron varying between 0.20 and 0.5. Of these
variables, the effect of magnesium concentration on the relative strength
of the present 356-T6 type aluminum alloy series has been previously re-
ported (2). The chemical effect of silicon has also been studied and was
determined to be negligible, at least within the prescribed compositional
range (3). It remained, then, to explore the influence of beryllium and
iron on this alloy system.
I
SM-44658Page: 2
I.RO IO (Conrad;')
III Effect of Contamination
The deleterious effect of iron and other minor alloying constituents on
the ductility of the aluminum-silicon-magnesium system has been
recognized on a theoretical (4) and a practical (5 ) basis since the time
(6)356 aluminum alloy was first suggested as a potential casting material
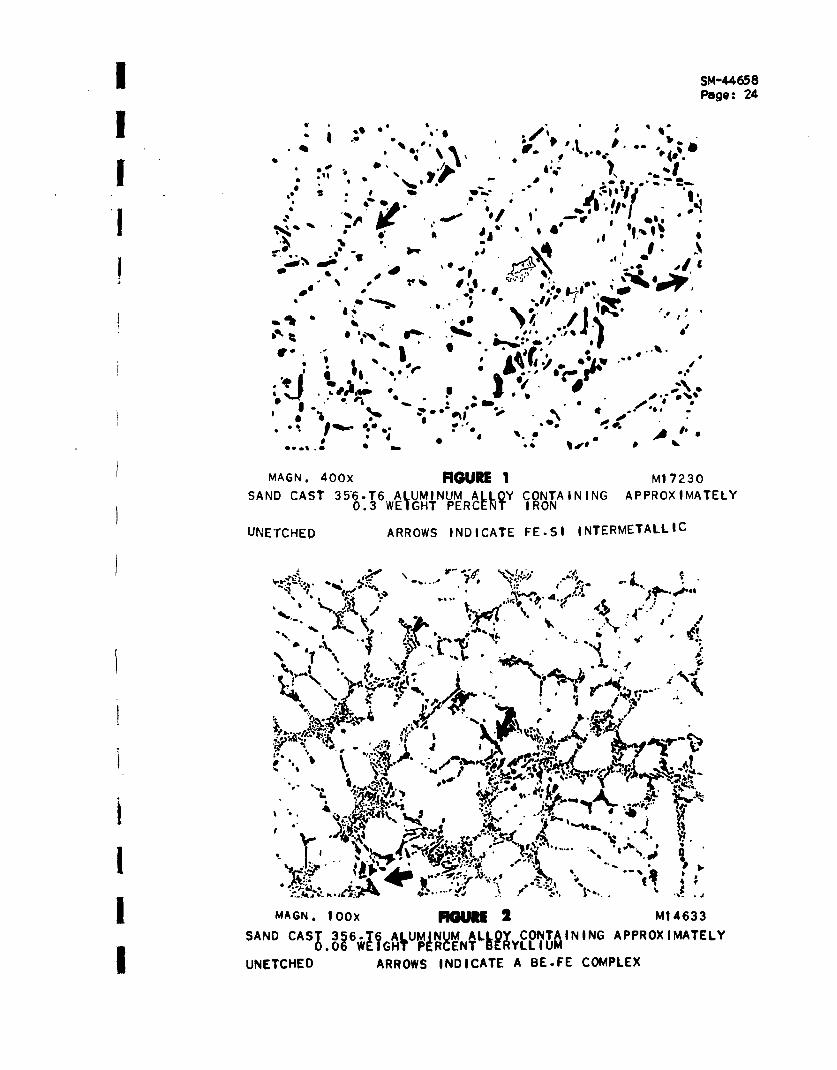
Iron, as shown in Figure I, occurs as an impurity in the form of thin,
often acicular, beta iron-silicon intermetallic compounds. These
embrittle cast structure in proportion to the amount present I It
was the recognition of this fact that led the Aluminum Company of
America, in 1954, to the announcement of XA356 as an experimental alloy(8 ).
This material was identical in nominal composition to 356 but with a
reduction of the maximum permissible level of impurities. The reduction
of iron concentration from 0.5 weight percent maximum to 0.2 weight
percent maximum resulted in more ductile castings. This added ductility
could be utilized by permitting increased aging times and/or temperatures
to provide higher ultimate and yield strengths while maintaining adequate
elongation. The aluminum alloy XA356 was immediately followed by the
market introduction of A356, HP356 and X357(9 ), all "high purity" alloys.
1.2 Beryl ium Additions
Apparently concurrent with developmental work on "high purity" 356(10),
Cron and Zeuch of North American Aviation approached the problem of iron
embrittlement with an attempt to chemically complex the iron rather than
to remove it from the alloy. Early in 1956, a North American Materials
Specification was issued describing a material, called initially 428,
and patented later as Tens-50 (11 ). The alloy, nominally 8.0 weight per-
cent silicon, 0.5 weight percent magnesium, contained a 0.15 to 0.30
l SM-44658Page: 3
1.2 Beryllium Additions
l weight percent beryllium addition which "helps control embrittlement by
modification of the iron needles to probably AI-Be-Fe-Si-A15-Si and
B-Fe-Si-A15 12 . A photomicrograph I I I ustati ng th i * reported mod i f i cat I on
l is shown as FIgure 2. A 0.4 weight percent maximum permissible iron
level was specified for this alloy.IUsing the principle of iron modification by beryllium, but coupling it
with the use of high purity alloying materials, Precision Castings of
Costa Mesa, California, formally announced in 1957 a material designated
I as 356CB(13). This material, properly cast and heat treated, showed a
I marked advantage over any competing alloy in the mechanical properties
of heavily chilled castings( 1 4 .
1 Since this time, it has become increasingly common foundry practice to
make arbitrary beryllium additions to the 356 type aluminum alloys in
order to enhance mechanical properties, and inhibit magnesium loss
during melting. Due to the expense of the element and the 0.05 weight
percent maximum impurity limit imposed by many specifications, this
beryllium addition is usually small.
1.3 Test Configuration
The relative effect of small compositional variations in beryllium on 356
type aluminum alloy strength could best be studied, not in separately
cast test bars where minor strength differences between alloys might be
masked by rapid cooling and ideal gating, but in a structural configura-
tion of as much complexity as is economically feasible. A series of such
castings could be reproducibly poured by a fixed foundry technique using
metal of known, variable compositions. Such parts, after comparable heat
I
I SM-44658
Page: 4
1.3 Test Configuration
treatment, can be statically loaded to failure under controlled conditions.
Numerical test values so derived should be definitive. By studying the
I relative functional strength of a given configuration in its entirety,
I the various alloy compositions can be compared directly. These part
strength data should be far more valid than are the mechanical property
results generally obtained in alloy and heat treat studies which make use
of separately cast test bars. In addition to part strength tnformation,
I such a configuration could also supply standard mechanical property values
derived from coupons machined from dissected segments of the failed
castings.
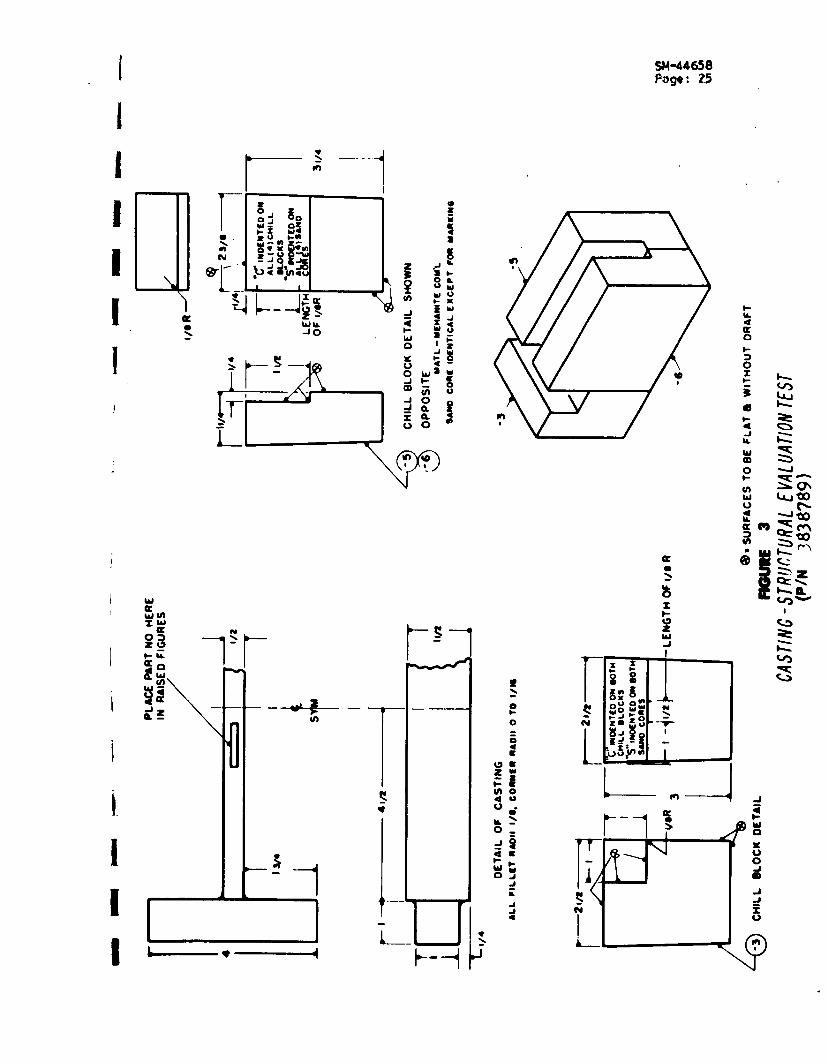
I The "Toe" bar casting, pictured in Figure 3, is one of two test con-
f figurations currently used by Douglas in foundry and alloy evaluations(3 )
(14). While the configuration is uncored, and suggests little necessity
to vary gating and chilling techniques, it does permit a strength eval-
uation not only of coupons cut from the casting but of the parent casting
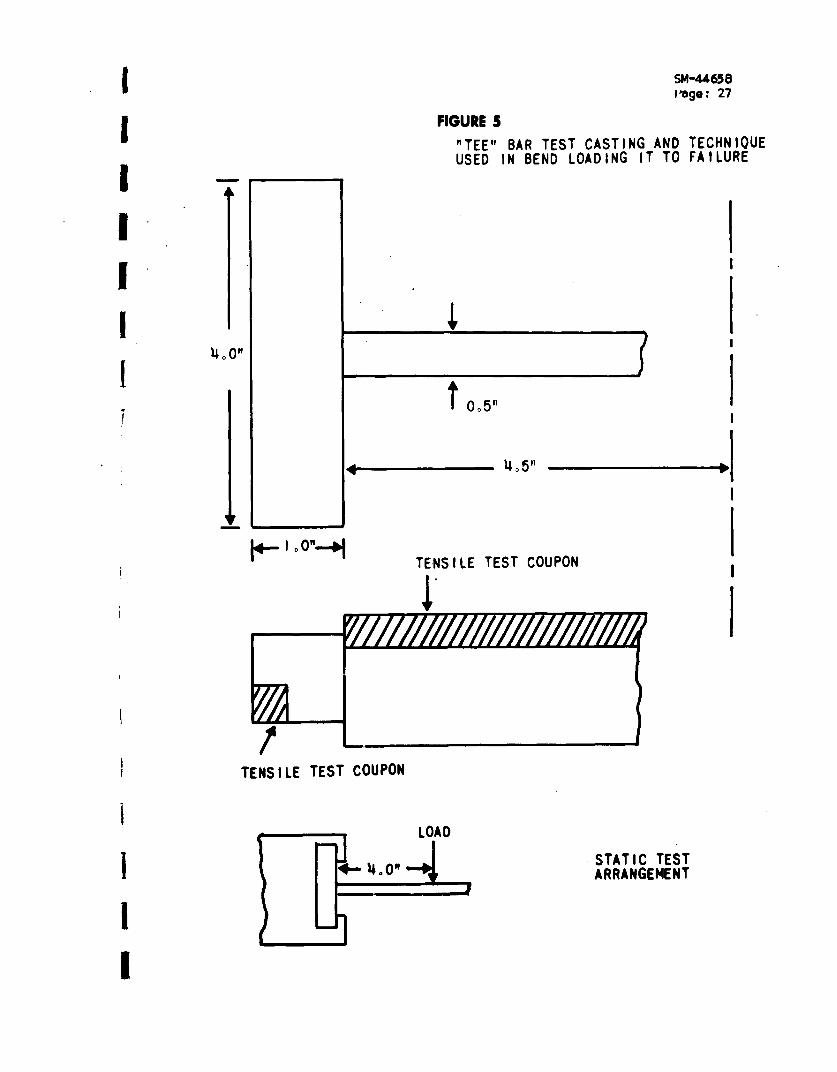
itself. The casting is poured and heat treated as an "H". The "" is then
bisected across the center arm Into two identical "Tee"-shaped pieces.
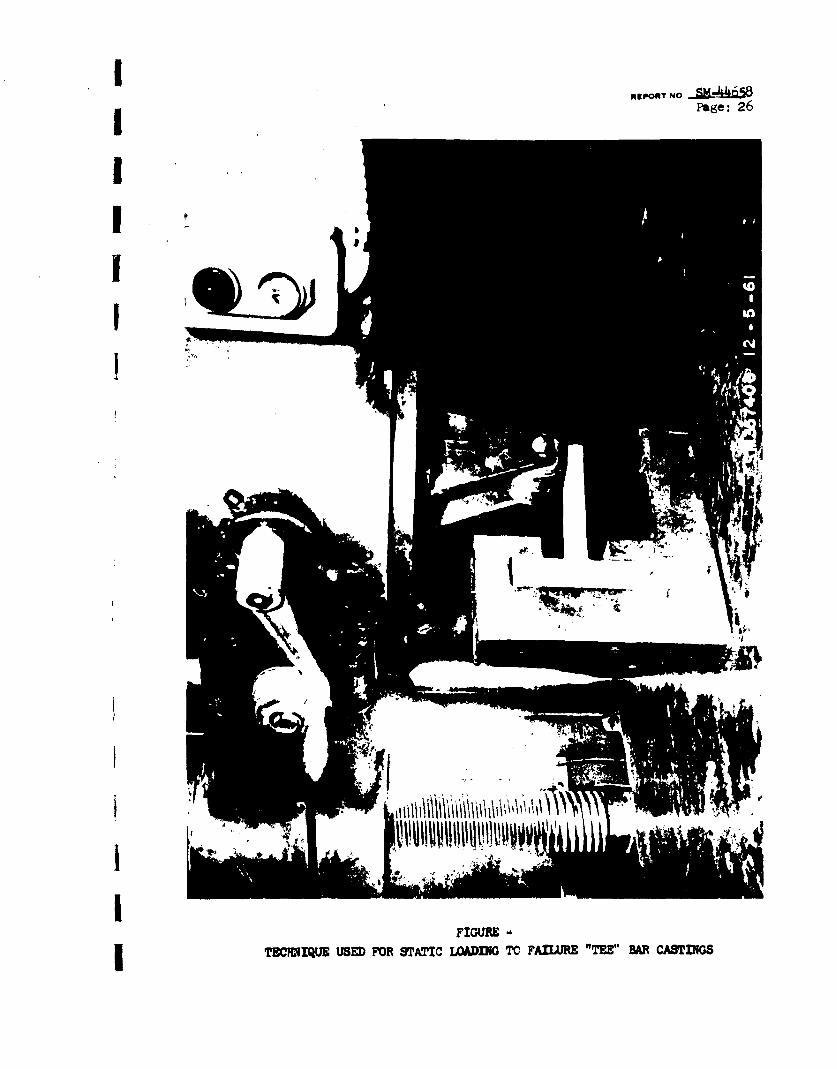
Each of these 'Tee's" is individually placed in a jig and bend loaded to
failure in a standard tensile testing machine. See Figure 4. The load
is applied to the cantilever at the position shown in Figure 5.
The present report describes strength data obtained from a series of such
castings produced by two foundries in 356 type aluminum alloys of varying
beryllium concentrations.
2. EVER.I MNlTAL . U
I
I SM-4465 8Page: 5
2.1 Castina Production
I Two foundries were requested to pour "Tee" bar castings in six 356 type
aluminum alloys of varying beryllium concentration. The targets were
0.00, 0.04, 0.08, 0.12, 0.16, and 0.20 beryllium by weight percent.
I Silicon was to be maintained constant at 7.0 weight percent and magnesium
held at 0.60 weight percent. Sodium modification was not permitted.
Titanium, white held within the standard specification maximum of 0.20
weight percent, was left to foundry option.IAt both foundries, each of the six target chemistries was produced as an
individual melt. Eight ?H"I castings were made from each melt. As shown
in Figure 3, each of these castings was poured so that only one end of
the 1" was chilled. Each individual "H" thus produced, represented two
interconnected, similarily gated parts - an essentially permanent mold
cast "Tee", cooled at a maximal rate, and a sand cast "Tee", cooled at
a minimal rate. The chills used by Foundry A were aluminum; those used
by Foundry B were iron. Figure 6 illustrates the gating technique used.
Pouring temperatures were approximately 13750F (7450C). All melts at
Foundry B were degassed by nitrogen fluxing. Foundry A used both nitrogen
and chlorine. A cover flux was used by Foundry 8 but not by Foundry A.
2.2 Heat Treatment
Castings produced by each foundry were heat treated by the foundry to
identical s4hedules. Castings of each of the six target chemistries
were solution heat treated in a single furnace load for twelve hours
j at 1010 & 5°F (543 & 20C) and were quenched immediately in 140 0F (60°C)
water. Less than a five second time delay existed between the opening
I of the furnace door and the entrance of the castings into the water.
I
I SM-44658Page: 6
2.2 Heat Treatmnt
IAs has been suggested elsewhere(15), a twenty-four hour room temperature
age interval was scheduled between the quenching and artificial aging of
I the castings. The use of this holding period does not imply agreement
with the popular concept of its beneficial effect on mechanical properties.
The author has, as yet, been unable to duplicate the reported advantage( 16 )
The holding period was specified for two reasons - first, to eliminate a
potential experimental variable and second, because such practice is
I currently common to many production foundries.
The eight "H"'s so solution heat treated were divided randomly into two
groups of four. One group of four castings from each of the six target
chemistries, 24 castings in all. were artifically aged in one furnace load
for various times at 320 F (160°C); the remaining 24 castings were
artifically aged in another furnace load for various times at 3500F (1770C).
The schedule was as follows - each time and temperature being represented
by an Id" casting of each alloy:
(a) age at 320 ± 5°F (160°C) for 3, 5, 7 and 14 hours
(b) age at 350 5°F (177°C) for 2, 3, 4 and 10 hours
Castings were fixed in the aging load so that at the above times and
temperatures a representative of each target chemistry could be
simultaneously removed from the furnace. With this technique, the
furnace door could be quickly closed and no appreciable heat loss
joccurred. Castings so removed were air cooled.
1 2.3 IUma
2.3.1 QhsnLAjr.
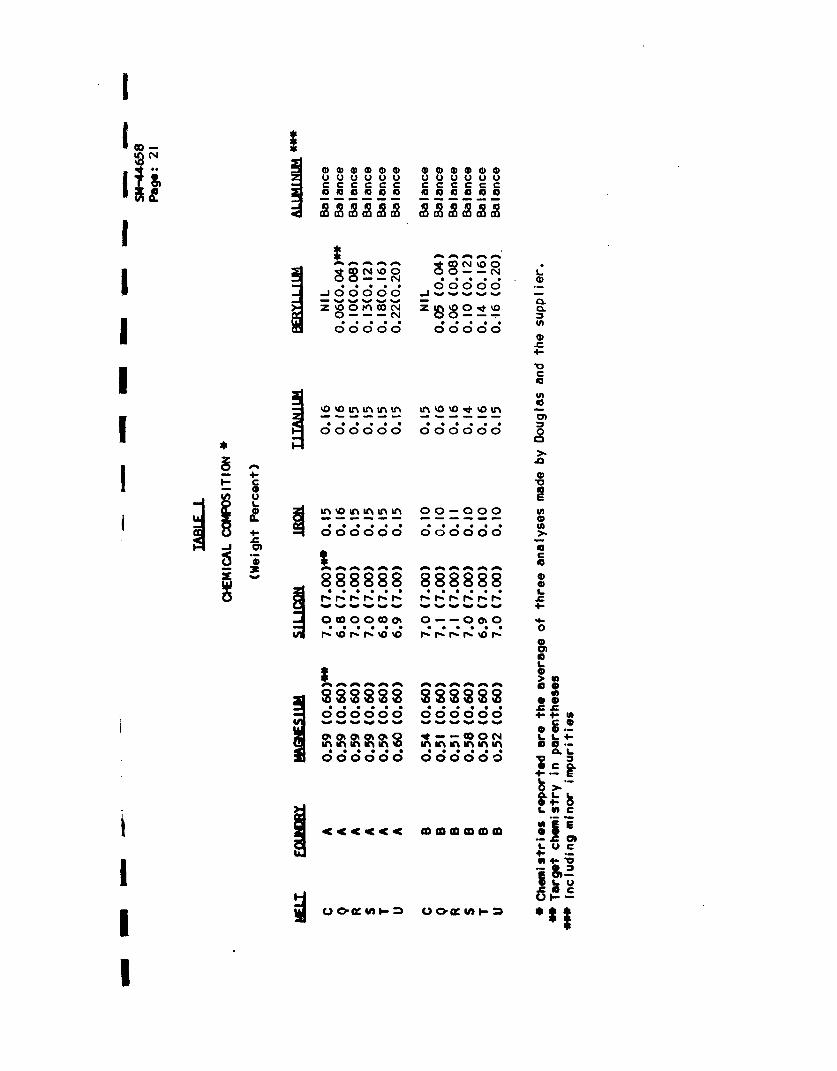
I Spectrographic chemical analyses for each target melt produced by each
I
i Sl-44658Page: 7
2.3.1 Cbn.Latry (Cont'd.)
foundry were made independently on specially prepared disc samples by
the producing foundry. The analyses were also determined by Douglas on
I the same chemical sample discs as well as on tensile coupons later cut
from the test castings. The averages of these analyses for each melt appear
in Table I. In general, there was good agreement between the values
obtained by Douglas and by the independent laboratories.
2.3.2 Fluorescent Penetrant Inspection
Each "H" casting was inspected by fluorescent penetrant. All were judged
acceptable and no discernible quality difference existed between melts or
between the production of either foundry.I2.3.3 Radionraphy
1 Radiographic examination demonstrated a very light shrinkage condition
along the midline of the 0.5 inch thick section of the chilled end and a
moderate level of gas porosity in the sand end of the "H" in all castings
received. These minor discontinuities, equally common to each alloy
produced, were Judged "acceptable" by an independent inspection laboratory,
and were considered to be typical of the minor heterogeneities encountered
in normal production runs. The radiographic quality level of castings
from both foundries were approximately equivalent.
2.4 IuXting
As described in the introduction, each "H" produced was bisected into
two "Tee" shaped pieces which were subsequently bend loaded to fai lure
as shown in Flgures 4 and 5. The canti levers fractured cleanly at the
Juncture of the two arms.II
j SM-44658Page: 8
1 2.4 Testing (Cont'd.)
j As shown in Figure 5, two tensile coupons were machined from each of the
broken "Tee's." (Standard, flat, 0.2 inch thick sub-size from the material
produced by Foundry A and standard, cylindrical, 0.25 inch diameter sub-size
from the material produced by Foundry 8). One coupon was machined from the
I I x I x 4 inch post section and the other coupon machined from the edge of
the 1.5 inch wide, 0.5 inch thick arm. The center of the gage length of
this latter coupon was then two inches from the point of fracture of the
original "ree". These coupons were then tensile tested by standard technique
at a loading rate of 1,200 pounds per minute. Elongations reported were
J measured by "fit-back" in a one inch gage length. The mechanical properties
of a given sand cast or chill cast "Tee" representing a given chemistry, aging
temperature and time were considered to be the arithmetical mean of the two
tensile coupons taken from it. Douglas has shown that tensile results
obtained from these standard flat coupons are essentially equivalent to
results obtained from standard round coupons.
3. ESETS
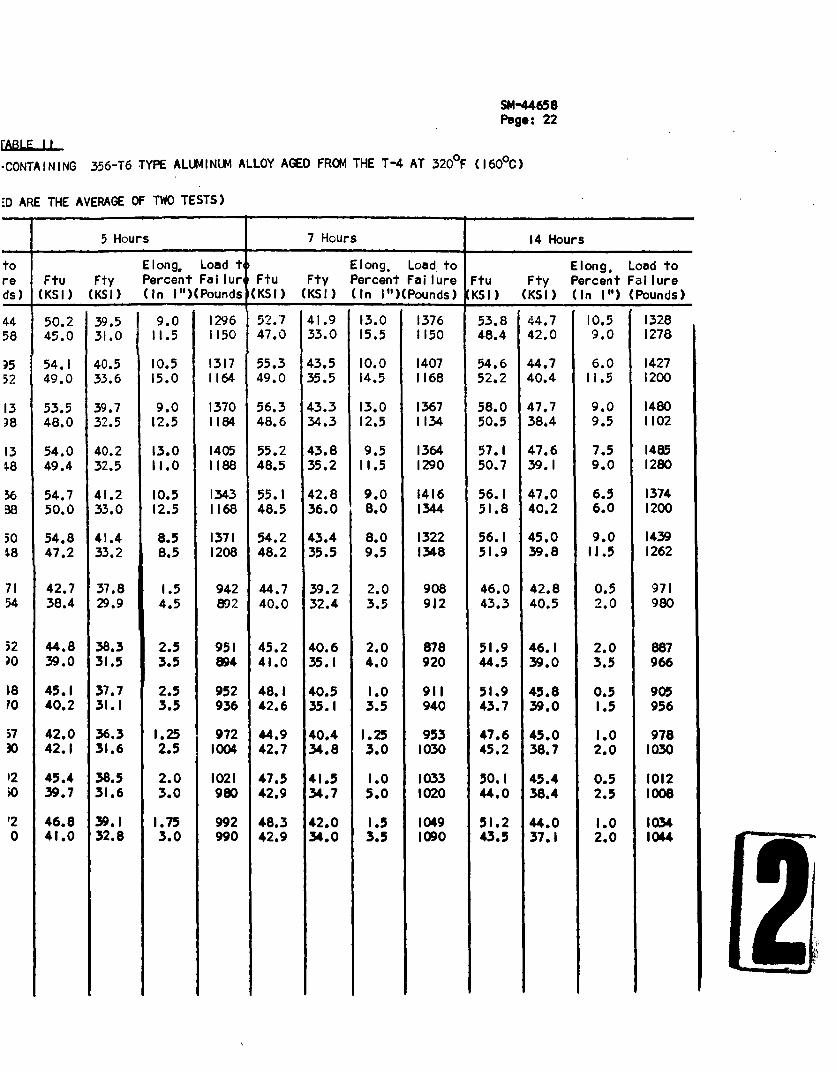
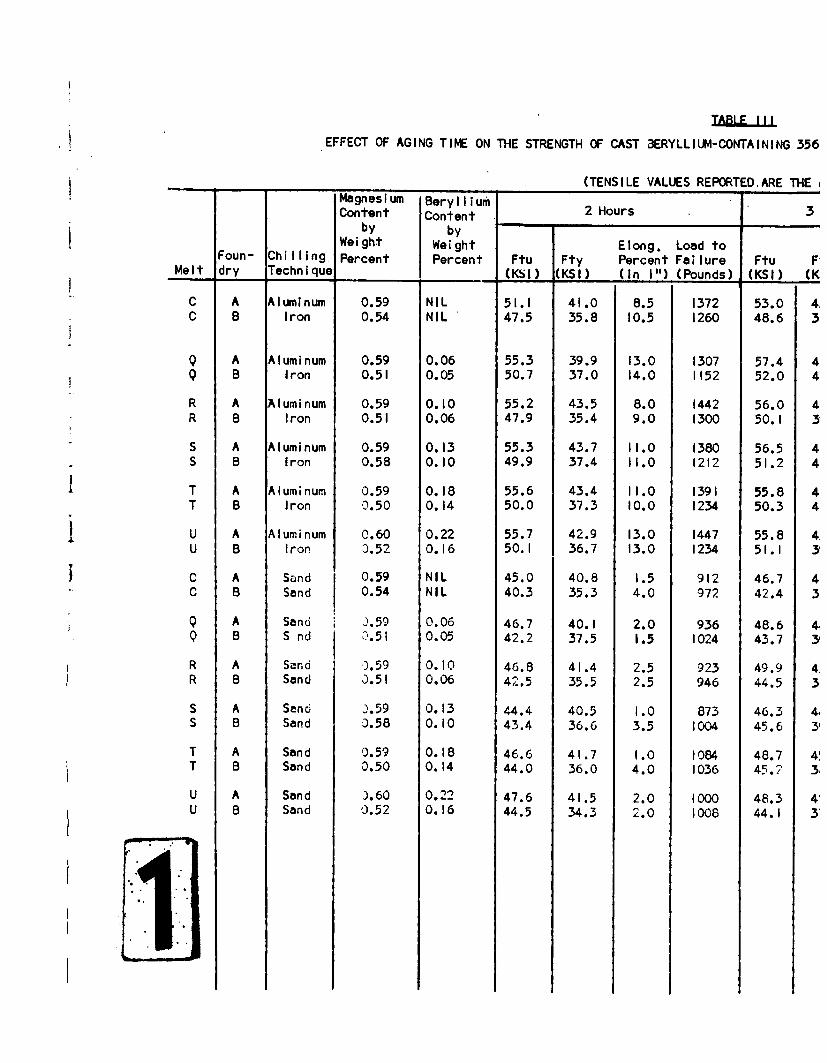
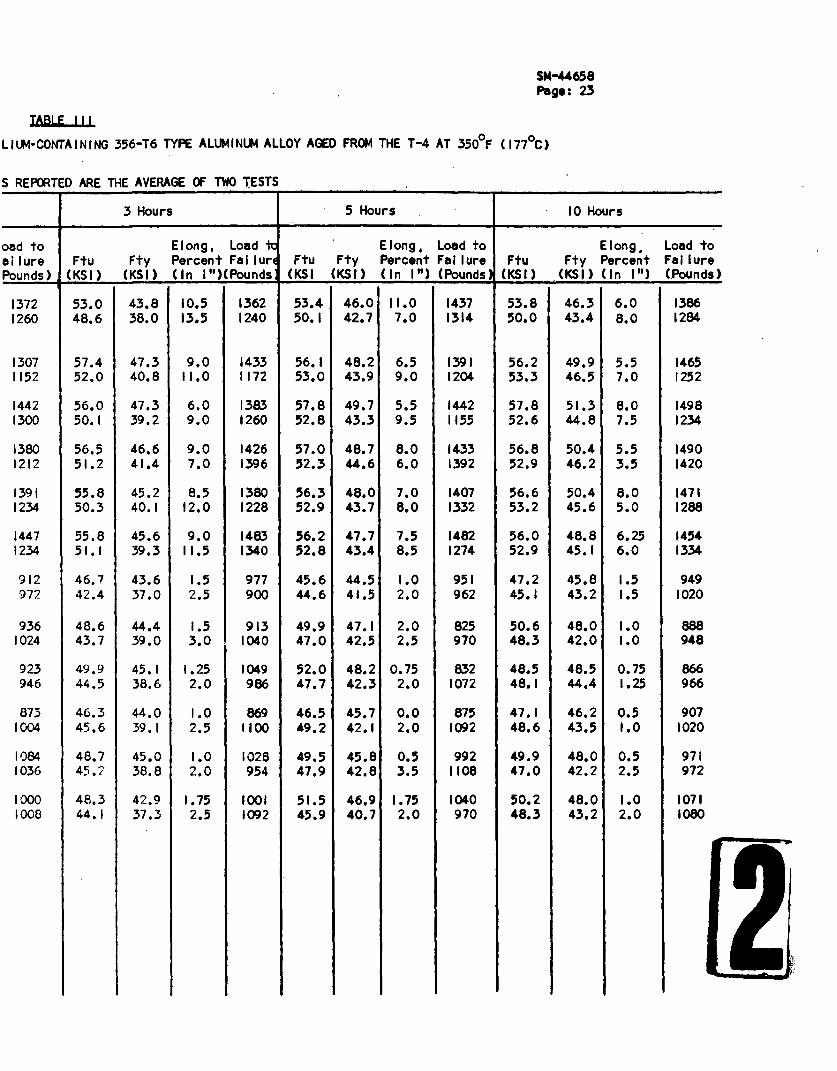
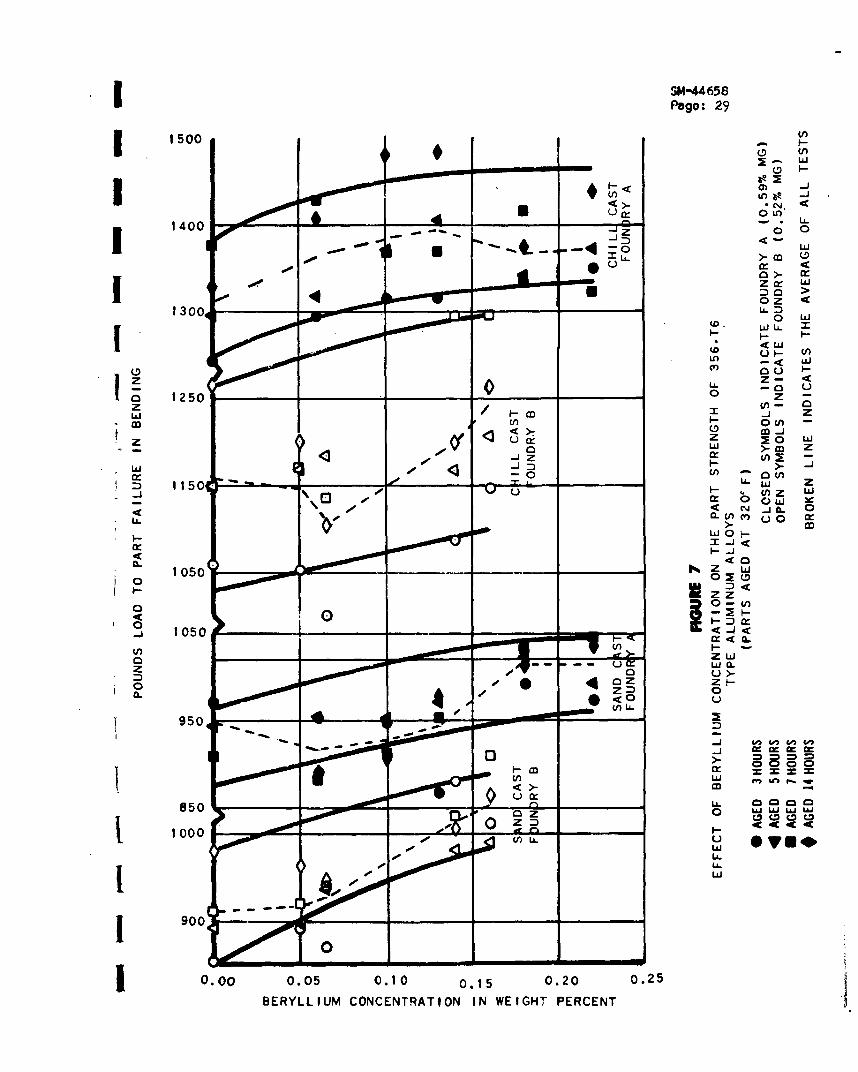
3.1 Part Strngth Testi na
The bending load to part failure results ,for each of the individual "Tee's"
produced by both foundries in each of the six target chemistries are report-
ed in Table II and Table Ill. Table II lists the part strength values ob-
tained from "Tee's" aged from the T-4 condition for various times at 320OF
(160°C) and Table Ill for those aged at 3509F (177 0C). These results are
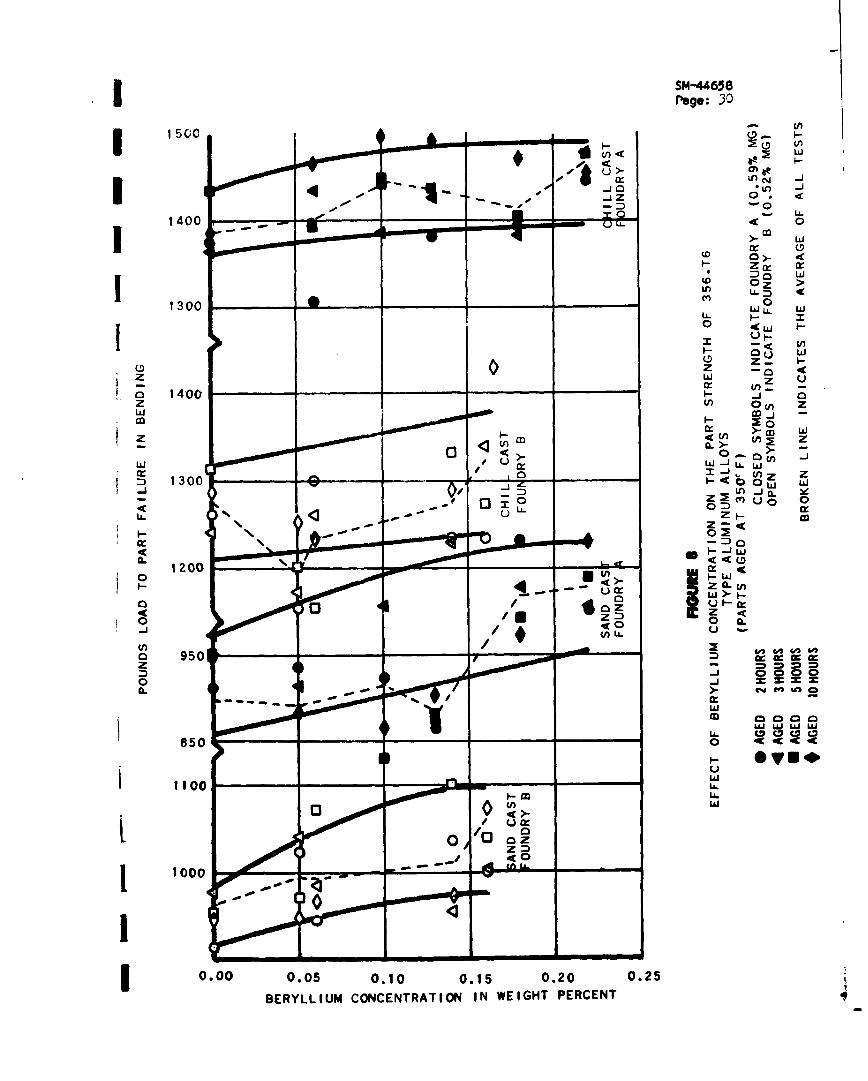
summarized in Figure 7 for parts containing various amounts of beryllium
Iand aged for various times at 320°F (16OC) and Figure 8 for similar partsaged for various times at 350°F C1770C). In these fIgures solid lines
designate the strength range; the broken lines designate the average
I properties.
I
SSM-44658Page: 9
3.2 Tensi Ie Tasting
The mechanical property results obtained from each of the six alloys.
produced by each of the foundries are also reported in Tables II and Ill.
Table II presents tensile strength values obtained from sand cast and
chill cast "Tee's' aged from the solution heat treated condition at
320°F (160°C) and Table Ill for those aged at 350°F (177 0C).
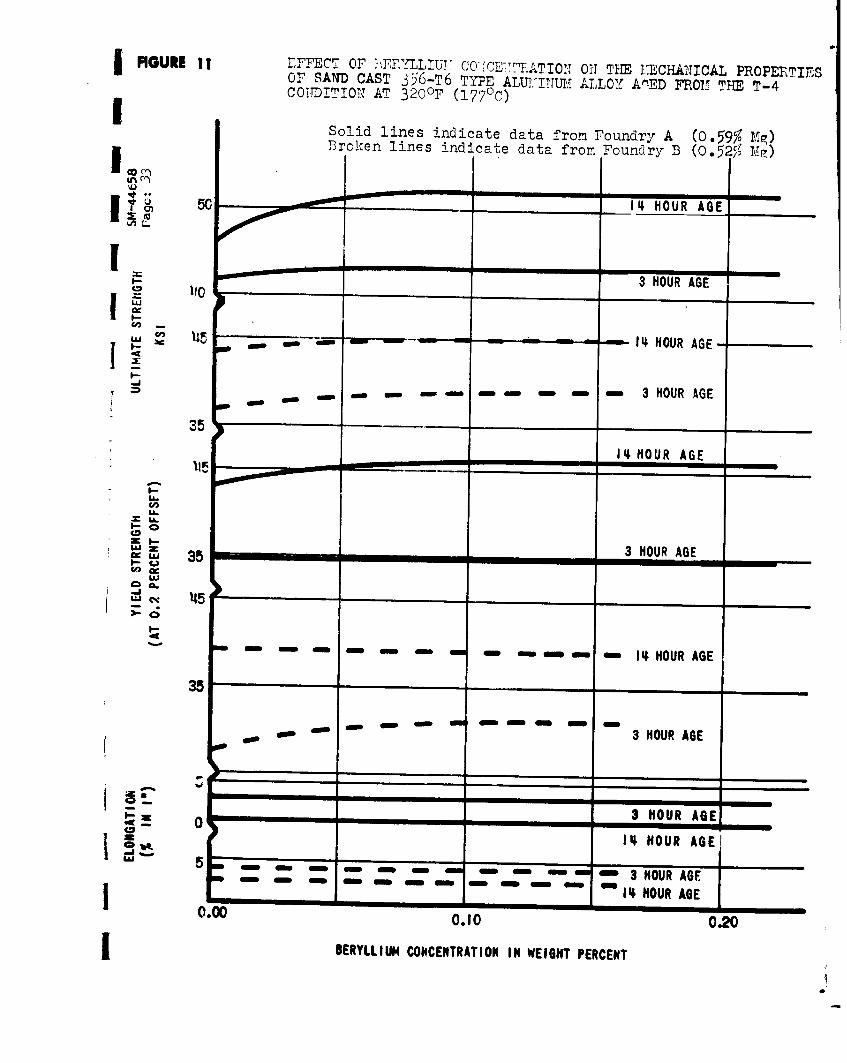
The effect of beryllium concentration on the mechanical properties of sand
cast and chill cast 356 variant type aluminum alloys appear in Figures 9
through 12. On each of these Figures, one set of curves describes tensile
tests made on material aged at a given temperature for the minimum time
used experimentally; the other set of curves describes tests made on
I material aged for the maximum time used experimentally at that temper-
ature. Tensile results from material aged for times between these two
extremes fall within the curves drawn. Figure 9 shows results from chill
cast material aged at 320°F (160°C). Figure I0 shows results from chill
cast material aged at 350°F (177 0C). Figure II shows results from sand
cast material aged at 320OF (177 0 C). Figure 12 shows results from sand
cast material aged at 350°F (177 0C).
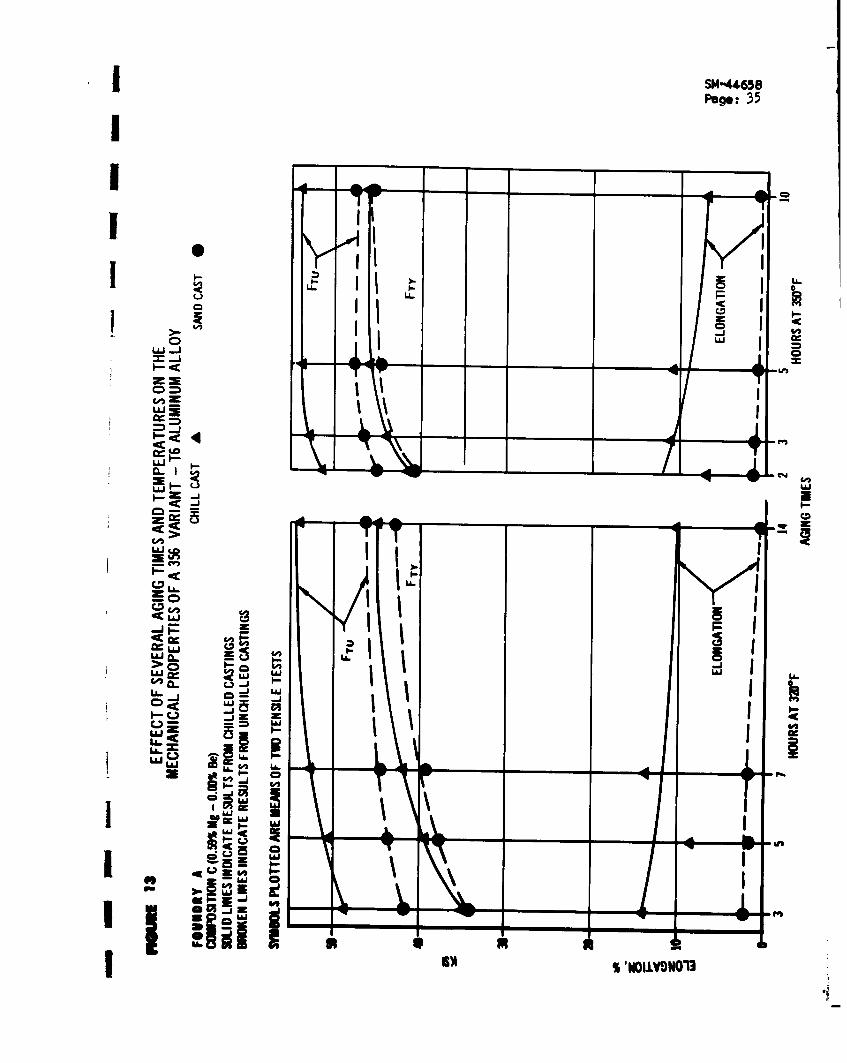
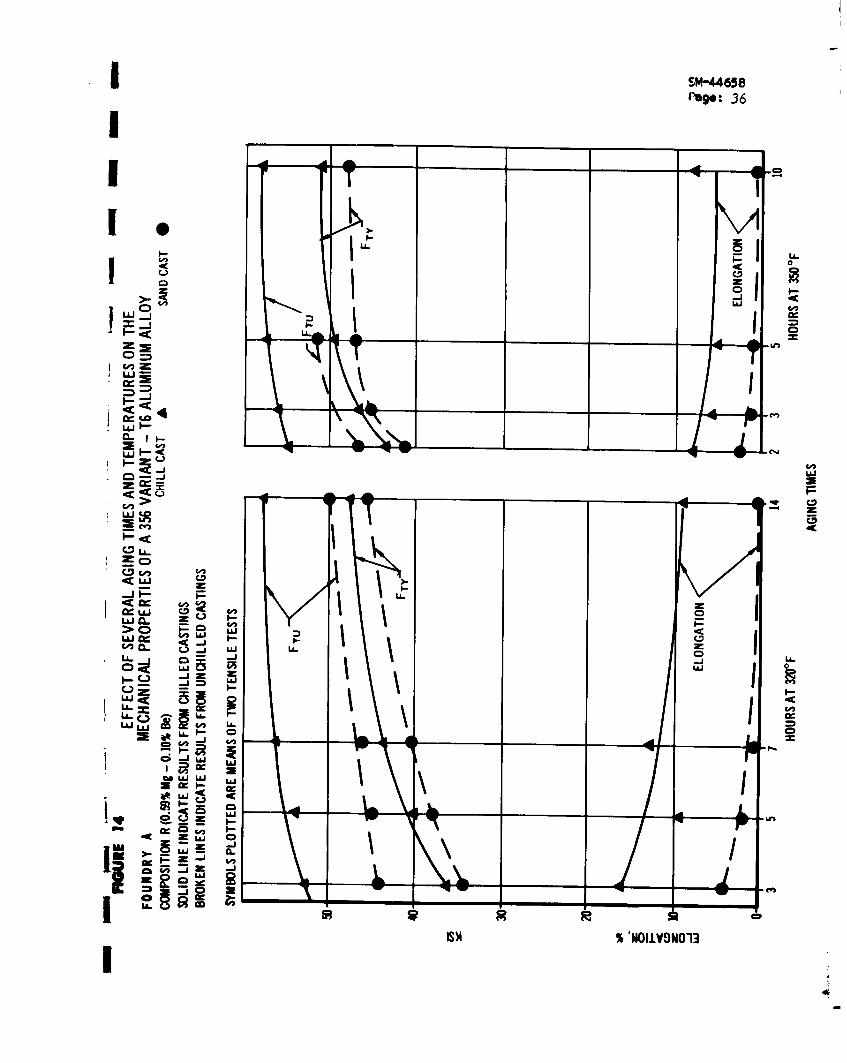
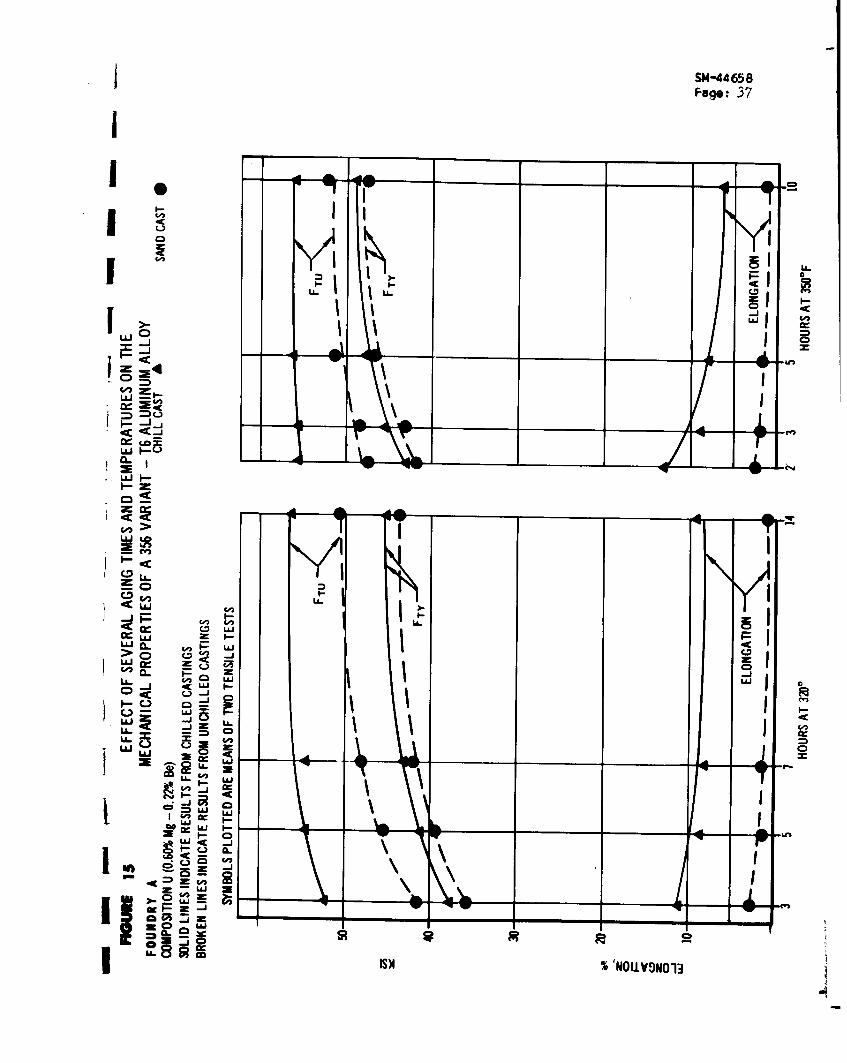
Figures 13 through 15 illustrate the effect of several aging times and
temperatures on the mechanical properties of three 356-T6 type aluminum
alloys of constant 0.60 weight percent magnesium but varying beryllium
concentration. Material described by the curves shown in Figure 13
contains no beryllium; that described In Figure 14, 0.10 weight percent
beryllium; that described in Figure 15, 0.22 weight percent beryllium.
IAluminum chills were used to produce all permanent mold data shown ini these figures.
I
SM-44 658Page: 10
3.3 Metal loaraphic Examination
I The sand cast and chill cast microstructures of each of the six
I compositions produced by both Foundry A and Foundry B were examined.
Metallographic specimens for this examination were excised from the grip
j end of that tensile test bar which had been machined from the 0.5 inch
thick, 1.5 inch wide section of the "Tee". These specimens were taken
I from that end of the tensile test bar which had been closest to the point
of fracture of the "Tee" when the part in its entirety was static loaded
to failure.
I No microstructural differences appeared to be induced by variation in
beryl lium concentration. Nor were variations induced by aging times or
temperatures in either sand cast or chill cast material, It was thought
necessary then, only to show typical photomicrographs of cast 356 type
material containing no beryllium and of material containing the maximum
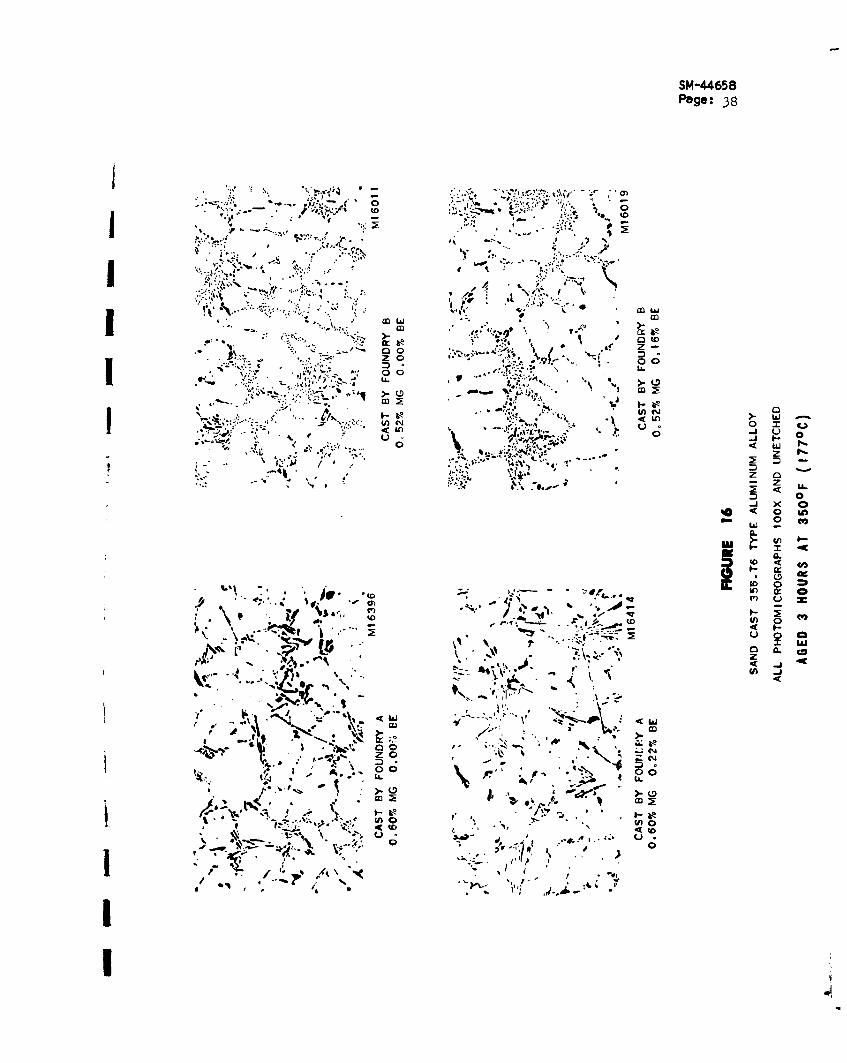
beryllium addition made by each foundry. Figure 16 shows sand cast
material produced by both foundries, material from Foundry A containing
0.60 weight percent magnesium with both 0.00 and 0.22 weight percent
beryllium,and material from Foundry B containing 0.52 weight percent
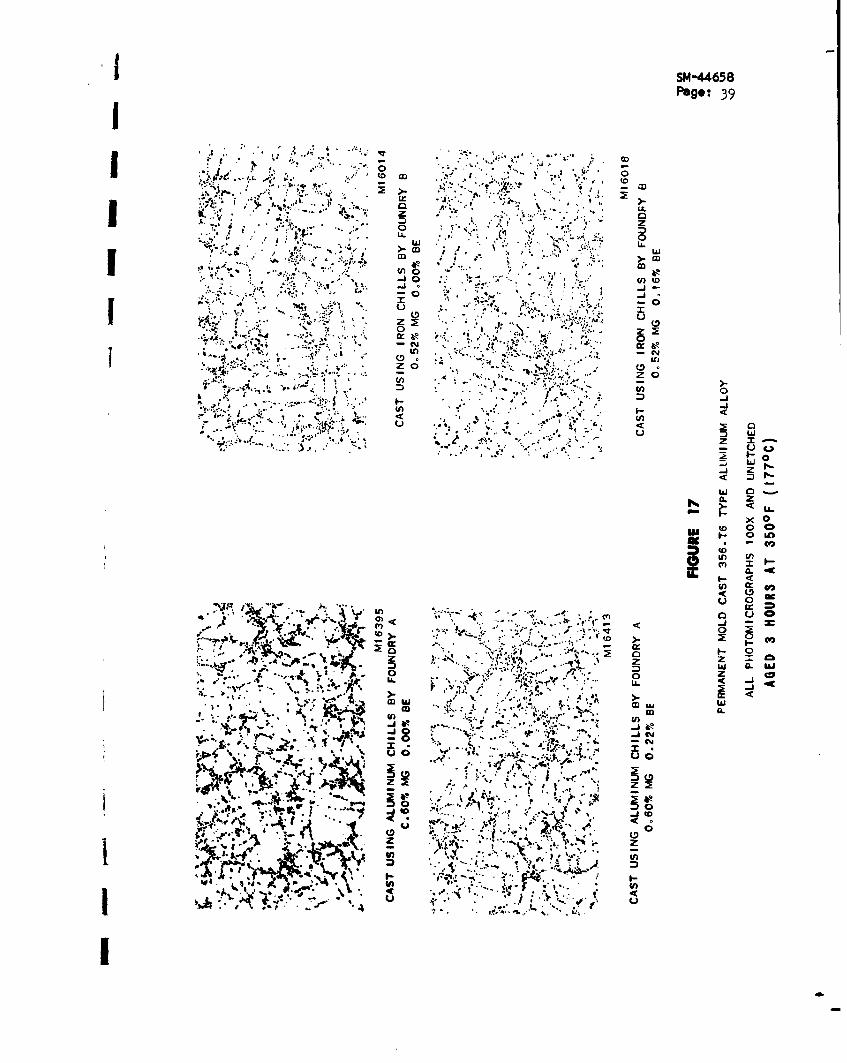
magnesium with both 0.00 and 0.16 weight percent beryllium. Figure 17
shows permanent mold cast material produced by both foundries in the
same compositions. The material shown in Figure 16 as sand cast by a
given foundry in a given composition is represented in Figure 17 by
material excised from the permanent mold end of the identical "H"50°F
casting. Aging times and temperatures, 3 hours at 350oF (177-C)Pare
j identical for all materials of which photomicrographs are shown.
I!
I 514-44658
Page: II
I
Figure 16 shows the typical microstructure of sand cast 356-T6 aluminum
alloys produced by both Foundry A and Foundry B. As can be seen,
I considerable difference in microstructure exists between the production
of the individual foundrys. At all beryllium concentrations studied, the
primary silicon particles observed in Foundry A sand castings were, in
general, large, acicular and irregularly shaped; those in Foundry B
castings were quite small and finely dispersed. Although both foundries
l were specifically requested not to sodium innoculate, the form and
dispersion of the fine silicon crystals surrounding the aluminum solid
solution dendrites seen in Foundry B sand castings is typical of sodium
j modified 356 type aluminum alloys.( 17 )
IWhile the foundry reported that sodium was not used and Its presence
was not experimental ly detectble by f lm spectrophotmetric techniques,
It would appear from the metal lographic evidence that the metal poured
by Foundry B was modified in some manner. Excluding the possibility of
foundry production and record error, it is conceivable that both foundries
initially melted prime ingot already modified. Foundry 8 subsequently
degassed with nitrogen. Such fluxing should not chemically alter the
initial modification. Foundry A, however, fluxed with gaseous chlorine in
addition to a nitrogen flux. Under these conditions, sodium certainlyp
and boron probably would be removed from the melt as chlorides. This
difference in fluxing practice could explain the basic variation In
sand cast 356 type aluminum alloy microstructure found between material
supplied by the two sources.
The marked difference in silicon particle structure and dispersion
I
SM-4658Page: 12
I4. DISUSIN (Cont'd.)
demonstrated between sand castings produced.by Foundry A and those pro-
duced by Foundry B'was not evident in the microstructure of the chilled
castings respectively produced. See Figure 17. The effect of modifica-
tion was apparently masked by rapid cooling from the molten state. The
primary silicon shown in Figure 17 had insufficient time to grow to the
sizes shown in Figure 16.
As would be expected, the dendrite cell size of the chill cast material
shown in Figure 17, was, on the average, considerably smaller than that
of the sand cast material shown in Figure 16. Note also in Figure 17
that the dendrite cells of the aluminum chill cast material produced by
Foundry A appear to be somewhat smaller than those of similar material
iron chill cast by Foundry B. If real, this size difference probably
must also be ascribed to variation in cooling rate, and not to magnesium
concentration. The same slight variation in microstructure between
aluminum chilled and iron chilled parts has been previously shown to be
independent of the minor changes in magnesium content within this
(2)family of alloys . The variation apparently obtains regardless of
beryllium concentration or aging schedule. It therefore must be
attributed to the greater heat conductivity of the aluminum chills
which was not compensated for by the greater mass of the Iron chills
used by Foundry B. Time for dendrite and constituent growth was limited
by more rapid cooling.
The practical structural advantage of this more rapid chill is reflected
by the consistently higher mechanical properties and part strengths shown
in Tables II and III for aluminum chilled material. Although in general,
I
SM-44658Page: 13
4. DICSI (Cont'd,)
Foundry B produced parts containing less magnesium than did Foundry A,
the data from two melts can be compared directly. Melt "R , Foundry A
and Melt "S", Foundry B are of equivalent chemistry. Here, aluminum
chilled material demonstrated, at both aging temperatures, an approximate
ten percent advantage in ultimate, yield and part strength over iron
chilled material.
Regardless of the differences in strength and in microstructure which
exist between parts produced by each foundry, the castings produced by
an individual foundry show similar trends. With silicon and magnesium
held constant, at any given aging temperature or time used experimentally,
ultimate strength and yield strength increase as a function of increase in
beryllium concentration from 0.00 to approximately 0.20 weight percent.
In both sand castings and chilled castings, this 0.2 weight percent
beryllium addition produces approximately a five to ten percent increase
in both tensile ultimate and tensile yield measured at 0.2 percent offset.
Full benefit of the beryllium addition on tensile strength is apparently
achieved at approximately 0.10 weight percent and concentrations beyond
,his p,,'nt have no apparent effect. At least at the iron impurity levels
(0.10 to 0.15 weight percent) used experimentally, beryllium additions
appear to have slight, if any, effect on the ductility of chill cast
material and none at all on the ductility of sand cast material. See
Pgm 9 through 12.
At a constant magnesium concentration, chilI cast part strengths are
increased approximately five percent and sand cast part strengths
approximately ten percent by beryllium addition. Solely from the test
i
ISM-44658Page: 14
I4. DICSSO (Cont'd.)
values presented, it would appear that the full benefit of beryllium
might not be reached until additions are in excess of 0.15 weight percent.
I The discrepancy between this concentration and the lesser amount
apparently required to produce maximum tensile strength (0.10 weight percent)
can not be currently explained except on the basis of test scatter.
I At any given heat treatment, regardless of chilling technique or of the
I beryllium concentration used experimentally, the mechanical properties
of test coupons taken from chilled castings had approximately a 10 to 20
percent advantage over the equivalent sand casting. Tensile yield strengths
for sand castings were, however, only slightly less than the values
I obtained from heavily chilled castings for the identical alloy and heat
treatment-from zero to four percent. Elongations, as would be expected,
were considerably less for sand castings as opposed to chilled castings.
As previously reported (3 ), the advantage of chill cast structure over
sand cast structure of simi lar composition and heat treatment was con-
siderably more pronounced when expressed as relative part strength. See
Figures 7 and 8. Despite the essential similarity of sand cast and
chill cast yield strengths obtained from coupons cut from the same "1H"
casting, the aluminum chilled halves showed a 35 to 55 percent (median
50 percent) part strength advantage over their sand cast counterparts.
The more slowly cooled, iron chilled castings showed somewhat less of an
j advantage, from 17 to 33 percent (median 25 percent). The strength
differential between a chill cast "Tee" and the corresponding sand cast
I "Tee" was not increased by beryllium addition. It was, however, some-
what influenced by aging temperature, 350°F (177 0C) producing a greater
I
* SM-44658Page: 15
4. DICS f (Cont'd.)
differential than did 320°F (1600C).
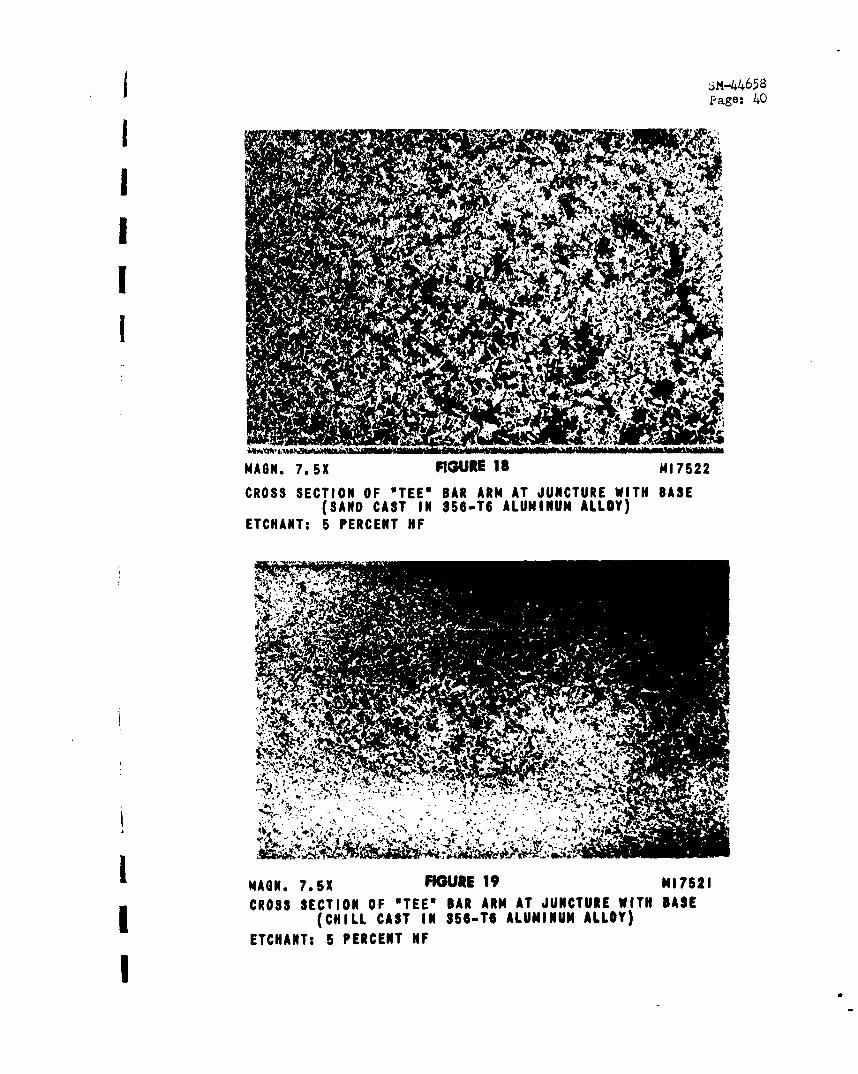
I The greater relative advantage for chill cast part strength than for
chill cast tensile strength when compared to similar sand cast material
i .can be partially explained on the basis of the photomacrographs shown in
Figures 18 and 19 . These figures show typical cross-sections of the
I juncture of the arm with the base of the "'ee". This is the point of
fracture of the part under static load. The polished surfaces were
heavily etched with five percent hydrofluoric acid. Figure 18,
representing a typical sand cast cross section, shows dendrites of
approximately constant size. These dendrites grew from the molten state
Iunder conditions more nearly approaching equilibrium than did thedendrites shown in Figure 19, a typical chill cast cross-section. In
this latter figure, there is a considerable difference in the size of
the dendrites ranging from relatively small at the periphery to relatively
large at the center, or last cooled area. The 'roe" under bending load
would be stressed in tension at the upper surface and in compression at
the lower. The neutral axis would then run through the larger dendrites
were microcompositional variations are greatest, shrinkage most severe
and general strength presumably lowest. The chilled "ree" is thus loaded
in the areas of maximum strength. Tensile coupons, however, excised from
this casting and machined on all sides, represent the matrix of the
section, the larger dendrites and the zone of lesser strength. A
hypothetical strength differential of this magnitude between part strength
j and tensile strength would not obtain in sand castings were the dendrites
toward the periphery or skin are more nearly similar, in size and kind,
to the dendrites of the matrix.
i
I SM-44658
Page: 16
I
1 4. DISLUiLI (Cont'd.)
At all beryllium concentrations used experimentally, seven hours of
aging at 320OF (160 0C) was required to produce the strength levels
I achieved with similar T-4 material using two hours at 350°F (177°C)
See Figures 13 through 15. It would also appear from these data that
higher strength can be produced in 356-T6 variant type aluminum alloys
using the 350°F (160°C) age. Ductility, of course is somewhat less at
the higher aging temperature.IIt appears that beryllium might perform two functions in this alloy
system. Its first and probably most significant effect is that of a
second deoxidizer. This results in a cleaner melt with relatively more
magnesium available for the formation of Mg2 Si, the principle hardening
agent. Any excess beryllium then acts, in a minor way, as a dispersion
hardener. Such a hypothesis readily explains the variation in the
apparent quantity of beryllium (0.10 to 0.15 weight percent) needed to
achieve the maximum mechanical property increases ascribable to this
alloying addition.
I. With silicon and magnesium concentration held constant, at any
given aging temperature or time used experimental ly, the tensile
ultimate and tensile yield strengths of castings increase from five
Ito ten percent with a 0.20 weight percent increase in beryllium
concentration. Full benefit of this alloying addition on tensile
I
j SM-446ZS
Page: 17
I
strength is apparently achieved at approximately 0.10 weight-r
percent beryllium.|2. At least at the iron impurity levels used experimentally, upe -to
1 0.20 weight percent beryllium additions have little or no ef-fect
on the ductility of cast 356-T6 type aluminum alloys.I3. Chill cast part strength, when aluminum chills were used, Wass in-
creased approximately five percent by up to a 0.20 weight pe rcent
increase in beryllium concentration and approximately three
percent when iron chills were used.
4. Sand cast part strength was increased approximately ten percoent by
up to 0.20 weight percent beryllium addition.
5. The beryllium concentration required to produce maximum bent-fit on
part strength is apparently in excess of 0.10 weight percent..
6. At any given heat treatment, regardless of the chilling techrnique
or of the beryllium concentration used experimental ly, the mchanical
properties of test coupons taken from chilled castings had ap prox-
imately a 10 to 20 percent advantage over the equivalent sael
casting.
7. Tensile yield strengths for sand castings were only slightly less
then the values obtained from heavily chilled castings for tne
Identical alloy and heat treatment. Elongations, however, were
markedly less for sand castings.
i ....
I SM-44658
Page: 18
I
1 5. CONCLUSIONS (Cont'd.)
8. Aluminum chilled castings, at all beryllium concentrations used
I experimentally, showed a 35 to 55 percent part strength advantage
over their sand cast counterparts. The more slowly cooled iron
chilled castings showed a 17 to 33 percent advantage over the sand
castings of similar aging schedule and chemical composition.
1 9. Aging for seven hours at 320°F (1609C) produces strength levels
approximately equivalent to those achieved with chemically similar
T-4 material aged for two hours at 350F (1770C).
10. Higher strength levels in all 356-T6 variant type aluminum alloys
can be produced using the 350°F (177 0C) aging temperature although
ductility is sligh '- impaired.
IIi
SM-44658Page: 19
i.
I. Bailey, W.A., and E.N. Bossing, "High Strength Aluminum Alloy AirframeCastings", Transactions, American Foundrymen's Society, Vol. 69,
pp 660-663 (1961).
2. Bailey, W.A., A356 Type Aluminum Casting Alloy, Part 1, Effect of MagnesiumConcentration Douglas Santa Monica Report No. 43094, dated November 21, 1963.
3. Bailey, W.A., Preliminary Exploration of the Aluminum-Silicon-Magnesium
Alloy System, Part I Douglas Santa Monica Report No. 43109, dated October 23,1963.
4. Bonsack, W., "Effects of Minor Alloying Elements on Aluminum Casting Alloys,Part II, Aluminum-Silicon Alloys", ASTM Bulletin, No. 124, pp 41-51,Oct., (1943).
5. De Ross, A.B., "Aging Practices for High Strength Ductile Aluminum AlloyHP 356", Transactions, American Foundrymen's Society, Vol. 65, (1957).
6. Archer, R.A., and L.W. Kempf, "Aluminum-Silicon-Magnesium Casting Alloys",Transactions. AIME. Inst. of Metals Div., Vol. 93, pp 448 (1931).
7. Mondolfo, L.F., Metallography of Aluminum AIloys, New York: John Wiley andSons, Inc., 1953.
8. Alcoa Technical Brochure, "Technical Information Regarding XA356 Alloy,August 16, 1954.
9. De Ross, A.B., "High Strength Aluminum Alloy X357", Transactions, AmericanFoundrymen's Society, Vol. 66 (1958).
10. Lemon, R.C., and H.Y. Hunsika, "New Aluminum Permanent Mold Casting Alloys",
Transactions. American Foundrymen's Society, Vol. 64, pp 255-;,60 (1956).
I1. Cron, R. and R. Zeuch, U.S. Patent 2,908,566.
12. NAVAN Products Technical Brochure, "Tens-5U Aluminum Casting Alloy - Designand Foundry Information".
13. Precision Castings, Inc., Technical Brochure, "Aluminum Alloy Castings(356CM-T6 and 356CMB-T6) - Special Quality", PCMSI100 (August C, 1957)
14. Bailey, W.A., and E.N. Bossing, "Relative "trength of Cast ConfigurationProduced in Both Aluminum and Magnesium Alloys", Transactions, MagnesiumAssociation (196?).
15. Quadt, R.A., "Effect of Room Temperature Intervals Between Quenching andAging of Sand Cast Alloys". Transactions, American Foundrymen's Society,
Vol. 55, pp 351-356 (1949).
i
I SM-44658
Page: 20
IIREERENCE (Cont'd.)
16. Bailey, W.A., "Effect of Time Delay Between Solution Heat Treatment andArtificial Age on the Mechanical Properties of A356-T6 Aluminum Alloy",Douglas Santa Monica Materials and Process Enginerina Laboratory RenortNo. MP 20,029.
17. Zeuch, R.A., "Sodium Improves Aluminum 356", T January 29, 1959.
Filed under Laboratory Work Sheet No. 33675PCR Book 17347, page 13PCR Book 17748, pages 13-15, 21-50
EWO 52704SO 80305-3001
I
I
4 000002 0N0
I8 C
I 10c
I000000 000
.0
4- 666666ni 00-0006F
.C z
0
0 000of 00% 0--Oo00 a 4-
6ddcddd dddddd - fU
IaJ4-.
b0 >.
uo.~v,4-
I4
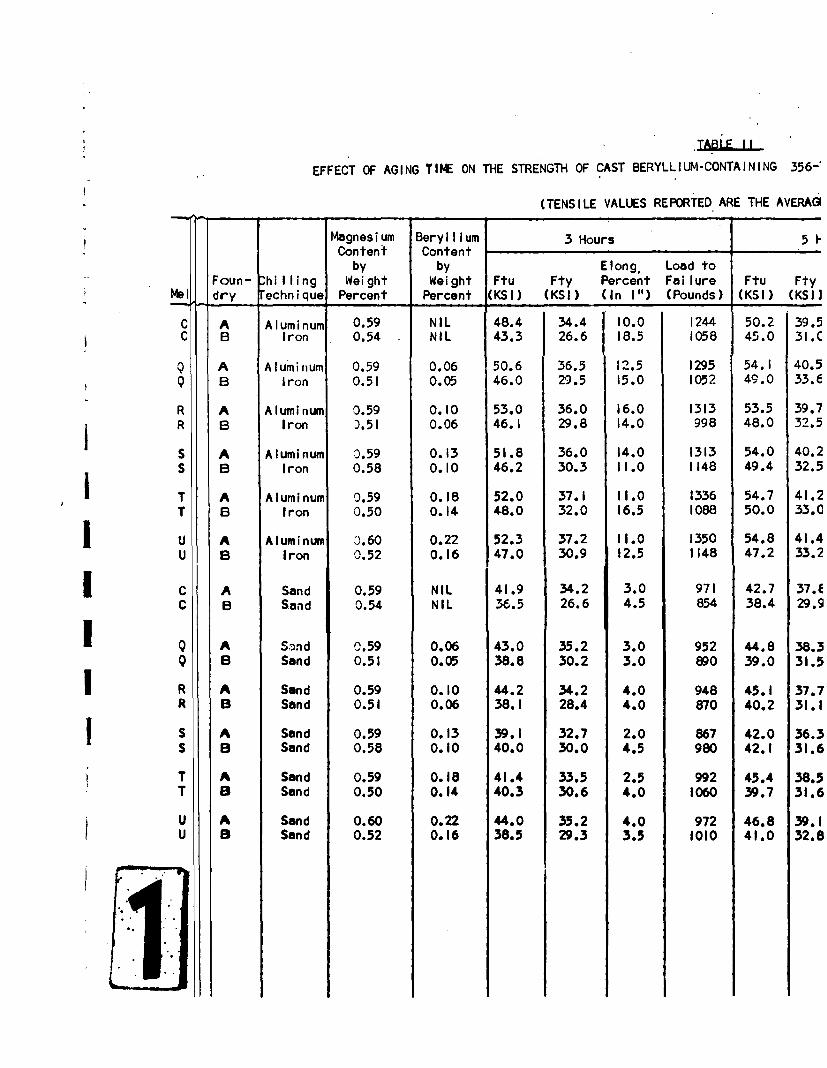
TABLE 11
EFFECT OF AGING TIME ON THE STRENGTH OF CAST BERYLLIUM-CONTAINING 356-
(TENSILE VALUES REPORTED ARE THE AVERAGI
Magnesium Beryllium 3 Hours 5 I-Content Content
by by Elong, Load toFoun- hi I ling Weight Weight Ftu Fty Percent Failure Ftu Fty
Me1i dry Technique Percent Percent (KSI) (KSI) (In I") (Pounds) (KSI) (KSI
C A Aluminum 0.59 NIL 48.4 34.4 I10.0 1244 50.2 39.5C B Iron 0.54 NIL 43.3 26.6 18.5 1058 45.0 31.C
Q A Aluminum 0.59 0.06 50.6 36.5 12.5 1295 54.1 40.5Q B Iron 0.51 0.05 46.0 29.5 15.0 1052 49.0 33.6
R A Aluminum 0.59 0.10 53.0 36.0 16.0 1313 53.5 39.7R B Iron ).51 0.06 46.1 29.8 14.0 998 48.0 32.5
S A Aluminum 0.59 0.13 51.8 36.0 14.0 1313 54.0 40.2S B Iron 0.58 0.10 46.2 30.3 11.0 1148 49.4 32.5
T A Aluminum 0.59 0.18 52.0 37.1 11.0 1336 54.7 41.2T B Iron 0.50 0.14 48.0 32.0 16.5 1088 50.0 33.0
U A Aluminum 3.60 0.22 52.3 37.2 11.0 1350 54.8 41.4U B Iron 0.52 0.16 47.0 30.9 12.5 1148 47.2 33.2
C A Sand 0.59 NIL 41.9 34.2 3.0 971 42.7 37.EC B Sand 0.54 NIL 36.5 26.6 4.5 854 38.4 29.9
Q A Sand 0.59 0.06 43.0 35.2 3.0 952 4.8 38.3Q B Sand 0.51 0.05 38.8 30.2 3.0 890 39.0 31.5
R A Send 0.59 0.10 44.2 34.2 4.0 948 45.1 37.7R B Sand 0.51 0.06 38.1 28.4 4.0 870 40.2 31.1
S A Sand 0.59 0.13 39.1 32.7 2.0 867 42.0 36.3
S B Sand 0.58 0.10 40.0 30.0 4.5 980 42.1 31.6
T A Sand 0.59 0.18 41.4 33.5 2.5 992 45.4 38.5T B Sand 0.50 0.14 40.3 30.6 4.0 1060 39.7 31.6
U A Sand 0.60 0.22 44.0 35.2 4.0 972 46.8 39.1U B Sand 0.52 0.16 38.5 29.3 3.5 1010 41.0 32.8
1I"--
SM-44658Page: 22
-CONTAINING 356-T6 TYPE ALUMINLM ALLOY AGED FROM THE T-4 AT 320°F (160°C)
.D ARE THE AVERAGE OF TWO TESTS)
5 Hours 7 Hours 14 Hours
to Elong. Load t Elong. Load to Elong. Load tore Ftu Fty Percent Fai lure Ftu Fty Percent Failure Ftu Fty Percent Fai lureds) (KSI) (KSI) (In I")(Pounds CKSI) (KSI) (In I")(Pounds) (KSI) (KSI) (In I") (Pounds)
44 50.2 39.5 9.0 1296 52.7 41.9 13.0 1376 53.8 44.7 10.5 132858 45.0 31.0 11.5 1150 47.0 33.0 15.5 1150 48.4 42.0 9.0 1278
?5 54.1 40.5 10.5 1317 55.3 43.5 10.0 1407 54.6 44.7 6.0 142752 49.0 33.6 15.0 1164 49.0 35.5 14.5 1168 52.2 40.4 II65 1200
13 53.5 39.7 9.0 1370 56.3 43.3 13.0 1367 58.0 47.7 9.0 1480)8 48.0 32.5 12.5 1184 48.6 34.3 12.5 1134 50.5 38.4 9.5 1102
13 54.0 40.2 13.0 1405 55.2 43.8 9.5 1364 57.1 47.6 7.5 1485t8 49.4 32.5 11.0 1188 48.5 35.2 11.5 1290 50.7 39.1 9.0 1280
56 54.7 41.2 10.5 1343 55.1 42.8 9.0 1416 56.1 47.0 6.5 137438 50.0 33.0 12.5 1168 48.5 36.0 8.0 1344 51.8 40.2 6.0 1200
50 54.8 41.4 8.5 1371 54.2 43.4 8.0 1322 56.1 45.0 9.0 1439t8 47.2 33.2 8.5 1208 48.2 35.5 9.5 1348 51.9 39.8 11.5 1262
71 42.7 37.8 1.5 942 44.7 39.2 2.0 908 46.0 42.8 0.5 97154 38.4 29.9 4.5 892 40.0 32.4 3.5 912 43.3 40.5 2.0 980
52 44.8 38.3 2.5 951 45.2 40.6 2.0 878 51.9 46.1 2.0 887? 39.0 31.5 3.5 894 41.0 35.1 4.0 920 44.5 39.0 3.5 966
18 45.1 37.7 2.5 952 48.1 40.5 1.0 911 51.9 45.8 0.5 905FO 40.2 31.1 3.5 936 42.6 35.1 3.5 940 43.7 39.0 1.5 956
57 42.0 36.3 1.25 972 44.9 40.4 1.25 953 47.6 45.0 1.0 978)0 42.1 31.6 2.5 1004 42.7 34.8 3.0 1030 45.2 38.7 2.0 1030
12 45.4 38.5 2.0 1021 47.5 41.5 1.0 1033 50.1 45.4 0.5 1012i0 39.7 31.6 3.0 980 42.9 34.7 5.0 1020 44.0 38.4 2.5 1008
F2 46.8 39.1 1.75 992 48.3 42.0 1.5 1049 51.2 44.0 1.0 10340 41.0 32.8 3.0 990 42.9 34.0 3.5 1090 43.5 37.1 2.0 1044
EFFECT OF AGING TIME ON THE STRENGTH OF CAST 3ERYLLIUM-CONTAINING 356
___ ___ __(TENSILE VALUES REPORTED. ARE THE
Magnesium Beryllium 2
Content Content 2 Hours 3by by-
Weight Weight Elong. Load toFoun- Chilling, Percent Percent Ftu Fty Percent Failure Ftu F
Melt dry Technique (KSI) (KSI) (in I") (Pounds) (KSI) (K
C A Aluminum 0.59 NIL 51.1 41.0 8.5 1372 53.0 4.C B Iron 0.54 NIL 47.5 35.8 10.5 1260 48.6 3
Q A Aluminum 0.59 0.06 55.3 39.9 13.0 1307 57.4 4Q B Iron 0.51 0.05 50.7 37.0 14.0 1152 52.0 4
R A Aluminum 0.59 0.10 55.2 43.5 8.0 1442 56.0 4R B Iron 0.51 0.06 47.9 35.4 9.0 1300 50.1 3
S A Aluminum 0.59 0.13 55.3 43.7 11.0 1380 56.5 4S B Iron 0.58 0.10 49.9 37.4 11.0 1212 51.2 4
T A Aluminum 0.59 0.18 55.6 43.4 11.0 1391 55.8 4T B Iron 0.50 0.14 50.0 37.3 10.0 1234 50.3 4
U A Aluminum 0.60 0.22 55.7 42.9 13.0 1447 55.8 4U B Iron ).52 0.16 50.1 36.7 13.0 1234 51.1 3
C A Sand 0.59 NIL 45.0 40.8 1.5 912 46.7 4C B Sand 0.54 NIL 40.3 35.3 4.0 972 42.4 3
Q A Sand '.59 0.06 46.7 40.1 2.0 936 48.6 4Q B S nd 2.51 0.05 42.2 37.5 1.5 1024 43.7 3
R A Sand ).59 0.10 46.8 41.4 2.5 923 49.9 4.R B Sand 3.51 0.06 42.5 35.5 2.5 946 44.5 3
S A Send 3.59 0.13 44.4 40.5 1.0 873 46.3 4S B Sand 0.58 0.10 43.4 36.6 3.5 1004 45.6 3
T A Sand 0.59 0.18 46.6 41.7 1.0 1084 48.7 4!T B Sand 0.50 0.14 44.0 36.0 4.0 1036 45.? 3
U A Sand -.60 0.22 47.6 41.5 2.0 1000 48.3 4U B Sand 0.52 0.16 44.5 34.3 2.0 1008 44.1 3
.1°1;
SM-44658Page: 23
TABLE LLLIUM-CONTAINING 356-T6 TYPE ALUMINUM ALLOY AGED FROM THE T-4 AT 350°F (177 0 C)
S REPORTED ARE THE AVERAGE OF TWO TESTS
3 Hours 5 Hours 10 Hours
oad to Elong, Load tc Elong, Load to Elong, Load toa lure Ftu Fty Percent Fal lur Ftu Fty Percent Failure Ftu Fty Percent FailurePounds) (KSI) (KSI) (In I")(Pounds (KSI (KSI) (In I") (Pounds) (KSI) (KSI) (In I") (Pounds)
1372 53.0 43.8 10.5 1362 53.4 46.0 11.0 1437 53.8 46.3 6.0 13861260 48.6 38.0 13.5 1240 50.1 42.7 7.0 1314 50.0 43.4 8.0 1284
1307 57.4 47.3 9.0 1433 56.1 48.2 6.5 1391 56.2 49.9 5.5 14651152 52.0 40.8 11.0 1172 53.0 43.9 9.0 1204 53.3 46.5 7.0 1252
1442 56.0 47.3 6.0 1383 57.8 49.7 5.5 1442 57.8 51.3 8.0 14981300 50.1 39.2 9.0 1260 52.8 43.3 9.5 1155 52.6 44.8 7.5 1234
1380 56.5 46.6 9.0 1426 57.0 48.7 8.0 1433 56.8 50.4 5.5 14901212 51.2 41.4 7.0 1396 52.3 44.6 6.0 1392 52.9 46.2 3.5 1420
1391 55.8 45.2 8.5 1380 56.3 48.0 7.0 1407 56.6 50.4 8.0 14711234 50.3 40.1 12.0 1228 52.9 43.7 8.0 1332 53.2 45.6 5.0 1288
1447 55.8 45.6 9.0 1483 56.2 47.7 7.5 1482 56.0 48.8 6.25 14541234 51.1 39.3 11.5 1340 52.8 43.4 8.5 1274 52.9 45.1 6.0 1334
912 46.7 43.6 1.5 977 45.6 44.5 1.0 951 47.2 45.8 1.5 949972 42.4 37.0 2.5 900 4.6 41.5 2.0 962 45.1 43.2 1.5 1020
936 48.6 44.4 1.5 913 49.9 47.1 2.0 825 50.6 48.0 1.0 8881024 43.7 39.0 3.0 1040 47.0 42.5 2.5 970 48.3 42.0 1.0 948
923 49.9 45.1 1.25 1049 52.0 48.2 0.75 832 48.5 48.5 0.75 866946 44.5 38.6 2.0 986 47.7 42.3 2.0 1072 48.1 44.4 1.25 966
873 46.3 44.0 1.0 869 46.5 45.7 0.0 875 47.1 46.2 0.5 9071004 45.6 39.1 2.5 1100 49.2 42.1 2.0 1092 48.6 43.5 1.0 1020
1084 48.7 45.0 1.0 1028 49.5 45.8 0.5 992 49.9 48.0 0.5 9711036 45.' 38.8 2.0 954 47.9 42.8 3.5 1108 47.0 42.2 2.5 972
1000 48.3 42.9 1.75 1001 51.5 46.9 1.75 1040 50.2 48.0 1.0 10711008 44.1 37.3 2.5 1092 45.9 40.7 2.0 970 48.3 43.2 2.0 1080
SM-44658Page: 24
b , ." , 0. , ;
e\" *- " * °- --
*~N 400
, ., *.
04 it
0,J " . ,""' .; I
o" "' ,,•d,_l P
'S*
0. W GT EC IRONI
,*D ,, O ' e . . . ,0. o..0 41)[
UNT DAROSIDCT F-SI INEmTLI
. ' , , "- " o * . A "o
SAND CAST 35"6-T6 ALUMINUM ALLOY CONTAINING APPROXIMATELY0.3 WE IGHT PERCENT IRON
UNETCHED ARROWS INDICATE FE.SI INTERMETALLIC
A,-~
w__f.-" - " s . . - * ' " . -.
*-* r
"" AK " *'
1 " ' "\ '; "- ,. ', ". • ., -~ " '" , " . " ' , * ,-" ;
..--.,e
46
,(1 . ..a, M1 33
0.0 ,, ' P R..I,,
IMAGN. oox A OWSI 2 M14633SAND CAST 35.6ALUMINUM ALLOY CONTAINING APPROXIMATELY
o.06WEIGT PERCENT BERYLLIUMUNETCHED ARROWS INDICATE A BE.FE COMPLEX
SM-44658Page: ?5
IISVII
I V-
oS 0
0J ds
0
L%* I0 -- J
-J t
IA.
w IA
oEze
In
1W 0
20 -J
REPORT NO -% kI Page: 26
FIURII:xu6UE O TAI ODN OFnRE"E"BMCS3G
fSM-44658vage: 27
I FIGURE 5
"TEE" BAR TEST CASTING AND TECHNIQUEUSED IN BEND LOADING IT TO FAILURE
III
0, O 5"
4.5°
TENSILE TEST COUPON
TENSILE TEST COUPON
iLOAD
-STATIC TESTS.ARRANGEMENT
II
I SM 44658
Page: 28
IG.APOIWEY16
IlWRGAIGADCILNIEHIU SDFRPOUTO F"E"BR
SM-44658Pago: 29
1500 - (
1400~ -a--j-J
uu
.. 0z 0 0 u
0 z13000- D
00w-- ow 0 -
4W
-u LJJ
0 0 00
125 (n~ -
00(-W Z
I~~* <A >-( o WU~~ m 2
LL --cr 0 cnD 1150I u- w
_______~~ _ _ _ -J 4
(A F- -
CL>
0~ z-C-
0 cr-
1050
0.0 000 01 01).0 02BEYLU COCNRTO INWaGTPECN
.1 St4-4658Page: 30
1 5(;C~
-Z - *00-
1400, U LL
Za: a
~0 >
U* z >
__ _ (___ 0
m CL 1
Zn -J CL !
UM 0U 0-
U.) .- L
1200 'llll0
40 U c-- L.
4~ D0c 0 a.-JA L
________~~~~~v V2___ ______e n n95 cc-
-J 0 0
a. co
imLU.
0 w w
0 azzLI.
0.00 0.05 0.10 0.15 0.20 0.25BERYLLIUM CONCENTRATION IN WEIGHT PERCENT
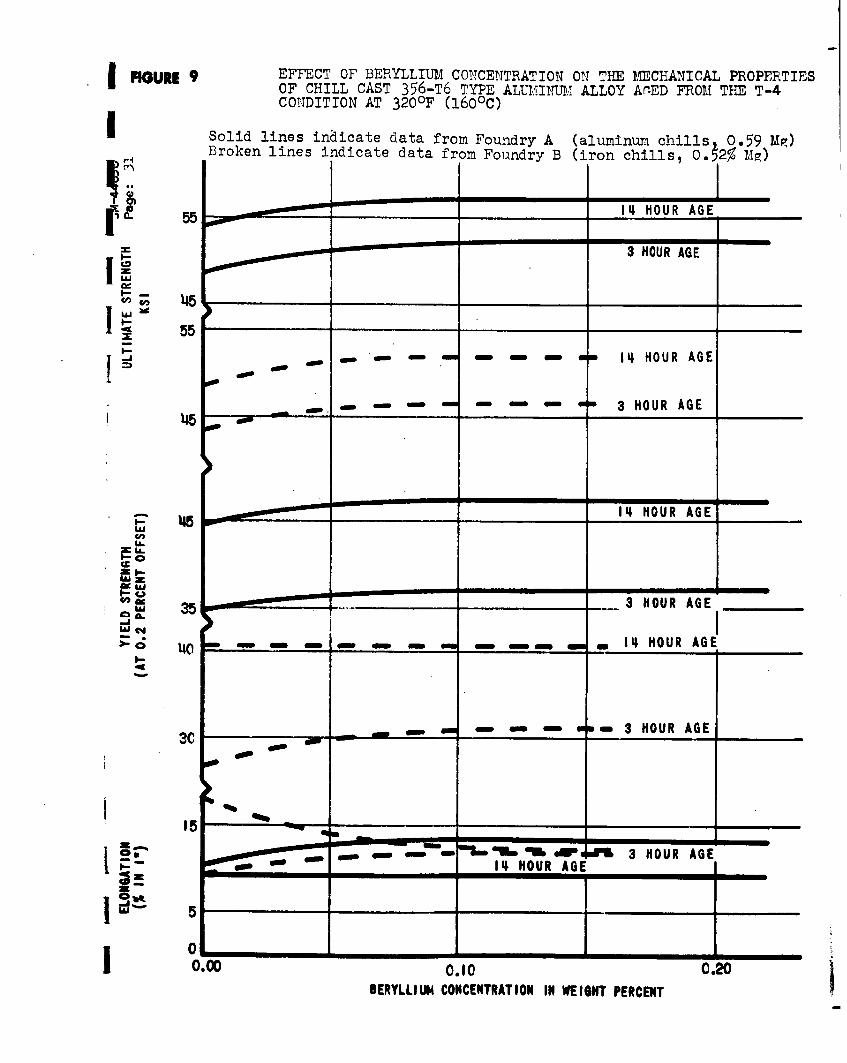
IFIGURE 9 EFFECT OF BERYLLIUM CONCENTRATION ON THE MECHANICAL PROPERTIESOF CHILL CAST 356-T6 TYPE ALUMIl"!I' ALLOY Ar-ED FROM THE T-4CONDITION AT 320OF (1.6 0 C)
Solid lines indicate data f'rom Foundry A (aluminumi chills 0.59 MR)Broken lines indicate data fromn Foundry B (iron chills, O. 2% )
______________ 14 HOUR AGE _ _ _ _ _
F! 3 HOUR AGE
1#~ 45
55
ago_ _ _ _ _ _ ago_ _ _ _ _ _ 3 H O U R A G E _ _ _ _ _
145
U-
355
I-.
3C - - - - - HOUR AGE ___
U_______ C4______ 14 HOUR AGEI
C;~ -4
Iw 5
BERYLLIUM CONCENTRATION IN WEIGHT PERCENT 02
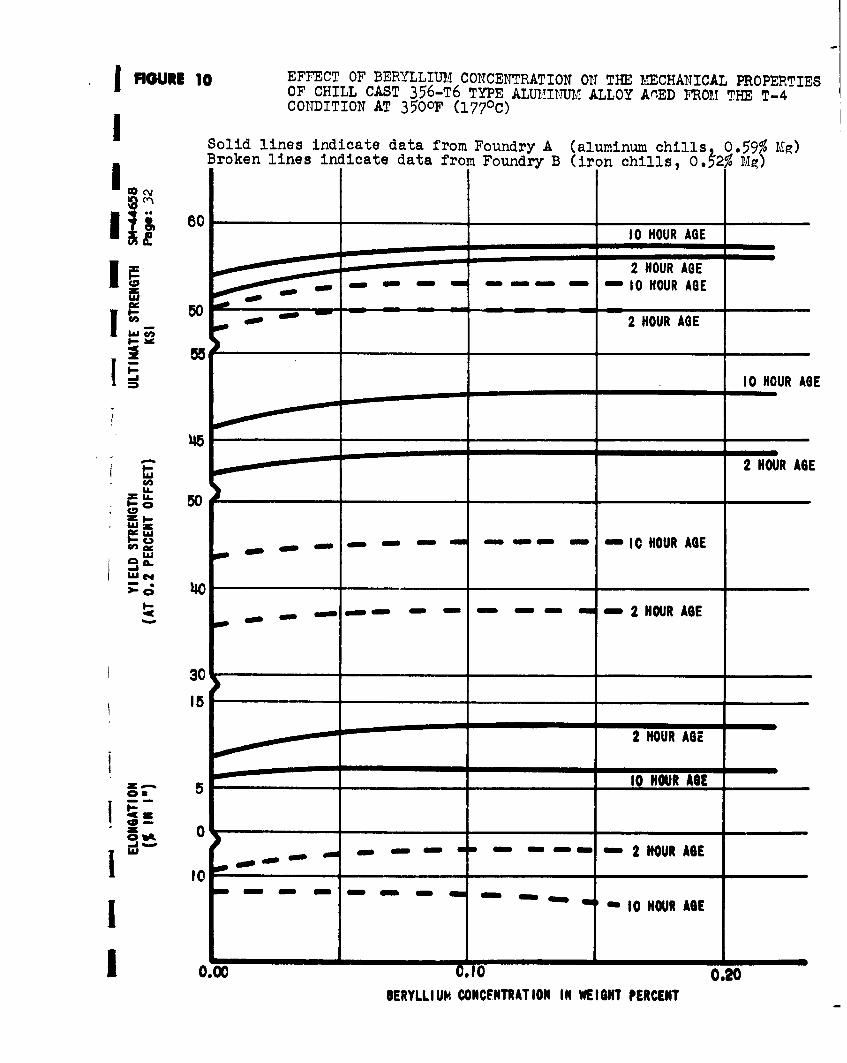
IFIGURE 10 EFFECT OF BERYLLIUM CONCENTRATION Ofl THE VIECHANICAL PROPERTIESOF CHILL CAST 356-T6 TYPE AL1,1INUIIE ALLOY Am'ED FEOTA THE T-4CONDITION AT 3500F (1770C)
Solid lines indicate data from Foundry A (aluminum chills 0.59% MT)
lcocv Broken lines indicate data from Foundry B (iron chills, 03~2% Mg)5
60 10___ t HOUR AGE
2 HOUR AGEco 10 - nnn -HOUR AGE
50- 2 HOUR AGE
55_ _ _ _ _ _ _ _ _ _ _ _ 10 HOUR AGE
2 HOUR AGE
L
-C2 50
1! 10 --- I HOUR AGEwjw
- - - 2 HOUR AGE
30
15
2 HOUR AGE
03 5 ___ __10 HOUR AGE ____
O~wk 0
' " m m I 10 HOUR AGE
0. 0.100.20BERYLLIUM CONCENTRATION IN WEIGHT PERCENT
IRGURE I EFFECT OF >EpJ ,LLLIU!C CcEVhATIO"1 Oil TI l:ECHAIIICAL PROPEETISOF SAND CAST 356-T6 TYPE ALU1I:!.TMI. ALLOY A".ED FRO. THE T-4COiTDITIOTI AT 320 0 F (1770C)
Solid lines indicate data from Foundry A (0.59% M1g)Broken lines indicate data from Foundry B (0.52 aT )
U 14 HOUR AGE
3 HOUR AGEIj..
3 5 _m"II.HOUR
AGE
I--.J
35.14 HOUR AGE
I-
_--3 HOUR AGE,, 35
I--
35 m I - - . m 14 HOUR AGE
3 HOUR AGE
0D2 13 HOUR AGE
0 lI 3 HOUR AGE
_ _11_1__1_1 1_1_ 1 1 I HOUR AGE
0.10 0.20
BERYLLIUM CONCENTRATION IN WEIGHT PERCENT
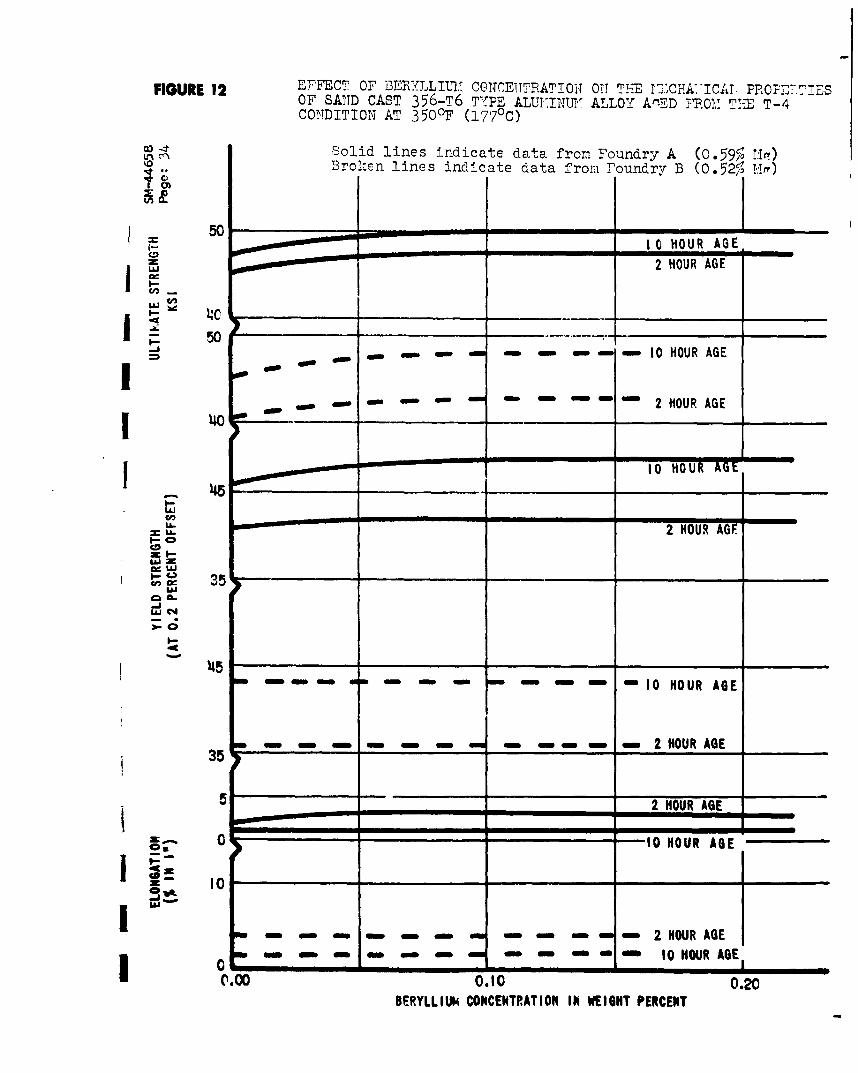
FIGURE 12 EFFECT OF DERYLLIUT: CGIWCEITTATION~ OTT TH1E T2!.CH-ICYJ PROPEL'-Ir-.ESOF SANTD CAST 356-T6 T17PE ALUITIFI ALLOYI ACED TMH T-4-CONDITION AT 35OF (177?0 C)
Solid lines indicate data f'ron Foundry A CO.59/- 1:10Brolren lines indicate data -from 7Poundry B (0.525'!~
50__________________50 to HOUR AGE.
2 HOUR AGE
I. 4C- 1 HU GI
f jamm O ma m 10 HOUR AGE
No
I-. 2 HOUR AGF -
U.
C-
Cn 35
_ __ 2 HOUR AGE -
_0 -to HOUR AGE
Uj~~~~~~~ -N
MO-U I 0 1 MW N a 2 HOUR AGE400_______ -M 0101 ON ON -1O 101 HOUR AGE1
0.000.1 MUMMMMMMM 0.20BERYLLIU14 CONCENTRATION IN WEIGHT PERCENT
SM-44658
Page: 35
II- _ __ _
>-
UziUJ cc.
U.L
LLIO =C,
I UJ
U a. _ _
ILI
S INLVN1
SM-44658u.:36
~~U-
-I- 0K
a - m I-
U
C; U-I
U-
_j. 0A
LL.ism % -.LUVO01
SM-44 65 8
Page: 37
II
I. -
C-D0
'- pLLJJ
cm; - . -J
>0 0'
C.-C.) C 1
ac - I
U.U
Ism %'NOILLVNOi3
SM-44658Page: 38
a 0
IWO ~ . ... L.4
Li~00 ~..aCDI**'I
0
4 0 < V
mU -do -.
~7 ;*~ ~ ... ~ .- .'.*qt " U
3ow 0
w'~L IN 0l C.L
x"A~tU.4. 0.
S00 Oo
S.L
Go
.~' (to
Pag.: 39
0 IL
U~UC
AXA
A. z
o a4 . . .4
<-N
4 CL -W
c* *4
* 0 O
4 z
I z z
0 c
%. 4L -
-. 4. 4.4 w
'A *V* a),. -
E%.to ~h4~44~Jgo~ I. ~.4~&c 4 'of
Jt 1 ... 4]0~
;~y*..,.:q;~a.:Al.
6m-44 6 58
Page: 40
11
MAGH. 7. 5X FIGURE 18 A117522
CROSS SECTION OF 'TEEw BAR ARM AT JUNCTURE WITH BASE(SAND CAST IN 356-T6 ALUMINUM ALLOY)
ETCHANT: 5 PERCENT HF
MAGN. 7.5X FIGURE 19 M17621CROSS SECTION OF wTEE' BAR ARM AT JUNCTURE WITH BASE1 (CHILL CAST IN 356-TO ALUMINUM ALLOY)
ETCHANT: 5 PERCENT HF
7REPRODUCTION QUALITY NOTICE
We use state-of-the-art high speed document scanning andreproduction equipment. In addition, we employ stringent qualitycontrol techniques at each stag. of the scanning and reproductionprocess to ensure that our document reproduction is as true tothe original as current scanning and reproduction technologyallows. However, the following original document conditions mayadversely affect Computer Output Microfiche (COM) and/or printreprodi--.tion:
" Pages smaller or larger than 8.5 inches x 11 inches.
" Pages with background color or light colored printing.
" Pages with smaller than 8 point type or poor printing.
" Pages with continuous tone material or colorphotographs.
" Very old material printed on poor quality or deterioratingpaper.
If you are dissatisfied with the reproduction quality of anydocument that we provide, particularly those not exhibitingany of the above conditions, please feel free to contact ourDirectorate of User Services at (703) 767-9066/9068 orDSN 427-9066/9068 for refund or replacement.
END SCANNED DOCUMENT