UNCERTAINTY OF THE IODINE-131 INGESTION DOSE...
33
1 UNCERTAINTY OF THE IODINE-131 INGESTION DOSE CONVERSION FACTOR INTRODUCTION The United States Department of Energy (DOE) has generated special nuclear materials and related by-products for nearly 50 years in support of the Nation’s nuclear weapons needs (1) . Across the Complex, radiation dose from iodines and noble gases were significant in the early years due to the practice of processing short-cooled fuel, before volatile short-lived fission and activation products could decay away and before effective measures were created for containing these products. The atmospheric source term at the major production sites is dominated, in terms of dose to the public, by 131 I and 144 Ce at Hanford (2) , uranium and its progeny at Fernald (3) , 131 I and 137 Cs at the Idaho National Engineering Laboratory (4) , and 3 H and 131 I at the Savannah River Site (SRS) (5,6) . Historically, throughout the DOE Complex, 131 I released to the atmosphere during the 1950’s as a result of fuel processing has been the largest contributor to public exposure. There are also current potential hazards with regard to radioiodines released to the environment from upsets at nuclear power stations; radioiodine was a major contributor to population exposures following the accident at the Chernobyl NPP (7,8,9,10) . Radiation dose to members of the general public living in the vicinity of sites that make up the DOE Complex is dominated by releases to the atmosphere and surface waters in the early years of operation, prior to the development of techniques to reduce emissions of potentially hazardous material. Dose to the offsite populations from atmospheric sources and pathways has a greater impact than surface water releases simply because of the greater number of people affected; surface water releases may result in a higher individual dose, but the total number of people impacted is much lower. In the late 1940’s through the early 1960’s, offsite dose throughout the DOE Complex from atmospheric releases was dominated by radioiodine, primarily 131 I. After the mid-
Transcript of UNCERTAINTY OF THE IODINE-131 INGESTION DOSE...

1
UNCERTAINTY OF THE IODINE-131 INGESTION
DOSE CONVERSION FACTOR
INTRODUCTION
The United States Department of Energy (DOE) has generated special nuclear materials and
related by-products for nearly 50 years in support of the Nation’s nuclear weapons needs(1).
Across the Complex, radiation dose from iodines and noble gases were significant in the early years
due to the practice of processing short-cooled fuel, before volatile short-lived fission and activation
products could decay away and before effective measures were created for containing these
products. The atmospheric source term at the major production sites is dominated, in terms of dose
to the public, by 131I and 144Ce at Hanford(2), uranium and its progeny at Fernald(3), 131I and 137Cs at
the Idaho National Engineering Laboratory(4), and 3H and 131I at the Savannah River Site (SRS)(5,6).
Historically, throughout the DOE Complex, 131I released to the atmosphere during the 1950’s as a
result of fuel processing has been the largest contributor to public exposure. There are also current
potential hazards with regard to radioiodines released to the environment from upsets at nuclear
power stations; radioiodine was a major contributor to population exposures following the accident
at the Chernobyl NPP(7,8,9,10).
Radiation dose to members of the general public living in the vicinity of sites that make up
the DOE Complex is dominated by releases to the atmosphere and surface waters in the early years
of operation, prior to the development of techniques to reduce emissions of potentially hazardous
material. Dose to the offsite populations from atmospheric sources and pathways has a greater
impact than surface water releases simply because of the greater number of people affected; surface
water releases may result in a higher individual dose, but the total number of people impacted is
much lower. In the late 1940’s through the early 1960’s, offsite dose throughout the DOE
Complex from atmospheric releases was dominated by radioiodine, primarily 131I. After the mid-

2
1960’s, when fuel was cooled for longer periods before processing and when effective emission
controls were in place, various long-lived fission products began to dominate the annual dose
estimates, but total dose was at least an order of magnitude lower and continued to decrease.
Dose reconstruction efforts at DOE’s Hanford Site have shown that, for releases of 131I, the
consumption pathway accounts for more than 95% of total dose with milk consumption accounting
for 80% and beef, eggs, and fruit making up the additional 15%(11). Uncertainties in the calculation
of historical atmospheric concentrations of 131I are on the order of a factor of 2 to 10(12), while the
total reconstructed dose of 131I is estimated to have a 90% confidence range of a factor of 15 for the
maximum individual(2). For a representative (average) individual at any given location, however,
90% of the dose estimates are within a factor of 25 at Hanford(13). Sensitivity analyses showed that
the parameter to which the dosimetry models were consistently most sensitive was the iodine dose
conversion factor (DCF)(13). This is not surprising since the DCF is very influential to dose
estimates from all pathways, similar to that shown by Hamby(14) with the aggregated atmospheric
tritium model. Knowledge of the uncertainties related to the calculation of the 131I ingestion DCF,
therefore, will greatly improve our confidence in the dose reconstruction effort and the prediction of
the consequences related to radioiodine intake.
METHOD
A probabilistic estimation of the 131I adult ingestion dose conversion factor was generated
by multiple calculations of dose to the thyroid following a 1 Bq intake via ingestion. An Excel®
spreadsheet was written that contains modules for calculating the S-factor, the integrated activity in
the thyroid, and the dose conversion factor. As an add-on to Excel, the Crystal Ball® software
package was used to accumulate many iterations of the DCF calculation and to perform statistical
analyses on input and output parameter values. The sections that follow present each of the
calculational steps in more detail.

3
Iodine metabolic modeling. Thyroid uptake and iodine metabolism involves extremely complex
biological systems. In modeling the metabolic transport of iodine through the body, many
simplifying assumptions have to be made. In addition to these assumptions, the presence or
absence of dietary iodine plays a significant role in iodine metabolism and thyroid function. There
is very little difference in metabolism rates between men and women, and, except during pregnancy,
the concentration of hormonal iodine in the bloodstream remains fairly constant throughout life(16).
The uptake of iodine via the ingestion pathway occurs from the consumption of food and
fluids. Iodine in these substances is in an inorganic iodide form and is, therefore, absorbed in the
bloodstream via all levels of the gastrointestinal tract(17), primarily the intestine(16). The rate of
absorption by the GI tract is about 5% per minute(16) and virtually all ingested iodine is absorbed by
the bloodstream(16,18), with very little appearing in the feces(17). Once in the bloodstream, iodine is
rapidly absorbed in the extracellular tissues of the body, with a large fraction, approximately 60-
80%, being lost via the urine(16,17). The majority of body iodine eventually flows through, and is
trapped by, the thyroid or is excreted via the kidneys. A small amount is also removed from the
bloodstream by the liver and excreted in feces(16). Equilibrium of the total pool of iodine is achieved
within several hours after intake, with iodine selectively concentrating in the thyroid, salivary, and
gastric glands(16,17).
Iodine in the body is either in the form of inorganic iodide or organic hormonal iodine.
Iodide is converted to an organic state in the thyroid and remains in that state until reincorporated
into the bloodstream, at which time it converts back to the inorganic form(16). The inorganic phase
of iodine in the body has a turn-over half-life of about 6-7 hours, and the organic phase of iodine
turns over with a half-life of approximately 9.5 days(17).

4
The uptake of iodine by the thyroid is directly correlated to thyroid mass(19) and decreases
only slightly with increasing age(16). Both mass and uptake fraction vary with dietary intakes of
iodine, increasing with low intakes and decreasing with high intakes(19). The size of the thyroid, and
thus, the uptake fraction, is highly dependent on the amount of iodine in the diet(18). Bair et al.(20)
have shown that thyroid uptakes were about 20% in rats with normal iodine diets, but increased to
40-50% with iodine-deficient rats. Dolphin(19) states that, because of its interdependence with
thyroid mass, uptake fractions and thyroid masses must be derived from similar cohorts. For
example, an appropriate uptake fraction for a cohort from the United States, where iodine is
abundant in the normal diet, is about 20%. However, in countries where the iodine abundance in
diets is reduced, and thyroid masses are correspondingly larger, average uptakes approach 45%.
The metabolism and transport of iodine in the human body is simulated using a three-
compartment, first-order kinetic model (Fig. 1). This model, as developed by Riggs(16) and
modified by the ICRP(18), contains one inorganic compartment representing iodide in the blood and
two organic compartments representing hormonal iodine in the thyroid gland and in the
extracellular tissues of the body. In the model of Fig. 1(16,18), iodide in the blood is either
transferred to the thyroid or lost via the urine with a half-life of approximately 6 hours. The
ICRP(18) metabolic data for iodine does not consider the blood-to-thyroid transfer to have any
holdup time, however, other interpretations of the Riggs model account for this short-term delay(21).
Once in the thyroid, iodide is converted to an organic form and then lost to the extracellular tissues
of the body with a half-life of about 120 days. Still in the organic form, iodine in the body is
transferred, with a half-life of approximately 12 days, either back to the blood and converted to
iodide or lost via feces. During profuse sweating, significant amounts of iodide can be lost by
perspiration, but this route is neglected in the model(16,18).
Iodine-131 decays to 131Xe and 131mXe with yields of about 99% and 1%, respectively(22).
Xenon-131 is a stable isotope, while 131mXe emits a 164 keV electron via internal conversion. Since

5
xenon is a noble gas, and because of the low yield and low energy of 131mXe, it is assumed for
estimates of internal dosimetry that its contribution to dose is insignificant. Dose from this nuclide,
therefore, is not considered in the estimate of the 131I dose conversion factor(18).
Time-integrated iodine activity. In Riggs’(16) original analysis of the differential equations
governing the iodine metabolic model, he suggests that the change in activity in the thyroid gland is
approximately equal to the product of the activity in the inorganic compartment and the rate constant
describing the transfer from the inorganic compartment to the thyroid. This analysis, however,
would rely on several simplifying assumptions. Therefore, a rigorous mathematical treatment is
more appropriate. Because of the need to explicitly calculate the dose conversion factor multiple
times to determine its variability, the details of the calculation are provided below.
A simplified representation of the three-compartment model for iodine ingestion is
presented in Fig. 2. The compartments represent the time-dependent radioiodine activity in the
blood, X(t), activity in the thyroid, Y(t), and activity in the rest of the body, Z(t). The rate constants
depicted in Fig. 2 account for the transfer of iodine between compartments and the loss of iodine
either by excretion or radioactive decay. The rate constants are equal to the following:
a f k
b f k
c k
d
e f k
f f k
blt bl
blt bl
t
bbl b
bbl b
== − +=== − +=
( )
( )
1
1
λ
λλ
where fblt and fbbl represent the fraction of activity in the blood taken up by the thyroid and the
fraction of activity in the body going to the blood, respectively. The parameters kbl, kt, and kb
represent the transfer rate constants for iodine moving out of the blood, out of the thyroid, and out

6
of the body, respectively. Radiological decay, of 131I in this case, is represented by λ. The
differential equations for the three compartments are:
dX t
dtfZ t a b X t
( )( ) ( )= − +( ) , (1)
dY t
dtaX t c d Y t
( )( ) ( )= − +( ) , and (2)
dZ t
dtcY t e f Z t
( )( ) ( )= − +( ) . (3)
The solution of these three linear homogeneous first-order differential equations follows
from the creation of a single third-order linear homogenous differential equation. This is
accomplished by solving eqn (1) for Z(t), where,
Z t
dX t
dta b X t
f( )
( )( ) ( )
=+ +
. (4)
Then, taking the derivative of eqn (4) with respect to time results in,
dZ t
dt
d X t
dta b
dX t
dtf
( )( )
( )( )
=+ +
2
2
. (5)
Solving eqn (3) for Y(t) yields,

7
Y t
dZ t
dte f Z t
c( )
( )( ) ( )
=+ +
, (6)
and substituting eqns (4) and (5) into eqn (6) results in,
Y tcf
d X t
dta b e f
dX t
dta b e f X t( )
( )( )
( )( )( ) ( )= + + + + + + +
1 2
2 . (7)
Then, the derivative of eqn (7) with respect to time gives,
dY t
dt cf
d X t
dta b e f
d X t
dta b e f
dX t
dt
( ) ( )( )
( )( )( )
( )= + + + + + + +
1 3
3
2
2 . (8)
Substituting eqns (7) and (8) into eqn (2) and defining the following parameters,
A a b c d e f
B a b e f a b e f c d
C acf a b c d e f
= + + + + += + + + + + + += − + + +
,
( )( ) ( )( ),
( )( )( ),
and (9)
results in the third-order differential equation describing the system of Fig. 2,
d X t
dtA
d X t
dtB
dX t
dtCX t
3
3
2
2
( ) ( ) ( )( )+ + = . (10)
The solution of eqn (10) follows from the solution of the characteristic equation,

8
r Ar Br C3 2+ + = , (11)
and, therefore, the general solution of eqns (10) and (11) takes the form,
X t c e c e c er t r t r t( ) = + +1 2 31 2 3 (12)
where r1, r2, and r3 are the roots of the characteristic equation and c1, c2, and c3 are
integration constants determined from the initial conditions.
In general terms, the roots of eqn (11) are:
rA D
E
E1
3
332
3 3 2= − − + , (13)
rA
iD
Ei
E2
3
331 3
23
1 36 2
= − − + − −( ) ( ) , and (14)
rA
iD
Ei
E3
3
331 3
23
1 36 2
= − + − − +( ) ( ) , (15)
where the parameters, D and E, have been defined as,
D A B= − +2 3 , and (16)
E A AB C A B A AB C= − + + + − + + − + +2 9 27 4 3 2 9 273 2 3 3 23 ( ) ( ) . (17)
9
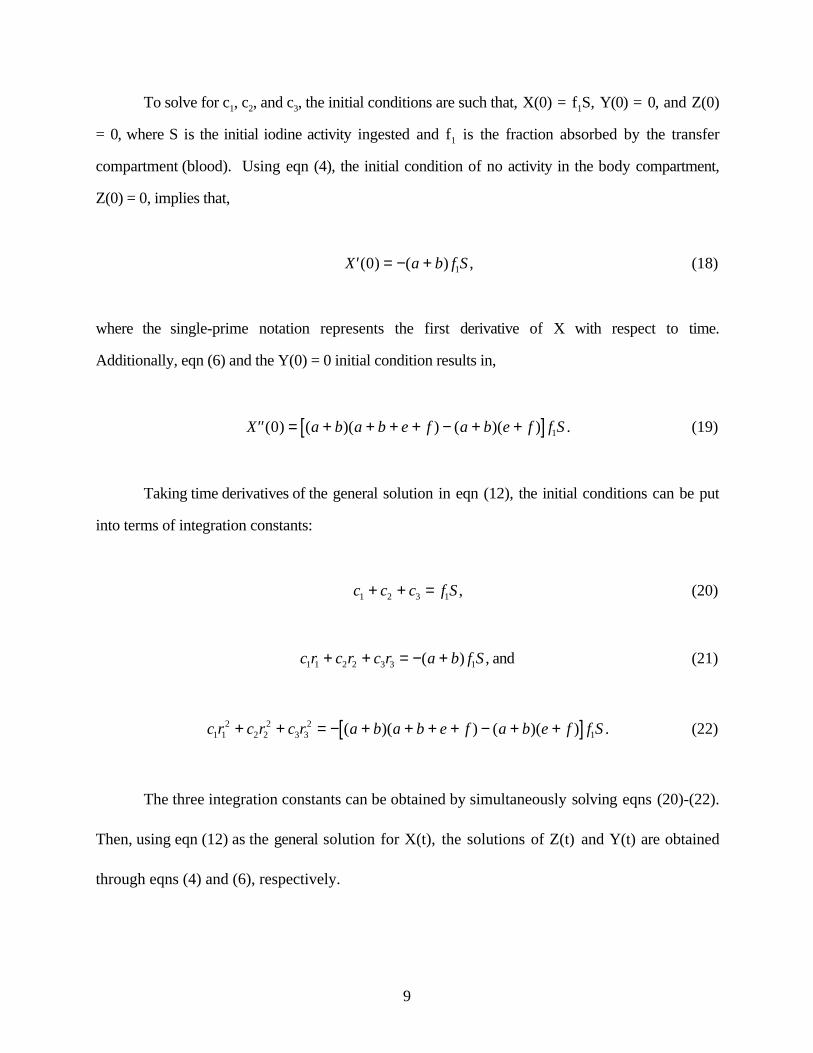
To solve for c1, c2, and c3, the initial conditions are such that, X(0) = f1S, Y(0) = 0, and Z(0)
= 0, where S is the initial iodine activity ingested and f1 is the fraction absorbed by the transfer
compartment (blood). Using eqn (4), the initial condition of no activity in the body compartment,
Z(0) = 0, implies that,
′ = − +X a b f S( ) ( )0 1 , (18)
where the single-prime notation represents the first derivative of X with respect to time.
Additionally, eqn (6) and the Y(0) = 0 initial condition results in,
′′ = + + + + − + +[ ]X a b a b e f a b e f f S( ) ( )( ) ( )( )0 1 . (19)
Taking time derivatives of the general solution in eqn (12), the initial conditions can be put
into terms of integration constants:
c c c f S1 2 3 1+ + = , (20)
c r c r c r a b f S1 1 2 2 3 3 1+ + = − +( ) , and (21)
c r c r c r a b a b e f a b e f f S1 12
2 22
3 32
1+ + = − + + + + − + +[ ]( )( ) ( )( ) . (22)
The three integration constants can be obtained by simultaneously solving eqns (20)-(22).
Then, using eqn (12) as the general solution for X(t), the solutions of Z(t) and Y(t) are obtained
through eqns (4) and (6), respectively.

10
Sample calculations of the roots and integration constants where performed using the
following values for the rate constants:
λ = = = =ln( ).
ln( ).
ln( ) ln( )28 02
20 25
2120
212 d
d
d
d
k k kbl t b (23)
with f1 = 1.0, fblt = 0.3, fbbl = 0.9, and S = 1 Bq of 131I ingested. With these inputs, the roots and
integration constants were determined. A high degree of precision was necessary during the
numerical calculation of these values due to the large difference in the magnitudes of the three roots
as well as taking powers of the roots in eqn (22). The final solutions for the time-dependent iodine
activity in the three compartments can be presented at a lower precision. For the base case given
here, the iodine activity in each compartment as a function of time, t, can be expressed as,
X t e e et t t( ) . . .. . .= − +− − −1 00 0 000613 0 0005882 86 0 146 0 0905 Bq , (24)
Y t e e et t t( ) . . .. . .= − − +− − −0 301 0 00949 0 2912 86 0 146 0 0905 Bq , and (25)
Z t e e et t t( ) . . .. . .= − +− − −0 000640 0 0320 0 03132 86 0 146 0 0905 Bq. (26)
The activity of other isotopes of radioiodine in the various compartments as a function of time can
be calculated rather easily by multiplying eqns (24) - (26) by the factor,
e i t− −( . )λ 0 0862 , (27)
where λi is the decay constant (in units of d-1) of the radioiodine in question. The integrated activity
in each compartment after ingestion to a time T, in units of d, is determined using,

11
X T e e eT T T( ) . . . .. . .= − + −− − −0 352 0 350 0 00420 0 006502 86 0 146 0 0905 Bq - d, (28)
Y T e e eT T T( ) . . . .. . .= + − −− − −3 18 0 105 0 0650 3 222 86 0 146 0 0905 Bq - d , and (29)
Z T e e eT T T( ) . . . .. . .= − + −− − −0 127 0 000224 0 219 0 3462 86 0 146 0 0905 Bq - d . (30)
For T = 18,250 d (50 y), the integrated activity is 0.35 Bq-d in the blood compartment (X50y), 3.2
Bq-d in the thyroid compartment (Y50y), and 0.13 Bq-d in the body compartment (Z50y). These
results are consistent with a previous solution of the iodine ingestion model(16,18), which used an 131I
decay half-life of 8.04 d and accounts for the different half-lives of other isotopes.
Calculation of the S-factor. The S-factor, in units of Gy Bq-1 d-1, is calculated using,
Sx
MTi i
i
=−
∑1 6 10 13. ∆ φ (31)
where the constant has units of J MeV-1 and, for the case of 131I, MT is the mass of the thyroid (in
kg), ∆i is the product of the fractional yield and the average emission energy per disintegration of
radiation I (in MeV), and φi is the fraction of energy absorbed by the target organ from radiation i
originating in a given source (the thyroid is both the source and the target in this case). The mass
of the thyroid varies from one person to the next and is correlated to the iodine uptake fraction and
its physiological health. Iodine-131 decays by beta emission 100% of the time (Fig. 3). Table 1
shows that it has six significant beta radiations, nine gamma radiations, five capture electrons, and
two characteristic x-rays(22). The specific absorbed fractions, Φi, for a thyroid mass of 0.020 kg(24)
were used to determine absorbed fractions as a function of photon energy (see Fig. 4). The
absorbed fraction, φi, is related to the specific absorbed fraction by,

12
φi i TM= Φ . (32)
Absorbed fractions will be used in the calculation of DCF uncertainty because of the
necessity to have variability in the mass of the adult thyroid. Some uncertainty will be introduced
into the calculation since the absorbed fractions are derived from specific absorbed fractions which
are determined using distinct geometrical shapes related to specific organ masses. This added
uncertainty, however, is expected to be insignificant in the overall variability of the DCF. The total
yield-weighted energy released per transition is about 0.574 MeV. Of that, approximately 0.204
MeV is absorbed by the thyroid for each transition of 131I that occurs in the thyroid (see Table 1).
Therefore, using a standard thyroid mass of 0.020 kg, the S-factor for 131I(thyroid<--thyroid) is
1.64x10⁻¹² Gy Bq-1 s-1, consistent with that quoted by Eckerman(23). The quality factor for all
radiations emitted by 131I is assumed to be unity.
Calculation of the dose conversion factor. The DCF is the product of the integrated activity and
the S-factor. In general terms, the DCF is written as,
D T A S T SSS
( ) ˜ ( )= ←∑ . (33)
In the case of the thyroid dose from 131I residing in the thyroid, eqn (33) reduces to,
DCF A Ss= ˜ , (34)
since contributions to total dose from all other organs are insignificant compared to thyroid as the
target and source(23). Using the base-case values, the dose conversion factor is equal to 4.5x10⁻⁷ Sv
Bq-1. This value compares to those reported by the DOE (1988), the EPA (1988), and Killough and
Eckerman(21), of 4.9x10⁻⁷, 4.76x10⁻⁷, and 4.6x10⁻⁷ Sv Bq-1, respectively. The spreadsheets designed

13
to perform all calculations were hand-checked against reported values(21) and results of
Mathematica® calculations.
Monte Carlo technique. Parameter values for multiple calculations of DCF were assigned using
a Latin hypercube sampling (LHS) routine. The method considers the range of each parameter to
be composed of a given number of non-overlapping intervals of equal probability. For a given
parameter, values are selected at random from each interval based on the probability density
function in the interval. The Latin hypercube approach is a constrained random sampling technique
that results in added precision over conventional random sampling methods (e.g., simple random
sampling) since the entire range of the distribution is sampled in a more systematic manner(15).
Thus, fewer iterations are needed in order to provide adequate statistical input for the probabilistic
dose estimate. Model input includes the type of distribution (e.g., normal, lognormal, uniform) and
parameters describing its range (e.g., mean, standard deviation, minimum, maximum).
One thousand dose estimates were calculated using the dose-conversion-factor model and
the parameter assignments described below. The Latin hypercube routine selected 10 parameter
values from each of 100 intervals within each parameter distribution. All parameters, except thyroid
mass and uptake fraction, were assumed to be independent since data supporting the calculation of
correlation coefficients were not found to be available. The Latin hypercube method provided
frequency distributions of dose with mean standard errors of less than 1%. Statistics of the dose
probability distribution were not significantly improved by increasing the number of trials above
1,000.
PARAMETER DISTRIBUTIONS
Of the parameters varied in the calculation of the 131I ingestion dose factor, very few are
known with certainty. Eleven parameters are allowed to vary according to their range and

14
probability distribution (see Table 2). Because of the lack of certainty, all parameters except thyroid
mass, are assigned triangular distributions, the least amount of bias for the information available.
Because of early studies on the kinetics of radioiodine in the human body, some information is
known about transfer rates, compartmentalization, and transfer fractions, but for the most part, these
estimates are either based on studies of persons with thyroid disease or results have been derived
from small cohorts(16). In all but one parameter, the thyroid uptake fraction, the data are limited
suggesting the use of uniform or triangular distributions. However, since iodine uptake has been
shown to be directly correlated to the mass of one’s thyroid(16,17,19), its assigned distribution will
mimic, and be closely correlated to, that of the thyroid mass.
Thyroid mass (MT). Since the mass of ones’ thyroid is directly related to its uptake fraction of
iodine from the bloodstream(16,19), and since diet has an important influence on fractional uptake and
mass, it is extremely important that thyroid mass be correlated with uptake fraction and that the two
come from comparable datasets(19). For example, erroneous dose estimates would result if a dataset
from the U.S. for thyroid mass were used with an estimate of fractional uptake from data in a
country with iodine-deficient diets. The mass of the adult thyroid (age > 17 years) in Standard Man
is determined from data collected in New York(25). These data have a geometric mean of 0.01778 kg
with a geometric standard deviation (GSD) of 1.47. When log-transformed, the distribution is
normal with a mean of 1.25 and a standard deviation of 0.1682.
Fractional absorption (f1). Fractional absorption refers to the fraction of the initial intake that is
absorbed into the transfer compartment, i.e., the bloodstream. It is generally assumed that f1 is
equal to unity for iodine(18). Early investigators report that iodine is rapidly and completely
absorbed by the gastrointestinal tract with very little appearing in the feces(16,17). To allow for the
modeling of some excretion via the feces after initial ingestion, the f1 parameter is assigned a
triangular distribution with a mode of 1.0 and a range of 0.9 to 1.0.

15
Fractional uptake from transfer compartment (fblt). Once in the bloodstream, iodine is taken
up by the thyroid with about 20-40% efficiency. This uptake is dependent on thyroid mass, thyroid
metabolism and function, and iodine-presence in ones’ diet. Dolphin(19) suggests a mass-dependent
uptake fraction of 0.015 per gram of thyroid. The ICRP(18) estimate of a fractional uptake of 0.30
is, therefore, consistent with the use of a 0.020 kg thyroid(25). The early data of Riggs(16) indicates
that, based on ratios of rate constants, the uptake fraction for a healthy individual with a “normal”
thyroid is approximately 0.33, whereas an individual with “chronic iodine deficiency” has an
uptake fraction of about 0.89. Uptake fractions reported by Riggs range from about 0.10 to 0.90.
In order to establish a fractional uptake distribution that is consistent with the distribution of
thyroid mass, we have assigned the uptake fraction a lognormal shape with a geometric mean of
0.267 and a GSD of 1.47. The mean is 0.015 times the geometric mean of the thyroid mass
(0.01778 kg) and the GSD is equal to the GSD of the thyroid mass distribution.
The parameters of thyroid mass and uptake fraction are directly correlated, however, the
numerical relationship is not known. We have chosen to arbitrarily set the correlation coefficient
between these two variables to 0.90. This degree of correlation will maximize their influence on
each other and on the entire model, as well as provide some degree of flexibility in the selection of
values for these two parameters. The value of the correlation coefficient will be investigated to
determine its influence on the DCF uncertainty.
Fractional transfer from body to blood (fbbl). The fraction of iodine moving from the
extracellular tissues of the body to the blood is more narrowly defined than the thyroid uptake
fraction. The body-to-blood fraction does not change from “normal” individuals to those with
“acute or chronic iodine deficiency”(16) indicating that the fraction is far less variable between
individuals. The iodine leaving the body compartment is assumed to go back to the transfer
compartment (bloodstream) or be excreted via the feces. A ratio of rate constants was used to

16
determine the fractional transfer to the bloodstream. The transfer fraction is taken as the ratio of the
rate constant for movement from the body to the blood, kbbl, and the total body loss rate constant,
i.e., the transfer to the blood plus the transfer to the feces, kbf, where,
fk
k kbblbbl
bbl bf
=+
. (36)
We have assigned fbbl a triangular distribution with a mode of 0.914 and a range of ±10%
(yet, not to exceed 1.0). The range assigned to this distribution is rather large given the low
variability of Riggs’ data(16). This wide range will maximize the parameter’s influence on model
output; this influence will be quantified if it is shown to be significant.
Radiological half-life (T1/2). The estimate of the radiological half-life for 131I, and hence the
decay constant, has varied over the years. Depending on which reference is chosen, the range of
values in the literature today spans only about 2%. The most current data on the decay of 131I is
obtained from the National Nuclear Data Center(22), where the half-life is reported to be 8.02070
days. This value, being carried to six significant figures, is highly precise. We have, therefore,
chosen to assign a triangular distribution to this parameter with a mode of 8.0207 d and a range of
±0.1%. Because its value is so well known, it is expected that this parameter will have very little
influence on total DCF uncertainty.
Thyroid-loss rate constant (kT). Iodine is lost from the thyroid in “normal” individuals (with
regard to thyroid function) with a half-life of about 113 days(16). It is from Riggs’ data that the
ICRP(18) obtain their estimate of 120 days. The half-life in patients with “chronic iodine
deficiency” increases to 156 days and drops to as low as 20 days in patients with
hyperthyroidism(16). Given this range of possible values over a large population, a triangular
distribution has been assigned with a mode of 113 days and a range of ±40%. Radioiodine is also

17
lost from the thyroid compartment by radiological decay, and in the case of the short-lived iodines,
radiological decay dominates the loss from the thyroid.
Body-loss rate constant (kb). Loss of iodine from the extracellular tissues occurs by transfer to
the blood, excretion via feces, and radiological decay. Riggs(16) estimates a half-life of 11.9 days in
this compartment for both blood transfer and fecal excretion. As with the blood-to-body fractional
transfer, the loss rate does not change in individuals with “acute or chronic iodine deficiency” and
the lowest value for patients with hyperthyroidism is 3.9 days(16). Based on Riggs’ data, therefore, a
triangular distribution with a mode of 12 days and a range of ±20% was chosen to describe kb.
Blood-loss rate constant (kblt). The ICRP 30 model(18) makes no mention of gradual loss of
iodine from the transfer compartment. Taken explicitly, the model suggests that the transfer of
iodine from the blood to the thyroid and out of the body via the urine is instantaneous. However,
when examining the original model development(16) and exercises by Killough and Eckerman(21) and
Eckerman(23), it is evident that iodine is lost from the blood with a half-life of about 6 hours.
Riggs(16) estimates this value to be 5.8 hours, varying between 1 and 13.9 hours depending on
iodine deficiency and thyroid function. Therefore, we have chosen a triangular distribution with a
mode of 0.25 days and a range of ±99% to describe the loss of iodine from the blood.
Radiation yield (∆i). The fraction of the time a given radiation is emitted per transition of 131I is
taken from data provided by the NNDC(22) and is reproduced in Table 1. These values are reported
to three significant figures, and as such, each have been assigned a triangular distribution with a
mode equal to the reported value and a range of ±1%.
Average energy per transition (Ei). Also given in Table 1 are the NNDC’s values for the
energy of each radiation emitted by 131I, average energies for beta particles(22). Radiation energies

18
are reported to four significant digits, and as such, each have been assigned triangular distributions
with ranges of ±0.1% and modes equal to the reported values.
Absorbed fraction (φi). The value of absorbed fraction is unity for beta particles and conversion
electrons, but varies as a function of energy for photons. Variability of this parameter is not
handled explicitly, but is linked to the variability established for Ei. The values of absorbed fraction
are linear-interpolated from the data(24) of Figure 4 for each iteration and each photon energy.
RESULTS
The sensitivity of the iodine-DCF model to its input parameters was determined using both
rank correlation and contribution to variance methods(14,26). Estimates of several distributions have
been made at a few intermediate steps through the calculation of dose conversion factor, i.e., energy
per transition, S-factor, and time-integrated activity. No correlations between parameters were
considered for the calculation of these distributions. However, since both uptake fraction and
thyroid mass are used in the calculation of dose conversion factor, these two input distributions
were assumed to be correlated with a coefficient of 0.9. The influence on DCF output of choosing
this value for the correlation is investigated below.
Energy per transition. The energy-per-transition distribution is calculated to assess the impact
that radiation yield and radiation energy have on the parameter, ∆ i ii
φ∑ , used in the calculation of
S-factor. The resulting distribution is triangular in shape with a range of no more than 2% from the
minimum to the maximum value. The variability in the distribution is almost entirely explained by
the B4 beta yield parameter to a degree of 93% and the B4 beta energy by an additional 1%.
Beyond that, no other single parameter of energy or yield contributes more than 1% to the
variability of ∆ i ii
φ∑ . Given that essentially one input parameter contributes to the uncertainty of

19
this output parameter, the radiation energy and yield parameters are excluded from further
consideration in the results that follow. Their slight contribution to the variability of the dose
conversion factor, however, will be maintained throughout the estimation of total uncertainty in the
DCF.
S-factor. The mass of the thyroid shows a complete inverse correlation (-1.0) with the 131I S-factor
distribution (Fig. 5) and contributes 96% to the total variance. The estimated S-factor distribution
is lognormal with a geometric mean (GM) of 1.9x10⁻¹² Gray per nuclear transition (Gy nt-1) and a
GSD of 1.47. The maximum value is about 14 times larger than the minimum value and the
historical MIRD estimation of 1.7x10⁻¹² Gy nt-1(27) falls at the 38th percentile.
Time-integrated activity. The distribution for time-integrated activity is lognormal with a
geometric mean of 1.0x10⁵ Bq d-1 and a GSD of 1.46, and its range spans a factor of 12 (Fig. 6).
The uptake fraction accounts for 96% of the total variance (Table 3). The other input parameters
play a minor role in the total variability of integrated activity in the thyroid.
Dose conversion factor. The dose conversion factor model is equally sensitive to thyroid mass
and uptake fraction (Table 4), primarily due to their high degree of correlation, but also because the
thyroid mass drives the estimate of the S-factor and the uptake fraction drives the estimate of the
integrated activity. Although the distribution appears to be normally distributed (Fig. 7), the DCF
best fits a lognormal distribution with a GM of 4.3x10⁻⁷ Sv Bq-1 and a GSD of 1.19. The range of
output values resulted in the maximum being a factor of about 3.7 times the minimum and the DOE
and EPA estimates(28,29) fall at about the 78th percentile. The recent estimate of 3.5x10⁻⁷ Sv Bq-1 by
the National Cancer Institute(30) falls at the 13th percentile.
DISCUSSION

20
The thyroid mass is of extreme importance in determining the S-factor for self-irradiation of the
thyroid and the uptake fraction completely dominates the estimate of the thyroid’s integrated
activity. And, in general, these two parameters dominate the uncertainty of the 131I ingestion dose
conversion factor. In calculating the dose conversion factor, two more parameters provide some
influence, those being the blood absorption fraction, f1, and the thyroid loss constant, kt. The
absorption fraction varied from 0.9 to 1.0, with increasing emphasis placed on values closer to
unity. When this parameter was allowed to vary from 0.8 to 1.0, with the same distributional
emphasis, f1 became the most influential parameter with regard to DCF model sensitivity, but
otherwise the distribution was essentially unchanged with only a 3% decrease in the median value.
The thyroid loss constant was varied by 40% on either side of 113 days. Even though this is a
considerable range, the parameter was still only marginally important in the calculation of DCF,
being responsible for only 2% of the total variance.
The emission yield of the B4 beta particle (see Table 1) is very important in the calculation of the
absorbed energy and only marginally for the S-factor, but in light of the major influence of thyroid
mass and uptake fraction, its influence on the total DCF uncertainty is vanishingly small.
The correlation between thyroid mass and uptake fraction plays a significant role in estimating the
DCF probability distribution. The degree to which the correlation affects the DCF was judged by
estimating certain statistical parameters while varying the correlation coefficient (CC) from zero to
1.0 (Fig. 8). Generally, with decreasing correlation, the range between the maximum and minimum
values estimated in the probabilistic DCF distribution is increased. Likewise, with decreasing
correlation, the skewness increases, indicating that the lognormal distribution is getting more
skewed to the right, and the kurtosis increases, indicating that the peakedness of the distribution is
increasing. However, regardless of the degree of correlation, the median of the DCF distribution
remains the same, with a standard deviation of the calculated median values of less than 1%.
Correlation coefficients between about 0.2 and 0.95 result in roughly the same DCF distribution,

21
except that the range of possible values increases from about 4 to 15 with decreasing correlation.
For CCs between 0.6 and 0.95, the distributions are virtually unchanged. At a CC of 1.0, the DCF
distribution changes shape dramatically, becoming skewed to the left. This degree of correlation is
mathematically equivalent to requiring that the uptake fraction equal the product of 0.015 and the
thyroid mass. It is not prudent to expect that thyroid mass and uptake are perfectly correlated
across any population. Therefore, it appears that the selection of a CC of 0.9 is a valid assumption
and has minimal impact on the results presented herein.
The overall uncertainty of the iodine dose conversion factor is actually decreased because of the
correlation between thyroid mass and uptake fraction. The individual variability in the S-factor and
integrated activity distributions is considerably greater than the uncertainty of the two combined.
This is due to the fact that the uncertainties of mass and uptake dominate the uncertainties of the S-
factor and the integrated activity, respectively, and that those two parameters are highly correlated.
Accordingly, the range of possible values is only about a factor of 4 for the 131I DCF, compared to a
factor of 15 for the tritium dose factor(31). By comparison, when the correlation is removed (CC=0),
the range of values for the iodine DCF increases to more than a factor of 40.

22
CONCLUSIONS
The 131I dose conversion factor is lognormally distributed with a median of 4.3x10⁻⁷ Sv Bq-1 and a
geometric standard deviation of 1.19. The distribution has a range of a factor of approximately 4.
Thyroid mass and the fractional uptake of iodine from the blood are the two most important
parameters in the calculation of the iodine DCF. These parameters are known to be correlated, but
not to what degree. Dose estimates to individuals and populations exposed to radioiodine can be
made more accurate with an increased understanding of the correlation between thyroid mass and
uptake fraction and the development of a more extensive database of these two parameters.

23
REFERENCES
1. U.S. Department of Energy. Closing the Circle on the Splitting of the Atom: The
Environmental Legacy of Nuclear Weapons Production in the United States and What the
Department of Energy is Doing About It. Office of Environmental Management.
Washington, DC: 1995.
2. Shipler, D.B.; Napier, B.A.; Farris, W.T.; Freshley, M.D. Hanford environmental dose
reconstruction project - an overview. Health Physics. 71:532-544; 1996.
3. Meyer, K.R.; Voilleque, P.G.; Schmidt, D.W.; Rope, S.K.; Killough, G.G.; Shleien, B.;
Moore, R.E.; Case, M.J.; Till, J.E. Overview of the Fernald Dosimetry Reconstruction
Project and source term estimates for 1951-1988. Health Physics. 71:425-437; 1996.
4. Maharas, S. Personal communication. July 1998.
5. Murphy, C.E.; Bauer, L.R.; Hayes, D.W.; Marter, W.L.; Zeigler, C.C. Tritium in the
Savannah River Site environment. Revision 1. Westinghouse Savannah River Company.
Aiken, SC: Report No. WSRC-RP-90-424-1; 1991.
6. Kantelo, M.V.; Bauer, L.R.; Marter, W.L.; Murphy, C.E.; Zeigler, C.C. Radioiodine in the
Savannha River Site environment. Wesinghouse Savannah River Company. Aiken, SC:
Report No. WSRC-RP-90-424-2; 1993.
7. Zvonova, I.A.; Balonov, M.I.; Bratilova, A.A. Thyroid dose reconstruction for the population
of Russia after the Chernobyl accident. Radiation Protection Dosimetry. 79:175-178; 1998.

24
8. Kryshev, I.I. Dose reconstruction for the areas of Russia affected by 131I contamination.
Radiation Protection Dosimetry. 64:93-96; 1996.
9. Makhon'ko, K.P.; Kozlova, E.G.; Silant'ev, A.N.; Bochkov, L.P.; Shkuratova, I.G.; Valetova,
N.K.; Volokitin, A.A.; Rabotnova, F.A. Local contamination with /sup 131/I after the
Chernobyl nuclear power plant accident and estimates of the dose burdens from its
radiation. Atomic Energy. 72:339-344; 1992. (Translated from: Atomnaya Energiya.
72:377-382; 1992.)
10. Nedveckaite, T.; Filistowicz, W. Estimates of thyroid equivalent dose in Lithuania following
the Chernobyl accident. Health Physics. 69:265-268; 1995.
11. Anderson, D.M.; Marsh, T.L.; Deonigi, D.A. Developing historical food production and
consumption data for 131I dose estimates: The Hanford experience. Health Physics.
71:578-587; 1996.
12. Ramsdell, J.V.; Simonen, C.A.; Burk, K.W.; Stage, S.A. Atmospheric dispersion and
deposition of 131I released from the Hanford Site. Health Physics. 71:568-577; 1996.
13. Farris, W.T.; Napier, B.A.; Ikenberry, T.A.; Shipler, D.B. Radiation doses from Hanford
Site releases to the atmosphere and the Columbia River. Health Physics. 71:588-601; 1996.
14. Hamby, D.M. A comparison of sensitivity analysis techniques. Health Physics. 68:195-
204; 1995.

25
15. Hamby, D.M. A probabilistic estimation of atmospheric tritium dose. Health Physics.
65:33-40; 1993.
16. Riggs, D.S. Quantitative aspects of iodine metabolism in man. Pharmacological Reviews.
4:284-370; 1952.
17. Hetzel, B.S.; Maberly, G.F. Iodine. In: Trace Elements in Human and Animal Nutrition.
Walter Mertz (ed.). 5th Edition. Vol. 2. Academic Press. New York, NY: 1986
18. International Commission on Radiological Protection (ICRP). Limits for intakes of
radionuclides by workers. New York: Pergamon Press; ICRP Publication 30, Part 1; 1979.
19. Dolphin, G.W. Dietary intakes of iodine and thyroid dosimetry. Health Physics. 21:711-
712; 1971.
20. Bair, W.J.; Snyder, M.D.; Walters, R.A.; Keough, R.F. Effect of 127I on thyroid uptake of
inhaled 131I. Health Physics. 9:1399-1410; 1963.
21. Killough, G.G.; Eckerman, K.F. Internal dosimetry. In: Radiological Assessment. J.E. Till
and H.R. Meyer (eds). U.S. Nuclear Regulatory Commission. Washington, DC: Report
No. NUREG/CR-3332; pp. 1983.
22. National Nuclear Data Center (NNDC). Brookhaven National Laboratory. Brookhaven,
NY; 1994. (http://www.nndc.bnl.gov)
23. Eckerman, K.F. Dosimetric methodology of the ICRP. In: Internal Radiation Dosimetry.
O.G. Rabbe (ed.). Medical Physics Publishing. Madison, WI: pp. 239-270; 1994.

26
24. Eckerman, K.F. Personal communication. October 1998.
25. International Commission on Radiological Protection (ICRP). Report of the task group on
reference man. New York: Pergamon Press; ICRP Publication 23; 1974.
26. Hamby, D.M. A review of techniques for parameter sensitivity analysis of environmental
models. Environmental Monitoring and Assessment. 32:135-154; 1994.
27. Snyder, W.S.; Ford, M.R.; Warner, G.G.; Watson, S.B. ‘S’, Absorbed dose per unit
cumulated activity for selected radionuclides and organs. New York: Society of Nuclear
Medicine. MIRD Pamphlet No. 11; 1975.
28. United States Environmental Protection Agency (USEPA). Limiting values of radionuclide
intake and air concentration and dose conversion factors for inhalation, submersion, and
ingestion. Washington, DC: Federal Guidance Report No. 11; 1988.
29. United States Department of Energy (USDOE). Internal dose conversion factors for
calculation of dose to the public. Washington, DC: Report No. DOE/EH-0071; 1988.
30. National Academy Press. Exposure of the American people to iodine-131 from Nevada
nuclear-bomb tests: Review of the National Cancer Institute report and public health
implications. National Academy Press. Washington, DC: 1998.
31. Hamby, D.M. Uncertainty of the tritium dose conversion factor. submitted to Health
Physics. October 1998.

27
28
FIGURE CAPTIONS
Fig. 1. ICRP 30 iodine ingestion biokinetic model(18). Radioiodine is also lost from each
compartment by radiological decay.
Fig. 2. Simplified iodine biokinetic model.
Fig. 3. Iodine-131 decay scheme (taken from Ref. 22).
Fig. 4. Absorbed fraction as a function of energy with the thyroid as both source and target (from
Ref. 24).
Fig. 5. Estimated probability distribution for the 131I S-factor with the thyroid as both source and
target (in units of Gy per nuclear transition).
Fig. 6. Estimated probability distribution for the 131I time-integrated activity in the thyroid.
Fig. 7. Estimated probability distribution for the 131I dose conversion factor.
Fig. 8. Statistical descriptors for distributional shape of the 131I dose conversion factor as a
function of correlation between thyroid mass and thyroid uptake fraction.

29
Table 1. Nuclear data and absorbed fractions for the transition of 131I with the thyroid as source
and target (adapted from Ref. 22).
______________________________________________________________________________
Yield Energy, Ei Ei per transition Absorbed Absorbed Ei
Radiations (Bq-1 s-1) (MeV) (MeV Bq-1 s-1) fraction (MeV Bq-1 s-1)
______________________________________________________________________________
β- 1 0.0210 0.06936 0.00146 1 0.00146
β- 2 0.00651 0.08694 0.000566 1 0.000566
β- 3 0.0727 0.09662 0.00702 1 0.00702
β- 4 0.899 0.1916 0.172 1 0.172
β- 6 0.00480 0.2832 0.00136 1 0.00136
γ 1 0.0262 0.08019 0.00210 0.0331 0.0000695
ce-K, γ 1 0.0354 0.04562 0.00161 1 0.00161
ce-L, γ 1 0.00464 0.07473 0.000347 1 0.000347
γ 3 0.00270 0.1772 0.000478 0.0283 0.0000135
γ 6 0.0614 0.2843 0.0175 0.0314 0.000548
ce-K, γ 6 0.00252 0.2497 0.000629 1 0.000629
γ 11 0.00274 0.3258 0.000893 0.0312 0.0000279
γ 13 0.817 0.3645 0.298 0.0310 0.00924
ce-K, γ 13 0.0155 0.3299 0.00511 1 0.00511
ce-L, γ 13 0.00246 0.3590 0.000883 1 0.000883
γ 16 0.00360 0.5030 0.00181 0.0319 0.0000577
γ 17 0.0717 0.6370 0.0457 0.0310 0.00142
γ 18 0.00217 0.6427 0.00139 0.0310 0.0000432
γ 19 0.0177 0.7229 0.0128 0.0306 0.000392
Kα1 X-ray 0.0256 0.02978 0.000762 0.1515 0.000115
Kα2 X-ray 0.0138 0.02946 0.000407 0.1551 0.0000631
Omitted β, ce and Auger radiations 0.00132 1 0.00132
Omitted X-ray and γ radiations 0.00114 <1 <0.00114
SUM 0.574 0.204
______________________________________________________________________________

30

31
Table 2. Input parameter distributions.
______________________________________________________________________________
Symbol Parameter Distribution(a) Reference(s)
______________________________________________________________________________
MT Thyroid mass LN (0.01778; 1.47) 20
f1 Fractional absorption T (0.9; 1.0; 1.0) 11,12,13
fblt Uptake fraction LN (0.267; 1.47) 11,14
fbbl Body-blood transfer T (0.823; 0.914; 1.000) 11
T1/2131I Radiological half-life T (8.0127; 8.0207; 8.0287) 17
kT Thyroid loss constant T (67.8; 113; 158) 11
kb Body loss constant T (9.6; 12; 14.4) 11
kblt Blood loss constant T (0.0025; 0.25; 0.4975) 11
∆i Radiation yield see Table 2 -
Ei Energy per transition see Table 2 -
φi Absorbed fraction see Figure 4 -
______________________________________________________________________________(a)LN = lognormal (GM; GSD); T = triangular (minimum value; mode; maximum value)

32
Table 3. Sensitivity analysis results for the time-integrated thyroid activity.
______________________________________________________________________________
Rank Contribution to
Parameter Symbol Correlation Variance (%)(a)
______________________________________________________________________________
Uptake fraction fblt 1.00 95.7
Body loss constant kb -0.08 0.6
Radiological half-life T1/2 0.04 0.1
Absorption fraction f1 0.03 0.1
Fraction body-to-blood fbbl 0.03 0.1
Blood loss constant kbl 0.00 0.0
Thyroid loss constant kt 0.00 0.0
______________________________________________________________________________(a)the remainder of the variance corresponds to the correlations with radiation yield and average energy.

33
Table 4. Sensitivity analysis results for the 131I dose conversion factor model.
______________________________________________________________________________
Rank Contribution to
Parameter Symbol Correlation Variance (%)(a)
______________________________________________________________________________
Thyroid mass MT -0.21 30.1
Uptake fraction fblt 0.21 30.3
Absorption fraction f1 0.13 6.5
Thyroid loss constant kt 0.08 2.2
Radiological half-life T1/2 -0.02 0.9
Blood loss constant kbl 0.02 0.3
Fraction body-to-blood fbbl -0.02 0.1
Body loss constant kb 0.00 0.0
______________________________________________________________________________(a)the remainder of the variance corresponds to the correlations with radiation yield and average energy.