
Uncertainty, Currency Excess Returns, and Risk Reversals · Uncertainty, Currency Excess Returns,...
36
K.7 Uncertainty, Currency Excess Returns, and Risk Reversals Husted, Lucas, John Rogers, and Bo Sun International Finance Discussion Papers Board of Governors of the Federal Reserve System Number 1196 February 2017 Please cite paper as: Husted, Lucas, John Rogers and Bo Sun (2017). Uncertainty, Currency Excess Returns, and Risk Reversals. International Finance Discussion Papers 1196. https://doi.org/10.17016/IFDP.2017.1196
Transcript of Uncertainty, Currency Excess Returns, and Risk Reversals · Uncertainty, Currency Excess Returns,...

K.7
Uncertainty, Currency Excess Returns, and Risk Reversals Husted, Lucas, John Rogers, and Bo Sun
International Finance Discussion Papers Board of Governors of the Federal Reserve System
Number 1196 February 2017
Please cite paper as: Husted, Lucas, John Rogers and Bo Sun (2017). Uncertainty, Currency Excess Returns, and Risk Reversals. International Finance Discussion Papers 1196.
https://doi.org/10.17016/IFDP.2017.1196

Board of Governors of the Federal Reserve System
International Finance Discussion Papers
Number 1196
February 2017
Uncertainty, Currency Excess Returns, and Risk Reversals
Lucas Husted, John Rogers, and Bo Sun
NOTE: International Finance Discussion Papers are preliminary materials circulated to stimulate discussion and critical comment. References to International Finance Discussion Papers (other than an acknowledgment that the writer has had access to unpublished material) should be cleared with the author or authors. Recent IFDPs are available on the Web at www.federalreserve.gov/pubs/ifdp/. This paper can be downloaded without charge from the Social Science Research Network electronic library at www.ssrn.com.

Un ertainty, Curren y Ex ess Returns, and
Risk Reversals
�
Lu as Husted
Federal Reserve Board
John Rogers
Federal Reserve Board
Bo Sun
Federal Reserve Board
�
We thank Mar elo O hoa for sharing his data and Matteo Ia oviello, Illenin Kondo, Mar elo O hoa,
Jonathan Wright, and seminar parti ipants at the JIMF workshop on \Impa t of un ertainty sho ks on
the global e onomy" for helpful omments. We also thank Qian Li for ex ellent resear h assistan e. The
views expressed here are solely our own and should not be interpreted as re e ting the views of the Board
of Governors of the Federal Reserve System or of any other person asso iated with the Federal Reserve
System.
1

Un ertainty, Curren y Ex ess Returns, and
Risk Reversals
Abstra t
In this paper we provide strong eviden e that heightened un ertainty in the U.S. real
e onomy or �nan ial markets signi� antly raises ex ess returns to the urren y arry trade.
We posit that this works through the in uen e of un ertainty on global investors' risk
preferen es. Ma ro and �nan ial un ertainty also lower foreign ex hange risk reversals, an
e�e t that is parti ularly strong for high interest rate portfolios. Our results are onsistent
with the idea that an in rease in un ertainty regarding the U.S. e onomy or �nan ial
markets in reases investors' risk aversion, whi h in turn drives up the expe ted returns
and the ost of prote tion against rash risk in the FX market.
Keywords: Exchange rates, uncovered interest parity, uncertainty
JEL Classification: F41
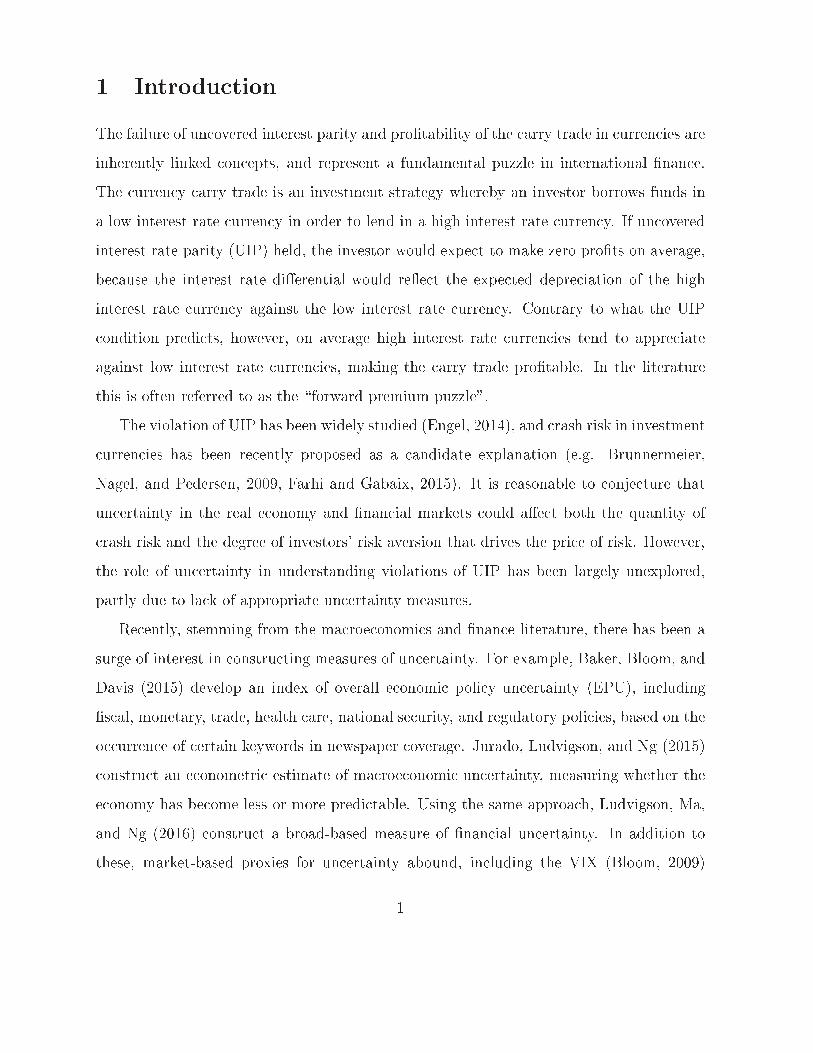
1 Introdu tion
The failure of un overed interest parity and pro�tability of the arry trade in urren ies are
inherently linked on epts, and represent a fundamental puzzle in international �nan e.
The urren y arry trade is an investment strategy whereby an investor borrows funds in
a low interest rate urren y in order to lend in a high interest rate urren y. If un overed
interest rate parity (UIP) held, the investor would expe t to make zero pro�ts on average,
be ause the interest rate di�erential would re e t the expe ted depre iation of the high
interest rate urren y against the low interest rate urren y. Contrary to what the UIP
ondition predi ts, however, on average high interest rate urren ies tend to appre iate
against low interest rate urren ies, making the arry trade pro�table. In the literature
this is often referred to as the \forward premium puzzle".
The violation of UIP has been widely studied (Engel, 2014), and rash risk in investment
urren ies has been re ently proposed as a andidate explanation (e.g. Brunnermeier,
Nagel, and Pedersen, 2009, Farhi and Gabaix, 2015). It is reasonable to onje ture that
un ertainty in the real e onomy and �nan ial markets ould a�e t both the quantity of
rash risk and the degree of investors' risk aversion that drives the pri e of risk. However,
the role of un ertainty in understanding violations of UIP has been largely unexplored,
partly due to la k of appropriate un ertainty measures.
Re ently, stemming from the ma roe onomi s and �nan e literature, there has been a
surge of interest in onstru ting measures of un ertainty. For example, Baker, Bloom, and
Davis (2015) develop an index of overall e onomi poli y un ertainty (EPU), in luding
�s al, monetary, trade, health are, national se urity, and regulatory poli ies, based on the
o urren e of ertain keywords in newspaper overage. Jurado, Ludvigson, and Ng (2015)
onstru t an e onometri estimate of ma roe onomi un ertainty, measuring whether the
e onomy has be ome less or more predi table. Using the same approa h, Ludvigson, Ma,
and Ng (2016) onstru t a broad-based measure of �nan ial un ertainty. In addition to
these, market-based proxies for un ertainty abound, in luding the VIX (Bloom, 2009)
1

and implied volatility measures derived from interest rate swaptions (Carlston and O hoa,
2016). Husted, Rogers, and Sun (2016) onstru t a news-based measure of monetary poli y
un ertainty that has several appealing features, in luding its similarity to survey-based
un ertainty measures and its attenuation from enhan ed Fed ommuni ation strategy.
In this paper we use several of these re ently-developed measures of un ertainty to in-
vestigate their role in explaining arry trade ex ess returns. We onje ture that in reased
un ertainty in the U.S. e onomy and �nan ial markets an in rease investors' risk aver-
sion, whi h in turn requires higher arry trade payo�s to ompensate investors for bearing
urren y risk. This idea is onsistent with our �ndings that our measure of urren y arry
trade returns are positively asso iated with ma roe onomi un ertainty and �nan ial un-
ertainty. In addition, we �nd that risk reversals on these same portfolios are negatively
asso iated with ma roe onomi and �nan ial un ertainty. As the pri e of the risk reversal
is negative (positive) if the risk-neutral distribution of the ex hange rate is negatively (posi-
tively) skewed, our pattern suggests that investors are willing to pay a higher ost of buying
prote tion on urren y positions against rashes in response to heightened ma roe onomi
and �nan ial un ertainty in the United States.
Given the lose link between urren y markets and monetary poli y, we also examine
whether U.S. monetary poli y un ertainty a�e ts arry trade ex ess returns. We expe t
an in rease in monetary poli y un ertainty to raise ex ess returns, as un ertainty in reases
investors' expe tation of future ex hange rate volatility, thus in reasing the per eived risk-
iness of their short position in the dollar. Combined with the e�e t that any form of
un ertainty an have on investors' risk aversion, we also expe t the risk reversal to de line
in monetary poli y un ertainty. Using measures of monetary poli y un ertainty available
in the literature, we �nd some eviden e that U.S. monetary poli y un ertainty raises re-
turns to the arry trade and makes risk reversals more negative. Furthermore, we on�rm
�ndings in the literature that TED spreads, whi h measure liquidity funding onstraints,
are positively linked to ex ess returns, even after ontrolling for un ertainty. This pattern
2

is onsistent with models that highlight the role of investors' funding onstraints, in whi h
TED spreads lead to tighter funding liquidity, for ing unwinding of arry trade positions,
thus making the returns higher going forward (Gabaix and Maggiori, 2015).
1
The vast literature on UIP violations fo uses on mean returns. Ba hetta and van
Win oop (2007) attribute the failure of UIP to infrequent revisions of investor portfolio
de isions. There is a substantive debate about whether arry trades are exposed to risk
fa tors. Burnside, Ei henbaum, Klesh helski and Rebelo (2011) argue that they are not,
but many others �nd exposures to a variety of risk fa tors. For example, Lustig and
Verdelhan (2007) argue that the returns on urren ies with high interest rates have greater
loadings on onsumption growth risk. Ra�erty (2012) relates arry trade returns to a
skewness risk fa tor in urren y markets. Dobrynskaya (2014) and Lettau, Maggiori, and
Weber (2014) argue that large average returns to high interest rate urren ies are explained
by their high onditional exposures to the market return in the down state. Jurek (2014)
demonstrates that the return to selling puts, whi h has severe downside risk, explains arry
trade pro�tability. Bakshi and Panayotov (2013) in lude ommodity returns as well as
foreign ex hange volatility and liquidity in their risk fa tors. Menkho�, Sarno, S hmeling
and S hrimpf (2012) �nd that the large average arry trade payo�s are ompensation
for exposure to global FX volatility risk. Christiansen, Ranaldo, and Soderlind (2011)
further show that the level of FX volatility also a�e ts the risk exposure of arry trade
returns to sto k and bond markets. Finally, Brunnermeier, Nagel, and Pedersen (2009)
do ument that returns to arry trades have negative skewness and suggest that arry trade
spe ulators fa e funding liquidity onstraints. Relatedly, Farhi and Gabaix (2015) propose
the possibility of rare but extreme disasters as an important determinant of risk premia in
asset markets. Burnside (2012) provides a review of the literature.
Our analysis is also related to the re ent papers that examine the impli ations of
1
TED spread is the di�eren e between the interest rates on interbank loans and on short-term U.S.
government debt (\T-bills"). TED is an a ronym formed from T-Bill and ED, the ti ker symbol for the
Eurodollar futures ontra t.
3

monetary poli y for urren y ex ess returns. Alvarez, Atkeson, and Kehoe (2009) build
a general equilibrium monetary model to exposit a me hanism through whi h monetary
poli y a�e ts asset market segmentation, whi h in turn a�e ts risk premia in the urren y
market. Ba kus, Gavazzoni, Telmer and Zin (2010) model the role of monetary poli y
for ex hange rates using Taylor representations. Benigno, Benigno, and Salvatore (2012)
present empiri al eviden e that following an in rease in monetary poli y un ertainty, the
dollar ex hange rate appre iates in the medium run. Rogers, S otti, and Wright (2016)
assess the relationship between monetary poli y, foreign ex hange risk premia and term
premia at the zero lower bound, and �nd that identi�ed U.S. monetary poli y sho ks have
a signi� ant e�e t on premia. Mueller, Tahbaz-Salehi, and Vedolin (2016) �nd signi� antly
larger ex ess returns on days with s heduled Federal Open Market Committee (FOMC)
announ ements, that these ex ess returns are higher for urren ies with higher forward
premia vis-�a-vis the U.S., and that monetary poli y un ertainty has a large e�e t on
FOMC day ex ess returns. Our analysis di�ers from theirs in that we use more broad and
ontinuous measures of monetary poli y un ertainty, we also look at all days and not only
s heduled FOMC meeting days, and we �nd that TED spreads have signi� antly larger
e�e ts on FOMC day ex ess returns than monetary poli y un ertainty has.
The rest of the paper is organized as follows. In Se tion 2 we des ribe the data and
empiri al properties of returns to the arry trade and risk reversals. In Se tion 3, we dis uss
the e�e ts of ma roe onomi and �nan ial un ertainty. In se tion 4, we analyze the e�e ts
of monetary poli y un ertainty. Se tion 5 provides a dis ussion of the impli ations of
un onventional monetary poli y and s heduled FOMC announ ements. A �nal se tion
on ludes.
2 Data and Summary Statisti s
We use daily data on spot ex hange rates and 3-month Treasury bill yields for the United
States and the following 20 ountries: Australia, Belgium, Brazil, Canada, Fran e, Ger-
4

many, Hungary, India, Israel, Italy, Japan, Mexi o, the Netherlands, Norway, New Zealand,
South Afri a, Sweden, Switzerland, Thailand, and the United Kingdom. All data omes
from Bloomberg and Haver. We use the NY 4 p.m. losing quotes. For most urren ies,
the beginning of the sample is April 2002 and the end of the sample is De ember 2015,
thus overing the entire ZLB period in the United States.
We denote the logarithm of the nominal ex hange rate (foreign urren y per dollar) by
s
t
, the U.S. interest rate by i
t
, and the foreign interest rate i
�
t
. For arry trade portfolio
returns, we follow Lustig and Verdelhan (2007), Brunnermeier et al. (2009), and Burnside
et al. (2011) among others, and onstru t portfolios that are long foreign bonds on the basis
of the foreign less U.S. 3-month interest rate di�erential. In parti ular, we onstru t �ve
portfolios sorted in in reasing order of the interest di�erential.
2
The �rst onsists of the
four lowest interest rate ountries, the se ond portfolio for the next four lowest interest rate
urren ies, and so on. Portfolios are rebalan ed every quarter (65 business days) in a way
that maintains the as ending order of interest di�erentials throughout the sample period.
We al ulate daily ex ess returns, in dollars, over orresponding-maturity U.S. interest
rates on these portfolios. We then ompute and use in our analysis the un onditional
mean of the ex ess returns, by portfolio at monthly frequen y.
Figure 1 shows the per entage of time a ountry spends in ea h portfolio. Some oun-
tries, like Switzerland and Brazil, lie at the extreme of being almost all of the sample in
one portfolio (1 and 5, respe tively), but in general ountries shift between portfolios often.
Generi ally, denote the return on an investment in the foreign urren y �nan ed by
2
Verdelhan (2015) introdu es an alternative, \dollar-neutral" measure of arry trade, whi h de�nes the
arry trade as going long $1 in the equally weighted portfolio of risky ountries and going short $1 in the
equally weighted portfolio of safe ountries. He separates a \dollar fa tor" and a \ arry fa tor" in the
ross-se tion of urren y ex ess returns, where the dollar fa tor is the average ex hange rate expressed in
dollars and the arry fa tor is the average ex hange rate of high- versus low- interest rate urren ies. He
�nds that the dollar fa tor is a onsiderably more important driver of movements in the urren y market.
With our fo us on the U.S. un ertainties, we instead study portfolios that are short in dollars and long
foreign urren ies, as in Lustig and Verdelhan (2007), Brunnermeier et al. (2009), and Burnside et al.
(2011) among others.
5

borrowing in the domesti urren y by
z
t+1
� (i
�
t
� i
t
) + �s
t+1
;
where �s
t+1
� s
t+1
� s
t
is the depre iation of the home urren y. It is a measure of
ex hange rate return in ex ess of the predi tion by un overed interest parity be ause under
UIP, E[z
t+1
℄ = 0 should hold.
More spe i� ally tailored to our daily data set, denote the pri e of an m-year zero
oupon bond with fa e value F , as Fexp(�i
t
m), and al ulate the \Hold One Quarter"
(HOQ) ex ess returns over orresponding-maturity U.S. interest rates (daily) as
(m� 0:25)i
t+65
�mi
t
� [(m� 0:25)i
�
t+65
�mi
�
t
℄ + S
t+65
� s
t
:
With the three-month bill (m = 0:25) data that we use, the measure of ex ess returns for
ea h foreign ountry paired with the U.S. is thus,
0:25(i
�
t
� i
t
) + s
t+65
� s
t
:
We display the monthly time series of ex ess returns by portfolio in Figure 2. These
are annualized HOQ returns, in per ent, equally-weighted a ross the four urren ies in
the portfolio. Clearly, ex ess returns are large and volatile, and for all but portfolio 1
plummeted amid the onset of the global �nan ial risis in the se ond half of 2008.
We also use data for these same urren ies (averaged within portfolio) on 25� three-
month risk reversals. These are also daily, obtained from Bloomberg beginning in January
2005. A risk reversal is an options-implied measure of skewness in the foreign ex hange
market. It is the di�eren e between the implied volatility of an out-of-the-money foreign
urren y all option (against U.S. dollars) and the implied volatility of an out-of-the-
money put option. Buying a risk reversal provides insuran e against foreign urren y
appre iation, �nan ed by providing insuran e against foreign urren y depre iation, and
hen e is a measure of \ rash risk". If the ex hange rate is symmetri ally distributed under
the risk-neutral measure, then the pri e of the risk-reversal is zero sin e the value of being
6

long the all exa tly o�sets the value of being short the put. On the other hand, if the
risk-neutral distribution of the ex hange rate is negatively (positively) skewed, the pri e
of the risk-reversal is negative (positive). Hen e, the risk reversal measures the ombined
e�e ts of expe ted skewness and a skewness risk premium.
For illustration, we display in Figure 3 the daily three-month ahead dollar-pound risk
reversal. For this �gure, the sample in ludes the June 23, 2016 referendum on Brexit.
Noti e the very sharp de line on Mar h 23, the �rst day that investors ould use this
instrument to insure against a rash in the pound following the vote. As the vote and
onsequent rash in the pound itself materialized, less money was put into insuring against
further rashes: the risk reversal reversed dire tion.
As noted above, we are interested in investigating the e�e t of un ertainty on ex ess
returns and risk reversals. We use �ve di�erent measures: U.S. ma roe onomi un er-
tainty, U.S. �nan ial un ertainty, and three di�erent proxies for U.S. monetary poli y
un ertainty. These are displayed in Figure 4. To proxy for ma roe onomi un ertainty
and �nan ial un ertainty, we use the monthly e onometri estimate of un ertainty (one
year ahead) onstru ted in Jurado, Ludvigson, and Ng (2015) and Ludvigson, Ma, and
Ng (2016), respe tively. We use three measures of monetary poli y un ertainty: (1) the
implied volatility of options on swap rates onstru ted in Carlston and O hoa (2016), (2)
the newspaper-based monetary-poli y subindex of E onomi Poli y Un ertainty in Baker,
Bloom, and Davis (2015), whi h we denote MPU-BBD, and (3) a re�ned newspaper-based
monetary poli y index in Husted, Rogers, and Sun (2016), denoted MPU-HRS.
3
Table 1 presents summary statisti s for ex ess returns and risk reversals, by portfolio.
We depi t the monthly mean returns in pre-ZLB (Apr 2002-Jun 2008) and ZLB (Jan 2009-
3
Comparisons of these measures are dis ussed in Husted, Rogers, and Sun (2016). As noted there,
the swaptions measure essentially re e ts un ertainty about the Fed Funds interest rate. Furthermore,
MPU-HRS is mu h more narrowly-fo used on the Federal Reserve than is MPU-BBD. Compared to the
estimation-based measures of ma ro and �nan ial un ertainty, the monetary poli y un ertainty measures
are onsiderably less smooth. We return to examine the inter-relatedness of all �ve un ertainty measures
below.
7

De 2015) sub-periods, respe tively. We omit the latter half of 2008 from these al ulations
so that we an hara terize the data apart from the unusually large movements depi ted in
Figure 2. We observe in Table 1 a pattern in the pre-ZLB data that e hoes �ndings in the
literature: a general rise in the mean return as we move from the low to high interest rate
urren ies. However, su h a pattern is not so evident during the ZLB period. Table 1 also
illustrates that portfolio ex ess returns de lined onsiderably during the ZLB period. In
addition, risk reversals be ome onsiderably more negative during the ZLB, indi ating that
investors were willing to pay a higher ost for insuran e against rashes in the urren y
market then. These summary statisti s motivate us to study both the full sample and the
ZLB sub-period in what follows.
Table 2 reports the orrelations between, alternatively, ex ess returns (ER) and risk
reversals (RR) and ea h of our un ertainty measures. We report these orrelations by port-
folio and separately for the pre-ZLB and ZLB sub-periods. Ex ess returns and un ertainty
are almost always positively orrelated: greater un ertainty is typi ally asso iated with
larger payo�s to the arry trade. The two ex eptions to this pattern are the small, neg-
ative orrelations between ER and (1) ma ro un ertainty during the pre-ZLB sub-period
and (2) MPU-HRS during the ZLB period. Examining the rows labelled RR, we see that
risk reversals are negatively orrelated with un ertainty, an e�e t that is espe ially large for
the high-interest-rate portfolios. We also note that in all ases these negative orrelations
be ame smaller in magnitude (less negative) during the ZLB.
The summary statisti s point to a lear relationship between un ertainty and urren y
ex ess returns. One might wonder, however, whether this is driven by fundamental di�er-
en es a ross portfolios that lead to di�eren es in both their interest rate and their urren y
risk. To ontrol for portfolio-spe i� e�e ts, our analysis to follow in ludes time-series ev-
iden e with portfolio �xed e�e ts.
8

3 Finan ial un ertainty and ma ro un ertainty
We �rst analyze whether and how U.S. �nan ial un ertainty (Ludvigson, Ma, and Ng
(2016)) and ma roe onomi un ertainty (Jurado, Ludvigson, and Ng (2015)) a�e t ur-
ren y ex ess returns. Exposure to un ertainty (imperfe t knowledge of the state) has
been shown to in rease individuals' risk aversion (e.g., Mengel, Tsakas, and Vostroknutov,
2016). Heightened un ertainty in the U.S. real e onomy or �nan ial markets an thus
a�e t global investors' risk preferen es, whi h in turn, has an e�e t on arry trade payo�s.
In this se tion, we analyze the e�e t of U.S. �nan ial and ma roe onomi un ertainty over
the full sample.
In Table 3 we present monthly regressions of HOQ ex ess returns on U.S. �nan ial
un ertainty, the interest rate di�erential (foreign less U.S.), TED spread, and monthly
risis dummies that equal 1 for July-De ember 2008 and zero otherwise,
HOQ
t+1
= b
0
+ b
1
� �nan ial un ertainty
t
+ b
2
� TED
t
+ b
3
(i
�
t
i
t
) + d � risis + �:
We ontrol for the interest rate di�erential be ause of its well-established (positive)
relationship with ex ess returns, and in lude the dummies be ause of the sharp drop in
ER in the latter half of 2008 (Figure 2). We display results by portfolio in olumns (1)-(5)
of the table and for the panel regression with portfolio �xed e�e ts in olumn (6). We
are thus examining within-portfolio time variation. We hypothesize that b
1
and b
2
, the
oeÆ ients on �nan ial un ertainty
t
and TED
t
, will be positive.
The results onsistently show that �nan ial un ertainty raises arry trade ex ess re-
turns. This suggests that un ertainty arising in the U.S. �nan ial market leads global
investors to demand a higher premium for their urren y positions. The positive and sig-
ni� ant estimates on TED
t
indi ate that tightened funding liquidity for es redu tions in
arry trade positions and leads to higher ex ess returns going forward.
Ex ess returns to the arry trade have been rationalized as ompensation for rash risk
in the urren y market (Brunnermeier et al., 2009). In Table 4, we examine the relationship
9
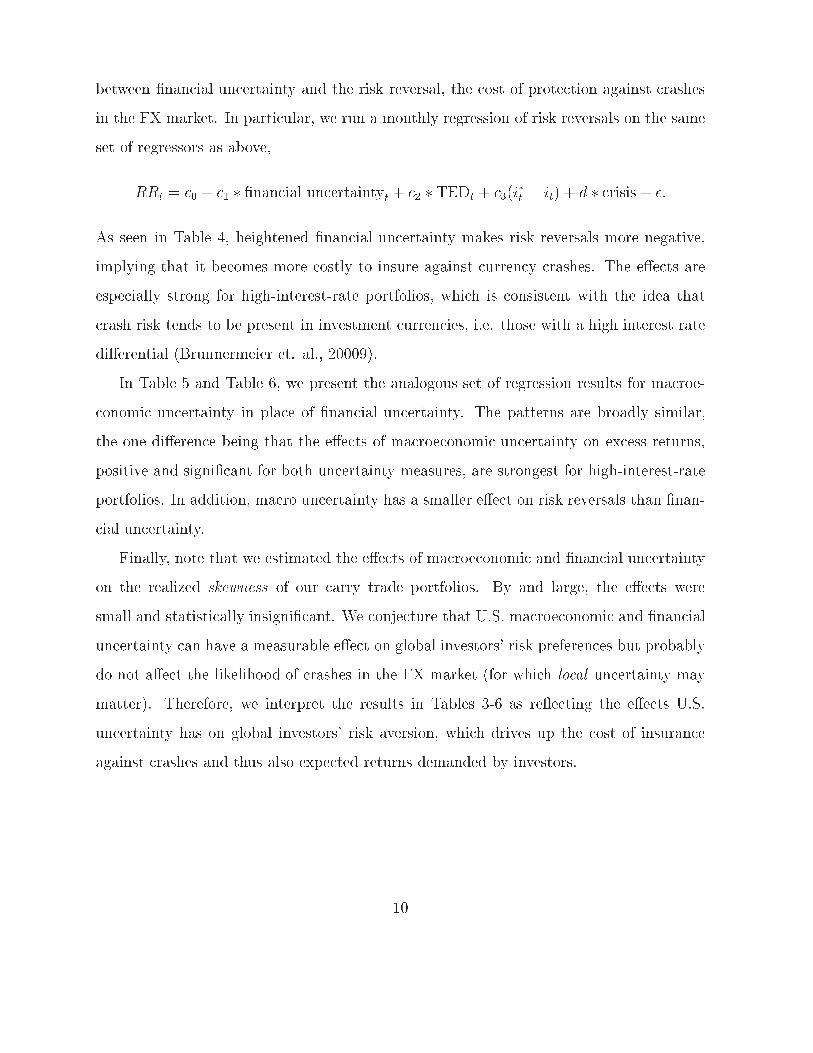
between �nan ial un ertainty and the risk reversal, the ost of prote tion against rashes
in the FX market. In parti ular, we run a monthly regression of risk reversals on the same
set of regressors as above,
RR
t
=
0
+
1
� �nan ial un ertainty
t
+
2
� TED
t
+
3
(i
�
t
� i
t
) + d � risis + �:
As seen in Table 4, heightened �nan ial un ertainty makes risk reversals more negative,
implying that it be omes more ostly to insure against urren y rashes. The e�e ts are
espe ially strong for high-interest-rate portfolios, whi h is onsistent with the idea that
rash risk tends to be present in investment urren ies, i.e. those with a high interest rate
di�erential (Brunnermeier et. al., 20009).
In Table 5 and Table 6, we present the analogous set of regression results for ma roe-
onomi un ertainty in pla e of �nan ial un ertainty. The patterns are broadly similar,
the one di�eren e being that the e�e ts of ma roe onomi un ertainty on ex ess returns,
positive and signi� ant for both un ertainty measures, are strongest for high-interest-rate
portfolios. In addition, ma ro un ertainty has a smaller e�e t on risk reversals than �nan-
ial un ertainty.
Finally, note that we estimated the e�e ts of ma roe onomi and �nan ial un ertainty
on the realized skewness of our arry trade portfolios. By and large, the e�e ts were
small and statisti ally insigni� ant. We onje ture that U.S. ma roe onomi and �nan ial
un ertainty an have a measurable e�e t on global investors' risk preferen es but probably
do not a�e t the likelihood of rashes in the FX market (for whi h lo al un ertainty may
matter). Therefore, we interpret the results in Tables 3-6 as re e ting the e�e ts U.S.
un ertainty has on global investors' risk aversion, whi h drives up the ost of insuran e
against rashes and thus also expe ted returns demanded by investors.
10

4 Monetary poli y un ertainty
Given the lose link between urren y markets and monetary poli y, we ontinue our
investigation by exploring the role of U.S. monetary poli y un ertainty. Su h measures
are more narrowly fo used than our two measures from the previous se tion. We expe t
an in rease in monetary poli y un ertainty to raise urren y ex ess returns, as un ertainty
about investors' urren y demand or interest rates in reases investors' expe tation of future
ex hange rate volatility, thus in reasing the per eived riskiness of their short position in
the dollar (Mueller, Tahbaz-Salehi, and Vedolin, 2016).
We �rst use the monetary poli y subindex of E onomi Poli y Un ertainty onstru ted
in Baker, Bloom, and Davis (2015), denoted MPU-BBD. Table 7 shows the results of
regressions analogous to those above, but now with MPU-BBD on the right-hand side. The
estimates show that arry returns in rease in monetary poli y un ertainty, onsistently
a ross portfolios, supporting the notion that monetary un ertainty raises the per eived
riskiness in traders' urren y positions and hen e requiring a higher payo�. TED spreads
are on e again positive and signi� ant.
Table 8 reports the results from regressions of risk reversals on MPU-BBD with the
same set of ontrol variables. Monetary poli y un ertainty onsistently makes risk reversals
more negative, indi ating a larger ost of buying prote tion on a urren y position to insure
against rashes. The e�e ts are parti ularly strong for the portfolios with high interest rate
di�erentials, for whi h we have shown that rash risk in the urren y market is espe ially
large. We again interpret this pattern as U.S. monetary poli y un ertainty potentially
a�e ting investors' risk preferen es, whi h raises the pri e investors are willing to pay for
prote tion against rashes.
We next use the market-based measure of monetary poli y un ertainty, the implied
volatility of options on swap rates (swaptions), from Carlston and O hoa (2016). The
results are very similar to those obtained using MPU-BBD for ex ess returns (Table 9),
but are found to have mostly a positive sign in the risk reversals regressions (Table 10).
11

Finally, we use the newspaper-based index of monetary poli y un ertainty onstru ted
in Husted, Rogers, and Sun (2016). Although the e�e ts of MPU-HRS on risk reversals
are mostly negative and signi� ant, just as we found with most of our other un ertainty
measures, its e�e ts on arry trade ex ess returns are insigni� ant (Table 11 and 12).
4
The results of this se tion suggest that the proxy for monetary poli y un ertainty
matters signi� antly. A loser examination of MPU-HRS reveals that, for example, it
aptures a broad notion of U.S. monetary poli y un ertainty that in orporates un ertainty
regarding the timing and path of poli y rate normalization, as highlighted by elevated
values during the ZLB when the market-based measures stayed extremely low (Figure 4).
This suggests that the latter are primarily measures of un ertainty over the poli y interest
rate (Husted, Rogers, and Sun (2016)). MPU-HRS also di�ers from MPU-BBD, in ways
we dis uss in detail below.
To illustrate the divergen e that exists among di�erent measures of U.S. monetary
poli y un ertainty, we report in Table 13 the orrelations among all of our un ertainty
measures. Correlations among the monetary poli y un ertainty measures are quite low.
The orrelation between MPU-HRS and the implied volatility of swaptions is negative
during the ZLB. As argued above, this re e ts that there is additional information in
MPU-HRS beyond un ertainty about the poli y interest rate. In addition, note that the
orrelation between MPU-HRS and MPU-BBD dropped from .74 to .29 from the pre-ZLB
subperiod to the ZLB period. We onje ture that low orrelations here are partially driven
by the mention of foreign entral banks su h as ECB, Bank of Japan, and Bank of England
in the onstru tion of MPU-BBD, whi h an in turn in uen e their respe tive asso iation
with FX market movements.
To push on this last point, we note the non-trivial di�eren es in the keyword sear hes.
As explained in Husted, Rogers, and Sun (2016), MPU-HRS is onstru ted by sear hing
4
As above, we analyze only the earlier notion of arry trade (Lustig-Verdelhan, Burnside et. al.,
Brunnermeier et. al.), leaving analysis of the arry fa tor and dollar fa tor (Verdelhan (2015) in driving
our results to future resear h.
12

for arti les ontaining the triple of (i) \un ertainty" or \un ertain," AND (ii) \monetary
poli y(ies)" or \interest rate(s)" or \Federal fund(s) rate" or \Fed fund(s) rate," AND (iii)
\Federal Reserve" or \the Fed" or \Federal Open Market Committee" or \FOMC". This
is a narrow keyword sear h ompared to that of BBD, who sear h for: (i) \un ertainty" or
\un ertain") AND (2) \e onomy" or \e onomi ") AND (3) \ ongress" or \legislation" or
\white house" or \regulation" or \federal reserve" or \de� it") AND (4) \federal reserve"
or \the fed" or \money supply" or \open market operations" or \quantitative easing"
or \monetary poli y" or \fed funds rate" or \overnight lending rate" or \Bernanke" or
\Volker" or \Greenspan" or \ entral bank" or \interest rates" or \fed hairman" or \fed
hair" or \lender of last resort" or \dis ount window" or \European Central Bank" or
\ECB" or \Bank of England" or \Bank of Japan" or \BOJ" or \Bank of China" or
\Bundesbank" or \Bank of Fran e" or \Bank of Italy". A ounting for the e�e ts of these
keyword sear h di�eren es warrants further examination.
5 The ZLB and FOMC meeting days
5.1 E�e ts of un ertainty during the ZLB
It is reasonable to question at a on eptual level the role of monetary poli y un ertainty
in explaining arry trade returns when the U.S. poli y rate is at the zero lower bound (for
very re ent work on UIP, monetary poli y, and the ZLB, see Chinn and Zhang (2015)).
The summary statisti s of Table 1 and simple orrelation analysis of Tables 2 and 13 gives
us aution that our regression results may be di�erent during the period of un onventional
monetary poli y. We examine this next.
We start with �nan ial and ma roe onomi un ertainty. The results, reported in Table
A1-A4 of the Appendix, are broadly similar to the full-sample results in that both measures
tend to raise arry trade ex ess returns, and make risk reversals more negative for the high
interest rate portfolios. However, judging from the statisti al and e onomi signi� an e,
13

the e�e ts are smaller during ZLB ompared to the full-sample. For our monetary poli y
un ertainty measures, we report regression results for the ZLB period in Table A5-A10 of
the on-line Appendix. The patterns are very similar to the full-sample results. Somewhat
to our surprise, regression results from the ZLB sub-period are thus not vastly di�erent
from the full-sample results (whi h in orporate dummies for the risis).
5.2 FOMC meeting days
We take a loser look at the e�e ts of monetary poli y un ertainty by examining arry
trade returns on regularly-s heduled Federal Open Market Committee meeting days. These
meetings have been the Federal Reserve's primary hannel to announ e its poli y de isions,
and the market may per eive in reased monetary poli y un ertainty prior to an up oming
FOMC meeting. Our sample is from April 2002 through De ember 2015, with 110 FOMC
meeting days and 3479 trading days with no s heduled FOMC meetings.
Table 14 displays the summary statisti s of ex ess returns and risk reversals and for the
two monetary poli y un ertainty measures for whi h daily data are available. We do this
separately on FOMC meeting days and non-FOMC days. The MPU-HRS index is indeed
onsiderably higher on FOMC meeting days, but swaption un ertainty is not. Ex ess
returns are also signi� antly higher on FOMC meeting days than on non-FOMC days,
while risk reversals are not. Thus, in this part of our analysis, we will fo us ex lusively on
ex ess returns.
We estimate the following regression:
H1D
t+1
= b
0
+ b
1
�mpu
t
+ b
2
�mpu * FOMC + b
3
� risis + �;
where monetary poli y un ertainty (generi ally denoted as mpu) is proxied by either MPU-
HRS or swaption implied volatility, FOMC is a dummy variable that equals 1 on FOMC
meeting days and 0 otherwise, and H1D is the ex ess return for holding an m-year bond
for only one day, whi h is expressed as
H1D
t
= (m� (1=260))i
t
�mi
t�1
� [(m� (1=260))i
�
t
�mi
�
t�1
℄ + s
t
� s
t�1
:
14

This is approximately the daily foreign bond return minus the daily U.S. bond return plus
the ex hange rate return �[m(i
�
t
� i
�
t�1
℄ + s
t
� s
t�1
. Sin e we onsider three-month bills
(m = 0:25), these returns are dominated by the ex hange rate return.
We present the results in Table 15. As indi ated in olumn (1), MPU-HRS does appear
to be signi� antly positively related to ex ess returns on FOMC meeting days. This is
onsistent with the �ndings in a ontemporaneous paper by Mueller, Tahbaz-Salehi, and
Vedolin (2016). They �nd that on days with s heduled FOMC announ ements arry
trade portfolios exhibit larger forward dis ounts, their proxy for ex ess returns, and that
greater monetary poli y un ertainty (proxied by \Treasury Implied Volatility", extra ted
from 30-year Treasury futures) leads to signi� antly higher ex ess returns. Upon further
inspe tion shown in olumn (3), however, we �nd lear eviden e that it is movements in
TED spreads that are driving ex ess returns on FOMC days. Monetary poli y un ertainty
has no signi� ant marginal e�e t. Using swaption implied volatility, a measure that is
loser to that of Mueller, Tahbaz-Salehi, and Vedolin than MPU-HRS, produ es the same
result: greater interest rate un ertainty on FOMC meeting days appears to lead to higher
ex ess returns ( olumn (2)), but on e we ontrol for the e�e t of TED spreads on FOMC
days, this result goes away ( olumn (4)). Consistently, our results indi ate that it is
liquidity funding onsiderations, rather than monetary poli y un ertainty or interest rate
un ertainty, that leads to greater ex ess returns on FOMC meeting days.
Finally, we note that these FOMC meeting day e�e ts are very short-lived. In estimates
not shown, we �nd that the positive e�e ts (of TED or MPU) on ex ess returns on FOMC
meeting days are almost entirely o�set the following day. In all ases, they are found to
be fully reversed by two days after the meeting.
6 Con lusion
We ontribute to the vast literature on UIP violations by examining the empiri al im-
portan e of un ertainty on urren y arry trade ex ess returns. We show strong eviden e
15

that heightened un ertainty in the U.S. real e onomy or �nan ial markets signi� antly
raises ex ess returns. We posit that this works through the in uen e of un ertainty on
global investors' risk preferen es, and we show supporting eviden e of this. Ma ro and
�nan ial un ertainty also lower the risk reversal, an e�e t that is parti ularly strong for
high-interest-rate portfolios. Our results are onsistent with the idea that an in rease in
un ertainty regarding the U.S. e onomy or �nan ial markets in reases investors' risk aver-
sion, whi h in turn, drives up the expe ted returns and the ost of prote tion against rash
risk in the FX market. We onsider this interpretation as broadly onsistent with the on-
ventional notion that U.S. un ertainty a�e ts the pri e of risk, as it a�e ts global investors'
risk aversion, while the quantity of risk{that is, the likelihood of rash{is on entrated in
investment urren ies (i.e., urren ies with high interest rate di�erentials) and perhaps is
more likely to be a�e ted by lo al un ertainties.
We also explore the role of monetary poli y un ertainty. In addition to the risk aversion
hannel, an in rease in monetary poli y un ertainty an in rease investors' expe tation of
interest rate volatility and thus the per eived riskiness of their urren y positions, raising
returns to arry trades. Consistent with this idea, we �nd that some measures of monetary
poli y un ertainty do indeed raise arry trade ex ess returns and lower the risk reversal.
However, we show that existing measures of monetary poli y un ertainty di�er signi� antly
in terms of what they re e t, in parti ular during the ZLB period when the orrelations
between all of our un ertainty measures fell noti eably. Thus, we do not un over an
unambiguously lear me hanism for how monetary poli y un ertainty operates through
the urren y market.
Referen es
[1℄ Alvarez, F., Atkeson, A., and P. J. Kehoe. 2009. \Time-varying Risk, Interest Rates,
and Ex hange Rates in General Equilibrium," The Review of E onomi Studies, 76,
851-878.
16

[2℄ Ba kus, D., F. Gavazzoni, C. Telmer, and S. E. Zin. 2010. \Monetary Poli y and the
Un overed Interest Parity Puzzle," NBER Working Paper no. 16218. Cambridge, MA:
National Bureau of E onomi Resear h, July.
[3℄ Baker, S. R., Bloom, N., and S. J. Davis 2015. \Measuring E onomi Poli y Un er-
tainty," Forth oming at Quarterly Journal of E onomi s.
[4℄ Ba hetta, P., and E. vanWin oop. 2007. \Infrequent Portfolio De isions: A Solution
to the Forward Dis ount Puzzle," Working paper, University of Lausanne.
[5℄ Bakshi, G. and G. Panayotov, 2013. \Predi tability of Curren y Carry Trades and
Asset Pri ing Impli ations," Journal of Finan ial E onomi s, 110, 139-163.
[6℄ Benigno, G., and P. Benigno. 2008. \Ex hange Rate Determination under Interest Rate
Rules." Journal of International Money and Finan e, 27:97193.
[7℄ Benigno, G., P. Benigno, and S. Nisti o. 2010. \Se ond-Order Approximation of Dy-
nami Models with Time-Varying Risk," NBER Working Paper no. 16633. Cambridge,
MA: National Bureau of E onomi Resear h, De ember.
[8℄ Brunnermeier, M. K., S. Nagel, and L. H. Pedersen. 2009. \Carry Trades and Cur-
ren y Crashes," Ed. Kenneth Rogo�, Mi hael Woodford, and Daron A emoglu. NBER
Ma roe onomi s Annual 23, 313-347.
[9℄ Burnside, C. 2011. \The Cross Se tion of Foreign Curren y Risk Premia and Consump-
tion Growth Risk: Comment," Ameri an E onomi Review, 111, 3456-76.
[10℄ Burnside, C. 2012. \Carry Trades and Risk," in Jessi a James, Ian W. Marsh, and
Lu io Sarno, eds. Handbook of Ex hange Rates, Hoboken, NJ: John Wiley and Sons.
[11℄ Burnside, C., M. Ei henbaum, I. Klesh helski, and S. Rebelo. 2011. \Do Peso Problems
Explain the Returns to the Carry Trade?" Review of Finan ial Studies, 24, 853-891.
17

[12℄ Carlston, C. and M. O hoa, 2016. "Ma roe onomi Announ ements and Investors
Beliefs at the Zero Lower Bound", Federal Reserve Board.
[13℄ Chinn, M. D. and Y. Zhang. (2015). \Un overed Interest Parity and Monetary Poli y
Near and Far from the Zero Lower Bound," (No. w21159). National Bureau of E onomi
Resear h.
[14℄ Christiansen, C., A. Ranaldo, and P. Soderlind, 2011. \The Time-varying System-
ati Risk of Carry Trade Strategies," Journal of Finan ial and Quantitative Analysis,
46,1107-1125.
[15℄ Dobrynskaya, V., 2014. \Downside Market Risk of Carry Trades," Review of Finan e,
24, 1-29.
[16℄ Engel, C., 2014. "Ex hange Rates and Interest Parity," Handbook of International
E onomi s.
[17℄ Farhi, E. and X. Gabaix, 2015. "Rare Disasters and Ex hange Rates", Quarterly
Journal of E onomi s, 131, 1-52.
[18℄ Gabaix, X., and M. Maggiori, 2015. "International Liquidity and Ex hange Rate
Dynami s", Quarterly Journal of E onomi s, 130, 1369-1420.
[19℄ Husted, L., Rogers, J., and B. Sun, 2016. "Measuring Monetary Poli y Un ertainty:
The Federal Reserve, January 1985 to January 2016," IFDP Note, Federal Reserve
Board.
[20℄ Jurado, K., S. Ludvigson, and S. Ng, 2015. \Measuring Un ertainty," Forth oming at
Ameri an E onomi Review.
[21℄ Jurek, J. W. 2014. \Crash-neutral Curren y Carry Trades," Journal of Finan ial
E onomi s, 113(3), 325-347.
18
[22℄ Lettau, M., Maggiori, M., and Weber, M, 2014. \Conditional Risk Premia in Curren y
Markets and Other Asset Classes," Journal of Finan ial E onomi s, 114(2), 197-225.
[23℄ Ludvigson S., S. Ma, and S. Ng, 2016. \Un ertainty and Business Cy les," Working
Paper, New York University and Columbia University.
[24℄ Lustig, H., and A. Verdelhan, 2007. \The Cross Se tion of Foreign Curren y Risk
Premia and US Consumption Growth Risk," Ameri an E onomi Review, 97, 1:89117.
[25℄ Mengel, F., Tsakas, E., Vostroknutov, A., 2016. \Past Experien e of Un ertainty
A�e ts Risk Aversion," Experimental E onomi s, 19(1), 151-176
[26℄ Menkho�, L., L. Sarno, M. S hmeling, and A. S hrimpf, 2012. \Carry Trades and
Global FX Volatility," Journal of Finan e, 67, 681-718.
[27℄ Mueller, P., Tahbaz-Salehi, A., and Vedolin, A. 2016. \Ex hange Rates and Monetary
Poli y Un ertainty," Columbia Business S hool Resear h Paper.
[28℄ Ra�erty, B. 2012. \Curren y Returns, Skewness and Crash Risk," Working Paper,
Duke University.
[29℄ Rogers, J. H., S otti, C., and J. H. Wright, 2014. \Evaluating Asset-Market E�e ts of
Un onventional Monetary Poli y: A Multi-Country Review," E onomi Poli y, 29(80),
749-799.
[30℄ Rogers, J. H., S otti, C., and J. H. Wright, 2016. \Un onventional Monetary Poli y
and International Risk Premia," International Finan e Dis ussion Paper, Board of
Governors of the Federal Reserve System.
[31℄ Verdelhan, A. 2015. \The Share of Systemati Variation in Bilateral Ex hange Rates,"
Journal of Finan e, forth oming.
19

Figure 1: Portfolio Allo ation by Country
0 20 40 60 80 100
Percentage
United Kingdom
Thailand
Switzerland
Sweden
South Africa
Norway
New Zealand
Netherlands
Mexico
Japan
Italy
Israel
India
Hungary
Germany
France
Canada
Brazil
Belgium
Australia
Portfolio 1 Portfolio 2 Portfolio 3 Portfolio 4 Portfolio 5
20

Figure 2: Carry Trade Portfolio Ex ess Returns
−100.00
−50.00
0.00
50.00
100.00
Perc
ent (
Annu
aliz
ed)
2004 2005 2006 2007 2008 2009 2010 2011 2012 2013 2014 2015 2016
Year
HOQ Returns (Portfolio 1) HOQ Returns (Portfolio 2) HOQ Returns (Portfolio 3)
HOQ Returns (Portfolio 4) HOQ Returns (Portfolio 5)
21

Figure 3: Dollar-Pound 3-month Risk Reversal, 2015-2016
Mar 23 Jun 23
−6
−5
−4
−3
−2
−1
0
Ris
k R
ever
sal
Sep Oct Nov Dec Jan Feb Mar Apr May Jun Jul
Month
22

Figure 4: Un ertainty Measures
0.90
0.95
1.00
1.05
1.10
1.15
Inde
x
2004 2005 2006 2007 2008 2009 2010 2011 2012 2013 2014 2015 2016
Year
Financial Uncertainty
0.85
0.90
0.95
1.00
1.05
1.10
1.15
Inde
x2004 2005 2006 2007 2008 2009 2010 2011 2012 2013 2014 2015 2016
Year
Macro Uncertainty
0
50
100
150
200
250
Inde
x
2004 2005 2006 2007 2008 2009 2010 2011 2012 2013 2014 2015 2016
Year
Swaption Uncertainty
0
50
100
150
200
250
Inde
x (A
vg =
100
)
2004 2005 2006 2007 2008 2009 2010 2011 2012 2013 2014 2015 2016
Year
MPU − BBD
0
50
100
150
200
250
300
Inde
x (A
vg =
100
)
2004 2005 2006 2007 2008 2009 2010 2011 2012 2013 2014 2015 2016
Year
MPU − HRS
23

List of Tables
1 Summary Statisti s by Portfolio, Quarterly Holding Period . . . . . . . . . 25
2 Correlation Between Un ertainty and Ex ess Return/Risk Reversal . . . . 25
3 Ex ess Returns and Finan ial Un ertainty, 2002m4 { 2015m12 . . . . . . . 26
4 Risk Reversals and Finan ial Un ertainty, 2005m11 { 2015m12 . . . . . . . 26
5 Ex ess Returns and Ma roe onomi Un ertainty, 2002m4 { 2015m12 . . . . 27
6 Risk Reversals and Ma roe onomi Un ertainty, 2005m11 { 2015m12 . . . 27
7 Ex ess Returns and MPU-BBD, 2002m4 { 2015m12 . . . . . . . . . . . . . 28
8 Risk Reversals and MPU-BBD, 2005m11 { 2015m12 . . . . . . . . . . . . . 28
9 Ex ess Returns and Swaption Un ertainty, 2002m4 { 2015m12 . . . . . . . 29
10 Risk Reversals and Swaption Un ertainty, 2005m11 { 2015m12 . . . . . . . 29
11 Ex ess Returns and MPU-HRS, 2002m4 { 2015m12 . . . . . . . . . . . . . 30
12 Risk Reversals and MPU-HRS, 2005m11 { 2015m12 . . . . . . . . . . . . . 30
13 Correlations Between Un ertainty Measures . . . . . . . . . . . . . . . . . 31
14 Summary Statisti s of Key Daily Measures By Portfolio . . . . . . . . . . . 31
15 Ex ess Returns, Daily Holding Period, 2002m4 { 2015m12 . . . . . . . . . 32
24
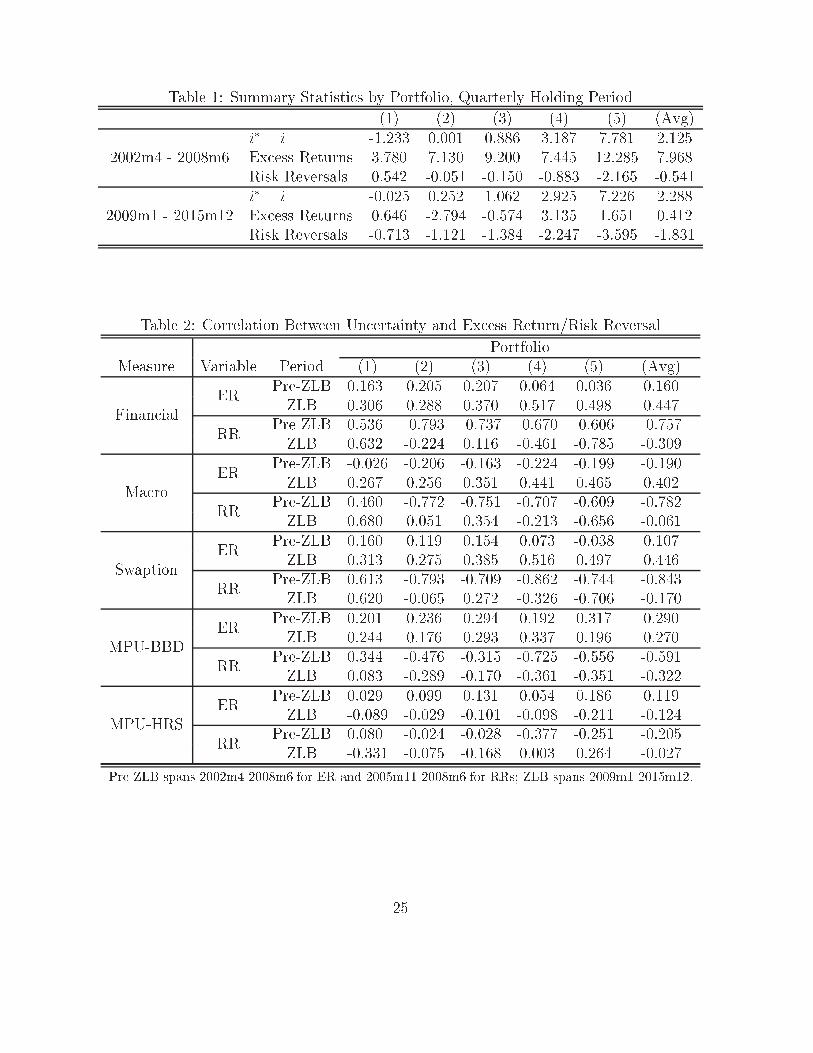
Table 1: Summary Statisti s by Portfolio, Quarterly Holding Period
(1) (2) (3) (4) (5) (Avg)
i
�
� i -1.233 0.001 0.886 3.187 7.781 2.125
2002m4 - 2008m6 Ex ess Returns 3.780 7.130 9.200 7.445 12.285 7.968
Risk Reversals 0.542 -0.051 -0.150 -0.883 -2.165 -0.541
i
�
� i -0.025 0.252 1.062 2.925 7.226 2.288
2009m1 - 2015m12 Ex ess Returns 0.646 -2.794 -0.574 3.135 1.651 0.412
Risk Reversals -0.713 -1.121 -1.384 -2.247 -3.595 -1.831
Table 2: Correlation Between Un ertainty and Ex ess Return/Risk Reversal
Portfolio
Measure Variable Period (1) (2) (3) (4) (5) (Avg)
Finan ial
ER
Pre-ZLB 0.163 0.205 0.207 0.064 0.036 0.160
ZLB 0.306 0.288 0.370 0.517 0.498 0.447
RR
Pre-ZLB 0.536 -0.793 -0.737 -0.670 -0.606 -0.757
ZLB 0.632 -0.224 0.116 -0.461 -0.785 -0.309
Ma ro
ER
Pre-ZLB -0.026 -0.206 -0.163 -0.224 -0.199 -0.190
ZLB 0.267 0.256 0.351 0.441 0.465 0.402
RR
Pre-ZLB 0.460 -0.772 -0.751 -0.707 -0.609 -0.782
ZLB 0.680 0.051 0.354 -0.213 -0.656 -0.061
Swaption
ER
Pre-ZLB 0.160 0.119 0.154 0.073 -0.038 0.107
ZLB 0.313 0.275 0.385 0.516 0.497 0.446
RR
Pre-ZLB 0.613 -0.793 -0.709 -0.862 -0.744 -0.843
ZLB 0.620 -0.065 0.272 -0.326 -0.706 -0.170
MPU-BBD
ER
Pre-ZLB 0.201 0.236 0.294 0.192 0.317 0.290
ZLB 0.244 0.176 0.293 0.337 0.196 0.270
RR
Pre-ZLB 0.344 -0.476 -0.315 -0.725 -0.556 -0.591
ZLB 0.083 -0.289 -0.170 -0.361 -0.351 -0.322
MPU-HRS
ER
Pre-ZLB 0.029 0.099 0.131 0.054 0.186 0.119
ZLB -0.089 -0.029 -0.101 -0.098 -0.211 -0.124
RR
Pre-ZLB 0.080 -0.024 -0.028 -0.377 -0.251 -0.205
ZLB -0.331 -0.075 -0.168 0.003 0.264 -0.027
Pre-ZLB spans 2002m4-2008m6 for ER and 2005m11-2008m6 for RRs; ZLB spans 2009m1-2015m12.
25

Table 3: Ex ess Returns and Finan ial Un ertainty, 2002m4 { 2015m12
(1) (2) (3) (4) (5) (6)
Finan ial Un ertainty 74.57
�
47.99 32.39 94.28
��
21.60 48.39
��
(2.37) (1.25) (1.09) (3.26) (0.58) (3.31)
TED Spread 5.702 8.011
+
9.046
�
6.082
+
14.75
��
8.429
��
(1.53) (1.82) (2.48) (1.70) (2.93) (4.54)
i
�
� i, Portfolio i -119.9 33.43 140.6 -78.86 290.3
��
(-0.87) (0.18) (0.97) (-0.62) (3.15)
i
�
� i, Panel 115.8
�
(2.13)
Re ession Dummies Yes Yes Yes Yes Yes Yes
Portfolio Dummies No No No No No Yes
Observations 165 165 165 165 165 825
Adjusted R
2
0.046 0.153 0.266 0.475 0.330
Monthly regressions; t statisti s in parentheses;
+
p < 0:10,
�
p < :05,
��
p < :01
Table 4: Risk Reversals and Finan ial Un ertainty, 2005m11 { 2015m12
(1) (2) (3) (4) (5) (6)
Finan ial Un ertainty 9.656
��
-3.846
�
1.604 -7.821
��
-19.21
��
-3.059
��
(5.73) (-2.28) (1.08) (-5.47) (-7.83) (-2.90)
TED Spread 0.864
��
0.838
��
0.873
��
0.944
��
0.161 0.703
��
(4.83) (4.75) (5.05) (5.76) (0.64) (6.12)
i
�
� i, Portfolio i -48.44
��
-44.27
��
-71.61
��
-31.91
��
-14.91
+
(-7.09) (-4.97) (-8.66) (-4.38) (-1.68)
i
�
� i, Panel -45.20
��
(-9.60)
Re ession Dummies Yes Yes Yes Yes Yes Yes
Portfolio Dummies No No No No No Yes
Observations 122 122 122 122 122 610
Adjusted R
2
0.535 0.397 0.478 0.734 0.748
Monthly regressions; t statisti s in parentheses;
+
p < 0:10,
�
p < :05,
��
p < :01
26
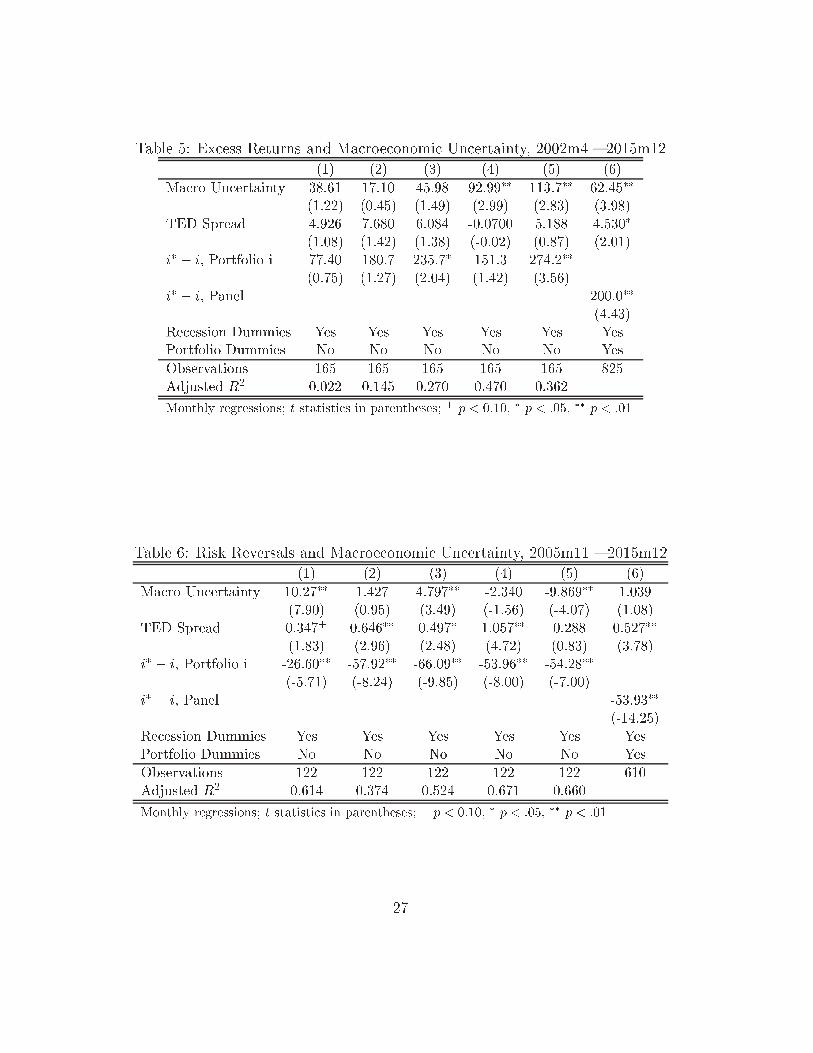
Table 5: Ex ess Returns and Ma roe onomi Un ertainty, 2002m4 { 2015m12
(1) (2) (3) (4) (5) (6)
Ma ro Un ertainty 38.61 17.10 45.98 92.99
��
113.7
��
62.45
��
(1.22) (0.45) (1.49) (2.99) (2.83) (3.98)
TED Spread 4.926 7.680 6.084 -0.0700 5.188 4.530
�
(1.08) (1.42) (1.38) (-0.02) (0.87) (2.01)
i
�
� i, Portfolio i 77.40 180.7 235.7
�
151.3 274.2
��
(0.75) (1.27) (2.04) (1.42) (3.56)
i
�
� i, Panel 200.0
��
(4.43)
Re ession Dummies Yes Yes Yes Yes Yes Yes
Portfolio Dummies No No No No No Yes
Observations 165 165 165 165 165 825
Adjusted R
2
0.022 0.145 0.270 0.470 0.362
Monthly regressions; t statisti s in parentheses;
+
p < 0:10,
�
p < :05,
��
p < :01
Table 6: Risk Reversals and Ma roe onomi Un ertainty, 2005m11 { 2015m12
(1) (2) (3) (4) (5) (6)
Ma ro Un ertainty 10.27
��
1.427 4.797
��
-2.340 -9.869
��
1.039
(7.90) (0.95) (3.49) (-1.56) (-4.07) (1.08)
TED Spread 0.347
+
0.646
��
0.497
�
1.057
��
0.288 0.527
��
(1.83) (2.96) (2.48) (4.72) (0.83) (3.78)
i
�
� i, Portfolio i -26.60
��
-57.92
��
-66.09
��
-53.96
��
-54.28
��
(-5.71) (-8.24) (-9.85) (-8.00) (-7.00)
i
�
� i, Panel -53.93
��
(-14.25)
Re ession Dummies Yes Yes Yes Yes Yes Yes
Portfolio Dummies No No No No No Yes
Observations 122 122 122 122 122 610
Adjusted R
2
0.614 0.374 0.524 0.671 0.660
Monthly regressions; t statisti s in parentheses;
+
p < 0:10,
�
p < :05,
��
p < :01
27

Table 7: Ex ess Returns and MPU-BBD, 2002m4 { 2015m12
(1) (2) (3) (4) (5) (6)
MPU-BBD 5.171
�
5.803
�
6.597
��
6.697
��
4.271 5.637
��
(2.42) (2.19) (2.99) (2.88) (1.46) (5.09)
TED Spread 6.419
+
7.306
+
7.573
�
6.052
+
13.60
��
7.850
��
(1.76) (1.69) (2.13) (1.67) (2.75) (4.29)
i
�
� i, Portfolio i 28.00 76.62 84.28 4.428 271.3
��
(0.26) (0.52) (0.68) (0.04) (3.25)
i
�
� i, Panel 132.5
��
(2.78)
Re ession Dummies Yes Yes Yes Yes Yes Yes
Portfolio Dummies No No No No No Yes
Observations 165 165 165 165 165 825
Adjusted R
2
0.048 0.170 0.300 0.468 0.338
Monthly regressions; t statisti s in parentheses;
+
p < 0:10,
�
p < :05,
��
p < :01
Table 8: Risk Reversals and MPU-BBD, 2005m11 { 2015m12
(1) (2) (3) (4) (5) (6)
MPU-BBD -0.0502 -0.366
��
-0.117 -0.345
��
-0.502
�
-0.267
��
(-0.37) (-3.04) (-0.95) (-2.74) (-2.51) (-3.35)
TED Spread 1.280
��
0.914
��
0.964
��
0.965
��
-0.360 0.733
��
(6.43) (5.16) (5.48) (5.29) (-1.21) (6.32)
i
�
� i, Portfolio i -21.54
��
-52.59
��
-64.72
��
-47.93
��
-59.65
��
(-3.63) (-7.59) (-8.74) (-6.88) (-7.56)
i
�
� i, Panel -50.35
��
(-13.09)
Re ession Dummies Yes Yes Yes Yes Yes Yes
Portfolio Dummies No No No No No Yes
Observations 122 122 122 122 122 610
Adjusted R
2
0.400 0.417 0.476 0.685 0.630
Monthly regressions; t statisti s in parentheses;
+
p < 0:10,
�
p < :05,
��
p < :01
28

Table 9: Ex ess Returns and Swaption Un ertainty, 2002m4 { 2015m12
(1) (2) (3) (4) (5) (6)
Swaption Un ertainty 9.55
�
18.10
��
18.10
��
16.70
��
15.40
�
15.40
��
(2.29) (3.37) (4.27) (3.49) (2.41) (6.89)
TED Spread 2.659 -1.378 -0.973 -1.434 4.817 0.511
(0.61) (-0.26) (-0.23) (-0.32) (0.74) (0.23)
i
�
� i, Portfolio i 67.55 -22.65 42.35 -61.04 196.3
�
(0.64) (-0.15) (0.36) (-0.50) (2.14)
i
�
� i, Panel 87.66
+
(1.83)
Re ession Dummies Yes Yes Yes Yes Yes Yes
Portfolio Dummies No No No No No Yes
Observations 165 165 165 165 165 825
Adjusted R
2
0.044 0.203 0.338 0.480 0.353
Monthly regressions; t statisti s in parentheses;
+
p < 0:10,
�
p < :05,
��
p < :01
CoeÆ ients for Swaption Un ertainty are multiplied by 100.
Table 10: Risk Reversals and Swaption Un ertainty, 2005m11 { 2015m12
(1) (2) (3) (4) (5) (6)
Swaption Un ertainty 2.090
��
0.468 1.270
��
0.464 -0.853
+
0.699
��
(7.36) (1.45) (4.43) (1.42) (-1.61) (3.42)
TED Spread -0.327 0.420 -0.0389 0.514
+
0.0470 0.0918
(-1.24) (1.42) (-0.15) (1.71) (0.10) (0.49)
i
�
� i, Portfolio 1 -24.64
��
-58.82
��
-67.63
��
-54.86
��
-62.17
��
(-5.22) (-8.39) (-10.44) (-8.10) (-7.92)
i
�
i, Panel -54.28
��
(-14.57)
Re ession Dummies Yes Yes Yes Yes Yes Yes
Portfolio Dummies No No No No No Yes
Observations 122 122 122 122 122 610
Adjusted R
2
0.595 0.381 0.551 0.669 0.618
Monthly regressions; t statisti s in parentheses;
+
p < 0:10,
�
p < :05,
��
p < :01
CoeÆ ients for Swaption Un ertainty are multiplied by 100.
29
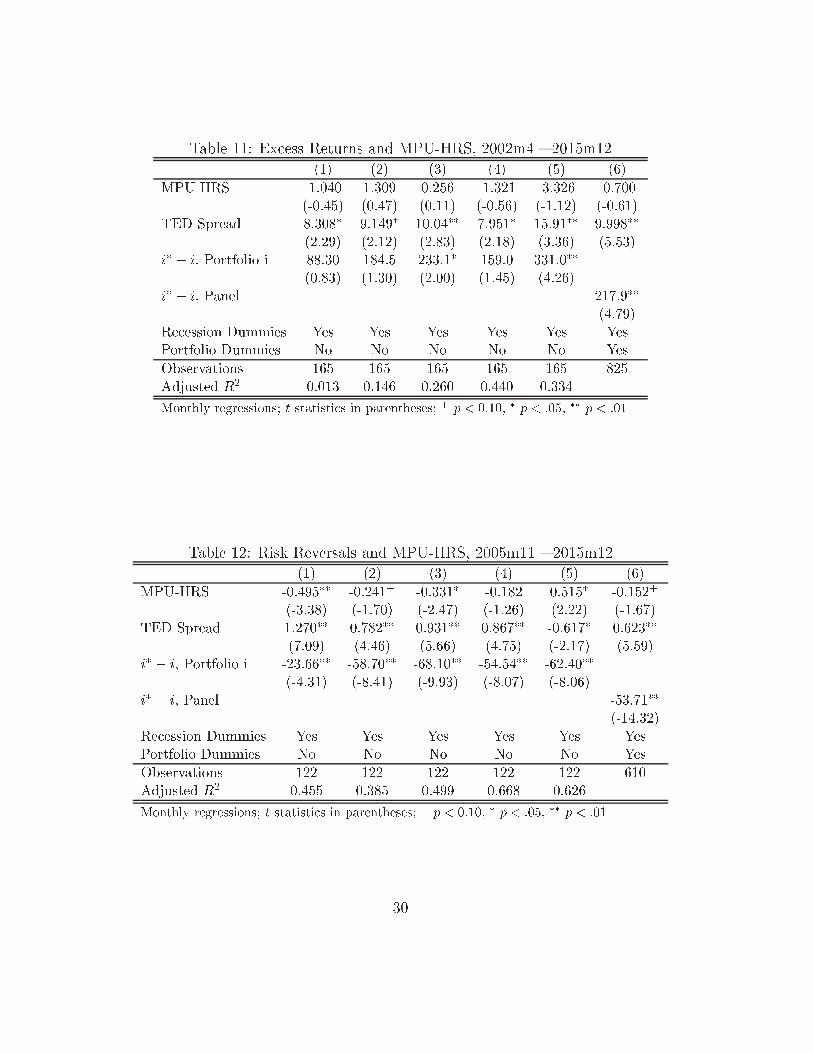
Table 11: Ex ess Returns and MPU-HRS, 2002m4 { 2015m12
(1) (2) (3) (4) (5) (6)
MPU-HRS -1.040 1.309 0.256 -1.321 -3.326 -0.700
(-0.45) (0.47) (0.11) (-0.56) (-1.12) (-0.61)
TED Spread 8.308
�
9.149
�
10.04
��
7.951
�
15.91
��
9.998
��
(2.29) (2.12) (2.83) (2.18) (3.36) (5.53)
i
�
� i, Portfolio i 88.30 184.5 233.1
�
159.0 331.0
��
(0.83) (1.30) (2.00) (1.45) (4.26)
i
�
� i, Panel 217.9
��
(4.79)
Re ession Dummies Yes Yes Yes Yes Yes Yes
Portfolio Dummies No No No No No Yes
Observations 165 165 165 165 165 825
Adjusted R
2
0.013 0.146 0.260 0.440 0.334
Monthly regressions; t statisti s in parentheses;
+
p < 0:10,
�
p < :05,
��
p < :01
Table 12: Risk Reversals and MPU-HRS, 2005m11 { 2015m12
(1) (2) (3) (4) (5) (6)
MPU-HRS -0.495
��
-0.241
+
-0.331
�
-0.182 0.515
�
-0.152
+
(-3.38) (-1.70) (-2.47) (-1.26) (2.22) (-1.67)
TED Spread 1.270
��
0.782
��
0.931
��
0.867
��
-0.617
�
0.623
��
(7.09) (4.46) (5.66) (4.75) (-2.17) (5.59)
i
�
� i, Portfolio i -23.66
��
-58.70
��
-68.10
��
-54.54
��
-62.40
��
(-4.31) (-8.41) (-9.93) (-8.07) (-8.06)
i
�
� i, Panel -53.71
��
(-14.32)
Re ession Dummies Yes Yes Yes Yes Yes Yes
Portfolio Dummies No No No No No Yes
Observations 122 122 122 122 122 610
Adjusted R
2
0.455 0.385 0.499 0.668 0.626
Monthly regressions; t statisti s in parentheses;
+
p < 0:10,
�
p < :05,
��
p < :01
30

Table 13: Correlations Between Un ertainty Measures
MPU-HRS MPU-BBD Swaption Ma ro Finan ial
MPU-HRS 1.000
MPU-BBD 0.737 1.000
Pre-ZLB Swaption 0.229 0.452 1.000
Ma ro 0.127 0.239 0.682 1.000
Finan ial 0.126 0.450 0.698 0.606 1.000
MPU-HRS 1.000
MPU-BBD 0.289 1.000
ZLB Swaption -0.349 0.123 1.000
Ma ro -0.384 0.079 0.911 1.000
Finan ial -0.312 0.272 0.902 0.853 1.000
Pre-ZLB spans 2003m1-2008m6 and ZLB spans 2009m1-2015m12.
Table 14: Summary Statisti s of Key Daily Measures By Portfolio
(1) (2) (3) (4) (5) (Avg)
3m Yield Spreads -0.537 0.212 1.053 3.132 7.564 2.285
Ex ess Returns 0.938 -0.231 1.909 2.245 4.686 1.909
Risk Reversals -.296 -0.873 -1.045 -1.986 -3.381 -1.516
Non-FOMC Day MPU-HRS 109.793
Swaption Un ertainty 63.128
Ted Spreads 0.438
3m Yield Spreads -0.528 0.219 1.056 3.152 7.560 2.291
Ex ess Returns 32.791 42.831 30.440 42.487 53.960 40.502
Risk Reversals -0.274 -0.873 -1.038 -2.005 -3.399 -1.518
FOMC Day MPU-HRS 163.931
Swaption Un ertainty 63.189
Ted Spreads 0.441
31

Table 15: Ex ess Returns, Daily Holding Period, 2002m4 { 2015m12
(1) (2) (3) (4)
MPU-HRS 0.346 0.699
(0.81) (1.55)
MPUxFOMC 4.185
��
-1.851
(2.93) (-1.01)
Swaption Un ertainty 0.0973
��
0.101
�
(3.00) (2.36)
SwaptionXFOMC 0.517
��
0.204
(5.70) (1.27)
TED Spread 4.239 -0.558
(1.21) (-0.13)
TED SpreadxFOMC 81.16
��
49.55
�
(5.26) (2.30)
3m Yield Spread, Panel 257.9
��
171.5
+
(2.94) (1.82)
Constant 1.679 -3.388 0.692 -2.125
(0.63) (-1.10) (0.22) (-0.63)
Re ession Dummies Yes Yes Yes Yes
Portfolio Dummies Yes Yes Yes Yes
Observations 17940 17660 16875 16850
t statisti s in parentheses
Daily regressions estimated over 2005m11-2015m12
with daily dummy variables for Jul.-De . 2008.
+
p < 0:10,
�
p < :05,
��
p < :01
32