Uncertainty connected with design rainfall for urban flood ...
10
NOVATECH 2010 1 Uncertainty connected with design rainfall for urban flood risk evaluation L'incertitude liée à la configuration des pluies en milieu urbain pour l'évaluation des risques d'inondation Chiara Maria Fontanazza*, Gabriele Freni*, Goffredo La Loggia* & Vincenza Notaro* * Dipartimento di Ingegneria Idraulica ed Applicazioni Ambientali, Università degli Studi di Palermo, viale delle Scienze - Edificio 8 - 90128 Palermo Italy ([email protected], [email protected], [email protected], [email protected]) RÉSUMÉ Une série de données suffisamment longue et fiable, liée à l'emplacement, aux volumes et aux hauteurs des phénomènes d'inondation, serait une condition idéale pour évaluer la distribution de fréquence des inondations elles-mêmes. Les données sont, cependant, malheureusement, souvent fragmentaires, donc pour l'estimation des inondations on utilise, généralement, les modèles de simulation hydraulique continuelle, qui exploitent les séries historiques de pluie. Puisque le modèle à long terme est coûteux tant en termes de temps que de ressources requises pour la simulation, il est souvent préférable d'utiliser la pluie de projet de synthèse. Cet article se concentre sur l'évaluation de l'incertitude associée à l'utilisation de modèles hydrauliques et d’histogrammes de synthèse pour l'évaluation des la fréquence des inondations. A cet effet, l'analyse statistique multi-variée, basée sur la méthode des Copules, a été appliquée aux propriétés fondamentales de la pluviométrie (hauteur totale, la durée et l'intensité maximale) afin de générer des précipitations synthétiques conciliables avec les événements historiques. La procédure a été appliquée à une étude de cas réels et les résultats ont été comparés à ceux obtenus en utilisant des événements typiques de pluie synthétique obtenus de courbes IDF. L'analyse multi-variée basée sur les Copules a montré une plus grande force, fournissant un bon ajustement aux données sur la localisation des inondations. L'étude a également montré que la corrélation statistique entre la fréquence, la durée, le volume et l'intensité maximale des précipitations peut expliquer en partie le manque de fiabilité de l'analyse de la fréquence des inondations appuyée sur les précipitations synthétiques. ABSTRACT A reliable and long dataset describing urban flood locations, volumes and depths would be an ideal prerequisite to assess flood frequency distributions. However, data are often piecemeal and long-term hydraulic modelling is often adopted to estimate floods from historical rainfall series. Long-term modelling approaches are time- and resource-consuming, and synthetically designed rainfalls are often used to estimate flood frequencies. The present paper aims to assess the uncertainty of such an approach. According to this aim, a multivariate statistical analysis based on a copula method was applied to rainfall features (total depth, duration and maximum intensity) to generate synthetic rainfalls that are more consistent with historical events. The procedure was applied to a real case study, and the results were compared with those obtained by simulating other typical synthetic rainfall events linked to IDF curves. The copula-based multi-variate analysis is more robust and adapts well to experimental flood locations; these features mitigate the higher complexity of the theoretical approach. This study demonstrates that statistical correlations amongst rainfall frequency, duration, volume and peak intensity can partially explain the weak reliability of flood-frequency analyses based on synthetic rainfall events. KEYWORDS Copula functions, multivariate analysis, synthetic rainfall, rainfall pattern, urban flood risk Selected for publication in "Water Science & Technology". Reproduced with the permission of IWA Publishing.
Transcript of Uncertainty connected with design rainfall for urban flood ...

NOVATECH 2010
1
Uncertainty connected with design rainfall for urban flood risk evaluation
L'incertitude liée à la configuration des pluies en milieu urbain pour l'évaluation des risques d'inondation
Chiara Maria Fontanazza*, Gabriele Freni*, Goffredo La Loggia* & Vincenza Notaro* * Dipartimento di Ingegneria Idraulica ed Applicazioni Ambientali, Università degli Studi di Palermo, viale delle Scienze - Edificio 8 - 90128 Palermo Italy ([email protected], [email protected], [email protected], [email protected])
RÉSUMÉ
Une série de données suffisamment longue et fiable, liée à l'emplacement, aux volumes et aux hauteurs des phénomènes d'inondation, serait une condition idéale pour évaluer la distribution de fréquence des inondations elles-mêmes. Les données sont, cependant, malheureusement, souvent fragmentaires, donc pour l'estimation des inondations on utilise, généralement, les modèles de simulation hydraulique continuelle, qui exploitent les séries historiques de pluie. Puisque le modèle à long terme est coûteux tant en termes de temps que de ressources requises pour la simulation, il est souvent préférable d'utiliser la pluie de projet de synthèse. Cet article se concentre sur l'évaluation de l'incertitude associée à l'utilisation de modèles hydrauliques et d’histogrammes de synthèse pour l'évaluation des la fréquence des inondations. A cet effet, l'analyse statistique multi-variée, basée sur la méthode des Copules, a été appliquée aux propriétés fondamentales de la pluviométrie (hauteur totale, la durée et l'intensité maximale) afin de générer des précipitations synthétiques conciliables avec les événements historiques. La procédure a été appliquée à une étude de cas réels et les résultats ont été comparés à ceux obtenus en utilisant des événements typiques de pluie synthétique obtenus de courbes IDF. L'analyse multi-variée basée sur les Copules a montré une plus grande force, fournissant un bon ajustement aux données sur la localisation des inondations. L'étude a également montré que la corrélation statistique entre la fréquence, la durée, le volume et l'intensité maximale des précipitations peut expliquer en partie le manque de fiabilité de l'analyse de la fréquence des inondations appuyée sur les précipitations synthétiques.
ABSTRACT
A reliable and long dataset describing urban flood locations, volumes and depths would be an ideal prerequisite to assess flood frequency distributions. However, data are often piecemeal and long-term hydraulic modelling is often adopted to estimate floods from historical rainfall series. Long-term modelling approaches are time- and resource-consuming, and synthetically designed rainfalls are often used to estimate flood frequencies. The present paper aims to assess the uncertainty of such an approach. According to this aim, a multivariate statistical analysis based on a copula method was applied to rainfall features (total depth, duration and maximum intensity) to generate synthetic rainfalls that are more consistent with historical events. The procedure was applied to a real case study, and the results were compared with those obtained by simulating other typical synthetic rainfall events linked to IDF curves. The copula-based multi-variate analysis is more robust and adapts well to experimental flood locations; these features mitigate the higher complexity of the theoretical approach. This study demonstrates that statistical correlations amongst rainfall frequency, duration, volume and peak intensity can partially explain the weak reliability of flood-frequency analyses based on synthetic rainfall events.
KEYWORDS
Copula functions, multivariate analysis, synthetic rainfall, rainfall pattern, urban flood risk
Selected for publication in "Water Science & Technology". Reproduced with the permission of IWA Publishing.
SESSION 1.9
2
1 INTRODUCTION
Evaluation and management of flood risk in urban areas is a fundamental theme in engineering research and practice. Namely, flooding risk assessment is very complex in urban areas, where floods are often produced only by rainfall rather than by natural water bodies inundations. Frequently, surface runoff cannot be completely collected by urban drainage system and water flows through the streets and squares. Sometimes, floods are generated by drainage system overflow occurring when sewer cross sections are insufficient to convey peak discharges.
In the last years, many definitions have been proposed to explain the concept of flood risk in urban areas and many methodologies have been defined in order to quantify that risk in the most objective and general way (e.g. among the most recent there are Barroca et al. 2006, Apel et al. 2006, Grunthal et al. 2006, Hardmeyer & Spencer 2007). According to these methodologies, a flood risk R can be defined as the probability of a loss and can be evaluated as the product of three parameters:
EVHR (1)
where H is the hazard or the probability that a system deficiency can cause flooding; V is the vulnerability of the objects “at risk” that may be affected and damaged by floods; and E is the exposure taking into account if people or assets are physically in the path of floodwater or not.
In order to evaluate the hazard or the probability of system failure causing an urban flooding, the statistical investigation of long and reliable historical series of flooding events would be advisable but data are often unavailable or piecemeal. For this reason, many standard approaches make use of long historical rainfall series or design storms in conjunction with urban drainage modelling (Thorndahl & Willems 2008). According to this aim, more or less complex numerical hydrodynamic simulation tools (e.g. MOUSE, InfoWorks, SWMM, etc.) are often applied to analyze drainage systems, either by brute force or by statistical methods. In the first case, long-term simulations of historical rain series are carried out to determine return periods of surcharges, flooding and overflows; in the second case, synthetic rain inputs (i.e. triangular hyetograph presented in Chow et al, 1988; Chicago Design Storm (CDS) suggested in Kiefer and Chu, 1957; etc ...) are used supposing that flooding and rainfall events are characterised by the same probability.
Both approaches need the model to be calibrated over the available historical flooding data. The first approach has the advantage of providing directly a return period of flooding depth, but it needs large computational efforts for running the simulation of long historical rain series. The second approach is less computationally demanding but it presents the disadvantages of relating flood return period to precipitation probability and of assuming simplified hypotheses to define synthetic rainfall events. The first assumption is not removable unless long term simulations are performed: the simplifications connected with the synthetic event generation may be investigated for estimating its impact on flood frequency estimation. A synthetic hyetograph is in fact a temporal rainfall pattern usually associated with a return period and determined by means of a statistical analysis of observed rainfall series. Due to the scarcity of the available rainfall data, often the statistical analysis on rainfall are carried out adopting univariate statistical approaches, where only the observed avarage intensity of a rainfall storm is statistically analysed by the mean of intensity-duration-frequency (IDF) curves (Grimaldi et al 2006). The other characteristics of a rainfall storm, such as its peak (maximum intensity), total depth and duration are found indirectly throughout several phases of hydrological analysis by applying suitable a-priori hypothesis to the hyetograph pattern. Such simplified hypothesis may greatly influence the risk analysis affecting the estimation of flooding probability. Therefore, as in several other hydrologic and hydraulic applications, uncertainty analysis may be useful to estimate such impact and to compare different a-priori hypotheses highlighting the most reliable (Beven & Binley 1992, Aronica et al. 2005, Gupta et al. 2005, Freni et al. 2006).
The aim of the present research is to tackle uncertainty introduced by the use of synthetic rainfall event, especially for those zenithal floods that are more influenced by the temporal distribution of rainstorm. The paper proposes a new approach to define the synthetic rainfall pattern based on a multivariate statistical analysis of the main interesting features of the observed rainfall pattern event (total depth, duration and maximum intensity). Finally, in order to highlight the advantages of the presented approach, the results of the proposed procedure are compared with those obtained simulating others synthetic rainfall event (triangular and Chicago hyetographs) obtained by the mean of IDF curves. The procedure is applied to a real case study: the historical city centre of Palermo (Italy).
NOVATECH 2010
3
2 MATERIALS AND METHODS
2.1 Urban drainage system modelling
Due to the complexity of the involved phenomena, the analysis of urban flooding is characterized by more uncertainties than the simpler study of the water flowing in the underground drainage system. In the past years, many models have been implemented to solve the flooding propagation problem trying to provide reliable tools for estimating flooding volumes, depths and water velocities on the catchment surface and consequently flooding impact on population. However, the adoption of such approaches is prevented by the lack of data on system geometry and monitored flooding events and by the high computation cost of such complex models. For this reasons, in order to obtain reliable tools for practical applications, several conceptual approaches to flooding propagation have been developed with widely different computational needs (Hsu et al. 2000, Despotovic et al. 2002, Schmitt et al. 2004, Smith 2006, Mark et al. 2004, Schmitt et al. 2005, Hunter et al. 2008, Maksimović et al. 2009, Leandro et al. 2009).
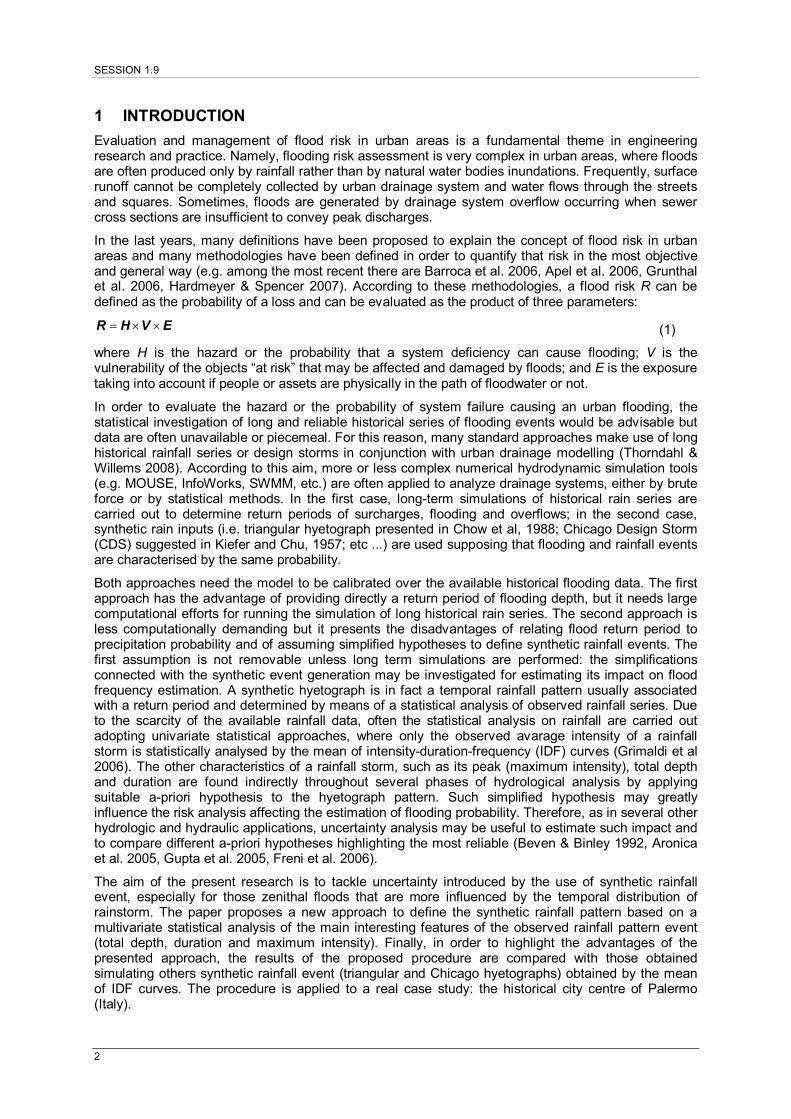
In the present study, in order to simulate the urban drainage system behaviour, the commercial urban drainage model SWMM is adopted. Namely, a distributed "non-linear reservoir" model is used to simulate the catchment’s surface runoff, taking into account both the detention storage and the infiltration phenomena (Rossman, 2009). Finally, a dual drainage approach is adopted in order to simulate surface flooding propagation (Djorgevich et al. 1999), where underground and surface drainage systems (streets network) are schematized as two dynamically interconnected networks (Fig.1).
Figure 1. Dual drainage model (Djordjevic et al 1999)
This approach assumes streets network as wide open channels connecting two storage nodes and it usually analyses them according to 1D De Saint Venant equations in their complete (dynamic) or simplified form (cinematic or diffusive) with a more detailed or a less resource consuming model (Bascià et al. 2001). Thus, this approach can analyze a wide range of problems, from the frequent and limited local flooding to a general surcharge of the system with high water levels on the streets and high discharges. The implementation of the dual system in existing models does not request to use different approaches for the underground and surface drainage. The adopted models are widely used both in professional practices and in research applications and they are all implemented in commonly applied commercial simulation software. The proposed procedure is therefore generally applicable and does not depend on the hydrologic/hydraulic simulation software.
2.2 The case study
The “Centro Storico” catchment of Palermo (Italy) is the oldest part of the city, strongly urbanized (Fig.2). It is about 2.5 km2, with about 88% of impervious areas, mainly buildings, roads and squares and with few pervious areas, mostly fragmented into public parks and many courtyards in mansion and religious buildings spread for the most part along the main roads.
The whole catchment is drained by a very old drainage system with about 118 years old and with a total length of about 56 km. It receives both storm and waste water also from upstream less urbanized watersheds; local surface flooding due to the system insufficiency often occur even for high-frequency rainfalls (La Loggia et al. 1998). During 1994-2008 in various part of the “Centro Storico” watershed more of 30 flooding events have been registered causing many damages to people, households and vehicles. In order to obtain an accurate and reliable data set of these historical flooding events, various data sources have been queried, i.e. fire brigades and insurance companies. Namely, for each event, fire brigades have provided information as about the flooded areas or locations with the related water depth, duration, flooding volumes and various information about damaged properties and objects. In Figure 2 have been identified the flooded areas, while in Table 1 have been reported the

SESSION 1.9
4
related mean water depth and flooding frequency.
Calibration of the adopted propagation model was carried out on the basis of flooding levels and volumes measured by Municipal Fire Brigades during small flooding events that interested the studied area between 1994 and 2008 (Freni et al. in press).
Figure 2. The “Centro Storico” of Palermo catchment with flooded areas
Flooded areas
Mean flooding depth [cm]
Average return period [yrs]
Flooded areas
Mean flooding depth [cm]
Average return period [yrs]
1 144,9 0,54 9 44,4 0,56
2 63,4 0,56 10 25,7 0,71
3 50,7 0,68 11 28,7 0,56
4 45,9 0,56 12 54,6 0,54
5 59,9 0,56 13 43,2 0,54
6 32,2 0,56 14 38,4 0,56
7 28,3 0,68 15 24,6 1,5
8 47,0 0,59
Table 1. Frequency and mean water depth at different flooding locations in “Centro Storico” catchment
2.3 Rainfall data analysis
The analysis of rainfall temporal variability has been based on data collected at Parco d’Orleans rain gauge located inside the analysed area. The rain gauge RG is working since 1993 and it has a temporal resolution equal to 1 min.
2.3.1 Multivariate statistical analysis
Initially, a multivariate statistical analysis of rainfall data was carried out, in order to identify the joint distribution between the variables that characterise a rainfall storm event, such as total depth H, total duration D and maximum intensity I.
According to this aim, a remarkably flexible tool for building multivariate cumulative distribution functions (cdfs) with arbitrary margins was applied: the 2-copula function, (Frees & Valdez 1998, De Michele & Salvadori 2003, Favre et al., 2004, Salvadori & De Michele 2004, Grimaldi & Serinaldi 2006).

NOVATECH 2010
5
In the first step of the analysis, a series of historical rainfall events during which urban flooding problems were registered in the studied area was chosen. The analysis of all 2340 rainfall events, recorded between 1994 and 2008 at the RG located into the analyzed catchment, drove the selection of 144 statistical independent rainfall events, with a minimum inter event time of 72 hours. For each event, total depth H [mm], total duration D [min] and maximum intensity I [mm/h] were collected.
In order to investigate correlations between the three variables, the Kendall’s K rank correlation matrix was evaluated (Table 2). As show in table 2 the three quantities are positively correlated.
H D I H
1 0.5796 0.4161 D
0.5796 1 0.0803 I
0.4161 0.0803 1
Table 2. Kendall’s K rank correlation matrix of total depth H, duration D and maximum intensity I
For each variable, the empirical frequency, as evaluated with Gringorten’s formula (Chow et al. 1988), was fitted with parametric cdfs. The Kolmogorov – Smirnov (K-S) tests showed that all the three variables, total depth H, total duration D and maximum intensity I, have GEV (Generalised Extreme Value) distributions, for which parameters are reported in Figure 3.
Figure 3. Comparison between Gringorten empirical distribution and theoretical GEV cdf for total depth H (a), total duration D (b) and maximum intensity I
In the second step, a multivariate statistical analysis aimed to identify the joint probability of H-D, of H-I and of D-I was carried out fitting different Archimedean 2-copulas to sample data. Applying the Canonical Maximum Likelihood method (Bouyé et al. 2000), parameters of several 2-copulas were assessed and table 3 shows the expressions of any 2-copula functions used in the study.
u1=F(x), u2=G(y) Copula
C
Gumbel-Hougaard
Clayton-Pareto
Frank
*
No. 2
* where and
Table 3. Any one-parameter Archimedean 2-copula families used in the case study
SESSION 1.9
6
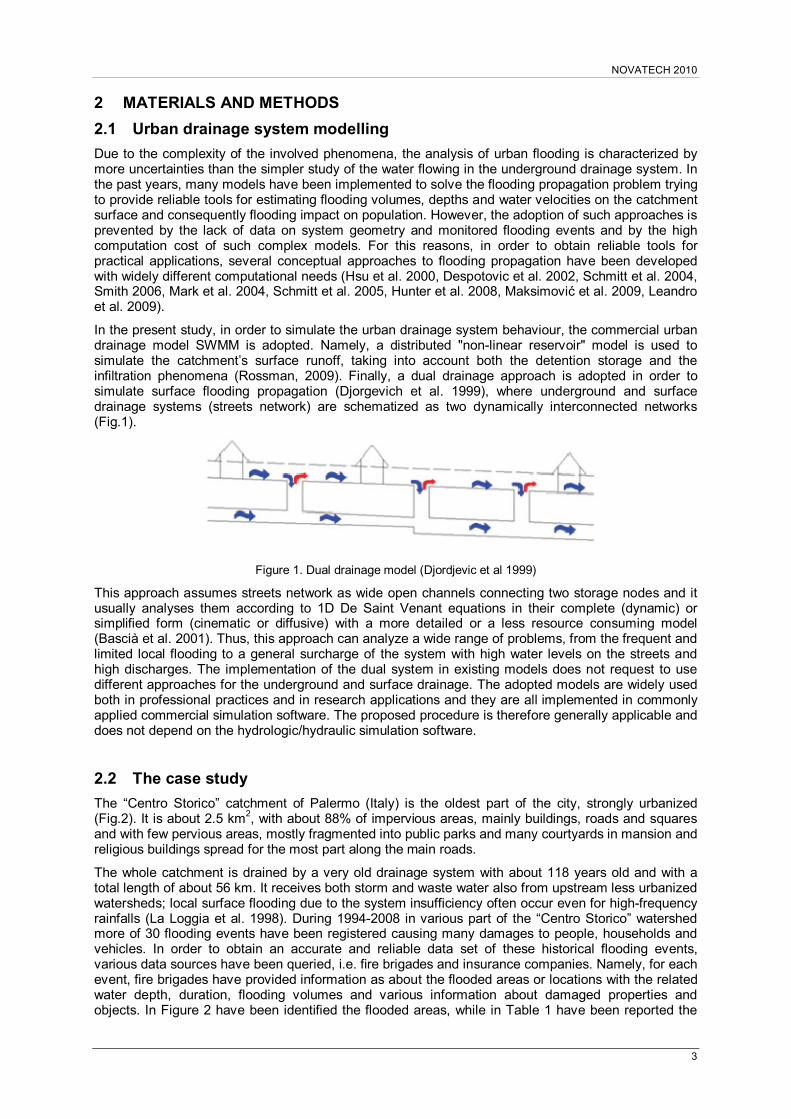
In order to identify the Archimedean copulae that fit better the sample data, a graphical method analysing the related cdfs KC (Genest & Rivest 1993) was applied.
The Probability Integral Transform theorem and its corollary establish that an Archimedean copula is uniquely determined by its cdf KC and that KC values have to be uniformly distributed. Therefore, an estimated copula fits the sample when the QQ plot of KC vs standard uniform quantiles has a roughly linear pattern. The goodness of the fit was evaluated by K-S test. The Gumbel-Hougaard copula family showed the best fitting to sample data H-D and V-I. In Figure 4 the related QQ plot of KC vs standard uniform U(0,1) quantiles together with the related copula parameter and Kolmogorov Smirnov test outcomes are reported.
a) b)
Figure 4. QQ plot of KC vs standard uniform U(0,1) quantiles for Gumbel-Pareto’s copula fitting H-D data (a); and
H-I data (b)
Therefore, the joint cumulative distribution function and the related joint return period corresponding to H-D and H-I were evaluated (Yue, 2001):
(2)
Figure 5 shows the corresponding contours of the joint return period of variable couples total depth H and total duration D and total depth H and maximum intensity I.
a) b)
Figure 5. Contour of the joint return period of a) total depth H and total duration D and b) total depth H and maximum intensity I
These contours can contribute meaningfully to solutions of several problems in hydrological engineering. For example, by crossing the information obtained by the two copulas, for a given return period of a storm event, it is possible to identify various occurrence combinations of total depth H and duration D (figure 5a) and then the related maximum intensity I value (Figure 5b) and vice versa. According to this procedure, in the present study, 2500 triplets of H, D and I values were randomly generated by Monte Carlo analysis assuming return periods varying in the range [1.2-15 years].

NOVATECH 2010
7
In the third step of the analysis, a shape to each synthetic event identified by each triplet (H,D,I) was assigned. The historical shapes of the 144 selected events were normalised by dividing the time by the event duration and the rainfall intensity by its maximum value. For each triplet (H,D,I), an historical shape was selected by minimising the function:
(3)
2.3.2 Monovariate statistical analysis
The proposed approach was compared with the classical monovariate statistical analisys. The annual maxima of the observed mean rainfall intensity were fitted to EV1 distribution and K-S test was performed to verify the adaptation. For 50 return period values randomly picked over the range [1.2-15 years], the corresponding IDF curve was generated as:
(4)
where i is the mean rainfall intensity, d is the rainfall duration and a and n are IDF curve parameters that depend on the return period.
Then, 50 couples [D, I] were obtained from each of the IDF curve, via a Monte Carlo procedure. Finally, to each of the randomly picked points of the IDF curve, a triangular or the Chicago (CDS) shape was applied while randomly varying their shape parameter r (the ratio between time to peak and storm duration) over the range [0.1, 0.9]. The total number of the generated events is 2500 for both the triangular and the CDS shape.
2.4 Urban flood simulations Results
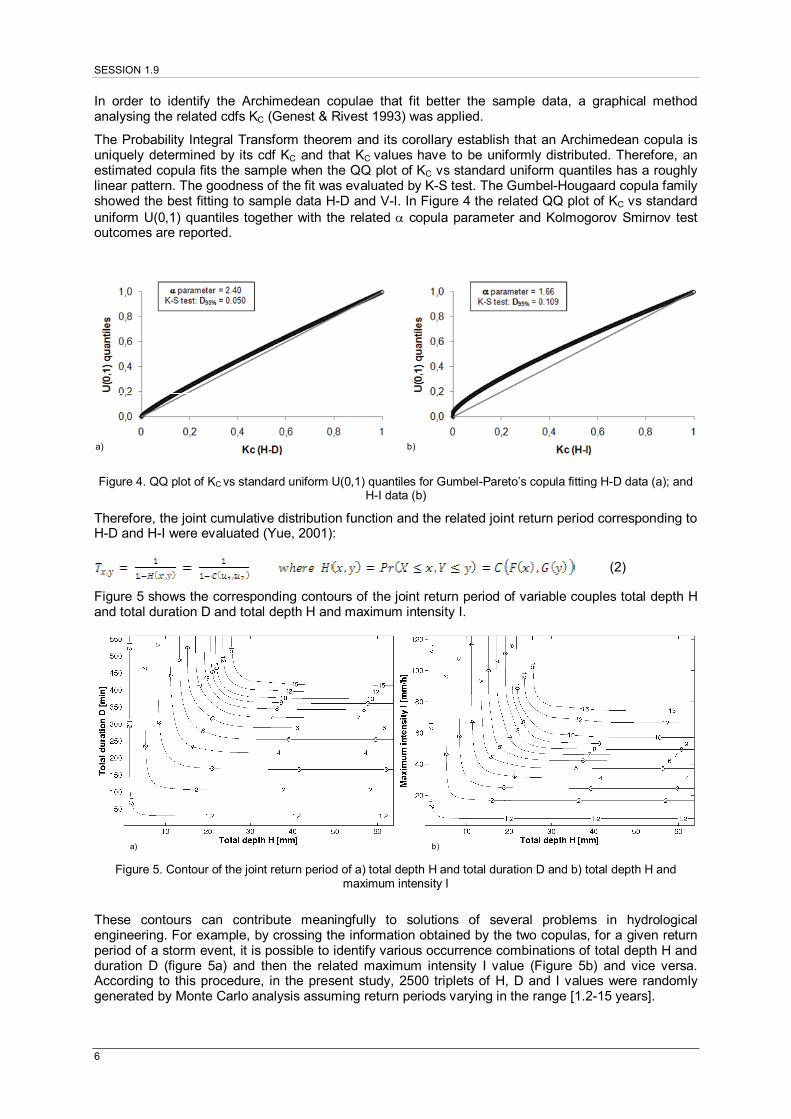
Both the copula-based and the monovariate estimates of synthetic rainfall events were used as input to the hydraulic model described above, obtaining 2500 Monte Carlo simulations which can be analysed by means of the uncertainty analysis. In order to highlight the advantages of the proposed procedure, the uncertainty boundaries related to the return period of urban floods were estimated by means of the 5% and 95% quantiles of the flood depth for fixed return period. The depth distribution was compared with the measured values for each flooding location in the analysed catchment. Figure 6 shows the results for four flood locations: one in the upstream part, one in the downstream part and two in the central part of the catchment.
Some considerations may be drawn from the analysis of the figure:
• experimental points always fall within the range given by the uncertainty bands, thus demonstrating the reliability of the approach.
• the width of the uncertainty bands increases with the event return period showing that the approach is more robust for estimating high frequency flooding events; this is probably due to the increased importance of surface flooding propagation phenomena when the return period increases. This fact stresses the importance of the non linear processes thus weakening the reliability of the iso-frequency hypothesis between rainfall and flooding.
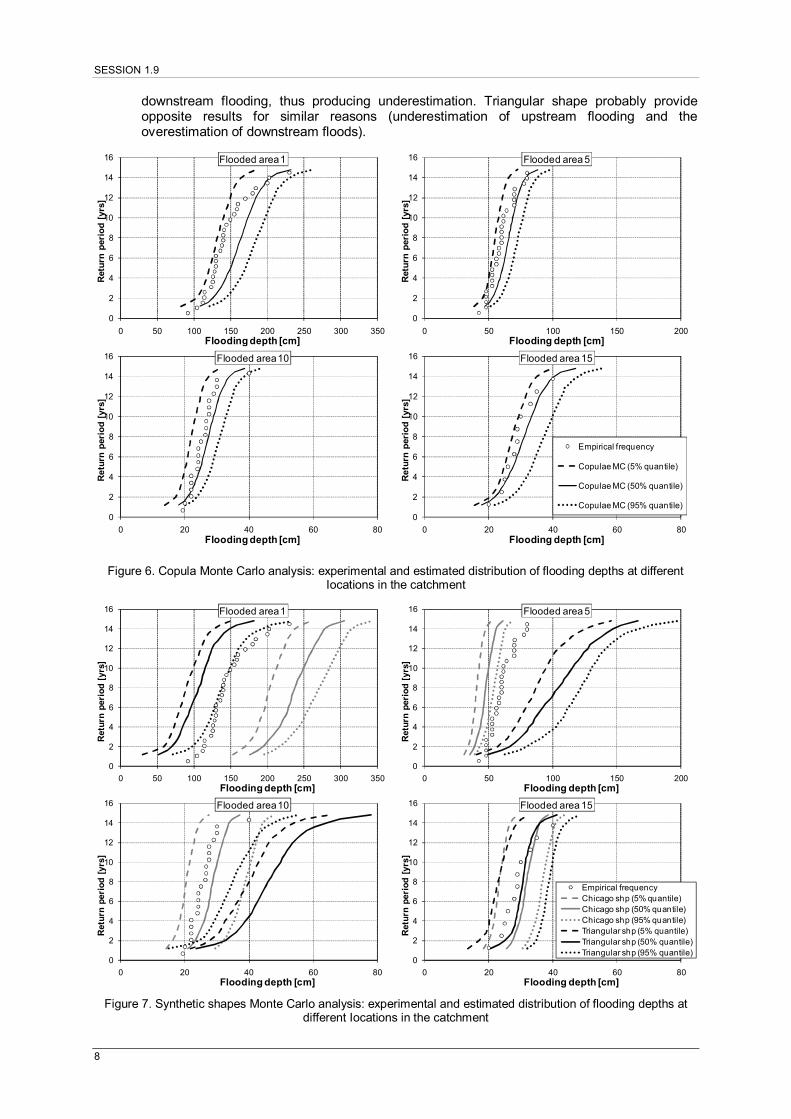
In the same way, uncertainty bands were obtained for the two analysed synthetic shapes (triangular and CDS). In this case, the only link between rainfall characteristics and return period is provided by the IDF curves. Figure 7 shows the estimated and empirical flooding frequency distributions and the related uncertainty bands. Note that:
• both the synthetic shapes demonstrate to be unreliable because for several flooding location experimental points fall outside the uncertainty bands.
• the best match between the empirical and the mean estimated frequency distributions is obtained in the central part of the catchment, while the highest discrepancies are obtained in the upstream and in the downstream parts.
• the CDS shape tends to overestimate flooding depth (for a fixed return period) in the upstream part of the catchment and to underestimate it in the downstream part; the triangular shape has the opposite behaviour. This is probably because CDS shape provides, by definition, the most intense rainfalls for a fixed return period causing higher flooding in the upstream part of the catchment; volumes temporarily stored in the upstream flooding do not contribute to
SESSION 1.9
8
downstream flooding, thus producing underestimation. Triangular shape probably provide opposite results for similar reasons (underestimation of upstream flooding and the overestimation of downstream floods).
0
2
4
6
8
10
12
14
16
0 50 100 150 200 250 300 350
Ret
urn
per
iod
[yr
s]
Flooding depth [cm]
Flooded area 1
0
2
4
6
8
10
12
14
16
0 20 40 60 80
Re
turn
per
iod
[yr
s]
Flooding depth [cm]
Flooded area 10
0
2
4
6
8
10
12
14
16
0 20 40 60 80
Re
turn
per
iod
[yr
s]
Flooding depth [cm]
Flooded area 15
Empirical frequency
Copulae MC (5% quantile)
Copulae MC (50% quantile)
Copulae MC (95% quantile)
0
2
4
6
8
10
12
14
16
0 50 100 150 200
Ret
urn
per
iod
[yr
s]
Flooding depth [cm]
Flooded area 5
Figure 6. Copula Monte Carlo analysis: experimental and estimated distribution of flooding depths at different Iocations in the catchment
0
2
4
6
8
10
12
14
16
0 50 100 150 200 250 300 350
Ret
urn
per
iod
[yr
s]
Flooding depth [cm]
Flooded area 1
0
2
4
6
8
10
12
14
16
0 20 40 60 80
Ret
urn
per
iod
[yr
s]
Flooding depth [cm]
Flooded area 10
0
2
4
6
8
10
12
14
16
0 20 40 60 80
Ret
urn
per
iod
[yr
s]
Flooding depth [cm]
Flooded area 15
Empirical frequencyChicago shp (5% quantile)Chicago shp (50% quantile)Chicago shp (95% quantile)Triangular shp (5% quantile)Triangular shp (50% quantile)Triangular shp (95% quantile)
0
2
4
6
8
10
12
14
16
0 50 100 150 200
Ret
urn
per
iod
[yr
s]
Flooding depth [cm]
Flooded area 5
Figure 7. Synthetic shapes Monte Carlo analysis: experimental and estimated distribution of flooding depths at different Iocations in the catchment

NOVATECH 2010
9
The comparison between the two figures shows generally smaller uncertainty bands by using Copulae MC depending on the fact that the use of historical rainfall shapes plays a positive role in the reduction of flooding estimates uncertainty. The use of classical univariate rainfall analyses may provide large errors in flooding frequencies estimation and the selection of a synthetic rainfall shape may generate errors higher than 80% in the evaluation of flooding depth for fixed return period.
These results confirm that synthetic hyetographs should not be used to evaluate flood depth; they should only be used to estimate discharges at catchment outlet and sizing pipes, the use for which they were initially created.
3 CONCLUSIONS
The present study discussed the uncertainties that may be generated by the use of synthetic rainfall events for the estimation of flooding depth frequencies. This type of study is commonly adopted when not enough experimental data are available for a direct statistical analysis and when simulating flooding derived by long rainfall series is computationally demanding. In those cases, the wrong selection of the synthetic rainfall shape may take to unreliable results. In the analysed case study, the adoption of CDS shapes took to higher flooding in the upstream part of the catchment and lower ones in the downstream part. The triangular shape demonstrated opposite results and both the synthetic shapes presented better results in the central part of the catchment.
The copula-based multi-variate analysis demonstrated to be more robust providing good adaptation to the experimental flooding locations mitigating the higher complexity of the theoretical approach.
The study demonstrated that statistical correlation among rainfall frequency, duration, volume and peak intensity can partially explain the weak reliability of flooding frequency analyses based on synthetic rainfall events. Another source of error is given by the non-linear processes that take part on the catchment but this source demonstrated to be negligible in the analysed case study and the copula-based Monte Carlo approach provided reliable estimates of the flooding frequency.
LIST OF REFERENCES Apel,H., Annegret, W., Thieken, H., Merz, B. & Bloschl, G. 2006. A probabilistic modelling system for assessing
flood risks. Natural Hazards vol. 38 (1-2) pp. 79-100 Aronica, G.T., Freni, G. & Oliveri E. 2005. Uncertainty analysis of the influence of rainfall time resolution in the
modelling of urban drainage systems. Hydrological Processes 19, 1055–1071 Barroca. B., Bernardara, P., Mouchel, J. M. & Hubert, G. 2006. Indicators for identification of urban flooding
vulnerability. Natural Hazards And Earth System Sciences vol. 6 (4) pp. 553-561 Bascià, A. & Tucciarelli, T. 2001. A robust and efficient dual multi-level urban drainage model. Proceedings of the
8th Int. Symposium on Flow Modelling and Turbulence Measurements. Tokyo - Japan, December 2001. Beven, K.J. & Binley, A.M., 1992. The future of distributed models - model calibration and uncertainty prediction.
Hydrological Processes Vol. 6(3), pp. 279-298. Chow, V. T., Maidment, D. R. & Mays, L. W. 1988. Applied Hydrology. McGraw-Hill, New York, USA Bouyé, E., Durrleman, V., Nikeghbali, A., Riboulet, G. & Roncalli T. 2000. Copulas for finance-a reading guide
and some applications. In: 17th Int. Conf. Finance (French Finance Association, Paris, France, 27 June 2000, and at First World Congress of the Bachelier Finance Society, 29 June 2000).
De Michele, C. & Salvadori, G. 2003. A generalized Pareto intensity–duration model of storm rainfall exploiting 2-copulas. Journal of Geophysical Research 108(D2), 4067, doi:10.1029/2002JD002534.
Despotovi´c, J., Petrovi´c, J. & Jacimovi´c, N. 2002. Measurement, calibration of rainfall-runoff models and assessment of the return period of flooding events at urban catchment Kumodraz in Belgrade. Water Science And Technology vol. 45 (2) pp. 127-133
Djordjevic, S., Prodanovic, D. & Maksimovic, C. (1999). An approach to simulation of dual drainage. Wat. Sci. Tech. 39 (9), 95-103
Favre, A.-C., El Adlouni, S., Perreault, L., Thiémonge, N. & Bobée B. 2004. Multivariate hydrological frequency analysis using copulas. Water Resource Research. 40(1), 1–12, W01101, doi:10.1029/2003WR002456.
Frees, E. W. & Valdez, E. A. 1998. Understanding relationships using copulas. North Am. Actuarial J. 2(1), 1–25. Freni, G., La Loggia, G., Notaro, V. & Oliveri, E. 2006. Reliability of sewer system performance analysis. In : 32nh
Congress of IAHR, the International Association of Hydraulic engineering & Research, Venezia, 1-6 giugno 2007, pp.208.
Freni, G., La Loggia, G., Notaro, V., (in press). Uncertainty in urban flood damage assessment due to urban drainage modelling and depth-damage curve estimation. Water Science and Technology (in press).

SESSION 1.9
10
Genest, C. & Rivest, L. 1993. Statistical inference procedures for bivariate Archimedean copulas. J. Am. Statist. Assoc. 88, 1034–1043.
Grimaldi, S. & Serinaldi, F. 2006. Design hyetograph analysis with 3-copula function. Hydrological Sciences–Journal–des Sciences Hydrologiques, 51(2) April 2006
Grunthal, G.,W, Thieken, A. H., Schwarz, J., Radtke, K. S., Smolka, A. & Merz, B. 2006. Comparative risk assessments for the city of Cologne - Storms, floods, earthquakes. Natural Hazards vol. 38 (1-2) pp. 21-44
Gupta, H. V., Beven, K. J. & Wagener, T., 2005. 142: Model Calibration and Uncertainty Estimation. Encyclopedia of Hydrological Sciences. Edited by M. Anderson. ©,John Wiley & Sons, Ltd.
Hardmeyer, K. & Spencer, M.A. 2007. Using risk-based analysis and geographic information systems to assess flooding problems in an urban watershed in Rhode Island. Environmental Management vol. 39 (4) pp. 563-574
Hsu, M.H., Chen, S.H. & Chang T.J.,. 2000. Inundation simulation for urban drainage basin with storm sewer system. Journal Of Hydrology vol. 234 (1-2) pp. 21-37
Hunter, N. M., Bates, P. D., Neelz, S., Pender G., Villanueva, I., Wright, N. G., Liang, D., Falconer, R. A., Lin, B., Waller, S., Crossley, A. J. & Mason, D. C. 2008. Benchmarking 2D hydraulic models for urban flooding. Proceedings Of The Institution Of Civil Engineers-Water Management vol. 161 (1) pp. 13-30
Kiefer, C.J. & Chu, H.H., 1957. Synthetic storm pattern for drainage design. ASCE J. Hydraul. Div. 83 (HY 4), 1332/1–1332/25.
La Loggia, G., Oliveri, E., Freni, G. & Giangrasso, G. 1998. Analisi della consistenza di una rete di drenaggio urbano attraverso l’uso di modelli a base fisica. Proc. of Conference on "Risorse idriche ed impatto ambientale dei deflussi urbani", 18-20 Nov., Cagliari, Italy.
Leandro, J., Chen, A. S., Djordjević, S. and Savić, D. A. 2009. A comparison of 1D/1D and 1D/2D coupled (sewer/surface) hydraulic models for urban flood simulation, Journal of Hydraulic Engineering, 135(6), 495-504.
Mark, O., Weesakul, S., Apirumanekul, C., Boonya Aroonnet, S. & Djordjevic, S. 2004. Potential and limitations of 1D modelling of urban flooding. Journal of Hydrology vol. 299 (3-4) pp. 284-299
Maksimović, Č., Prodanović, D., Boonya-aroonnet, S., Leitão, J., Djordjević, S. and Allitt, R. 2009. Overland flow and pathway analysis for modelling of urban pluvial flooding, Journal of Hydraulic Research, 47(4), 512–523.
Rossman L.A. (2009). Storm Water management model, User’s manual. U.S. Environmental Protection Agency. Salvadori, G. & De Michele, C. 2004. Analytical calculation of storm volume statistics involving Pareto-like
intensity–duration marginals. Journal of Geophysical Research. Lett. 31, L04502, doi:10.1029/2003GL018767. Schmitt, T. G., Thomas, M. & Ettrich, N. 2004. Analysis and modeling of flooding in urban drainage systems.
Journal Of Hydrology (vol. 299 (3-4) pp. 300-311 Schmitt, T.G., Thomas, M. & Ettrich, N. 2005. Assessment of urban flooding by dual drainage simulation model
RisUrSim. Water Science And Technology vol. 52 (5) pp. 257-264 Smith, M.B. 2006. Comment on 'Potential and limitations of 1D modeling of urban flooding' by O. Mark et al. [J.
Hydrol. 299 (2004) 284-299]. Journal Of Hydrology vol. 321 (1-4) pp. 1-4 Thorndahl, S. & Willems, P., 2008. Probabilistic modelling of overflow, surcharge and flooding in urban drainage
using the first-order reliability method and parameterization of local rain series. In Water Reser. 42 pp.455-466 Yue, S. 2001. The Gumbel logistic model for representing a multivariate storm event. Adv. Water Resources. 24,
79–185