Uncertainty communication in environmental assessments ... · PDF fileUncertainty...
15
Uncertainty communication in environmental assessments: views from the Dutch science-policy interface J. Arjan Wardekker a,b, *, Jeroen P. van der Sluijs a , Peter H.M. Janssen b , Penny Kloprogge a , Arthur C. Petersen b a Department of Science, Technology and Society, Copernicus Institute for Sustainable Development and Innovation, Utrecht University, Heidelberglaan 2, 3584 CS Utrecht, The Netherlands b Netherlands Environmental Assessment Agency (PBL), P.O. Box 303, 3720 AH Bilthoven, The Netherlands 1. Introduction Scientific assessments of complex environmental risks, and policy responses to those risks, involve uncertainties of many sorts (Funtowicz and Ravetz, 1990). These uncertainties can be present in various stages of the policy cycle, ranging from the initial detection of a (possible) problem, to policy formulation and, eventually, monitoring and adjustments to existing policies. More research will not necessarily reduce uncertainty and decisions often need to be made before conclusive evidence is available (Risbey et al., 2005; Van der Sluijs, 2005; Van der Sluijs et al., 2005a,b; Wardekker and Van der Sluijs, 2005). Meanwhile, the potential impacts of wrong decisions on, for instance, health, economy, environment and credibility can be huge. Communication of uncertainties aimed at policymakers, as well as other parties involved in policymaking, is important because uncertainties can influ- ence the policy strategy that is selected. Furthermore, it is a matter of good scientific practice, accountability and openness towards the general public. The question of how to deal with environmental science & policy 11 (2008) 627–641 article info Published on line 7 July 2008 Keywords: Risk communication Uncertainty Probability Pedigree Science-policy interface Information needs abstract Scientific assessments of environmental problems, and policy responses to those problems, involve uncertainties of many sorts. Meanwhile, potential impacts of wrong decisions can be far-reaching. This article explores views on uncertainty and uncertainty communication in the Dutch science-policy interface and studies several issues concerning presentation of uncertainty information. Respondents considered uncertainty communication to be impor- tant, but it should be concise and policy relevant. Several factors influence policy relevance, including the place of an issue in the policy cycle, and its novelty, topicality and contro- versiality. Respondents held particular interest in explicit communication on the implica- tions of uncertainty. Related to this, they appreciated information on different sources and types of uncertainty and qualitative aspects of uncertainty (e.g. pedigree charts). The article also studies probability terms, particularly for IPCC’s 33–66% probability interval (‘about as likely as not’). Several terms worked reasonably well, with a median interpretation of 40– 60%. Finally, as various target groups have different information needs and different amounts of attention for various parts of a report or communication process, it is important to progressively disclose uncertainty information throughout the communication. Improved communication of uncertainty information leads to a deeper understanding and increased awareness of the phenomenon of uncertainty and its policy implications. # 2008 Elsevier Ltd. All rights reserved. * Corresponding author at: Copernicus Institute, Utrecht University, Heidelberglaan 2, 3584 CS Utrecht, The Netherlands. Tel.: +31 30 2533618; fax: +31 30 2537601. E-mail address: [email protected] (J.A. Wardekker). available at www.sciencedirect.com journal homepage: www.elsevier.com/locate/envsci 1462-9011/$ – see front matter # 2008 Elsevier Ltd. All rights reserved. doi:10.1016/j.envsci.2008.05.005
Transcript of Uncertainty communication in environmental assessments ... · PDF fileUncertainty...

Uncertainty communication in environmental assessments:views from the Dutch science-policy interface
J. Arjan Wardekker a,b,*, Jeroen P. van der Sluijs a, Peter H.M. Janssen b,Penny Kloprogge a, Arthur C. Petersen b
aDepartment of Science, Technology and Society, Copernicus Institute for Sustainable Development and Innovation,
Utrecht University, Heidelberglaan 2, 3584 CS Utrecht, The NetherlandsbNetherlands Environmental Assessment Agency (PBL), P.O. Box 303, 3720 AH Bilthoven, The Netherlands
e n v i r o n m e n t a l s c i e n c e & p o l i c y 1 1 ( 2 0 0 8 ) 6 2 7 – 6 4 1
a r t i c l e i n f o
Published on line 7 July 2008
Keywords:
Risk communication
Uncertainty
Probability
Pedigree
Science-policy interface
Information needs
a b s t r a c t
Scientific assessments of environmental problems, and policy responses to those problems,
involve uncertainties of many sorts. Meanwhile, potential impacts of wrong decisions can
be far-reaching. This article explores views on uncertainty and uncertainty communication
in the Dutch science-policy interface and studies several issues concerning presentation of
uncertainty information. Respondents considered uncertainty communication to be impor-
tant, but it should be concise and policy relevant. Several factors influence policy relevance,
including the place of an issue in the policy cycle, and its novelty, topicality and contro-
versiality. Respondents held particular interest in explicit communication on the implica-
tions of uncertainty. Related to this, they appreciated information on different sources and
types of uncertainty and qualitative aspects of uncertainty (e.g. pedigree charts). The article
also studies probability terms, particularly for IPCC’s 33–66% probability interval (‘about as
likely as not’). Several terms worked reasonably well, with a median interpretation of 40–
60%. Finally, as various target groups have different information needs and different
amounts of attention for various parts of a report or communication process, it is important
to progressively disclose uncertainty information throughout the communication.
Improved communication of uncertainty information leads to a deeper understanding
and increased awareness of the phenomenon of uncertainty and its policy implications.
# 2008 Elsevier Ltd. All rights reserved.
avai lab le at www.sc iencedi rec t .com
journal homepage: www.e lsev ier .com/ locate /envsc i
1. Introduction
Scientific assessments of complex environmental risks, and
policy responses to those risks, involve uncertainties of many
sorts (Funtowicz and Ravetz, 1990). These uncertainties can be
present in various stages of the policy cycle, ranging from the
initial detection of a (possible) problem, to policy formulation
and, eventually, monitoring and adjustments to existing
policies. More research will not necessarily reduce uncertainty
and decisions often need to be made before conclusive
* Corresponding author at: Copernicus Institute, Utrecht University, HTel.: +31 30 2533618; fax: +31 30 2537601.
E-mail address: [email protected] (J.A. Wardekker).
1462-9011/$ – see front matter # 2008 Elsevier Ltd. All rights reserveddoi:10.1016/j.envsci.2008.05.005
evidence is available (Risbey et al., 2005; Van der Sluijs,
2005; Van der Sluijs et al., 2005a,b; Wardekker and Van der
Sluijs, 2005). Meanwhile, the potential impacts of wrong
decisions on, for instance, health, economy, environment and
credibility can be huge. Communication of uncertainties
aimed at policymakers, as well as other parties involved in
policymaking, is important because uncertainties can influ-
ence the policy strategy that is selected. Furthermore, it is a
matter of good scientific practice, accountability and openness
towards the general public. The question of how to deal with
eidelberglaan 2, 3584 CS Utrecht, The Netherlands.
.
1 It should be noted that in many fields of science and policy (e.g.scenario analysis, safety policy, etc.) risk is the crucial evaluativefigure, which includes both probability and severity.
e n v i r o n m e n t a l s c i e n c e & p o l i c y 1 1 ( 2 0 0 8 ) 6 2 7 – 6 4 1628
‘deep’ uncertainties and limits to its quantification is central in
several fields which aim to improve the science-policy and
science-society interfaces (Guimaraes Pereira et al., 2006).
These fields are evolving around different concepts and
notions, such as complexity (Chu et al., 2003), resilience
(Holling, 1973), post-normal science (Funtowicz and Ravetz,
1993), trans-disciplinarity (Thompson Klein et al., 2001) and
the precautionary principle (EEA, 2001; Cooney, 2004; UNESCO
COMEST, 2005; Van der Sluijs, 2007). However, many scientists
believe that the general public is unable to conceptualise
uncertainties and that providing the public with information
on uncertainty would increase distrust in science and cause
panic and confusion regarding the risk (Frewer et al., 2003). In
contrast, focus groups with citizens have shown that citizens
in such a group context can take part in differentiated debates
about complex environmental issues that are blurred by
uncertainties (Kasemir et al., 2003). Furthermore, psychologi-
cal studies revealed no average change in perceived risk when
providing uncertainty information (although, for example,
some forms of presentation made it easier for people to either
refute a risk or justify heightened concern) (Kuhn, 2000).
However, clear and responsible communication on uncer-
tainties, whether addressed to professional policymakers or
the general public, is difficult and not always appreciated. The
interest of target audiences often seems limited or variable
over issues and time. Uncertainty information is often
considered difficult to understand, and strategic use is
possible (people may use it merely to further their personal
goals, for example, by ignoring/trivialising or emphasising it;
see e.g. Hellstrom, 1996; Blanke and Mitchell, 2002; Neutra
et al., 2006; Michaels, 2005). Various approaches to the
communication and presentation of uncertainty have been
developed, but not all are easy to understand by non-technical
audiences, and they can also unexpectedly lead to misinter-
pretation.
The Third Assessment Report of the Intergovernmental
Panel on Climate Change (IPCC, 2001) offered two forms of
communication on uncertainties: the use of words to reflect
different levels of certainty (probability or confidence), and the
use of graphics (Moss and Schneider, 2000; Ha-Duong et al.,
2007; Swart et al., 2008). The verbal approach used a seven-
point scale of terms of likelihood that a particular statement is
true: extremely unlikely (<1%), very unlikely (1–10%), unlikely
(10–33%), medium likelihood (33–66%), likely (66–90%), very
likely (90–99%), and virtually certain (>99%). A similar, five-
point scale was used for confidence, together with a quadrant
depicting ‘‘level of consensus’’ and ‘‘amount of evidence’’. The
more recent IPCC Guidance Notes (IPCC, 2005) and IPCC
Working Group I Summary for Policymakers (IPCC, 2007) for
the Fourth Assessment Report implement several changes, for
instance, the ‘‘medium likelihood’’ label was replaced by
‘‘about as likely as not’’ (although this category was not
applied in the main conclusions). Alternatives to the IPCC
scale exist, for example, the twelve-point Weiss scale, which
describes the level of certainty in terms of the degree to which
evidence is convincing (Weiss, 2003, 2006), and the seven-
point scale by Renooij and Witteman (1999) and Witteman and
Rinnooij (2003). The advantage of using words is that people
are better at hearing/reading, using and remembering risk
information described in words, rather than in numbers.
However, using words results in loss of precision, and words
have different meanings for different people (Wallsten et al.,
1986), resulting in broad ranges of probabilities associated
with each term by different members of the audience
(Wardekker and Van der Sluijs, 2005; Wallsten et al., 1986).
On the other hand, this disadvantage may remedy the
tendency of experts to be overly precise and underestimate
the uncertainty associated with their own predictions (cf.
Slovic et al., 1981). Broad ranges and wordings may more
accurately reflect the limited state of knowledge. A fixed
scale’s consistent use of language (fixing probability terms to
probability intervals) makes it easier to remember and
consistent messages are perceived as more credible. A
disadvantage is that a fixed scale does not match people’s
intuitive use of probability language. As Patt and Schrag (2003)
have shown, people translate such language by taking the
event magnitude (severity of effects) into account.1 For
example, an ‘unlikely’ hurricane is interpreted as less likely
(in percentage of probability) than an ‘unlikely’ rain shower.
This may result in an overestimation of the probability of low
magnitude events and an underestimation of the probability
of high magnitude events, when a fixed scale is used for
communication. Problems appear to be most pronounced
when dealing with predictions of one-time events, where
probability estimates result from a lack of complete con-
fidence in the predictive models. In general, the context of an
issue influences the interpretation and choice of uncertainty
terms (see e.g. Wallsten and Budescu, 1990; Flugstad and
Windschitl, 2003; Patt and Schrag, 2003; Patt and Dessai, 2005;
Wardekker and Van der Sluijs, 2005). Another issue concern-
ing the use of scales is that it favours attention to quantifiable
and probabilistic uncertainty. It is much harder to address
‘deep uncertainty’ (e.g., problem-framing uncertainty, meth-
odological unreliability or recognised ignorance) (Wardekker
and Van der Sluijs, 2005; Petersen, 2006; Risbey, 2007).
Surprisingly little research has been done on graphical
communication, the main exception being Ibrekk and Morgan
(1987). Some general remarks can be made. Graphical
communication has the advantage of conveniently summar-
ising significant amounts of uncertainty information (Ibrekk
and Morgan, 1987; Wardekker and Van der Sluijs, 2005;
Krupnick et al., 2006). Its major disadvantage is that most
graphical expressions are not straightforward to understand.
Especially when communicating with people who are not
used to working with these expressions, this may become
problematic. Policymakers prefer simple forms of commu-
nication, such as probability density functions (PDFs) and
tables, rather than the complex graphics commonly used and
favoured by analysts (Krupnick et al., 2006). Graphs can also
easily mislead the user. In general, displays that explicitly
contain the information that people are looking for, perform
best. As with the verbal approach, communication of deep
uncertainty seems difficult (Wardekker and Van der Sluijs,
2005).
The Netherlands Environmental Assessment Agency
(current Dutch acronym: PBL; until May 2008: MNP – which
e n v i r o n m e n t a l s c i e n c e & p o l i c y 1 1 ( 2 0 0 8 ) 6 2 7 – 6 4 1 629
is used here) has been actively reflecting on its assessment and
communication of uncertainties over the past few years. It is a
government funded agency that performs independent
scientific assessments and policy evaluations of human
impact on the environment. Until 2006, it was affiliated with
the Dutch National Institute for Public Health and the Environment
(RIVM). The reflection process was initiated by discussions in
media and politics on the reliability of modelling studies (Van
Asselt, 2000; Van der Sluijs, 2002; Petersen, 2006), followed by
calls to more systematically address uncertainty. A ‘‘Guidance
for Uncertainty Assessment and Communication’’ (Van der
Sluijs et al., 2003; Janssen et al., 2005; Petersen, 2006) was
developed by MNP/RIVM and Utrecht University. The MNP
applied the Guidance in the Environmental Balance 2005
(MNP, 2005). The MNP’s Environmental Balance (‘State of the
Environment’) reports are yearly reports, describing the state
of the (Dutch) environment and evaluating policy influences.
National-level policymakers are the main target audience of
these reports. This paper presents and analyses a series of
experiments evaluating uncertainty communication in the
Environmental Balance 2005. These experiments were also
meant to generate input for the MNP. The experiments aimed
at answering the following questions: How do target audi-
ences perceive uncertainty and its communication? How do
they use uncertainty information? What are their needs and
desires with respect to uncertainty information? What is their
opinion on the present practice of uncertainty communication
in the Environmental Balance? How do several existing and
new forms of presentation perform, and how could they be
improved?
The first part of this paper (Sections 3 and 4) deals with
views on, and demand for uncertainty information/commu-
nication. The second part (Section 5) deals with how to best
present this information. This paper present results from a
number of experiments. To improve readability, the sections
containing the results include both direct experimental results
and their interpretation (preventing the need for readers to
continually refer to various earlier sections when reading the
interpretations).
2. Methodology
The MNP and Utrecht University initially explored the issue of
uncertainty communication during an Expert Meeting with 19
international experts on uncertainty, assessing the state-of-
the-art and promising experiments for future research
(Wardekker and Van der Sluijs, 2005). The meeting provided
the basis for the experimental set-up of this study (Table 1).
This meeting was followed by several communication
experiments, employing two methods: computer-assisted
Table 1 – Overview of research setup
Design Ex
Exploratory
1. Expert meeting uncertainty experts 2. Workshop scientis
3. Workshop student
workshops at Utrecht University’s Policy Laboratory and an
electronic survey (Kloprogge and Van der Sluijs, 2006a,b;
Wardekker and Van der Sluijs, 2006a,b,c; Kloprogge et al.,
2007). The Policy Laboratory is a meeting room designed for
computer-assisted meetings, using a Group Decision Support
System (GDSS) (Turban and Aronson, 1998; GroupSystems,
2002). Computer-facilitated workshops are similar to focus
groups, but structured and enhanced with various interactive
tools. Participant input can be collected using, for example,
surveys or various brainstorming tools. Input can be priori-
tised, categorised, or returned to the participants, for use in
discussion or for collecting additional input. An advantage of
computer-assisted discussion over normal discussion is that
more input can be collected in a shorter time and that more
vocal participants will not drown out other participants’ input.
This method was employed because it allows for a real-time
exchange of opinions, feedback of results, brainstorming and
discussions. A drawback is that it only allows for a small
number of participants and is time-consuming, for both
participants and researchers. Electronic surveys allow for
more participants and can be less time-consuming, but do not
allow for interaction and brainstorming. The survey was used
to complement and check results from the workshops in a
larger and more diverse group. The workshops used combina-
tions of surveys (quick opinion gathering with multiple-
choice, agree-disagree (five-point scale), allocate-100-points,
and short open questions), brainstorms (more thorough
collection and exchange of opinion), and discussion. A
handout containing examples of, for instance, presentation
formats was used during some parts of the workshops. The
electronic survey employed both multiple-choice and open
questions.
The first workshop was a case study with 13 experts on
particulate matter (Kloprogge and Van der Sluijs, 2006a). It
intended to collect views on uncertainty communication
(experiences, content and criteria) from a researcher/expert’s
point of view and used the MNP Guidance for Uncertainty
Assessment and Communication (Janssen et al., 2005) to
structure the discussion. The particulate matter case was
chosen because of its topicality in the Netherlands. The
second workshop had the character of a try-out and focused
on the Environmental Balance, using a convenience sample of
9 undergraduate students in a course on risk management
(Kloprogge and Van der Sluijs, 2006b). The workshop intended
to experiment with people unfamiliar with the context of the
studies (Environmental Balance reports, uncertainty), spotting
problems with presentation formats and fine-tuning the
experimental design for the targeted workshops.
Participants in the experiments that followed, were users
of the Environmental Balance, and were chosen from the
complete list of all people to whom the MNP had distributed a
perimental workshops Validation
Targeted
ts 4. Workshop policymakers 6. Survey
s 5. Workshop policy advisors
e n v i r o n m e n t a l s c i e n c e & p o l i c y 1 1 ( 2 0 0 8 ) 6 2 7 – 6 4 1630
copy of the Environmental Balance 2005 (n � 3000). Within this
population we identified several subgroups of interest to
sample from for the workshops and survey: national policy-
makers at ministries (n = 197), regional and local policymakers
(n = 102), and stakeholders and policy advisors, active in the
science-policy interface (n = 148).
The third workshop included seven policymakers (War-
dekker and Van der Sluijs, 2006a). Policymakers are the
Environmental Balance’s main target audience and, therefore,
a key group to include in this study. This group of seven
policymakers was put together by random and non-random
sampling from the subgroups ‘‘national policy makers’’ and
‘‘regional and local policy makers’’. The non-random factor in
the sampling favoured those policymakers that had an active
involvement in reviewing draft texts of the Environmental
Balance (this subgroups of n = 10 was identified in close
consultation with MNP). They received invitations in writing
and by telephone. From the remaining subgroup of policy-
makers participants were randomly selected and invited by
email. It was difficult to find policymakers who were willing to
invest 4 h of their time to participate in the workshop (non-
random factor in the sampling: bias towards those who would
have an interest in the subject), and who would be available at
the time of the workshop (random factor in the sample). To
increase their willingness to participate, they were offered the
prospect of a book token of 25 euros in return for their efforts
and reimbursement of travel expenses. The Hague was chosen
as the location for the workshop, very close to the ministries to
minimise the travelling time for the participants.
The fourth workshop included nine policy advisors, who
were mainly professional consultants (Wardekker and Van der
Sluijs, 2006b), strongly involved in the science-policy interface.
The sampling was done as follows: from the subgroup
‘‘stakeholders and policy advisors’’ we invited people who
are considered active users of the Environmental Balance, and
based our selection on the requirement of a diversity of
affiliations. This led to about 40 invitations. Within the
workshop there turned out to be an overrepresentation of
professional consultants, compared to NGO representatives.
This apparently stemmed from their greater willingness to
participate and their availability on the date set for the
workshop.
The electronic survey included 29 respondents (two
respondents did not reply to the multiple-choice questions
and, therefore, are not included in presented quantitative
results). It was conducted among all identified subgroups, and
included policymakers (59%) and representatives from
science, NGOs, companies and other organisations (Wardek-
ker and Van der Sluijs, 2006c).
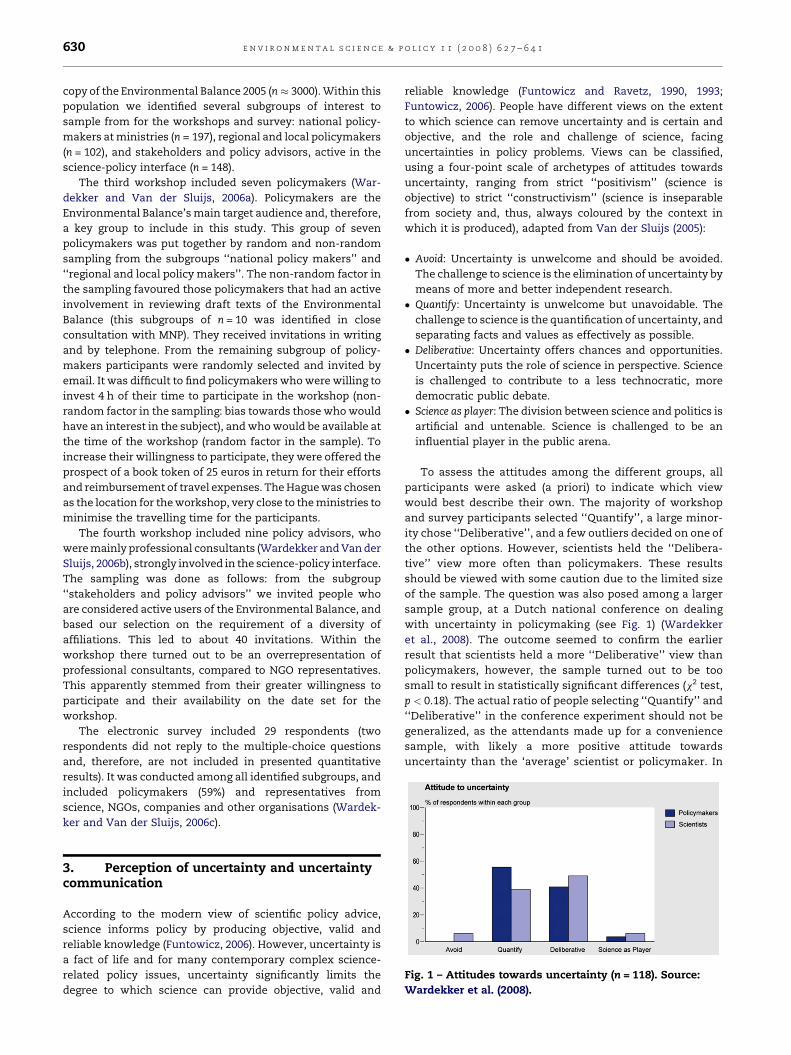
Fig. 1 – Attitudes towards uncertainty (n = 118). Source:
Wardekker et al. (2008).
3. Perception of uncertainty and uncertaintycommunication
According to the modern view of scientific policy advice,
science informs policy by producing objective, valid and
reliable knowledge (Funtowicz, 2006). However, uncertainty is
a fact of life and for many contemporary complex science-
related policy issues, uncertainty significantly limits the
degree to which science can provide objective, valid and
reliable knowledge (Funtowicz and Ravetz, 1990, 1993;
Funtowicz, 2006). People have different views on the extent
to which science can remove uncertainty and is certain and
objective, and the role and challenge of science, facing
uncertainties in policy problems. Views can be classified,
using a four-point scale of archetypes of attitudes towards
uncertainty, ranging from strict ‘‘positivism’’ (science is
objective) to strict ‘‘constructivism’’ (science is inseparable
from society and, thus, always coloured by the context in
which it is produced), adapted from Van der Sluijs (2005):
� A
void: Uncertainty is unwelcome and should be avoided.The challenge to science is the elimination of uncertainty by
means of more and better independent research.
� Q
uantify: Uncertainty is unwelcome but unavoidable. Thechallenge to science is the quantification of uncertainty, and
separating facts and values as effectively as possible.
� D
eliberative: Uncertainty offers chances and opportunities.Uncertainty puts the role of science in perspective. Science
is challenged to contribute to a less technocratic, more
democratic public debate.
� S
cience as player: The division between science and politics isartificial and untenable. Science is challenged to be an
influential player in the public arena.
To assess the attitudes among the different groups, all
participants were asked (a priori) to indicate which view
would best describe their own. The majority of workshop
and survey participants selected ‘‘Quantify’’, a large minor-
ity chose ‘‘Deliberative’’, and a few outliers decided on one of
the other options. However, scientists held the ‘‘Delibera-
tive’’ view more often than policymakers. These results
should be viewed with some caution due to the limited size
of the sample. The question was also posed among a larger
sample group, at a Dutch national conference on dealing
with uncertainty in policymaking (see Fig. 1) (Wardekker
et al., 2008). The outcome seemed to confirm the earlier
result that scientists held a more ‘‘Deliberative’’ view than
policymakers, however, the sample turned out to be too
small to result in statistically significant differences (x2 test,
p < 0.18). The actual ratio of people selecting ‘‘Quantify’’ and
‘‘Deliberative’’ in the conference experiment should not be
generalized, as the attendants made up for a convenience
sample, with likely a more positive attitude towards
uncertainty than the ‘average’ scientist or policymaker. In

e n v i r o n m e n t a l s c i e n c e & p o l i c y 1 1 ( 2 0 0 8 ) 6 2 7 – 6 4 1 631
the workshops and survey (n = 65) the ratio was roughly 3:1
in favour of ‘‘Quantify’’.
The workshop and survey participants considered uncer-
tainty information to be important to policymaking, scientific
and societal debate, and to their own work. However, they
noted that uncertainty information should be politically and
policy relevant, as well as clear, understandable, diverse and
precise. Policymakers expressed that assessment reports,
such as the annual Environmental Balance, should not
contain every nuance of uncertainty, but put forward only
the most relevant messages. Uncertainty information was
seen as important to put issues on the agenda, to prioritise
them, and to phase the policy process. The workshops and
survey also revealed other applications of uncertainty
information, including: (1) to more realistically assess the
effectiveness and efficiency of policy measures, (2) to be used
as an argument in support of one’s own conclusions and to
undermine proposals that do not suit one’s interest or
agenda, (3) to weigh information and the risks of using
information (which may turn out to be incorrect), (4) to
determine the desirability of actions, (5) to estimate the
plausibility of scenario’s and trends, and (6) to develop a
vision on future government policy (e.g. development of new
policies, or estimating risks for corporate management).
Participants noted that providing uncertainty information
prevents false certainty, waste of money, and decisions based
on insufficient information. We found that policy advisors
use uncertainty information for finding policy options and
they considered it useful for clarifying options, choices and
opinions.
While considered important, uncertainty information has
its drawbacks. According to the participants, it can lead to
difficulties in negotiations and weaken policy proposals. An
‘‘overdose’’ could, in their opinion, paralyse and lead to
unnecessary discussion and delay of action. Selective and
strategic use of uncertainty information was said to be a
problem in many cases. Some participants also considered
interpretation and use of uncertainty information to be
difficult in their own daily practice. Preliminary results from
another study indicate that policymakers often were not
aware of uncertainty information, or did not know how to
deal with it. Consequently, the actual use is limited (De Vries,
2007). Several policy advisors and survey participants
considered it problematic that uncertainties are often
stressed in environmental issues, while little or no uncer-
tainty is communicated in other policy domains (e.g.
economy). According to participants, this can give the
impression that environmental issues and policy are much
more uncertain than those of other policy domains,2 while
this is not necessarily the case. Moreover, added complexity
due to uncertainty information may confuse the general
public. Finally, some suggested that uncertainty commu-
nication could also be seen as a way for researchers to avoid
giving definite answers. Despite these issues, transparency
was deemed highly important.
2 Similarly, new policy proposals which include uncertaintyinformation could appear more uncertain than previous strategieswithout such information.
4. Demand for uncertainty information
Uncertainty information has various target audiences. A clear
choice of target audience, or at least the most important
audiences, is highly important for ‘what and how’ to
communicate uncertainty in an environmental assessment.
The Environmental Balance reports are intended for national
policymakers. Consequently, while policymakers were fairly
content with the amount and type of uncertainty information
in the document, policy advisors noted that ‘‘the information
in the Environmental Balance does not cater to the needs of
people working with numbers’’ (Wardekker and Van der Sluijs,
2006b). However, such a mismatch is not necessarily a
problem. The policy advisors were well aware that the main
target audience (policymakers) had different information
needs. The advisors could obtain their information from
other sources.
4.1. Interest in uncertainty information: general andspecific topics
Survey respondents were asked to indicate on which topics
they would like to see uncertainty information in the
Environmental Balance, for themselves, and for the main
target audience (policymakers). Interest was surprisingly
broad. Selecting from a list of topics, survey respondents
(n = 27) expressed most interest in uncertainty information on
environmental effects of policy (70% for themselves, 74% for
the target audience), reaching policy goals (63% for them-
selves, 70% for the target audience), and severity of environ-
mental problems (67% for themselves, 59% for the target
audience). They expressed the least interest in uncertainty
concerning environmental quality (33% for themselves, 37%
for the target audience) and in expected future policy
developments (22% for themselves, 41% for the target
audience). Differences between their own interests and those
for the main target audience remained small, probably due to
the large percentage of policymakers in the sample. Partici-
pants in the policymakers workshop were mainly interested in
uncertainty information on reaching policy goals. They
considered this to be the main topic of the Environmental
Balance. However, they noted that uncertainty information
should be much broader for environmental issues which are
topical, controversial, or relatively new.
Furthermore, workshop and survey participants were
asked to suggest specific topics on which they would like
more uncertainty information. Three main categories could be
discerned: topical issues (e.g. air quality and particulate
matter, which have received much media attention in the
Netherlands due to problems with meeting European stan-
dards), issues on which there is little to no uncertainty
communication while uncertainties do play an important role
(e.g. external safety and flooding hazards), and matters which
are important for finding, selecting and prioritising policy
responses (e.g. sources and types of uncertainty, differentia-
tion in time and spatial scale, and uncertainties in health
effects of various environmental stressors). Policymakers as
well as policy advisors considered uncertainties surrounding
the economic effects of policies to be important. The policy
advisors disagreed with the policymakers’ preference for the

e n v i r o n m e n t a l s c i e n c e & p o l i c y 1 1 ( 2 0 0 8 ) 6 2 7 – 6 4 1632
focus of uncertainty information in the Environmental
Balance to be on reaching policy goals, and they called for a
much broader set of topics. In particular, they called for more
explicit information on the solidity of the presented numbers,
for instance, by adding a margin of accuracy, to make
policymakers more aware of the sometimes limited solidity
and accuracy of presented numeric information.
The policy relevance of uncertainty information on
various topics around a particular environmental issue,
depends on the issue’s stage in the policy cycle. Upon
recognition of a problem and agenda setting, information
related to fundamental issues such as problem framing, level
of scientific understanding, methodology, environmental
quality, causes and impacts is relevant. During policy
formulation, uncertainties around impacts, emission data,
scenarios, and expected policy effects (environmental,
economic, social) are relevant. During the implementation
and monitoring/control phases, uncertainties around emis-
sion data, projections, environmental quality, and actual and
expected policy effects are important. Questions from earlier
phases regain relevance when policy is evaluated, or when an
issue is topical or controversial. The choice of the target
audience is again important. For example, differentiation in
spatial scale may be relevant to actors at a regional level, but
may provide too much information for a national level. One
could publish information that is relevant for audiences other
than the primary target audience in, for instance, a back-
ground document.
Based on the workshops and earlier experiences, the
following situation-specific factors3 can be posed, which
may increase the policy relevance of uncertainty: (1) when
being wrong in one direction could carry more serious
consequences than being wrong in the other (also see
Manning et al., 2004), (2) when uncertain outcomes can have
a large influence on policy advice, (3) when indicators are close
to policy goal or threshold, (4) when there is the possibility of
large effects or catastrophic events, (5) in cases of societal
controversy, (6) when value laden choices are in conflict with
interests or views of stakeholders, and (7) when public distrust
in outcomes that show low risk can be expected.
4.2. Sources and types of uncertainty
The policy advisors emphasised particular interest in the
various types and behind-the-scenes causes of uncertain-
ties, such as modelling-uncertainty and scenario-uncer-
tainty. They noted that insight in these aspects is relevant
for finding and selecting policy responses, for example,
monitoring or performing more research on specific issues.
In their workshop, policymakers noted that uncertainty is a
much more complex issue than becomes apparent from the
graphs and texts of the Environmental Balance. Aspects,
such as uncertainties due to the quality and accuracy of
monitoring techniques and level of knowledge, play a role,
as well as the origin and/or use of models, scenarios,
3 The precautionary principle (e.g. UNESCO COMEST, 2005; Vander Sluijs, 2007; Cooney, 2004) is an often suggested heuristic forpolicymaking in situations characterized by one or more of thesefactors.
worldviews, values, and underlying assumptions. Or, as one
respondent in the survey noted: ‘‘uncertainty is often
translated in terms of absence of risk, but it should also
be about issues such as uncertainty about the hypothesis,
the empirical data, and about fundamental issues, such as
the chosen methodology and the posed causal relations’’
(Wardekker and Van der Sluijs, 2006c). The survey respon-
dents (n = 27) were asked whether the Environmental
Balance should pay more attention to the sources/causes
and different types of uncertainty. Many were positive (30%
agreed, 11% strongly agreed), but just as many were hesitant
(30% neutral, 15% do not know/no opinion). The consulted
policymakers were unsure whether users of the Environ-
mental Balance would be interested in such information.
Most of them preferred this information to be added to the
appendices, not the main text of the report, except for when
it concerned topical issues. One person noted that it would
be useful to add a description of the origin of the
uncertainties.
4.3. Implications of uncertainty
Policy advisors considered sources and types of uncertainty to
be important issues, because of the implications for policy.
However, a policymaker noted that it is not always clear why
knowledge of the uncertainties is important. Survey respon-
dents (n = 27) were strongly in favour of paying more attention
in the Environmental Balance to the implications of uncer-
tainty: 37% strongly agreed and 37% agreed. Apparently, many
participants consider sources and types of uncertainty
important, but they, typically, would prefer the MNP to
incorporate this information more directly into the implica-
tions. In general, the way in which such an incorporation
could be done, depends on the objectives of the assessment
organisation. In the end, policymakers are making the policy
decisions, whether or not implications of uncertainty have
been included in the assessments. However, it remains useful
to reflect on the possible implications of uncertainties, thereby
providing decision makers with some perspectives on how to
deal with those uncertainties.
4.4. Recalculations
Another issue pointed out by the workshop participants, is
the phenomenon of recalculations. That is, recalculating
and modifying past estimates (e.g. emission data), based on
progressing insights. A striking example of this, is the
Dutch ammonia emission data for the year 1995, as reported
in the Environmental Balances between 1996 and 2002 (see
Fig. 2). The effect of the recalculations of these data is of the
same order of magnitude as the 2002 2s interval (technical
uncertainty, not including methodological uncertainty)
(Honingh, 2004). The policymakers considered this phenom-
enon to be very confusing and noted that the Environmental
Balance does not always show clearly that recalculations
were done, or why. Most survey respondents (n = 27)
agreed with the policymakers that the Environmental
Balance should pay specific attention to this phenomenon:
19% strongly agreed, 53% agreed, and 22% remained
neutral.

Fig. 2 – Dutch ammonia emissions in 1995, as reported in
different Environmental Balances. Error bars indicate 2s
intervals (technical uncertainty, first reported in 2001).
Source: Honingh (2004).
e n v i r o n m e n t a l s c i e n c e & p o l i c y 1 1 ( 2 0 0 8 ) 6 2 7 – 6 4 1 633
5. Presentation of uncertainty information
Authors make choices on whether uncertainty information is
presented by using text or graphs, on its place in the report,
and the way in which it is communicated. Several approaches,
current and new, were evaluated during the workshops and
survey. This section deals with several issues of interest
related to presentation: probability terms, presenting different
types of uncertainty, qualitative aspects of uncertainty, and
the place of uncertainty information in reports.
5.1. Probability terms
In the Environmental Balance 2005, the MNP systematically
communicates uncertainties by using, among other things, a
fixed scale of probability terms (translation of the IPCC scale),
coupled with colour codes. The IPCC scale is easy and
appealing, as it is already widely used. However, its central
term, ‘‘medium likelihood’’ (33–66% probability), proved to be
problematic in use and translation. Apparently, its use is
disputed within IPCC, as well. The Uncertainty Guidance Notes
for the Fourth Assessment Report replaced the term with
‘‘about as likely as not’’ (IPCC, 2005), and the WG I Summary for
Policymakers used ‘‘more likely than not’’ for 50–66% (IPCC,
2007). Literal translation to Dutch would result in ‘‘middel-
grote waarschijnlijkheid’’, but the MNP opted for ‘‘fifty-fifty;
circa 50%’’ (derived from ‘‘tossup’’ in Morgan (2003)). Earlier
studies have shown that people’s interpretation of probability
terms results in broad ranges of estimated probabilities (e.g.
Wallsten et al., 1986; Morgan, 1998, 2003). During the work-
shops and survey, several experiments were conducted on
how the terms of the IPCC scale are interpreted. The scale
already attaches a range to a given term, rather than a single
probability. The experiments aimed to determine whether
people’s interpretation of various probability terms matched
the range provided by IPCC. On the one hand, participants
were given various probability terms (intended for the range of
33–66%) and asked to estimate a probability range (. . .% to
. . .%). On the other hand, people were given the probability
range of 33–66% and asked to provide a suitable term for this
range. These participant-designed terms were then tested in
later workshops and the survey.
Participants’ interpretations of various terms are shown in
Fig. 3. The figure shows the ranges of lower and upper border
estimates and the median for each estimate. ‘‘Fifty-fifty’’
performed reasonably well, most estimates being 40–60% or
45–55%. Several people indicated that it could be anything,
placing the range at 0–100%. Individual estimates of policy-
makers and students were dominated by one answer,
resulting in medians at the ranges’ extremes. With an overall
median estimate of 40–60%, the term was interpreted more
narrowly than intended. The term ‘‘circa even waarschijnlijk
als onwaarschijnlijk’’ (IPCC’s new ‘‘about as likely as not’’)
performed similarly, the difference being several estimates of
a flat 50%. The term ‘‘middelgrote waarschijnlijkheid’’ (IPCC’s
old ‘‘medium likelihood’’) did not do well. Estimates of the
lower border ranged from 0 to 80%, of the upper border from 25
to 100%. The median estimate was 50–75%; higher than
intended. When asked to suggest a term for the interval of 33–
66%, suggestions diverged greatly, ranging from ‘‘cannot be
determined’’ to ‘‘to be expected’’ to ‘‘not to be expected’’. The
two possibly suitable terms (‘‘very well possible’’ and ‘‘to be
expected’’) were tested in the survey. They did not perform
well, considering the overlapping lower and upper border
estimates, and high medians.
If the Dutch experiment is any indication of interpretation
of the English terms, IPCC’s switch to ‘‘about as likely as not’’
seems a good move. While this term performed well, ‘‘medium
likelihood’’ did not. The results also show that, while terms
such as ‘‘fifty-fifty; about 50%’’ and ‘‘about as likely as not’’
result in broad estimated ranges, these ranges match IPCC’s
probability range fairly well. As these terms were interpreted
somewhat more narrowly than the intended range, it could be
useful to provide additional information in cases where
probability can be placed near the borders of the range.
Discussion and comments during the workshops and survey
suggested that the diversity in participant-suggested terms
might be due to differences in perceived need for additional
policy. This would be consistent with literature findings,
which indicate that choice and interpretation of terms depend
on context (Wallsten and Budescu, 1990; Flugstad and Wind-
schitl, 2003; Patt and Schrag, 2003; Patt and Dessai, 2005). For
example, interpretations can depend on expected impacts,
expected effectiveness of policy measures, or strategic
considerations.
5.2. Presenting different sources of uncertainty
Two sources of uncertainty, which are communicated in
environmental assessments, are projection-uncertainty
(uncertainty in prediction of future emissions) and monitor-
ing-uncertainty (uncertainty in measurement of emissions).
The MNP elected to communicate only the projection-
uncertainty in cases of relative policy goals (e.g., reduction
of emissions with x% compared with that of year y), and to
communicate both projection-uncertainty and monitoring-
uncertainty in cases of fixed goals (reduction of emissions with
x tons compared with that of year y). Monitoring-uncertainty,
which is calculated as a fixed percentage of emissions, is less
relevant to a relative goal, as it is assumed to be the same

Fig. 3 – Estimated probability intervals (. . .% to . . .%) for ‘‘medium likelihood’’ probability terms.
e n v i r o n m e n t a l s c i e n c e & p o l i c y 1 1 ( 2 0 0 8 ) 6 2 7 – 6 4 1634
percentage in both reference and goal year. However, it is
relevant when a goal is fixed, as changes in emissions to those
of a reference year change the required policy effort. Fig. 4
shows both situations.
During the workshops, experiments were conducted in
which participants were confronted with figures presenting
either projection-uncertainty or monitoring-uncertainty, or
both (e.g. Fig. 4a as presented above, as well as a version that
included monitoring-uncertainty), with and without textual
explanation of what was included and/or why. Participants
were asked a series of closed and open-ended questions to
determine their understanding and interpretation of the
graphs, followed by discussion of the results. Conclusions
from the workshop were then tested during the survey, by
means of multiple-choice questions.
In the graphs, it is not always clear what is communicated,
and why and when. However, both sources of uncertainty
have different strategies for reducing uncertainty and differ-
ent policy implications. Textual explanation proved difficult to
interpret due to the technical nature of this issue; for example,
the differences between the two sources of uncertainty and
the reasons for including them or not, required thorough
explanation. Several of the workshop participants remarked
that the problem with the above reasoning of which source of
uncertainty to include, is that relative targets tend to become
fixed targets later on, for example when an emission ceiling is
set and emission rights are granted. The participants in the
survey and those in the workshops with policymakers and
advisors all wanted the MNP to communicate both the
projection-uncertainty and the monitoring-uncertainty,
regardless of the type of goal. However, policymakers and
survey respondents thought that monitoring-uncertainty
should be placed in the appendices, unless it had direct
consequences for policy. Respondents differed on whether
these uncertainties should be communicated within the same
or in different graphs, but agreed that a distinction should be
made. Suggestions included a set of three graphs (projection,
monitoring, both), an online interactive graph, and adding
projection-uncertainty as grey area around the projection and
monitoring-uncertainty as an error bar.
5.3. Qualitative aspects of uncertainty
‘Deep’ uncertainties cannot be easily quantified or expressed
probabilistically and are hard to communicate using tradi-
tional methods, such as probability terms, uncertainty ranges,
and error bars. Among these uncertainties are qualitative
issues, such as problem framing, choice of methods, general
level of knowledge and value-ladenness. The participants
expressed an interest in such information. Both verbal and
graphical approaches, dealing with these qualitative aspects,
were included in an evaluation of various presentation
formats, during the workshops and survey. Respondents were
asked, using closed and open-ended questions and open
discussion, to evaluate these approaches on several criteria
and to voice initial impressions and interpretations.
One verbal approach to communicate qualitative aspects is
to add a level-of-knowledge indicator. The wording in the

Fig. 4 – (a) Projection-uncertainty in greenhouse gas emissions. (b) Monitoring-uncertainty and projection-uncertainty in
NOx emissions (arrows indicate contribution of five policy measures that have been implemented since 1990). Modified
from MNP (2005).
e n v i r o n m e n t a l s c i e n c e & p o l i c y 1 1 ( 2 0 0 8 ) 6 2 7 – 6 4 1 635
graph of radiative forcing due to various greenhouse gasses, in
the IPCC Third and Fourth Assessment Reports (IPCC, 2001,
2007), is a well-known example. The graph lists the ‘‘level of
scientific understanding’’ (LOSU) for each forcing under the
graph using the scale ‘‘high, medium, low, very low’’. A similar
MNP graph was tested in the policy advisors workshop. A more
extensive verbal approach would be to provide a section of text
on qualitative uncertainties.
Another approach is to use graphics. One could rate
several qualitative aspects of uncertainty and depict them in
diagram. The NUSAP system for uncertainty assessment
includes such a ‘‘Pedigree’’ Assessment, in which the
Fig. 5 – Example pedigree chart. Gradient ranges from red (low)
interpretation of the references to color in this figure legend, th
strength of research results is evaluated, looking at the
background and foundation of these results (Funtowicz and
Ravetz, 1990; Groenenberg and Van der Sluijs, 2005; Van der
Sluijs et al., 2005a,b,c). A set of qualitative criteria is rated, by
means of individual expert judgments, on a scale of 0 (weak)
to 4 (strong) giving a description of each rating on the scale.
The criteria may vary, depending on the audience and case at
hand. Common criteria include: quality of proxy, empirical
basis, theoretical understanding, methodological rigor, vali-
dation, and value-ladenness. The results can be plotted in, for
example, a radar diagram or kite diagram (Moss and
Schneider, 2000; Van der Sluijs et al., 2005a). In practice,
to green (high). For value-ladenness, this is reversed. (For
e reader is referred to the web version of the article.)

e n v i r o n m e n t a l s c i e n c e & p o l i c y 1 1 ( 2 0 0 8 ) 6 2 7 – 6 4 1636
these figures revealed several problems: they are not
straightforward to understand, and can be misleading as
they invite to compare area sizes, while these strongly
depend on the arrangement of the criteria in the graph
(Wardekker and Van der Sluijs, 2005). A new approach was
developed during the workshops: the Pedigree Chart (see
Fig. 5). Average pedigree scores are placed on a gradient of red
to green (bad to good). Margins (e.g., ‘error bars’) can be added
to reflect the range of individual expert scores. The chart uses
the same traffic-light analogy as a kite diagram, but is easier
to interpret and less likely to mislead.
Participants considered the level-of-knowledge indicator to
be a useful approach, but noted that it suggests a correlation
between the level of understanding and the uncertainty in
data presented in the graph (e.g., the error bars in the radiative
forcings in the IPCC graph). However, this is not necessarily
the case. Furthermore, the approach is fairly simplistic and
does not provide insight in the background of the uncertain-
ties, policy implications or strategies to reduce uncertainties.
Policymakers liked to be provided with some background text
on qualitative aspects, but preferred such information to be
placed in the appendices, except for topical issues.
The policy advisors were very enthusiastic about the
Pedigree Chart. According to them, it gives a quick overview
of qualitative uncertainties and is very useful for relativising
presented data. The majority would like to see such graphs in
the main text of the Environmental Balance. However, the
present criteria (Proxy, Empirical basis, etc.) would require
explanation, or could be replaced by more straightforward
alternatives. More than half of the survey respondents (n = 27)
agreed that such figures should be added to the Environmental
Balance: 7% strongly agreed, 44% agreed, 19% remained
neutral, 19% disagreed. The respondents were divided on
Table 2 – Suggested general guidelines on the contents, styledifferent PDI (progressive disclosure of information) layers
Outer layers
Contents Uncertainties can be integrated in the message (i
using words such as ‘‘may’’ or ‘‘might’’)
Uncertainties as essential contextual information
assessment results
Uncertainties translated to the political and socie
Emphasis on policy relevance of uncertainties
Emphasis on implications of uncertainties
Implications of uncertainties for the assessment
and the policy advice given
Style Scientific information translated into ‘common la
Use of jargon to be avoided
Degree of detail Details only if considered policy relevant
whether such figures should be added to the main text. Survey
respondents preferred the graphical approach above adding
the textual information.
During the workshop, the policy advisors stressed the
importance of presenting qualitative aspects of uncertainty;
they observed that policymakers tend to regard the numbers
presented in the Environmental Balance as solid information,
while the solidity of those numbers is often questionable.
Here, we encounter the tension between what policymakers
expect and/or prefer (solid quantitative information) and what
scientists can deliver, which was also observed in Section 3.
5.4. The place of uncertainty information in reports
The participants in the policymakers workshop preferred only
a limited amount of directly policy relevant information in the
main text of documents. Other information should be placed
in appendices or other reports. However, when asked whether
they had read the Environmental Balance’s appendix on
uncertainties (Appendix 3 from MNP, 2005), none had done so.
Many of the policy advisors, however, wanted as much
uncertainty information in the main text as possible,
increasing its visibility to the policymakers. They emphasised
that the presented information should be relativised, as
policymakers often overestimate its rigidity. Important
uncertainty information should be placed both in the general
summary and in the chapters or the chapter summaries/
conclusions, as policymakers often read only certain chapters
of reports, depending on the relevance to their policy field.
Furthermore, policy advisors considered it useful to add a
short introduction, early on in the report, on how it deals with
uncertainty. This helps readers attune to the concept of
uncertainty and the communication formats that are used.
and degree of detail of reported uncertainty information at
Inner layers
mplicit, Uncertainties mentioned separately and explicitly
on the Uncertainties as part of scientific accounting on
the approach used in the study and on the
assessment results
tal context Account of the ‘untranslated’ uncertainties from
a scientific point of view
Balanced account of uncertainties in all parts of
the assessment
Emphasis on nature, extent and sources of
uncertainties
results Implications of uncertainties for the
representativeness of a study, value of the
results, and further research
nguage’ Scientific information with a high technical
sophistication
Use of jargon allowed
Highly detailed (each layer offers more detailed
information than the previous)

e n v i r o n m e n t a l s c i e n c e & p o l i c y 1 1 ( 2 0 0 8 ) 6 2 7 – 6 4 1 637
Crucial information, such as the explanation of probability
terms, should not be left to the – often unread – appendices.
As noted earlier, not all uncertainty information will be
relevant to the main target audiences. However, principles of
good scientific practice, the presence of other interested target
audiences, and the fact that other uncertainty information
may become relevant at a later point, call for the commu-
nication of additional information as well. An approach to
dealing with the dilemma of what to communicate and where,
is the concept of ‘‘Progressive Disclosure of Information’’
(Guimaraes Pereira and Corral Quintana, 2002). This approach
entails implementing several ‘‘layers of information’’ to be
progressively disclosed, from non-technical to more specia-
lised, according to the needs of the user. In environmental
assessments, these layers could be the summary, conclusions,
chapter summaries/conclusions, main text, appendices, and
background material, such as background reports or addi-
tional online information. Uncertainty information that is
deemed to be highly relevant to the main target groups should
be placed in the summary and conclusions, while other
material could be added to the main text, appendices, or
background material, in order of relevance. Background
material, available in appendices and from other sources,
should be clearly referred to, indicating their existence and
location. Some general guidelines are suggested in Table 2. For
detailed guidance on how to apply progressive disclosure of
information (PDI) in practice, see Kloprogge et al. (2007).
6. Discussion
6.1. Limitations of the analysis
In the previous Sections, several remarks on the statistical
representativeness of the various samples were made. In view
of the objective of our study, our primary concern is societal
and political relevance and not technically defined represen-
tativeness, per se. For this reason, several biases in our study
can also be seen as advantages and not only as limitations. We
aimed at involving competent and engaged participants who
are well in touch with the groups they represent.
Research efforts tend to attract respondents who are
interested in the subject and used to working with it.
Participants may, therefore, have a more positive attitude
towards uncertainty and communicating uncertainty than the
‘‘average’’ audience (that is, the majority of readers of an
assessment report). Those who do not favour such activities
may consider research to hold little relevance to them. One
policymaker noted in an e-mail, declining participation, that
he considered uncertainties to be ‘‘annoying’’ in daily practice
and that people ‘‘shop selectively’’ and interpret and use the
information to further their own goals, making communica-
tion of uncertainty a waste of effort. However, an indication
that the participants were indeed representative for the larger
target audience, is the fact that many of the participating
policymakers were sent by their departments, to represent the
department’s collective views.
In evaluating presentation formats, respondents who had
experience with uncertainty may have found the formats
easier to interpret, compared to an ‘‘average’’ audience.
Furthermore, the research subject brought the uncertainty
information into focus, as would not happen in casual reading,
which might result in easier interpretation, as well. Never-
theless, participants would likely be able to differentiate
between the more straightforward and more difficult formats,
to estimate interpretation by less experienced colleagues, and
to offer suggestions for improvement. However, it would be
useful to check specific presentation formats, perhaps in a
study not focused on uncertainty, by conducting additional
experiments with educated laypersons (such as the students
in this study).
The generally limited amount of respondents, is another
issue. Participation takes time, people often felt their
(departmental/organisational) views would be better repre-
sented by others, or they considered themselves only distantly
related to uncertainty communication or to the contents of the
Environmental Balance. While policymakers seemed to be
adequately represented, would have been interesting to have
had more input on individual/personal views and views of
NGOs, companies and politicians.
Finally, calls for information on specific issues and aspects
of uncertainty are likely to vary for different assessments,
countries and topics, due to varying economic, social,
environmental, and political situations (cf. Geert Hofstede’s
concept of ‘‘uncertainty avoidance’’, one of five dimensions of
differences in national cultures; see, e.g., Hofstede, 2001).
Visser and Petersen (in press) present a specific Dutch example
of uncertainty communication regarding climate change
impacts on ice-skating marathons, showing the contextual
dependence of uncertainty information. In the present study,
we identified a strong call for uncertainty information on
particulate matter, as it is highly topical in the Netherlands.
Issues, such as probability terms, are strongly language-
dependent. The reported results can be seen as indicative of
other configurations/countries, but the extent to which these
results can be generalised remains to be determined.
6.2. Implications for the practice of uncertaintycommunication
Perceptions in the science-policy interface, on how to deal
with and communicate uncertainty vary strongly (see also Van
der Sluijs, 2005, 2007). For example, is it important to provide
uncertainty information, and should this information pre-
ferably be quantified? Many contemporary policy issues can be
characterised as ‘post-normal’: facts are uncertain, values in
dispute, and the decision stakes high (Janssen et al., 2005; Van
der Sluijs, 2002, 2007; Van der Sluijs et al., 2008). In such
situations, explicit attention for uncertainty and knowledge
quality is important. Policy processes demand information at
short notice, but users of this information often do not have a
clear view of the research behind it and its complexities,
caveats, and robustness. Policymakers were surprised by the
many aspects of uncertainty, and policy advisors noted that
policymakers tend to see numbers as ‘solid facts’. Nuances in
information may be obvious to scientists, but not to policy-
makers and, therefore, need to be made explicit.
Uncertainty information may indeed add to the complicat-
edness of already complex problems. However, simply not
providing such information or relegating it to background

e n v i r o n m e n t a l s c i e n c e & p o l i c y 1 1 ( 2 0 0 8 ) 6 2 7 – 6 4 1638
reports would not add to the quality of these decisions.
Quantitative, as well as qualitative uncertainty information is
required. This is particularly true in policy settings, where
time is limited and many assumptions are required for
quantification. Moreover, (yet or principally) unquantifiable
uncertainties can be highly policy-relevant. Qualitative infor-
mation can provide insight in, for example, research priorities,
scenarios of plausible futures and development pathways, and
‘deep’ uncertainties (e.g. problem-framing uncertainty, meth-
odological unreliability or recognised ignorance). Unquantifi-
able uncertainties can take the forefront in societal debate. As
the policy advisors in this study noted, policymakers will need
information to be prepared for this.
A way forward for uncertainty communication is to
improve its tailoring to the users of this information. In
environmental assessments, its role is not merely ‘good
practice’, but to support societal decision-making. To enhance
usability, the communicator will need to keep in mind the
decision problem that the user faces. Different uncertainties
are relevant to different people, in different situations, and in
different stages of a policy cycle. In some cases, it may be
sufficient to compound different uncertainties into a single
range (black box); in other cases it could be useful to segregate
them to reveal different levers for improving the odds.
Furthermore, policymakers strongly called for information
on the implications of uncertainty. This does not mean that
scientists should tell policymakers what to do, but that they
should provide them with useful insights, to help them make
their decisions. For example, provide information on the
consequences for the solidity of the conclusions and the policy
risk (probability and consequences) of wrong decisions. In
‘fifty-fifty’ situations, policymakers were more interested in
how much they might exceed a target (and how to limit this),
than in the exact probability of meeting such a target. Perhaps
integrating probability, severity, and reduction possibilities
(e.g., as in EEA, 2005, p. 15) could prove a useful approach, also
for overcoming the problems of interpreting probability terms.
7. Conclusions
This study explores the views, held by various parties in the
Dutch science-policy interface hold, on uncertainty, uncer-
tainty communication and its use and usefulness. Most
participants preferred a quantifying approach to uncertainty.
In this view, uncertainty is undesirable, but inevitable and
science should quantify uncertainty and separate facts and
values. However, in practice this is often difficult and
unrealistic in complex issues where facts are uncertain,
values in dispute and the stakes high. This means that there
is a mismatch between the degree of certainty that science can
realistically deliver in such a situation, and what science is
expected to provide. A large minority of the respondents opted
for a deliberative view: uncertainty creates opportunities and
puts the role of science into perspective. Differences between
scientists and policymakers in such perceptions of uncer-
tainty and tensions, between what is expected from science
and the limits to quantification of uncertainty, should be
anticipated in communication strategies. Participants con-
sidered uncertainty information to be important to policy-
making and the scientific and societal debate, but it should be
concise and policy relevant. Policy relevance depends on, for
example, the place of an issue in the policy cycle, novelty,
topicality, controversiality, and several situation-specific
factors. However, political interest is often limited, and
uncertainty adds additional complexity and difficulty in daily
practice (interpretation and use) and in negotiations, and the
possibility of strategic use.
Participants had a broad interest in information on various
types of uncertainty. They were particularly interested in
uncertainty in (1) the environmental effects of policy, (2)
reaching policy goals, and (3) the severity of environmental
problems. Furthermore, they called for more uncertainty
information on (4) topical issues, (5) issues on which there is
little uncertainty communication at present, and (6) matters
that are important for finding, selecting and prioritising policy
responses. Specific information needs reported by partici-
pants included: sources and types of uncertainty, implications
of uncertainty, and the phenomenon of recalculations.
Reflection on possible implications of uncertainty seems
especially important, considering reported difficulties in
interpretation and use of uncertainty information, lack of
clarity on why it is important to be aware of (specific)
uncertainties, and a strong perceived need for such informa-
tion.
The use of probability terms – as is done by for instance the
IPCC – is problematic, since differences in interpretation are
large and context-dependent. The term ‘‘medium likelihood’’
for 33–66% probability seems especially problematic. Partici-
pants’ estimates for a direct Dutch translation varied greatly
(median: 50–75%). Translations of the newly introduced terms
‘‘about as likely as not’’ (IPCC, 2005; IPCC, 2007) and ‘‘fifty-fifty;
about 50%’’ (MNP, 2005) were also studied. The present study is
the first to empirically assess these two new terms. The
performance of both terms turned out to be fairly good
(median: 40–60%), which implies that they could effectively to
communicate what is meant.
Respondents were interested in information on the
different sources of uncertainty that play an important role
in a particular environmental problem. For instance, informa-
tion on both projection-uncertainty and monitoring-uncer-
tainty was found useful. The different types of uncertainty
appeared to be relevant for assessing different policy ques-
tions. The monitoring-uncertainty is sometimes not commu-
nicated, as it is less relevant for relative policy goals. However,
relative goals tend to develop into absolute goals, for which
monitoring-uncertainty is relevant. Thus, it depends on the
policy setting, first, which sources of uncertainty should be
taken into account and, second, which sources of uncertainty
could be aggregated.
Qualitative aspects of uncertainty are deemed relevant to
policy. They can be communicated using a simple verbal ‘‘level
of scientific knowledge’’ indicator or a more comprehensive
graphical Pedigree Chart.
Writers of environmental assessments should carefully
consider where to place uncertainty information in the report.
Information should be progressively disclosed depending on
its relevance to target audiences. Crucial information (e.g. for
interpreting how the report deals with uncertainty) should not
be placed in often unread places, such as the appendices.

e n v i r o n m e n t a l s c i e n c e & p o l i c y 1 1 ( 2 0 0 8 ) 6 2 7 – 6 4 1 639
Most participants were positive about the amount and
clarity of uncertainty communication in MNP’s Environmental
Balance reports, but several suggestions for improvements
have been made. These include the issues described in this
article, as well as more specific suggestions, which can be
found in the Dutch background documents.
Overall, a responsible communication of uncertainty
information leads to a deeper understanding and increased
awareness of the phenomenon of uncertainty and its policy
implications. It is expected that this understanding and
awareness may result in a more responsible, accountable,
more transparent – and ultimately more effective – use of
intrinsically uncertain science in decision-making.
Acknowledgements
Research was financed by the Netherlands Environmental
Assessment Agency. We would like to thank Mark van
Oorschot, Marian Abels, Hans Visser, Filip de Blois, and
Annemieke Righart (Netherlands Environmental Assessment
Agency), Pieter van Eeden and Anneriek Poelman (Cadre BV),
Suraje Dessai (Tyndall Centre, University of East Anglia),
Annick de Vries (University of Twente), and Floortje Alke-
made, Erwin Adema, Machteld van den Broek, Ruud Smits,
and Carsten Lemmen (Utrecht University) for their sugges-
tions or contributions to the project.
r e f e r e n c e s
Blanke, D.D., Mitchell, W., 2002. Towards Health with Justice:Litigation and Public Inquiries as Tools for Tobacco Control.World Health Organization (WHO), Geneva.
Chu, D., Strand, R., Fjelland, R., 2003. Theories of complexity.Complexity 8, 19–30.
Cooney, R., 2004. The Precautionary Principle in BiodiversityConservation and Natural Resource Management: An IssuesPaper for Policy-makers, Researchers and Practitioners.IUCN, Gland, Switzerland/Cambridge, UK.
De Vries, A.S., 2007. Department of Science, Technology, Healthand Policy Studies. University of Twente, Enschede(Personal communication).
EEA, 2001. Late Lessons From Early Warnings: ThePrecautionary Principle 1896–2000. European EnvironmentAgency, Copenhagen.
EEA, 2005. Environment and health. European EnvironmentAgency, Copenhagen. Available from: http://reports.eea.europa.eu/eea_report_2005_10/en.
Flugstad, A.R., Windschitl, P.D., 2003. The Influence of Reasonson Interpretations of Probability Forecasts. Journal ofBehavioral Decision Making 16, 107–126.
Frewer, L., Hunt, S., Brennan, M., Kuznesof, S., Ness, M., Ritson,C., 2003. The views of scientific experts on how the publicconceptualize uncertainty. Journal of Risk Research 6 (1),75–85.
Funtowicz, S.O., 2006. Why knowledge assessment? In:Guimaraes Pereira, A., Guedes Vaz, S., Tognetti, S. (Eds.),Interfaces between Science and Society. GreenleafPublishing Ltd., Sheffield, pp. 138–145.
Funtowicz, S.O., Ravetz, J.R., 1990. Uncertainty and Quality inScience for Policy. Kluwer Academic Publishers,Dordrecht.
Funtowicz, S.O., Ravetz, J.R., 1993. Science for the post-normalage. Futures 25, 739–755.
Groenenberg, H., Van der Sluijs, J.P., 2005. Valueloading anduncertainty in a sector-based differentiation scheme foremission allowances. Climatic Change 71 (1), 75–115.
GroupSystems, 2002. GroupSystems Workgroup Edition &Professional Suite, Version 3.4. See http://www.groupsystems.com/.
Guimaraes Pereira, A., Corral Quintana, S., 2002. Fromtechnocratic to participatory decision support systems:responding to new governance initiatives. Journal ofGeographic Information and Decision Analysis 6, 95–107.
Guimaraes Pereira, A., Guedes Vaz, S., Tognetti, S. (Eds.), 2006.Interfaces Between Science and Society. GreenleafPublishing Ltd., Sheffield.
Ha-Duong, M., Swart, R., Bernstein, L., Petersen, A.C., 2007.Uncertainty management in the IPCC: agreeing to disagree.Global Environmental Change 17, 8–11.
Hellstrom, T., 1996. The Science-Policy dialogue intransformation: model-uncertainty and environmentalpolicy. Science and Public Policy 23 (2), 91–97.
Hofstede, G., 2001. Culture’s Consequences: Comparing Values,Behaviors, Institutions and Organizations Across Nations,2nd ed. Sage Publications, Thousand Oaks, CA.
Holling, C.S., 1973. Resilience and stability of ecological systems.Annual Review Of Ecology And Systematics 4, 1–23.
Honingh, N., 2004. Onzekerheden in het Mest- enammoniakmodel. Department of Science, Technology andSociety, Utrecht University, Utrecht.
Ibrekk, H., Morgan, M.G., 1987. Graphical communication ofuncertain quantities to nontechnical people. Risk Analysis7, 519–529.
IPCC, 2001. Climate Change 2001: Synthesis Report.Intergovernmental Panel on Climate Change. CambridgeUniversity Press, Cambridge.
IPCC, 2005. Guidance Notes for Lead Authors of the IPCC FourthAssessment Report on Addressing Uncertainties.Intergovernmental Panel on Climate Change, Geneva.
IPCC, 2007. Climate Change 2007: The Physical Science Basis—Summary for Policymakers. Intergovernmental Panel onClimate Change, Geneva.
Janssen, P.H.M., Petersen, A.C., Van der Sluijs, J.P., Risbey, J.S.,Ravetz, J.R., 2005. A guidance for assessing andcommunicating uncertainties. Water Science & Technology52, 125–131.
Kasemir, B., Jaeger, C.C., Gardner, M.T., Clark, W.C., Wokaun, A.,2003. Public Participation in Sustainability Science—AHandbook. Cambridge University Press, Cambridge.
Kloprogge, P., Van der Sluijs, J.P., 2006a. Verslag Expert Meetingonzekerheidscommunicatie rond fijn stof en gezondheid.Department of Science, Technology and Society, UtrechtUniversity, Utrecht.
Kloprogge, P., Van der Sluijs, J.P., 2006b. Verslag Beleidslabsessie‘Onzekerheidsinformatie in de Milieubalans 2005’.Department of Science, Technology and Society, UtrechtUniversity, Utrecht.
Kloprogge, P., Van der Sluijs, J.P., Wardekker, J.A., 2007.Uncertainty Communication: Issues and Good Practice.Department of Science, Technology and Society, UtrechtUniversity, Utrecht. Available from: http://www.nusap.net/guidance/.
Krupnick, A., Morgenstern, R., Batz, M., Nelson, P., Burtraw, D.,Shih, J.S., McWilliams, M., 2006. Not A Sure Thing: MakingRegulatory Choices under Uncertainty. Resources for theFuture (RFF), Washington.
Kuhn, K.M., 2000. Message format and audience values:interactive effects of uncertainty information andenvironmental attitudes on perceived risk. Journal ofEnvironmental Psychology 20, 41–51.

e n v i r o n m e n t a l s c i e n c e & p o l i c y 1 1 ( 2 0 0 8 ) 6 2 7 – 6 4 1640
Manning, M., Petit, M., Easterling, D., Murphy, D., Patwardhan,A., Rogner, H.H., Swart, R., Yohe, G., 2004. IPCC Workshopon Describing Scientific Uncertainties in Climate Change toSupport Analysis of Risk and of Options. IntergovernmentalPanel on Climate Change, Geneva.
Michaels, D., 2005. Doubt is their product. Scientific American292 (6), 96–101.
MNP, 2005. Milieubalans 2005. Netherlands EnvironmentalAssessment Agency (MNP), Bilthoven.
Morgan, M.G., 1998. Uncertainty analysis in risk assessment.Human Ecological Risk Assessment 4 (1), 25–39.
Morgan, M.G., 2003. Characterizing and dealing withuncertainty: insights from the integrated assessment ofclimate change. Integrated Assessment 4 (1),46–55.
Moss, R.H., Schneider, S.H., 2000. Uncertainties in the IPCC TAR:recommendations to lead authors for more consistentassessment and reporting. In: Pachauri, R., Taniguchi, T.,Tanaka, K. (Eds.), IPCC Supporting Material, GuidancePapers on the Cross Cutting Issues of the Third AssessmentReport of the IPCC. Intergovernmental Panel on ClimateChange, Geneva, pp. 33–51.
Neutra, R.R., Cohen, A., Fletcher, T., Michaels, D., Richter, E.D.,Soskolne, C.L., 2006. Toward guidelines for the ethicalreanalysis and reinterpretation of another’s research.Epidemiology 17 (3), 335–338.
Patt, A.G., Dessai, S., 2005. Communicating uncertainty: lessonslearned and suggestions for climate change assessment.Comptes Rendus Geoscience 337, 425–441.
Patt, A.G., Schrag, D.P., 2003. Using specific language to describerisk and probability. Climatic Change 61, 17–30.
Petersen, A.C., 2006. Simulating Nature—A Philosophical Studyof Computer-simulation Uncertainties and Their Role inClimate Science and Policy Advice. Het Spinhuis Publishers,Amsterdam.
Renooij, S., Witteman, C., 1999. Talking probabilities:communicating probabilistic information with words andnumbers. International Journal of Approximate Reasoning22, 169–194.
Risbey, 2007. Subjective elements in climate policy advice.Climatic Change 85 (1–2), 11–17.
Risbey, J., Van der Sluijs, J., Kloprogge, P., Ravetz, J., Funtowicz,S., Corral Quintana, S., 2005. Application of a checklist forquality assistance in environmental modelling to an energymodel. Environmental Modeling & Assessment 10 (1),63–79.
Slovic, P., Fischhoff, B., Lichtenstein, S., 1981. Perceived risk:psychological factors and social implications. Proceedingsof the Royal Society of London, Series A, Mathematical andPhysical Sciences 376, 17–34 1764.
Swart, R., Bernstein, L. Ha-Duong, M., Petersen, A., 2008.Agreeing to disagree: uncertainty management in assessingclimate change, impacts and responses by the IPCC.Climatic Change, doi:10.1007/s10584-008-9444-7.
Thompson Klein, J., Grossenbacher-Mansuy, W., Haberli, R., Bill,A., Scholz, R.W., Welti, M., 2001. Transdisciplinarity: JointProblem Solving Among Science, Technology, and Society.An Effective Way for Managing Complexity. Birkhauser,Basel.
Turban, E., Aronson, J.E., 1998. Decision Support Systems andIntelligent Systems, 5th ed. Prentice-Hall, Upper SaddleRiver.
UNESCO COMEST, 2005. The Precautionary Principle. WorldCommission on the Ethics of Scientific Knowledge andTechnology (COMEST) United Nations Educational,Scientific and Cultural Organization (UNESCO), Paris.
Van Asselt, M.B.A., 2000. Perspectives on Uncertainty and Risk:The PRIMA Approach to Decision Support. KluwerAcademic Publishers, Dordrecht.
Van der Sluijs, J.P., 2002. A way out of the credibility crisisaround model-use in integrated environmental assessment.Futures 34, 133–146.
Van der Sluijs, J.P., 2005. Uncertainty as a monster in thescience-policy interface: four coping strategies. WaterScience & Technology 52, 87–92.
Van der Sluijs, J.P., 2007. Uncertainty and Precaution inEnvironmental Management: Insights from the UPEMconference. Environmental Modelling and Software 22 (5),590–598.
Van der Sluijs, J.P., Risbey, J.S., Kloprogge, P., Ravetz, J.R.,Funtowicz, S.O., Corral Quintana, S., Guimaraes Pereira, A.,De Marchi, B., Petersen, A.C., Janssen, P.H.M., Hoppe, R.,Huijs, S.W.F., 2003. RIVM/MNP Guidance for UncertaintyAssessment and Communication: Detailed Guidance.Utrecht University and RIVM/MNP, Utrecht/Bilthoven.Available at: http://www.nusap.net/guidance/.
Van der Sluijs, J.P., Craye, M., Funtowicz, S.O., Kloprogge, P.,Ravetz, J.R., Risbey, J.S., 2005a. Combining quantitative andqualitative measures of uncertainty in model basedenvironmental assessment: the NUSAP System. RiskAnalysis 25, 481–492.
Van der Sluijs, J.P., Craye, M., Funtowicz, S., Kloprogge, P.,Ravetz, J., Risbey, J., 2005b. Experiences with the NUSAPsystem for multidimensional uncertainty assessment inmodel based foresight studies. Water Science & Technology52 (6), 133–144.
Van der Sluijs, J.P., Risbey, J.S., Ravetz, J.R., 2005c. Uncertaintyassessment of VOC emissions from Paint in theNetherlands. Environmental Monitoring and Assessment105, 229–259.
Van der Sluijs, J.P., Petersen, A.C., Janssen, P.H.M., Risbey, J.S.,Ravetz, J.R., 2008. Exploring the quality of evidence forcomplex and contested policy decisions. EnvironmentalResearch Letters 3, 9 024008.
Visser, H., Petersen, A.C., in press. The likelihood of holdingoutdoor skating marathons in the Netherlands as a policy-relevant indicator of climate change. Climatic Change.
Wallsten, T.J., Budescu, D.V., 1990. Quantifying probabilisticexpressions: comment. Statistical Science 5, 23–26.
Wallsten, T.J., Budescu, D.V., Rapoport, A., Zwick, R., Forsyth,B.H., 1986. Measuring the vague meanings of probabilityterms. Journal of Experimental Psychology: General 115,348–365.
Wardekker, J.A., Van der Sluijs, J.P., 2005. Report of the ExpertMeeting Uncertainty Communication, Hotel Mitland,Utrecht, The Netherlands, December 10, 2004. Departmentof Science, Technology and Society, Utrecht University,Utrecht.
Wardekker, J.A., Van der Sluijs, J.P., 2006a.Onzekerheidscommunicatie in de Milieubalans 2005:Resultaten Gebruikerspanel Beleidsmakers. Department ofScience, Technology and Society, Utrecht University, Utrecht.
Wardekker, J.A., Van der Sluijs, J.P., 2006b.Onzekerheidscommunicatie in de Milieubalans 2005:Resultaten Gebruikerspanel Stakeholders. Department ofScience, Technology and Society, Utrecht University,Utrecht.
Wardekker, J.A., Van der Sluijs, J.P., 2006c. Evaluatie vanOnzekerheidscommunicatie in de Milieubalans 2005.Synthesis Report. Department of Science, Technology andSociety, Utrecht University, Utrecht.
Wardekker, J.A., Janssen, P.H.M., Besseling, P.J.,Mathijssen, J., 2008. Interactive experiment: perceptionand communication of risks and uncertainty. In:Mathijssen, J., Petersen, A., Besseling, P., Rahman, A., Don,H. (Eds.), Dealing with Uncertainty in Policymaking. CPB,PBL, and RAND Europe, The Hague/Bilthoven/Leiden, pp.75–85.

e n v i r o n m e n t a l s c i e n c e & p o l i c y 1 1 ( 2 0 0 8 ) 6 2 7 – 6 4 1 641
Weiss, C., 2003. Expressing scientific uncertainty. Law,Probability and Risk 2, 25–46.
Weiss, C., 2006. Can there be science-based precaution?Environmental Research Letters 1 (1), 7 014003.
Witteman, C., Rinnooij, S., 2003. Evaluation of a verbal–numerical probability scale. International Journal ofApproximate Reasoning 33, 117–131.
Arjan Wardekker is researcher at Utrecht University and, untilNovember 2007, was advisor/researcher at the Netherlands Envir-onmental Assessment Agency. His interests include dealing withrisks and uncertainties in environmental policymaking andadvice, particularly risk/uncertainty perception and communica-tion and environmental ethics.
Jeroen van der Sluijs is senior researcher and assistant professorat Utrecht University and visiting professor at the Centre d’Econ-omie et d’Ethique pour l’Environnement et le Developpement,Universite de Versailles Saint-Quentin-en-Yvelines, France. Hehas published on multi-dimensional uncertainty methods, codesfor good modelling practice, uncertainty communication and theprecautionary principle.
Peter Janssen is senior researcher with large experience inmodelling methodology in policy-advice settings (simulation,validation, calibration, optimisation, sensitivity and uncertaintyanalysis, complex systems). He has participated in many pro-jects on local and global environmental issues, concerningacidification, eutrophication, climate change, emission inven-tories, noise modelling, risk and safety studies inaviation, sustainability assessment and complex systems mod-elling.
Penny Kloprogge worked as researcher at Utrecht University until2005, where she studied and developed methods to deal withsubjective choices and ‘value-ladenness’ in environmental assess-ments and integrated assessment modelling. She is currentlyworking at the Dutch organisation for consumer information onthe environment, Milieu Centraal.
Arthur Petersen is senior researcher and programme managerMethodology and Modelling at the Netherlands EnvironmentalAssessment Agency. His research interests include methodologydevelopment for uncertainty assessment and sustainabilityassessment.


![Uncertainty Footprint: Visualization of Nonuniform ... · PDF fileUncertainty Footprint: Visualization of Nonuniform Behavior of ... [ALM 14]. No matter how their parameters were adjusted,](https://static.fdocuments.us/doc/165x107/5aad13467f8b9a8d678daa79/uncertainty-footprint-visualization-of-nonuniform-footprint-visualization.jpg)