Uncertainty and Climate Change Adaptation - NUSAP net · relative importance - to the particular...
97
Uncertainty and Climate Change Adaptation - a Scoping Study Suraje Dessai and Jeroen van der Sluijs
Transcript of Uncertainty and Climate Change Adaptation - NUSAP net · relative importance - to the particular...

Uncertainty and ClimateChange Adaptation -a Scoping StudySuraje Dessai and Jeroen van der Sluijs

This report is prepared for the Netherlands Environmental Assessment Agency, in a joint project between Copernicus Institute of Utrecht University, Tyndall Centre for Climate Change Research, UK and School of Environmental Sciences, University of East Anglia, Norwich, UK.
Report NWS-E-2007-198 ISBN 978-90-8672-025-5
Utrecht, December 2007
Contact person: Jeroen van der Sluijs E-mail: [email protected]
Copernicus Institute for Sustainable Development and Innovation Department of Science Technology and Society (STS) Heidelberglaan 2 3584 CS Utrecht The Netherlands Phone +31-30-2537631 Fax +31-30-2537601

Uncertainty and Climate Change Adaptation - a Scoping Study
Suraje Dessai1,2,3 and Jeroen van der Sluijs3
1 - Tyndall Centre for Climate Change Research, UK2 - School of Environmental Sciences, University of East Anglia, Norwich, UK 3 - Copernicus Institute for Sustainable Development and Innovation, Utrecht University, The Netherlands
Copernicus Institute Utrecht University


3
Table of contents
1. Introduction........................................................................................................................7 2. Adapting to climate change in The Netherlands..............................................................15
2.1 Observed changes in the climate of the Netherlands and their impacts ....................15 2.2 From curative reactive adaptation to planned precautionary adaptation ...................16 2.3 Where are planned adaptation decisions needed or expected in the Netherlands?....17 2.4 Climate change scenarios...........................................................................................19
3. Decision making frameworks for adaptation to climate change......................................23 3.1 Attitudes to risk and uncertainty ....................................................................................26 3.2 Precautionary principle versus Prevention principle .....................................................29 3.3 Top-down approaches....................................................................................................33
3.3.1 The IPCC approach.................................................................................................33 3.3.2 Risk approaches ......................................................................................................33
3.4 Bottom-up approaches ...................................................................................................37 3.4.1 Engineering Safety Margin .....................................................................................37 3.4.2 Anticipating design .................................................................................................38 3.4.3 Resilience................................................................................................................39 3.4.4 Adaptive management ............................................................................................40 3.4.5 Human development approaches ............................................................................41
3.5 Mixed approaches and alternative approaches ..............................................................41 3.5.1 The Adaptation Policy Framework.........................................................................41 3.5.2 Robust decision making..........................................................................................42
4. Methods and tools to assess climate change uncertainties relevant for adaptation planning................................................................................................................................44 4.1 Prediction approach .......................................................................................................44
4.1.1 Greenhouse gas emissions ......................................................................................45 4.1.2 Global climate change.............................................................................................48 4.1.3 Global climate change impacts ...............................................................................51 4.1.3 Regional climate change (including downscaling methods) ..................................52 4.1.4 Regional/local impacts............................................................................................54
4.2 Wild cards and surprises ................................................................................................55 5. Synthesis and Case study .................................................................................................59 5.1 Mapping methods, decision frameworks and uncertainty levels to each other .............59 5.2 A hypothetical case study ..............................................................................................63 6. Conclusion .......................................................................................................................67 7. Acknowledgements..........................................................................................................718. References........................................................................................................................72 Appendix 1 Overview of adaptation issues by sector..........................................................86 Appendix 2 Discussion climateprediction.net v.s. KNMI scenarios ...................................91 Appendix 3 List of acronyms and abbreviations .................................................................95

4

5
Summary
It is increasingly recognized that adaptation to climate change has become unavoidable. It is the only response available for the impacts that will occur over the next several decades before mitigation measures can have an effect. Societies, organisations and individuals have been adapting to changing conditions for centuries but the advent of climate change brings new challenges. Some of the challenges are brought about by issues related to the rate (and magnitude) of change of climate, the potential for non-linear changes and the long time horizons. All these issues are plagued with substantial uncertainties, which makes anticipatory adaptation difficult. The fact that we have partial knowledge of future climate is in itself a new challenge.
Effective communication between science and policy - necessary for well informed adaptation policy making - is often hampered by misunderstandings about the phenomenon of uncertainty in the science. The focus on statistical and quantitative methods of uncertainty assessment leads to a tendency to ignore policy relevant uncertainty information about the deeper dimensions of uncertainty that in principle cannot be quantified. Lack of systematic attention for unquantifiable uncertainties in the science makes the perceived scientific foundation basis of climate policies prone to controversies, can undermine public support for climate policies, and increases the risk that society is surprised by unanticipated climate changes.
This report reviews state-of-the-art of methods and tools available in the literature in helping inform adaptation decisions. We focus on the assessment of climate change uncertainties. Further, the report reviews existing frameworks for decision making under uncertainty for adaptation to climate change. The report explores how different ways of including uncertainty in decision making match with uncertainty information provided by the various uncertainty assessment methods. It reviews a broad range of areas of climate change impacts and impacted sectors of society and economy that may require a response of planned adaptation.
The questions addressed in this scoping study focus on three interrelated areas: (1) To what climate changes do we need to adapt where, and what parties are involved in adaptation decision making? (2) What decision making frameworks for adaptation and strategies for accounting for uncertainty in adaptation are proposed in the literature and or used in other countries?, and (3) What methods are available to assess climate change impact uncertainties to inform adaptation decisions?
The existence of different attitudes to risk and uncertainty leads to different decision making frameworks existing in various adaptation contexts. The various decision making frameworks call for different decisions analysis frameworks and different tools for uncertainty analysis.
Decision frameworks and analysis tools can roughly be grouped into two schools of thought: the predictive top-down approach and the resilience bottom-up approach. Some mixed approaches were also discussed. The difference between top down and bottom up is in the direction in which the causal chain is followed in the reasoning: Top down starts from the top by exploring the accumulation of uncertainty from each step going from emission scenarios, to carbon cycle response, to global climate response, to regional climate scenarios to produce a range of possible local impacts in order to quantify what needs to be anticipated. Bottom up
6
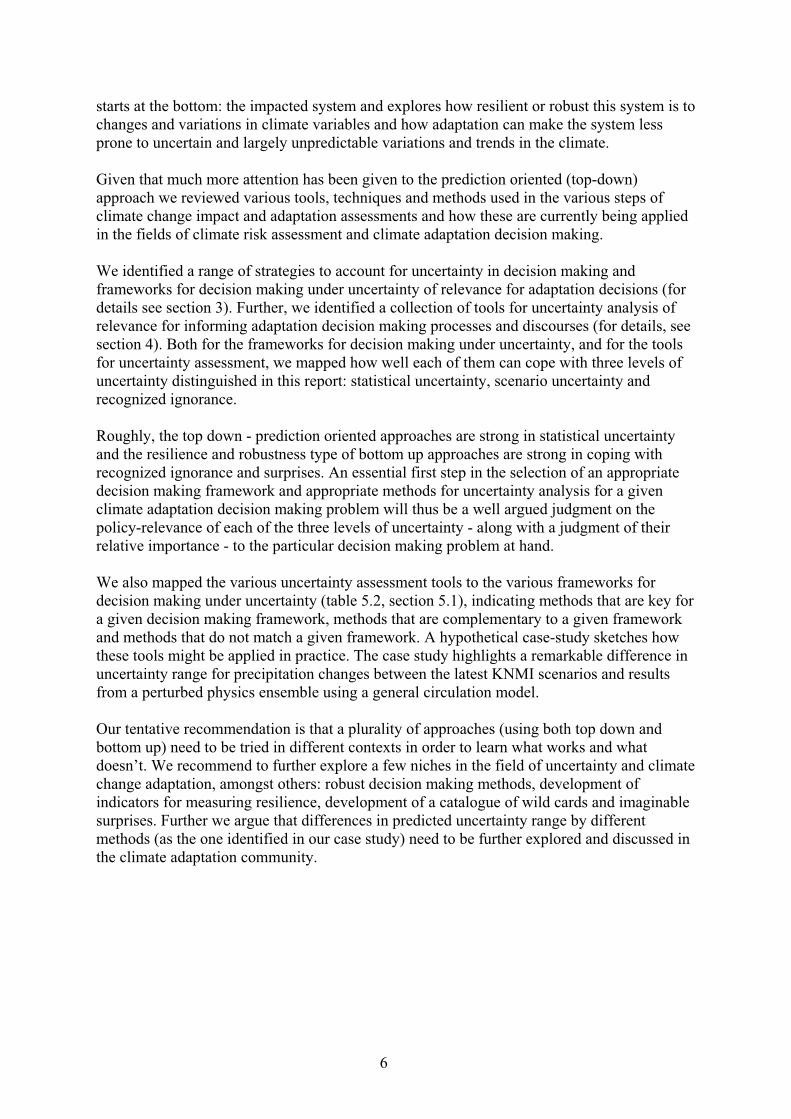
starts at the bottom: the impacted system and explores how resilient or robust this system is to changes and variations in climate variables and how adaptation can make the system less prone to uncertain and largely unpredictable variations and trends in the climate.
Given that much more attention has been given to the prediction oriented (top-down) approach we reviewed various tools, techniques and methods used in the various steps of climate change impact and adaptation assessments and how these are currently being applied in the fields of climate risk assessment and climate adaptation decision making.
We identified a range of strategies to account for uncertainty in decision making and frameworks for decision making under uncertainty of relevance for adaptation decisions (for details see section 3). Further, we identified a collection of tools for uncertainty analysis of relevance for informing adaptation decision making processes and discourses (for details, see section 4). Both for the frameworks for decision making under uncertainty, and for the tools for uncertainty assessment, we mapped how well each of them can cope with three levels of uncertainty distinguished in this report: statistical uncertainty, scenario uncertainty and recognized ignorance.
Roughly, the top down - prediction oriented approaches are strong in statistical uncertainty and the resilience and robustness type of bottom up approaches are strong in coping with recognized ignorance and surprises. An essential first step in the selection of an appropriate decision making framework and appropriate methods for uncertainty analysis for a given climate adaptation decision making problem will thus be a well argued judgment on the policy-relevance of each of the three levels of uncertainty - along with a judgment of their relative importance - to the particular decision making problem at hand.
We also mapped the various uncertainty assessment tools to the various frameworks for decision making under uncertainty (table 5.2, section 5.1), indicating methods that are key for a given decision making framework, methods that are complementary to a given framework and methods that do not match a given framework. A hypothetical case-study sketches how these tools might be applied in practice. The case study highlights a remarkable difference in uncertainty range for precipitation changes between the latest KNMI scenarios and results from a perturbed physics ensemble using a general circulation model.
Our tentative recommendation is that a plurality of approaches (using both top down and bottom up) need to be tried in different contexts in order to learn what works and what doesn’t. We recommend to further explore a few niches in the field of uncertainty and climate change adaptation, amongst others: robust decision making methods, development of indicators for measuring resilience, development of a catalogue of wild cards and imaginable surprises. Further we argue that differences in predicted uncertainty range by different methods (as the one identified in our case study) need to be further explored and discussed in the climate adaptation community.

7
1. Introduction
Climate change is one of the most pressing global problems of our time. Two major responses have emerged to deal with this issue: mitigation and adaptation. In general, climate policy has mostly focused on mitigation – i.e., the reduction of greenhouse gas emissions and/or the enhancement of sinks – with instruments such as the Kyoto Protocol. While there is a wide consensus amongst climate experts and policy makers that mitigation of climate change (i.e. reduction of greenhouse gas emissions) is and should remain the prime focus of climate policy, it is increasingly recognized that adaptation to climate change has become unavoidable. The IPCC has shown that even under optimistic assumptions for the success of present day mitigation efforts and policies, human activity is likely to lead to further climate change with possibly severe impacts (IPCC 2007a). The Stern review noted that adaptation is the only response available for the impacts that will occur over the next several decades before mitigation measures can have an effect (Stern 2007). However, research on adaptation is lagging behind climate impact assessment by almost a decade if we use research output as an indicator of activity levels (see Figure 1.1).
0
100
200
300
400
500
600
700
1991 1993 1995 1997 1999 2001 2003 2005
Num
ber o
f pub
licat
ions Impacts Adaptation
Figure 1.1 Annual number of climate change publications with the words “impact” or “adaptation” in either the title or abstract. Data: Web of Science [accessed 31 July 2007] (Rob Wilby, personal communication 23-8-2007).
Important here is also the understanding that even if atmospheric greenhouse gas concentrations are kept constant at today's level then, temperature would still continue to rise because the thermal inertia of the oceans causes the realised warming to lag several decades behind changes in radiative forcing from greenhouse gases. Moreover, temporary aerosol cooling masks part of the greenhouse warming, but aerosols are short-lived and their impact is highly regional.
IPCC scenario studies show that without additional mitigation climate policies, global mean temperature change could range from 1.1ºC to 6.4ºC by the end of the century compared to 1980-99 (IPCC 2007b). These circumstances make adaptation to climate change – i.e., the adjustment in natural or human systems in response to actual or expected climatic stimuli or their effects - unavoidable (Parry et al. 1998, Pielke Jr. 1998, IPCC 2001a, Pielke Jr. et al. 2007).

8
The impacts of projected climate change are expected to be manifold. Because of limited understanding of many feedback loops in the complex Earth system and inherent limitations to the predictability of climate on the local and regional spatial scales, uncertainty in climate projections are very large and partly irreducible. Effects can become manifest gradually but also abruptly as a singular event and the processes of change can be linear or non-linear. Gradual changes include the increase of temperature, sea level rise, melting of glaciers, increase in length of the growth season, increase in precipitation and increase of extreme weather events such as heat waves and tropical cyclones. These gradual changes can be manifest in extreme singular events (e.g a storm surge or an extreme precipitation event). Examples of non-linear effects are the possible strong reduction or even shut down of the so called thermohaline circulation in the oceans (which could lead to a cooling of North and North-West Europe), disintegration of gas hydrates in melting permafrost and in the oceans (which leads to massive emissions of the greenhouse gas methane), disintegration of the West Antarctic Ice Sheet or strongly increased melting of the Greenland Ice Sheet which may lead to several meters of sea level rise on the long term (see box 1.1).
Recently the Netherlands Scientific Council for Government Policy (WRR 2006) proposed a climate strategy for The Netherlands based on three solution pathways: (1) adaptation to climate change; (2) reduction of greenhouse gas emissions; and (3) effective global coordination. The WRR recommend giving high priority to adaptation, especially in water policy in relation to flood protection (cf. EEA 2007), for four reasons:
• Climate change will still occur if emission reductions are successful, albeit at a reduced rate and magnitude. • The credibility of coordinated global emission reductions is (so far) low. • Successful adaptation will improve the Netherlands’ international negotiating position. • There is ground to be made up in the area of cost-effective flood protection.
Other reasons to pursue adaptation include:
• It yields benefits against existing climate related hazards; • The Netherlands derives economic benefit from the international industry in environmental services e.g. water management. • A credible and successful adaptation policy and a justified image of a long term climate proof Netherlands, increases the attractiveness of the Netherlands for investors as a stable environment.
The IPCC has defined adaptation as an adjustment in ecological, social, or economic systems in response to actual or expected climatic stimuli and their effects or impacts (Smit et al. 2001). Adaptation is therefore made up of actions throughout society, by individuals, groups and government (Adger et al. 2005). In essence, adaptation is a complex societal process of activities, actions, decisions and attitudes that reflect existing social norms and processes. Adaptation is often reactive, induced by observed extreme weather events and their impacts (see also McKenzie-Hedger 2005). Societies, organisations and individuals have been adapting to changing conditions for centuries but the advent of climate change brings new challenges. Some of the challenges are brought about by issues related to the rate (and magnitude) of change of climate, the potential for non-linear changes and the long time horizons. All these issues are plagued with substantial uncertainties, which makes anticipatory adaptation difficult. The fact that we have partial knowledge of future climate is in itself a new challenge.

9
Box 1.1 Poorly known probability, high impact events: the example of accelerated sea level rise (Source: van der Sluijs and Turkenburg 2006)
In the assessments of the risk of sea level rise through anthropogenic climate change, four factors play a role: thermal expansion of sea water, ice-sheet dynamics, natural trends and other man-made causes of sea level rise (mainly groundwater extraction). The ice sheet dynamics constitutes the most problematic factor in the assessments of future sea level as it harbors the largest uncertainties and can be non-linear. In table B1.1 estimates for the present ice volumes and sea-level equivalents of the Earth are given. If all ice on Earth would melt, the worldwide average sea level would rise about 80 meters.
Ice volume (106 km3) Sea level rise equivalent (m) East Antarctica 25.92 64.8 West Antarctica 3.40 8.5 Greenland 3.0 7.6 Small ice caps and mountain glaciers
0.12 0.3
Permafrost 0.03-0.7 0.08-0.17 Table B1.1 Ice components of land ice and their sea level rise equivalents (Titus, 1986).
The mass balance of ice sheets is quite complicated. Increase of temperature at the poles leads to increased evaporation of seawater and increased snowfall, positively contributing to the mass balance. At the same time the melting rate increases, which is a negative contribution. Morphological aspects (profiles of the bottom, shape and thickness of the ice shelves etc.) are a third factor, as they influence calving and streaming of the ice.
The first warnings about the possible instability of the West Antarctic Ice Sheet (WAIS) came from Mercer (1978): "If the global consumption of fossil fuels continues to grow at its present rate, atmospheric CO2 content will double in about 50 years. Climate models suggest that the resultant greenhouse warming effect will be greatly magnified in high latitudes. The computed temperature rise at latitude 80 degrees South could start rapid deglaciation of West Antarctica, leading to a 5 meter rise in sea level."and:"... deglaciation of West Antarctica would probably be the first disastrous result of continued fossil fuel consumption. ... If so, major dislocations in coastal cities, and submergence of low lying areas such as much of Florida and the Netherlands, lies ahead."
Mercer's theory gave rise to public concern and to a scientific debate on the stability of the WAIS. Further research in the 1980s pointed in the direction that the WAIS might be more stable than assumed by Mercer, and anticipated warming in the coming century would not be large enough to initiate the complete melting of the West Antarctic ice shelves (Van der Veen and Oerlemans 1987). It should be noted that this assessment was biased by the time horizon chosen of one century, which is short in comparison to the typical time scales of ice sheet dynamics and does not account for committed warming. Later assessments exhibit the same bias: The first IPCC report concludes in 1990: "Within the next century, it is not likely that there will be a major outflow of ice from West Antarctica due directly to global warming"(IPCC 1990). In the third assessment report, IPCC (2001b) concludes that, ice-dynamic instability of the WAIS and accelerated sea level rise are very unlikely during the 21st century for the range of projected warming. However, for local warming of more than 10°C,

10
simple runoff models predict that a zone of net mass loss would develop on the ice sheet surface. Irreversible disintegration of the WAIS would result because the WAIS cannot retreat to higher ground once its margins are subjected to surface melting and begin to recede. According to IPCC, once started, such disintegration would take at least a few millennia. The thresholds for total disintegration of the East Antarctic Ice Sheet by surface melting is estimated to be about 20°C local warming (IPCC 2001b). The Greenland ice sheet is the most vulnerable to climate warming but is not as potentially instable as the WAIS, meaning that the melting would be a more gradual process. Models project that a local increase of the annually averaged temperature of larger than 3°C sustained for millennia would lead to virtually a complete melting of the Greenland ice sheet. For a local warming over Greenland of 5.5°C the Greenland ice sheet contributes about 3 m in 1,000 years. For a warming of 8°C, the contribution is about 6 m, the ice sheet being largely eliminated (IPCC 2001b).
Hansen (2007) reasons that although a linear approximation fits the past sea level change well for the past century, this is only because the two terms contributing significantly to sea level rise were (1) thermal expansion of ocean water and (2) melting of alpine glaciers. Under foreseen forcing scenarios in the 21st century, the sea level rise surely will be dominated by a third term: (3) ice sheet disintegration. While this third term was small in the past century, it has at least doubled in the past decade and is now close to 1 mm/year. Hansen reasons that if this pattern of nonlinearity in ice sheet disintegration would be simply extrapolated (doubling every 10 years), a sea level rise of several meter in one century would be conceivable. Hansen warns the community that a ‘scientific reticence’ is inhibiting the communication of a threat of a potentially large sea level rise that may well be highly policy relevant. In his view, delay is dangerous because of system inertias that could create a situation with future sea level changes out of our control. Hansen’s concept of “scientific reticence” was earlier noted by Patt (1999) who called this the “strategic treatment of low probability events” and relabled by Van der Sluijs and Turkenburg (2006) as “strategic treatment of poorly known probability - high impact events”. In a sense, IPCC (2007) has become even more reluctant than in earlier assessments and notes that they are unable to evaluate possible dynamical responses of the ice sheets, and thus do not include any possible ‘rapid dynamical changes in ice flow’ in their scenario projections. This echoes with other calls for a full exploration of uncertainty instead of focusing on consensus science (Oppenheimer et al. 2007).
A ‘cascade’ or ‘explosion’ of uncertainty arises when conducting climate change impact assessments for the purposes of making national and local adaptation decisions. In climate projections used for the development of long term adaptation strategies, uncertainties from the various levels of the assessment accumulate. For example, there are uncertainties associated with future emissions of greenhouse gases and sulphate aerosols, uncertainties about the response of the climate system to these changes at global and local scales, uncertainties associated with the impact models and the spatial and temporal distributions of impacts. Climate change impacts such as changes in temperature, precipitation, runoff or heating-degree days are therefore characterized by major uncertainties regarding their magnitude, timing and spatial distribution, sometimes having opposite signs (e.g., some projections show more precipitation whereas others show less). These uncertainties pose major challenges for planners taking decisions on adaptation measures. Gagnon-Lebrun and Agrawala (2006) note that the level of certainty associated with climate change and impact projections is often key to determining the extent to which such information can be used to formulate appropriate adaptation responses. There are also uncertainties associated with the assessment of adaptation options. Uncertainties also exist when trying to understand current vulnerabilities to the impacts of climate variability and change for the purpose of identifying

11
adaptive responses. These uncertainties can potentially be quite large, but there has been little research in this area.
The nature of uncertainty is multi-dimensional: it includes statistical uncertainty, scenario uncertainty and recognized ignorance (see box 1.2) in observed data, in climate models, in climate impacts, in policy context, and on all these locations uncertainties are both epistemic (imperfect knowledge) and stochastic (intrinsic variability in the climate system) (Walker et al. 2003, Dessai and Hulme 2004, Janssen et al. 2005).
Effective communication between science and policy is often hampered by misunderstandings about the phenomenon of uncertainty in the science (Van der Sluijs 1997, Funtowicz 2006). The focus on statistical and quantitative methods of uncertainty assessment leads to a tendency to ignore policy relevant uncertainty information about the deeper dimensions of uncertainty that in principle cannot be quantified. Lack of systematic attention for unquantifiable uncertainties in the science makes the perceived scientific basis of climate policies highly vulnerable to deconstruction in societal discourses and controversies on these policies. For instance, if such hidden unquantifiable uncertainties in scientific assessments are later exposed, magnified and underlined in societal debates over the science by those who have an interest in delaying climate policies, public support for climate policies may vanish. Further, underutilization of scientific insights about policy relevant - but yet unquantifiable - uncertainties may lead to an under-informed policy debate and sub-optimal policies. The precautionary principle requires that policy relevant unquantifiable uncertainties are explicitly considered in setting a stabilization target for mitigation policies (Van der Sluijs and Turkenburg 2006). In a sense this creates a paradox: to evaluate whether our policies are effective we need to quantify a stabilization target while at the same time we will never be able to know whether we have adequately covered the unquantifiable in our attempt to quantify a safe stabilization target. In this respect, adaptation seems to offer additional opportunities to accommodate such deeper uncertainties as a 'safety net' to take care where mitigation fails to take these uncertainties on board. Finding a proper balance between adaptation and mitigation amid deep uncertainty is a major challenge of present day climate policy making.
Over the next decades large investments in climate change adaptation are foreseen in The Netherlands to make the Netherlands more "climate proof" and better prepared for anticipated climate impacts and possible climate surprises. For the anticipated climate impacts, the KNMI regional climate change scenarios are a key input to these investment decisions, which project a range of sea level rise in the year 2100 of 35 to 85 cm (Hurk et al. 2006). For the surprises, MNP is exploring the boundaries of what might be possible in terms of accelerated sea level rise by looking at the maximum sea level rise per century that occurred in the geological past and the maximum conceivable melting rates based on expert judgment of ice sheet dynamics of the Greenland and West Antarctic ice sheets, leading to an estimated upper boundary of 1.5 meters per century (MNP 2007).

12
Box 1.2 Levels of uncertainty (Source: Walker et al. 2003, Janssen et al. 2005)
Uncertainty sources can be classified on a gradual scale running from ‘knowing for certain’ to ‘not know’ (see Figure 1.1). Three classes can be distinguished that will be used throughout this report:
‘Statistical uncertainty’: this concerns the uncertainties which can adequately be expressed in statistical terms, e.g., as a range with associated probability (examples are statistical expressions for measurement inaccuracies, uncertainties due to sampling effects, uncertainties in model-parameter estimates, etc.). In the natural sciences, scientists generally refer to this category if they speak of uncertainty, thereby often implicitly assuming that the involved model relations offer adequate descriptions of the real system under study, and that the (calibration)-data employed are representative of the situation under study. However, when this is not the case, ‘deeper’ forms of uncertainty are at play, which can surpass the statistical uncertainty in size and seriousness and which require adequate attention.
‘Scenario uncertainty’: this concerns uncertainties which cannot be adequately depicted in terms of chances or probabilities, but which can only be specified in terms of (a range of) possible outcomes. For these uncertainties it is impossible to specify a degree of probability or belief, since the mechanisms which lead to the outcomes are not sufficiently known. Scenario uncertainties are often construed in terms of ‘what-if’ statements.
‘Recognized ignorance’: this concerns those uncertainties of which we realize – some way or another – that they are present, but of which we cannot establish any useful estimate, e.g., due to limits to predictability and knowability (‘chaos’)1 or due to unknown processes. A way to make this class of uncertainties operational in climate risk assessment studies is by means of surprise scenarios. Usually there is no scientific consensus about the plausibility of such scenario's while there is some scientific evidence to support them. Examples are the accelerated sea level rise discussed in box 1 or the possible shut down of the thermo-haline ocean circulation.
Continuing on the scale beyond recognized ignorance, we arrive in the area of complete ignorance (‘unknown unknowns’) of which we cannot yet speak and where we inevitably grope in the dark.
Figure 1.1 Uncertainty levels between determinism and total ignorance (Walker et al. 2003).
This report reviews state of the art of methods and tools available in the literature in helping inform adaptation decisions with a particular focus in the assessment of climate change
1 Note that the existence of chaotic systems can lead also to a probabilistic representation (this is the motive behind ensemble weather forecasting) and does not in all cases imply “ignorance”.

13
uncertainties.2 Further, the report reviews existing frameworks for decision making under uncertainty for adaptation to climate change. It explores a broad range of areas of climate change impacts and impacted sectors of society and economy that may require a response of planned adaptation.
The questions addressed in this scoping study focus on three interrelated areas: decision context, strategies for decision making under uncertainty, and scientific methods to assess uncertainty in projections of climate change and impacts. The questions are:
Decision context Where are adaptation decisions needed or expected in the Netherlands: to what changes do we need to adapt and where? What parties are involved in adaptation decision making?
Adaptation decision making under uncertainty What decision making frameworks for adaptation are proposed in the literature and or used in other countries? What strategies exist to account for uncertainty in adaptation decision making?
Assessing uncertainties in (regional) climate change projections What methods are available to assess climate change impact uncertainties to inform adaptation decisions?
The primary audience of this report is the Netherlands Environmental Assessment Agency (MNP), who funded this Scoping Study under MNP project S/550032 ‘Onzekerheden, Transparantie en Communicatie’. Within this project, methodologies for assessing and communicating uncertainties are developed for use in the MNP. A specific case that is currently of interest within MNP is the uncertainty surrounding climate-adaptation decision making. This report has been written as a scoping study of the topic, reviewing the available literature, serving as a reference point, synthesising the knowledge and sketching out some potential ways forward. These recommendations will be considered by MNP in their follow-up work in this area.
There is now growing momentum in the area of adaptation to climate change at the international level. The IPCC Fourth Assessment Report has an entire chapter devoted to adaptation practices, options, constrains and capacity (Adger et al. 2007), and some attention is given to the issue of uncertainty in a chapter on new assessment methodologies and characterisation of future conditions (Carter et al. 2007) as well as parts of the Working Group I report. At the United Nations Framework Convention on Climate Change level, the Nairobi work programme on impacts, vulnerability and adaptation to climate change is of relevance here. This five-year programme was adopted in 2005 at COP-11 in Montreal, and is described in decision 2/CP.11. The main objectives of the Nairobi Work Programme are to: 1) assist countries to improve their understanding and assessment of impacts, vulnerability and adaptation and; 2) assist countries to make informed decisions on practical adaptation actions and measures to respond to climate change on a sound, scientific, technical and socio-
2 There are many dimensions to uncertainty, but in this report we have focused on the more technical and methodological dimensions and its scientific assessment. We are aware that organizational and cultural issues associated with accepting and managing uncertainty are important, but we have not examined this systematically in the report.
14
economic basis, taking into account current and future climate change and variability. The Nairobi Work Programme is structured around nine areas of work, each of them key to increasing the ability to successfully adapt. These areas of work include: methods and tools; data and observations; climate modelling, scenarios and downscaling; climate related risks and extreme events; socio-economic information; adaptation planning and practices; research and technologies for adaptation; economic diversification. Uncertainty is an important component of all these areas of work.
Recently, the European Commission adopted its first policy document on adapting to the impacts of climate change (CEC 2007) . This Green Paper is based on four core pillars: 1) early action in the EU; 2) integrating adaptation into EU external actions; 3) reducing uncertainty by expanding the knowledge, base through integrated climate research, and; 4) involving European society, business, and public sector in the preparation of coordinated and comprehensive adaptation strategies. The Green Paper is the basis for the current on-going public debate, via web-based consultations and workshops, about adaptation to climate change in Europe. In 2008 it is expected that a revised policy document will be drafted, subjected to an impact assessment and introduced as an official Adaptation White Paper later in the year.
Various EU Member States are currently preparing national adaptation strategies, plans or frameworks. Finland, for example, has adopted a National Strategy for Adaptation to Climate Change that details cross-sectoral adaptation measures that should be mainstreamed into regular planning over the period 2005-2015. Other Member States, such as the UK and the Netherlands, are in the process of developing their national adaptation strategies. Adaptation planning is also occurring at the sub-national level. Many regions (York and Humberside in the UK; Queensland in Australia), cities (e.g. London, Rotterdam, Nijmegen) and municipalities (Cape Town in South Africa, see, Mukheibir and Ziervogel 2007) have developed or are developing climate change strategies that include adaptation.
The focus of this report is on the Netherlands. In section 2 we will discuss the issue of adaptation to climate change in the Netherlands, reviewing the observed changes in the climate of the Netherlands and their impacts (2.1), presenting a short history of Dutch climate change adaptation (2.2), explaining where in the Netherlands adaptation decisions might be needed or expected (2.3), and describing the Dutch climate change scenarios (2.4). Section 3 reviews decision making frameworks for adaptation to climate change, with a focus on decision making under uncertainty. We briefly review attitudes to risk and uncertainty, and generic risk philosophies (3.1). Next we introduce two major policy principles of dealing with uncertain environmental risks: the prevention principle and the precautionary principle (3.2). We continue with a detailed review of strategies for accounting for uncertainty in decision making and frameworks for decision making under uncertainty, which we group in two main classes: top-down prediction oriented approaches (3.3) and bottom-up resilience oriented approaches (3.4). In section 4 we review the current practice of uncertainty assessment in climate risk assessment and what uncertainty tools and uncertainty assessment methods are used or proposed in the literature in each of the steps in the causal chain of climate change from socio economic drivers to climate impacts. Section 5 brings together the decision making frameworks and the uncertainty methods identified in sections 3 and 4, and explores how they match to each other. It also presents a hypothetical case study on flood risks under climate change uncertainty, illustrating what the various methods can contribute. Finally, section 6 summarizes the main findings of this scoping study and presents some conclusions and recommendations.

15
2. Adapting to climate change in The Netherlands
2.1 Observed changes in the climate of the Netherlands and their impacts
At the request of the State Secretary for the Environment, MNP put together a comprehensive review of existing knowledge on the effects of climate change in the Netherlands (MNP 2005). One of the major conclusions of this report is that the climate is already changing in the Netherlands. Over the last century, temperature in the Netherlands has increased in accordance with global mean temperature, except for recent decades, where the rise has been 1.5 times the world average. This has been shown to be mainly due to changes in the dominant wind directions (see Oldenborgh and Ulden 2003). The number of cold days has decreased, while the number of hot days has increased, particularly since 1975. Despite large variability in precipitation records, there is a trend towards an increase in annual precipitation over the last century. This is mostly due to an increase in precipitation between October and March; rainfall between April and September has remained unchanged. It is also believed that high intensity precipitation has been increasing. There has been a decrease in storminess over the Netherlands for the period 1962-2002 (Smits et al. 2005) although this timeframe is short to base strong conclusions on. The sea level along the Dutch coast has risen by about 20 cm as an average during the past century.3
These observed changes have already affected various natural and human systems. River flows in the Rhine have increased in the winter and decreased in the summer over the past few decades, though we should be aware that this is the joint effect of changes in climate, water management and land use changes upstream in Germany and Switzerland. Partially as a result of observed changes in the climate, the temperature in the river water has increased by more than 3ºC over the last century.4 The last ‘severe flood’ occurred in 1953, but ‘light floods’ have occurred more recently (e.g., in 1998).5 Severe droughts have also occurred in the recent past (e.g., 1959, 1976 and 2003). None of the recent floods or droughts have been directly attributed to recent observed changes in the climate of the Netherlands (cf. Stott et al. 2004, Stone and Allen 2005). The effects of the observed temperature rise can be seen in the natural environmental in the Netherlands. This includes northward migration of plants and animals, earlier start of the spring season and disruption of relationships within the food chains. Vliet et al. (2002) have showed that the pollen season has been starting 3 to 22 days earlier from 1969 till 2000. A number of commercial sectors have experienced problems during low flows including inland navigation and electricity production companies. Box 2.1 details the observed impacts experienced in the summer of 2003.
3 This is the absolute rise in sea level. The total impact along the Dutch coast (i.e., the relative sea level rise) is larger, since subsidence of the ground level also has also occurred. During the 20th century this subsidence in the Netherlands varied on average between 0 and 4 mm per year, depending on the exact location. 4 This figure is for average annual temperature of the water in the Rhine at Lobith during the period 1909-2003. It is estimated that one third of the increase is attributable to observed changes in the climate. 5 The term ‘severe flooding’ describes a situation which is life-threatening, possibly with casualties; the term ‘light floods’ is used when there may be damage to buildings and/or the agricultural infrastructure but the situation is not life-threatening (MNP 2005).

16
Box 2.1: The extremely hot and dry summer of 2003
The summer heatwave of 2003 provides a good proxy of potential future conditions given that according to Stott et al. (2004) more than half the years will be warmer than 2003 by the 2040s and by the end of the century, 2003 would be classified as an abnormal cold summer.6While the heatwave was not as extreme as in other part of Europe (e.g., central Europe), the Netherlands suffered various impacts. Due to the low supply of water in the Rhine, the brackishness from the sea gradually spread inland, with the result that in the middle of August the inlet points of the Rhineland and Schieland Water Boards became brackish. This caused damage to tree nurseries in the middle of the Netherlands because of their intolerance to salt. Extremely low water levels forced inland ships to use a fraction of their normal loading capacity, thus increasing transportation costs significantly. Energy production temporarily decreased as a consequence of a shortage of cooling water; a tight situation arose (code ‘red’ in terms of certainty of delivery) for a period of almost 40 days when the water temperature was above 24ºC.7 High water temperatures and low river level threatened the cooling capacity of several power stations. A number of peat dikes lost a critical amount of water due to the persistent drought, which ultimately resulted in their collapse and light flooding (e.g., Wilnis, Rotterdam, Stadskanaal). The heatwave lead to the premature death of about 400-500 people in the Netherlands.8 Consumption of drinking water rose by 2%, compared to 2002, mainly for watering gardens and lawns.
2.2 From curative reactive adaptation to planned precautionary adaptation
The history of water management and flood protection in the Netherlands can be seen as continuous adaptation, but most of it was not to anticipated environmental changes but reactive responses to floods and disasters. In the last century, a series of floods each triggered a further step in the development of flood protection in the Netherlands. A major storm tide flood in 1906, that inundated many polders along the East Scheldt and the West Scheldt, gave rise to large scale dike strengthening. The storm tide flood of 1916 hit mainly the north of the Netherlands. This flood was the direct reason to close the Zuider Zee with the "Afsluitdijk" (a 32 kilometer Closure-dike), which was completed in 1932 (Geluk 1977). The storm tide flood of 1953 - in which 1835 people drowned - gave rise to the start of the Delta Works.
In their 1960 report, the Delta Committee has set standards for safety with respect to flooding (Commissie 1960). The starting point was that all protection works protecting the Randstad should be constructed to resist a flood level of 5 meter above NAP (Amsterdam Ordnance Datum, a national Dutch levelling reference system). The probability that this level would be exceeded was estimated at that time to be once in 10000 year. For the other areas threatened by tidal waters, a construction standard to resist flood levels that occur once in 4000 years was set. These standards have been the starting point of the Dutch coastal defence policy. In 1977 the Committee Brecht (Committee on River Dikes) formulated a construction standard for the dikes of the river Rhine: they should be constructed to resist a river discharge at
6 This projection used the HadCM3 model under the SRES A2 scenario. 7 A water temperature of 23°C applies as the critical limit for the use of cooling water. 8 Recent calculations for the Netherlands demonstrate that the increased air pollution (ozone, particulate matter) during heat waves is responsible for about 25–40% of the registered ‘heat wave mortalities’.

17
Lobith of 16500 m3/sec, which would occur statistically once in 1250 years. In 1986 the same standard (1:1250) was adopted for the dikes of the river Meuse, corresponding to a maximum discharge of 3650 m3/sec at Borgharen. In 1989 the construction standard for dikes of the Lake IJssel was set on a water level that would occur once in 4000 years. In 1993, the Committee Boertien lowered the design discharge for the Rhine to 15000 m3/sec which according to them still corresponded to a once in 1250 years flood risk. In 2001, the Rhine discharge at Lobith corresponding to once in 1250 years flood risk was recalculated again to be 16000 m3/sec (Klein et al. 2001).
In the mid nineties the government proposed a new "Law on sea-defence and river dikes" (Wet op de Waterkering), that provides the legal framework for flood risk management in the Netherlands. It is with this law that the paradigm shift from reactive and curative adaptation in response to disasters towards planned adaptation in response to anticipated climate change begins. In the light of the expected increased sea level rise through global warming (at that time estimated to be about 0.6 meter per century), the law takes the same standards as set by the Delta Committee, but connect these standards to inundation probabilities of an area rather than fixed design flood levels. In this law it is explicitly stated that the safety standards (such as design flood levels) have to be recalculated every five year, and that dike managing authorities have to certify every five years that their dike still meets the requirements. In this way it is tried to prevent that the effect of climatic changes causes surprises and dikes have to be adapted to the new situations regularly. This is the main reason that in this law, design water levels etc, are not given in meters above NAP to withstand but in inundation probabilities (Louisse 1990). The approach also acknowledges that flood probability is not just a consequence of loading probability. See for example CUR/TAW (1990).
Recently it has been recognized that coordinated action for a national adaptation strategy is urgently needed to timely meet the challenges to spatial planning and spatial development of the anticipated climate change and climate impacts the Netherlands faces. This has led to the formation in 2006 of a "Nationaal Programma Adaptatie Ruimte en Klimaat" (National Program on Spatial Planning and Adaptation to Climate Change, ARK), in which the national government (especially the ministries VROM, V&W, LNV, EZ ) collaborates with the regional governments (provinces, with IPO as their umbrella organization) and local governments (with the VNG as umbrella organization of the municipalities) to jointly develop an adaptation strategy with a planning horizon of 100 years. On the European level a similar initiative has been taken in the project European Spatial Planning Adapting to Climate Events (ESPACE, www.espace-project.org).
2.3 Where are planned adaptation decisions needed or expected in the Netherlands?
At present, the water sector is the only sector in the Netherlands that has a legal obligation to take anticipated climate change into account. Key players in Netherlands water management are Rijkswaterstaat, with RIZA taking care of inland safety and RIKZ taking care of coastal protection, and the 26 Water Boards (waterschappen) governing the regional water issues.In the context of "Water Management in the 21st Century" (WB21), - the Netherlands water policy - a scenario of maximum river discharge is used, based on a set of regional scenario's developed by KNMI in 2000 (see section 2.4). The planning horizon is 100 years and the scenario foresees a sea level rise of 60 cm (central estimate) in the next century and an associated rise in the water level of the Lake IJssel. In addition, the water policy used

18
projections of maximum river discharge simulated with regional climate models, taking the IPCC scenarios as a boundary condition. It foresees a 40% increase in winter river runoff and a 30% decrease in summer river runoff by 2050. For soil subsidence of low-lying parts of the Netherlands a range between 2 and 60 cm is anticipated until 2050. Finally this 2000 scenario anticipates a 3 to 12% increase in winter precipitation and a few percent decrease in summer precipitation (Werners et al. 2004). The present water program aims to prepare and protect the Netherlands by 2015 for river runoff of the Rhine up to 16000 m3/s. After 2015, a follow up program should defend NL against 18000 m3/s runoff of the Rhine. The Dutch government reserved 1.9 billion Euro for these programs. Scenario's for extreme low water conditions are in preparation.
Other sectors where adaptation has started to get some initial attention include coasts, spatial planning, housing, transport, nature and rural area's, agriculture, fresh water, fisheries and health. Good sector by sector inventories of climate adaptation issues include an overview by Werners et al. (2004) and the so called "Route Planner" reports (Kwadijk et al. 2006, Pater and Drunen 2006, Van Drunen 2006, Veraart et al. 2006, Van Ierland et al. 2007) that outlines a long term strategy to achieve a ‘climate-proof’ Netherlands. The latter has been developed in the framework of the Netherlands ARK program building on the research work of three major Dutch research programmes: Climate Changes Spatial Planning, Living with Water and Habiforum. The Routeplanner made an inventory of 96 adaptation options that were reviewed according to five criteria: importance, urgency, no-regret (also beneficial if climate does not change), secondary effects and mitigation synergies. This led to a selection of 46 adaptation options. The high priority options turned out to be not equally distributed over the various sectors: for instance 37% of these had to do with water, while only 2% applied to the health sector, the other sectors (nature, agriculture, energy, transport, housing & infrastructure, and recreation) each had a share of about 15% of the priority options (some options applied to multiple sectors).
In appendix 1 we provide an explorative and non-exhaustive overview of sectors of society and economy where planned adaptation to climate change may have net societal benefits. In most of these sectors strategy formation for adaptation to anticipated climate change seems to be absent at present. In a few sectors, the early stages of such strategy formation seem to be emerging. For instance, triggered by capacity problems of the sewage system during a extreme precipitation event on 14 August 2006, the sewage water infra structure sector started to show interest in KNMI scenarios for changes in extreme precipitation for decision making on pipe-diameter and buffering capacity in the sewage water infra structures. The energy supply sector has also started to include anticipated climate change in their decisions: the Gasunie uses KNMI scenario's to be prepared for extreme events in maintaining energy supply security (dimensioning of buffering in natural gas supply to meet peek demand during extreme weather events). Other sectors that have started to think about using climate impact projections for adaptation are tourism (Maastricht developing a tourism comfort index), sports (in reaction to deaths from extreme heat during the "Nijmeegse Vierdaagse" long distance hiking event, on a exceptionally warm summer day) and the building sector (mainly for dimensioning of cooling capacity of buildings).
Where sectoral examples are used in this scoping study, the main focus is on water management (floods, precipitation changes etc.) and particularly the challenge to develop long term adaptation strategies related to the combined effects of sea level rise and changes in river runoff and groundwater pressure ("kweldruk" in Dutch). Exploration of such long term adaptation strategies has been the focus of the MNP-study "Nederland Later" (MNP 2007).

19
2.4 Climate change scenarios
In some adaptation frameworks, climate change scenarios are the main driver of biophysical and socio-economic impacts, thus being of key importance in devising adaptation strategies (Dessai et al. 2005). The Netherlands has published a number of climate scenarios in the past (Klein Tank et al. 1995, Kors et al. 2000, Können 2001, Hurk et al. 2006). A formal set of climate change scenarios was prepared in the context of the ‘Water Management in the 21st Century’ (WB21) project (Kors et al. 2000, Können 2001). These scenarios had mean global temperature change as their independent driving variable, with a low, central and high value adopted (these values are internally relative and not absolute, i.e., they are only low, central or high compared to each other; there are other plausible scenarios that are lower or higher). The scenarios assumed that local temperature change was the same as global mean temperature change and precipitation was estimated by using an observed relationship between temperature and precipitation intensity. After the publication of the WB21 scenarios additional scenarios were constructed at the request of users. One scenario assumed that the global temperature rise would be accompanied by a strong decline of the thermohaline circulation, thus giving a relatively strong cooling of Northwest Europe (based on Klein Tank and Können, 1997). Another scenario was based on evidence from early GCM and RCM simulations for Europe, in which higher temperatures would lead to strong drying of the continent during summer, which in turn would lead to enhanced warming and reduced precipitation (see Können 2001 for numerical details and Table 2.1).

20
Box 2.2 The Dutch Challenge Project
In order to study the probability of extreme events in a changing climate, the Netherlands Centre for Climate Research (CKO) decided to produce a large ensemble of transient climate simulations in 2003. For this purpose, the CKO used the TERAS, the supercomputer of the Academic Computing Centre at Amsterdam (SARA). The NCAR Community Climate System Model, version 1.4, was ported to the machine at SARA. During three months, 256 ofits processors were dedicated to this project, thus calculating a total of 62 simulations of the global climate for the period 1940-2080. During the historical part of the simulation, GHG concentrations, sulphate aerosols, solar radiation and volcanic aerosols were prescribed according to observational estimates. From 2000 onwards, solar radiation was held constant and sulphate aerosols were kept fixed. Only the GHG concentrations varied according to a Business-as-Usual scenario, which was similar to the SRES A1 scenario. The ensemble members differ only in a small random perturbation in the initial temperature field of the atmosphere, enough to lead to entirely different atmospheric evolutions within the first couple of weeks of the integrations. An example of the results of this ensemble experiment is show in Figure 2.1. It shows that the probability of cold days in January may decrease in the future as result of GHG emissions. This sort of analysis is useful to get a handle on the uncertainty associated with the internal variability of the climate system as represented by the chosen GCM (see, e.g., Selten et al. 2004). However, the scope of this probabilistic experiment is limited because it does not involve perturbed physics and intra-model comparison.
Figure 2.1 Probability density function of daily mean temperatures over the Netherlands, for January for the period 1951-1980 (black solid) and 2051-2080 (grey solid). Short vertical lines indicate the temperatures of the one in 10 year cold extremes (left ones), the mean
temperatures (middle ones) and the one in 10 year warm extremes (right ones) (Selten et al. 2003)

21
In 2006 a new set of scenarios was published presenting four scenarios of how the climate in the 21st century could change in the Netherlands (Hurk et al. 2006, Klein Tank et al. 2006). The scenarios present changes in temperature, precipitation, potential evaporation and wind for a 30 year-period centred around 2050 and 2100 (compared to 1976-2005), and sea level rise for 2050 and 2100. Hurk et al. (2006) found that most of the range of regional climate change over the Netherlands can be related to changes in global mean temperature and changes in atmospheric circulation patterns over Europe. Some user consultation was conducted with a number of sectors such as water, nature/ecosystem, energy, agriculture, transport and infrastructure, industry, financial services and public health. Using scientific knowledge and the user consultation, Hurk et al. (2006) devised four scenarios on the basis of the GCM range of mean global temperature change (approximately 1-2ºC by 2050 compared to 1990) and whether there was a strong9 or weak change in circulation (see Figure 2.2). Hurk et al. (2006) dealt with the large uncertainties in projecting future climate by using a small number of climate scenarios that are relevant (for decision making), plausible and internally consistent pictures of how the climate may look like in the future.
Figure 2.2 Schematic overview of the four KNMI’06 climate scenarios. G=moderate (“gematigd” in Dutch) W=Warm.
The 2006 climate scenarios were constructed by combining information from global and regional climate models in a novel approach (Lenderink et al. 2007). Results from several GCMs (mainly ECHAM5, CCC63, GFDL2.1, HadGEM and MIROCHi) and eight RCMs (DMI, ETH, GKSS, METO, ICTP, KNMI, MPI and SMHI) were used based on an evaluation of their simulations compared to present day climate (van Ulden and van Oldenborgh 2006). Because the RCM simulations had only been driven by two GCMs, additional scaling and weighing rules were designed to generate RCM sub-ensembles matching the seasonal mean precipitation range suggested by the GCMs (see Figure 2.3).
9 A strong change of circulation induces warmer and moister winter seasons and increasing likelihood of summertime dry and warm situations.

22
Figure 2.3 Schematic presentation of the methodology used for the construction of the KNMI’06 climate scenarios. The blue rectangles describe the sources of scenario information
in the green rectangles. The arrows symbolise the information flow. Information about the climate system at global, regional and local scales was used for the climate scenarios.
Some selected results of the KNMI scenarios are shown in Table 2.1 for 2050. In general both summer and winter temperature and precipitation are expected to increase under scenarios G and W. Scenarios with circulation changes (G+ and W+) expect summer precipitation to decrease. Two sea level scenarios were constructed on that basis of high and low global mean temperature change for 2050 and 2100 (also shown in Table 2.1).
Table 2.1 Mean changes in some variables of Dutch climate scenarios in 2050 (Können 2001, Hurk et al. 2006).
WB21 climate scenarios (Können 2001) KNMI’06 climate scenarios (Hurk et al. 2006)
Low Central High
Change of Atlantic circulation
Highdry G G+ W W+
Annual temperature (ºC) 0.5 1 2 -2 2 Summer temperature (ºC) 0.9 1.4 1.7 2.8Winter temperature (ºC) 0.9 1.1 1.8 2.3Summer precipitation (%) 0.5 1 2 -2 -10 2.8 -9.5 5.5 -19Winter precipitation (%) 3 6 12 -12 -10 3.6 7 7.3 14.2Summer evaporation (%) 2 4 8 -8 8 3.4 7.6 6.8 15.2Absolute sea level rise (cm) in 2050 5 20 40 40 15.6-24.6 15.6-24.6 19.6-33.9 19.6-33.9Absolute sea level rise (cm) in 2100 10 50 100 100 34.9-59.5 34.9-59.5 42-84 42-84

23
3. Decision making frameworks for adaptation to climate change
In the past, decision making frameworks on climate change have largely focused on mitigation decisions. In a review of decision analysis frameworks for the IPCC Third Assessment Report, Toth (2000) noted that the literature on climate change adaptation decision making is scanty. He defined decision analysis frameworks as analytical techniques aimed at synthesising available information from many (broader or narrower) segments of the climate problem in order to help policymakers assess consequences of various decision options in their own jurisdictions. Toth (2000) compiled an incomplete catalogue of decision analysis frameworks that we reproduce here due to its relevance for climate change adaptation (Table 3.1).10 The decision principles or criteria shown in the table below are not exhaustive, but they cover much of the literature in the area: for optimisation/efficiency see Fankhauser et al.(1999), for equity see Paavola and Adger (2006) and for the precautionary principle see van der Sluijs and Turkenburg (2006). Adger et al. (2005) have argued that elements of effectiveness, efficiency, equity and legitimacy are important normative evaluative criteria in judging successful adaptation.11
Table 3.1 Decision analysis frameworks and their compatibility with decision making principles (- is weak but not impossible, + possible but not central and * essential feature of the decision analysis framework) (Adapted from Toth 2000).
Decision principles Decision analysis frameworks Optimisation/efficiency Precautionary
principleEquity
Decision analysis * + + Cost-benefit analysis * - + Cost-effectivenessanalysis
* + +
Tolerablewindows/Safelanding approach
+ * +
Game theory + - + Portfolio theory * + - Public finance theory * - * Behavioural decision theory
- + +
Ethical and cultural prescriptive rules
- + +
Policy exercises + + + Focus groups - + + Simulation-gaming - + +
Toth (2000) describes these decision analysis frameworks in broad terms in his paper so we refer to that for further detail. Here we elaborate on literature that has used these frameworks
10 In the IPCC TAR only decision analysis, cost-benefit analysis, cost-effectiveness analysis and the policy exercise approach are mentioned. In part this is because many decision analysis frameworks overlap in practice, and clear classification of practical applications sometimes is difficult. 11 Two key indicators of the effectiveness of an adaptation action is robustness to uncertainty and flexibility.

24
to examine adaptation to climate change and subsequently how uncertainty has been dealt with.
In the context of decision analysis, Hobbs et al. (1997) used decision trees and Bayesian analysis to assess climate change risk to two specific investment decisions in the Great Lakes region: a regulatory structure for Lake Erie, and breakwaters to protect Presque Isle State Park, PA. They found that beliefs about climate change can affect optimal decision. Cost-benefit analysis has not frequently been applied yet to climate change adaptation because of the difficulty of estimating the costs and the benefits, but this is also evolving (see Metroeconomica 2004). Cost-effectiveness analysis has been proposed by Smith (1997) whereas portfolio theory has recently been applied to the adaptation of water management systems to climate change (Aerts and Werners 2007). Behavioural decision theory has also been applied to adaptation, but mostly in the context of past climate variability (Patt and Gwata 2002, Marx et al. 2007). Cultural perspectives have also been applied to adaptation in the context of flood management in the Rhine and Meuse rivers (Middelkoop et al. 2004). A mixture of a policy exercise and a focus group was conducted by Few et al. (2007) as part of an inclusive approach to adaptation that involved public participation in the context of long-term coastal management in the UK and elsewhere. See Olsthoorn et al. (2005) for a similar exercise in the context of Dutch responses to five meter sea level rise, and Lonsdale et al. (2008) for a stakeholder role play exercise for adaptation to extreme sea level rise in the Thames Estuary.
Each one of these frameworks is a huge field in itself. For example, decision analysis includes some features of sequential decision making (Hammitt et al. 1992), hedging (Yohe et al. 2004); versions of multicriteria analysis (Bell et al. 2000); applications such as risk assessment (Jones 2001), etc. In general decision analysis has dealt with uncertainty by using scenarios (Risbey 1998), probabilistic descriptions (Yohe 1991) or fuzzy sets (Prato 2007). Behavioural decision theory, which includes behavioural economics, psychology and other fields, is geared towards understanding how people understand and process uncertain information.
We argue that two main schools of thought have emerged on how to deal with climate change uncertainty in adaptation under which the various decision analysis frameworks can fit into.
One school of thought is prediction oriented. It argues that if there is uncertainty about climate change then uncertainty needs to be characterised, reduced12, managed and communicated. This leads to an ever increasing sophistication of modelling tools and techniques to describe future climates and impacts. This school of thought emanates from conventional public policy analysis13, decision analysis, the risk analysis literature and the IPCC to some extent.
The other school of thought is resilience oriented. They accept that some uncertainties associated with climate change are irreducible, therefore they emphasise learning from past events. “Learning to live with uncertainty requires building a memory of past events, abandoning the notion of stability, expecting the unexpected, and increasing the capability to
12 For example by doing more research, although this often leads to more uncertainty in complex systems such as the global climate. 13 For example, fiscal policy is often designed to give investors and tax-payers as much certainty as possible, so that they have clear policy framework within which to make their calculations (Barg et al. 2006).

25
learn from crisis” (Berkes 2007). This thinking comes from the fields of societal and policy learning, adaptive management for natural resources, and complex adaptive systems research.
The prediction approach leads to an emphasis on foreseeing the future while the resilience approach expects the future to bring unanticipated surprises and tries to learn from the past.14
Figure 3.1 shows how these two approaches can inform adaptation: the top-down approach relates to prediction and the bottom-up to resilience. These schools of thought emerge not only because of their different attitudes to uncertainty – one is uncertainty ‘reducer’ (to the quantifiable part) while the other is uncertainty ‘accepting’ – but for a range of other reasons such as different epistemologies, the unit of analysis being considered, the issue of timescale and planning horizons, and the development status of the region or country (Dessai and Hulme 2004). The issue of timescales of adaptation decisions is particularly significant in the context of uncertainty because over the next couple of decades there is little sensitivity to greenhouse gas emission uncertainty, whereas by the end of the century it represents a significant uncertainty (see Zwiers 2002).
Climateadaptation
policy
World development
Global greenhouse gases
Global climate models
Regionalisation
Impacts
Vulnerability(physical)
Vulnerability(social)
Adaptive capacity
Indicators base on:TechnologyEconomic resources
Information & skillsInfrastructureEquityInstitutions
Past Present Future
Bottom-up approach
Top-down approachGlobal
LocalClimate
adaptationpolicy
World development
Global greenhouse gases
Global climate models
Regionalisation
Impacts
Vulnerability(physical)
World development
Global greenhouse gases
Global climate models
Regionalisation
Impacts
Vulnerability(physical)
Vulnerability(social)
Adaptive capacity
Indicators base on:TechnologyEconomic resources
Information & skillsInfrastructureEquityInstitutions
Vulnerability(social)
Adaptive capacity
Indicators base on:TechnologyEconomic resources
Information & skillsInfrastructureEquityInstitutions
Past Present Future
Bottom-up approach
Top-down approachGlobal
Local
Figure 3.1. “Top-down” and “bottom-up” approaches used to inform adaptation to climate change (from Dessai and Hulme 2004).
14 Although the resilience approach comprises much more than vulnerability assessment alone, it should be noted that vulnerability assessment tends to focus on near-term climate risks (Washington et al. 2006).

26
The next sections elaborate first on attitudes to risk and uncertainty (3.1), then two major principles of dealing with risk and uncertainty are introduced: the prevention principle and the precautionary principle (3.2). Next, the two schools of thought: predictive (top-down, 3.3) and resilience (bottom-up 3.4) are explored and finally some mixed approaches (3.5) are discussed.
3.1 Attitudes to risk and uncertainty People consider a number of dimensions or risk attributes when they judge risks and decide whether or not they consider a given risk acceptable or not. The degree to which people consider a risk acceptable or not depends not only on the magnitude of the damage and the probability that damage will occur, but on other risk dimensions as well. A given risk tends to be seen as less acceptable if the (perceived) controllability of consequences is lower; if the nature of the consequences is unfamiliar and dreadful; if one is exposed to the risk involuntarily; if the benefits of the activity are less clear and smaller; if the effects are more acute and more nearby in space and time; if risk and benefits are unfairly distributed; and if the likely harm is intentional (Vlek 2004).
Attitudes towards risks vary across people, cultures, time and experience. Some people have a risk-seeking attitude whereas others have a risk averse attitude. Ultimately, which school of thought (top-down, bottom-up or a mixed approach) is pursued or given more weight depends critically on the attitudes to risk and uncertainty of those actors involved in the adaptation process and the decision making environment where adaptation happens. For example, private water supply companies in England and Wales are adapting to climate change in a highly regulated environment where certainty is required for multi-million pound investments to be approved (see Arnell and Delaney 2006). This leads to a focus on the prediction approach to deal with uncertainty. In the context of present-day collective action for community-based coastal management in Trinidad and Tobago, Tompkins and Adger (2004) have showed that community-based management enhances adaptive capacity in two ways: by building networks that are important for coping with extreme events and by retaining the resilience of the underpinning resources and ecological systems. Under this approach enhancing adaptive capacity leads to greater resilience to climate change, which does not require precise information about how the climate will change. Still uncertainty remains as to whether the adaptive capacity of the system is sufficient to withstand future climate stresses on that system.
Walters (1986) has noted two types of attitudes about the objectives of formal policy analysis that are relevant to uncertainty and climate change adaptation (Table 3.2). Walters’s typology can be dismissed as a caricature in setting conventional as narrow minded and adaptive as enlightened, but the point it makes is still relevant. What Walters (1986) calls a conventional attitude tends to lead to a predictive oriented assessment whereas an adaptive attitude tends to lead to a resilience approach.

27
Table 3.2 Conventional and adaptive attitudes about the objectives of formal policy analysis (Walters, 1986, p. 351). Conventional Adaptive Seek precise predictions Build prediction from detailed understanding Promote scientific consensus Minimize conflict among actors Emphasize short-term objectives Presume certainty in seeking best action Define best actions from a set of obvious alternatives Seek productive equilibrium
Uncover range of possibilities Predict from experience with aggregate responsesEmbrace alternatives Highlight difficult trade-offs Promote long-term objectives Evaluate future feedback and learning Seek imagination in new options Expect and profit from change
Cultural theory (Douglas and Wildavsky 1982) is also useful to elaborate on people’s attitude to risk and uncertainty. Risk attitudes tend to coincide with views of nature that people have. For example, egalitarians see nature as fragile and humans as good and malleable. The egalitarian worldview implies a risk-averse attitude with a preventive management style (perhaps akin to the precautionary principle). One should be aware that being risk averse to ecological risks is not the same as being risk averse to economic risks. For individualists, nature is robust and people are self-seeking. They are characterised as risk seeking, which leads to an adaptive management style that mostly focuses on the short-term. Hierarchists believe nature is tolerant within limits and that people are sinful. The management style of hierarchists is to control situations by keeping the system within its limits. Hierarchists have a risk-accepting attitude. Cultural theory also mentions the fatalist, who is indifferent to risk, corresponding to a view of nature as capricious or risk as fate.
We are aware that no decision-maker fits nicely into each of these categories, but this provides an overview of the diversity of attitudes to risk and uncertainty. It is interesting to note that Middelkoop et al. (2004) note that the Dutch style of water management largely matches the Hierarchist management style.
Weiss (2003, 2006) proposed a framework that links levels of evidence of risk, levels of intervention and attitudes to risk. When scientific uncertainty is hard to quantify, we may still be able to express a well-argued judgment of how convincing the evidence of risk is for which Weiss suggests that the standards of proof used in legal practice could offer some guidance (see table 3.3).

28
Table 3.3 Levels of evidence Source: Weiss (2003). Level Scale based on Legal Standards of
ProofLegal Situation where Standard of
Proof Applies 11 Virtually certain Exceeds criminal standard 10 “Beyond a reasonable doubt” Criminal conviction 9 “Clear and convincing evidence” Quasi-penal civil actions, such as
termination of parental rights 8 “Clear showing” Granting temporary injunction 7 “Substantial and credible evidence” Referring evidence for impeachment 6 “Preponderance of the evidence” Most civil cases 5 “Clear indication” Proposed criterion for nighttime, X-Ray or
body cavity searches 4 “Probable cause”, “Reasonable belief” Field arrest, Search incident to arrest;
Search warrant; Arraignment or indictment 3 “Reasonable indication” Initiate FBI investigation or trade inquiry 2 “Reasonable, articulable grounds for
suspicion”Stop and frisk for weapons
1 “No reasonable grounds for suspicion,” “Inchoate hunch”, “Fanciful conjecture”
Does not justify stop and frisk
0 Insufficient even to support a hunch or conjecture
Action taken could not have resulted in the crime being charged
The argument by Weiss is that in responding to risks, similar to the situation in the court, different levels of evidence justify different levels of policy intervention. However, the relation between the level of evidence and the level of intervention justified is not objective, but strongly depends on ones risk attitude. For that purpose, Weiss distinguishes 5 different attitudes to risk: the scientific absolutist, who insists on rigorous scientific proof in order to justify any intervention; the environmental absolutist, who is prepared to accept very significant costs at even the hint of an environmental danger; and the techno-optimist, the environmental centrist, and the cautious environmentalist, who fall between these extremes.
Figure 3.2 sketches the relationship between level of evidence and level of intervention justified for different risk attitudes. Note that these curves will also depend on the perceived severity of the possible harm: the more severe the possible harm is perceived to be, the lower the level of evidence will be that is felt to be sufficient to justify a given intervention (compare to anti terrorism policies).

29
Figure 3.2. Justified level of interventions (vertical axis) to address shared danger of severe and irreversible harm, as a function of the level of scientific evidence (horizontal axis) and the degree of risk aversion (numbered curves) (Weiss 2003). Curves corresponding to different risk attitudes are represented as follows:
1. Environmental absolutist 2. Cautious environmentalist 3. Environmental centrist 4. Technological optimist 5. Scientific absolutist
The cultural plurality in risk attitudes implies that the question of how society ought to deal with risks can only be answered in public debate – a debate in which people will necessarily discuss their perception of risks and risk management from different points of view and different conceptual and ethical frameworks (Davidson 2002), and perhaps also from different epistemological stances as we will further discuss and explore in the following sections.
3.2 Precautionary principle versus Prevention principle The early stages of national and international policies on environmental risks can be characterized by a curative model towards our natural environment: With increased environmental impacts of growing populations and industrialization, the environment was no longer able to cure itself; it had to be helped in repairing the damage inflicted upon it by human activities. For reasons of equity and feasibility, governments sought to apportion the economic costs of such intervention by requiring polluters to pay the cost of pollution. It soon became apparent, however, that this Polluter Pays Principle was practicable only if accompanied by a preventive policy, intended to limit damage to what could be repaired or

30
compensated for. This 'prevention is better than cure' model marks the second stage of governmental action for environmental protection. This stage was characterized by the idea that science can reliably assess and quantify risks and uncertainties, and the Prevention Principle could be used to eliminate or diminish further damage (de Sadeleer 2002).
The emergence of increasingly unpredictable, uncertain, and unquantifiable but possibly catastrophic risks such as those associated with genetically modified organisms, has confronted societies with the need to develop a third, anticipatory model to protect humans and the environment against uncertain risks of human action: the Precautionary Principle (PP). The emergence of the PP has marked a shift from post-damage control (civil liability as a curative tool) to the level of a pre-damage control (anticipatory measures) of risks (de Sadeleer 2002).
The Precautionary Principle (hereafter: PP) is a strategy to cope with deep uncertainties in the assessment and management of risks. Precaution means taking action to protect human health and the environment against possible danger of severe damage even while the scientific evidence of danger is uncertain and inconclusive. Over the past two decades, the PP has been endorsed in more than 60 international agreements related to environmental protection, including the UN Framework Convention on Climate Change.
Despite divergence in the wording of the various formulations of the PP in the literature, there is congruence regarding key elements. Also, in debates about the PP broadly shared insights have emerged (UNESCO 2005).
The main common elements and points of convergence are: The PP applies when there exist considerable scientific uncertainties about causality, magnitude, probability, and nature of harm; Some form of scientific analysis is mandatory; a mere fantasy or crude speculation is not enough to trigger the PP. Grounds for concern that can trigger the PP are limited to those concerns that are plausible or scientifically tenable. Scientific and technical evidence and analysis is seen as a necessary, rather than a sufficient, basis for effective policy choices.Because the PP deals with risks with poorly known outcomes and poorly known probability, the unquantified possibility is sufficient to trigger the consideration of the PP.;Application of the PP is limited to those hazards that, though uncertain, are unacceptable. What is considered unacceptable is dependent on societal values. Some definitions emphasize the impact on future generations, or the environment, while others suggest that impacts must be irreversible before the PP can be invoked.; Interventions are required before possible harm occurs, or before certainty about such harm can be achieved; Interventions should be proportional to whatever level of protection one aims at and the magnitude of the possible harm. Some definitions call for 'cost-effective measures', while others speak only of prevention of environmental damage. Costs are only one consideration in assessing proportionality.There is a repertoire of interventions available:
o measures that constrain the possibility of the harm; o measures that contain the harm, that is limit the scope of the harm and increase
the controllability of the harm, should it occur, this implies that not only mitigation but also adaptation measures can be precautionary interventions;
31
There is a need for ongoing systematic empirical search for more evidence and better understanding (long-term monitoring and learning) in order to realize any potential for moving a situation beyond the PP towards more traditional risk management.
These common elements are taken on board by the new working definition of the PP as proposed and endorsed by UNESCO (see box 3.1).
Box 3.1: The definition of the Precautionary Principle, as endorsed by COMEST15 of UNESCO (2005).
When human activities may lead to morally unacceptable harm that is scientifically plausible but uncertain, actions shall be taken to avoid or diminish that harm.
Morally unacceptable harm refers to harm to humans or the environment that is threatening to human life or health, or serious and effectively irreversible, or inequitable to present or future generations, or imposed without adequate consideration of the human rights of those affected.
The judgment of plausibility should be grounded in scientific analysis. Analysis should be ongoing so that chosen actions are subject to review.
Uncertainty may apply to, but need not be limited to, causality or the bounds of the possible harm.
Actions are interventions that are undertaken before harm occurs that seek to avoid or diminish the harm. Actions should be chosen that are proportional to the seriousness of the potential harm, with consideration of their positive and negative consequences, and with an assessment of the moral implications of both action and inaction. The choice of action should be the result of a participatory process.
It emerges that the PP is not based on 'zero risks' but aims to achieve lower or more acceptable risks or hazards. We see this reflected in a shift in parlance from “flood defence” to “flood risk management”. It is not based on anxiety or emotion, but is a rational decision heuristic, based in ethics, that aims to use the best of the 'systems sciences' of complex processes to make wiser decisions. Finally, like any other principle, the PP in itself is not a decision algorithm and thus cannot guarantee consistency between application of the PP to different risks. Just as in legal court cases, each case will be somewhat different, having its own facts, uncertainties, circumstances, and decision-makers, and the element of judgment cannot be totally eliminated.
The UNESCO definition provides a new footing for the PP. By choosing the terms “scientifically plausible but uncertain” instead of “lack of scientific certainty” (as in the widely cited definition from the Rio declaration on environment and development in 1992) the new version of the PP avoids allusions to quantifiable risks. Whenever there is credible ground for quantifying uncertainty, the prevention principle applies instead. In that case, risks can be managed by agreeing on an acceptable risk level for the potentially harmful activities or events, and taking measures to keep the risk below the accepted maximum standard.
15 World Commission on the Ethics of Scientific Knowledge and Technology (COMEST).

32
Furthermore, the new definition recognizes the essential role of science in the judgement of plausibility of harm and understanding possible threats, uncertainties and ignorance. The PP does only make sense on the basis of the scientifically tenable grounds for concern, not of absence of certainty. The PP thus requires a science that systematically addresses uncertainty and complexity in the assessment of risks. Uncertainties, assumptions, and limits to knowledge in risk assessment need to be made explicit and communicated clearly to the various actors involved in the discourses on the management of these risks (UNESCO 2005).
Finally, the new definition allows for a wide range of precautionary actions, provided they appear effective in order to either avoid or diminish the possible harm. This answers the criticism that the PP is too narrow a tool for innovation policy as long as it only provides the go or no-go options. Also it implies that the PP is relevant to adaptation decision making, because adaptation policies can diminish and constrain possible harm.

33
3.3 Top-down approaches
Proponents of the predictive approach will argue that the reason for quantifying risk is to make coherent risk management decisions under uncertainties and within resource constraints (see, e.g., Paté-Cornell 1996). This type of information would allow decision-makers to hedge the risk of climate change by balancing the risks of waiting against premature action. Some communities – for example water resource managers and engineers – who are comfortable using uncertain information actually demand proper quantification of uncertainties in climate change projections (Hickox and Nichols 2003). Turnpenny et al. (2004) reported that various users of climate information would like a better treatment of information, e.g., one of the users said “we want a probabilistic understanding of future changes to inform business decisions”. The following sub-sections elaborate on various prediction oriented approaches that exist in the literature.
3.3.1 The IPCC approach
One of the earliest guidelines for impact and adaptation assessment was developed by the IPCC in the early 1990s (Carter et al. 1994, Parry and Carter 1998). This approach followed seven steps, which included:
1. define problem (including study area, its sectors, etc.); 2. select method of assessment most appropriate to the problems; 3. test methods/conduct sensitivity analysis; 4. select and apply climate change scenarios; 5. assess biophysical and socio-economic impacts; 6. assess autonomous adjustments; 7. evaluate adaptation strategies.
This approach relies heavily on uncertain information by using climate change scenarios (step 4) as this is the main driver of the impacts (step 5), from which adaptation strategies are devised in the last step. This framework was later expanded to include socio-economic scenarios (Feenstra et al. 1998), another major uncertainty that is relevant in the context of adaptation. Because this approach is scenario driven, further guidance was provided on the use of scenario data (both climate and non-climate scenarios) in climate impact and adaptation assessments (IPCC-TGCIA 1999) and, more recently, on the use of climate scenarios developed from regional climate model experiments (Mearns et al. 2003) and statistical downscaling (Wilby et al. 2004). This framework proposes a significant role for uncertain climate information in informing adaptation planning.
3.3.2 Risk approaches
One broad definition of risk assessment is the process of identifying, evaluating, selecting, and implementing actions to reduce risk to human health and to ecosystems (USPCC RARM as cited inJones 2001). Each community of practitioners has adopted a different definition. For example, the disaster risk management community defines risk assessment as the analysis

34
of potential hazards and the evaluation of existing conditions of vulnerability that could pose a potential threat to people, property, livelihoods and the environment. Central to risk assessment is the management of uncertainties, which allows the risk (i.e., in its simplest form probability times consequence) of something to be determined. Risk assessment and risk management have been widely applied to a number of environmental problems, but only very recently to climate change. Reasons for this include the high level of uncertainty associated with climate change projections, the global nature of the problem, the difficulty (or impossibility) of attaching probabilities to different world development paths (Dessai and Hulme 2004), and the difficulty of valuing impacts and costing mitigation/adaptation policies.Jones (2001) developed an environmental risk assessment/risk management framework to assess the impacts of climate change on individual exposure units identified by stakeholders as potentially vulnerable to climate change. This work was based on the IPCC approach (Carter et al. 1994), but it incorporated features of risk assessment frameworks. While the framework is conceptually simple, Jones acknowledges that it is difficult to implement due to the complexity of climate change. The climate impact risk assessment proposed by Jones (2001) also has seven steps:
1. identify the key climatic variables affecting the exposure units being assessed; 2. create scenarios and/or projected ranges for key climatic variables; 3. carry out a sensitivity analysis to assess the relationship between climate change and impacts; 4. identify the impact thresholds to be analysed for risk with stakeholders; 5. carry out risk analysis; 6. evaluate risk and identify feedbacks likely to result in autonomous adaptations; 7. consult with stakeholders, analyse proposed adaptations and recommend planned adaptation options.
Like the IPCC approach, uncertainty is taken into account using climate scenarios (step 2), but this particular risk approach is not totally scenario driven. It is more dependent on stakeholder involvement and their definition of critical impact thresholds. The analysis phase of the framework involves the linking of key climatic variables with impact thresholds. The conditional probabilities of exceeding those thresholds are then assessed within the context of projected ranges for key climatic variables under climate change (Jones 2001). Another example of using thresholds can be found in New et al. (2007). The United Kingdom’s Climate Impact Programme published a guidance report that helps decision-makers take account of the risk and uncertainty associated with climate variability and change and identify ‘‘good adaptation options’’ (Willows and Connell 2003). This generic framework is focused on institutional decision making. It is composed of eight stages (Figure 3.3)
Unlike the previous examples, this framework does not have uncertain climate information as a specific stage of the framework. Instead, a number of tools and techniques are suggested for stage 3 (risk assessment); see Table 3.4. They recommend that the decision-maker adopts a different level of analysis (tier) depending on: the level of decision; the level of understanding she/he has about how climate change will affect her/his decision; and whether she/he is making a climate adaptation decision or a climate influenced decision. Tier 1 would focus on risk screening, tier 2 on qualitative and generic quantitative risk assessment, and tier 3 on specific quantitative risk assessment. The higher the tier the more quantification of uncertainty will be required.

35
Figure 3.3 UKCIP’s risk, uncertainty and decision making framework (Willows and Connell 2003).
Table 3.4 Tools and techniques for Stage 3 (risk assessment) (Willows and Connell 2003). Risk screening (Tier 1) Qualitative and quantitative risk
assessment (Tier 2 and 3) Checklists Uncertainty Radial Brainstorming Fault/Event Trees Problem Mapping Tools Decision and Probability Trees Process Influence Diagrams Expert Judgement and Elicitation Consultation Exercises Scenario Analysis Fault/Event Trees Climate Change Scenarios Expert Judgement and Elicitation Cross-Impact Analysis Scenario Analysis Monte Carlo Techniques Climate Change Scenarios Modelling Tools: Process Response Models
Statistical Models Cross-Impact Analysis Development and use of Specific
Sophisticated Modelling Tools Deliberate Imprecision Climate Typing Pedigree Analysis Downscaling Bayesian Methods Markov Chain Modelling Interval Analysis
There are also a range of tools and techniques to identify (Stage 4) and appraise (Stage 5) options. Options appraisal (stage 3) is closely linked with risk assessment (stage 3) because they relate to how much adaptation is necessary and when, which depends on changes in the probability and magnitude of the significant climate variables identified by the risk assessment (Willows and Connell 2003). A tiered approach is also recommended for the options appraisal stage, which should start with the application of qualitative assessment tools

36
(tier 1), followed by semi-quantitative analysis (tier 2) or more fully quantitative analysis if warranted by the importance of the decision. Table 3.5 provides some examples of tools and techniques to appraise options.
Table 3.5 Tools and techniques to appraise options.
Tools and techniques Consultation Exercises Focus Groups Ranking/Dominance Analysis ScreeningScenario Analysis Cross-Impact Analysis Pairwise Comparison Sieve Mapping Maximax, Maximin, Minimax, Regret Expected Value Cost-Effectiveness Analysis Cost-Benefit Analysis Decision Analysis Bayesian Methods Decision Conferencing DiscountingEnvironmental Impact Assessment/Strategic Environmental Assessment Multi-Criteria Analysis (Scoring and Weighting) Risk-Risk Analysis Contingent Valuation
Revealed performance Stated performance
Fixed Rule-based Fuzzy Logic Financial Analysis Partial Cost-benefit Analysis Preference Scales Free-form Gaming Policy Exercise
Australia developed its own climate change risk management framework that is based on the Australian and New Zealand Standard AS/NZS 4360 Risk Management (BJI and MJA 2006). The guide is mostly focused on an initial assessment, which is accompanied by a set of standard climate change scenarios developed by CSIRO (Hennessy et al. 2006). The initial assessment is centred on a workshop process that is designed to identify, analyse and evaluate risks (new or pre-existing) so that the highest priority issues can be addressed with an appropriate level of efforts and urgency. The report provides examples of success criteria of different stakeholders (Table 3.6), which shows the necessity of reaching multiple objectives when dealing with adaptation to climate change.

37
Table 3.6 Examples of different success criteria for a range of stakeholders (BJI and MJA 2006).Success criteria for a local authority:
Success criteria for a public utility:
Success criteria for a business:
Maintain public safety Maintain service quality Build shareholder value Protect and enhance the local economy
Ensure reliable service delivery
Achieve planned growth
Protect existing community structures and the lifestyle enjoyed by the people of the region
Manage interaction with other providers to achieve cost-effective operation
Protect the supply chain
Sustain and enhance the physical and natural environment
Ensure that community and regulatory standards of administration are met
Maintain required human resources
Ensure sound public administration and governance
Maintain and strengthen community confidence in the organisation
Ensure regulatory and legislative compliance
Both the Australian and the UK risk frameworks recommend adaptive (or flexible) management as a strategy for dealing with climate change uncertainties. Adaptive management is the process of putting in place small, flexible, incremental changes based on regular monitoring and revision of plans using information available at the time, rather than relying on one-off, large-scale treatments (BJI and MJA 2006). This involves doing what is needed and makes sense now to address obvious risks and delaying those for which current understanding of the associated risks are less certain yet are tolerable (UKCIP 2006). Adaptive management leaves scope for decisions to be reviewed, and further decisions implemented at a series of later dates, as improved information becomes available on the nature of the present day and future climate risk (Willows and Connell 2003). In our opinion, however, sectors where adaptation actions take time to be implemented (e.g., building a new reservoir for water storage) and where low or no regret measures are unavailable, adaptive management is probably of little use. Some would argue based on experience that this is not necessarily true. Although adaptive management in the context of a single adaptive measure may have limited value, in the broader sense where adaptation is seen as an investment and continuing process comprised of a suite of measures and includes the possibility that any one or number of these can be introduced over a period of time, adaptive management may be worth considering, especially when focused on demand management.
3.4 Bottom-up approaches
3.4.1 Engineering Safety Margin In the design of dikes, it is common practice to apply an engineering safety margin ("waakhoogte", in Dutch) on top of the design flood level in order to compensate forphysical processes that have not been allowed for in the design water level, such as overtopping by waves, and for uncertainty in the prediction of design flood levels, such as accuracy in the flood estimation, accuracy of conveyance modelling, etc. (Figure 3.4) This is also known as conservative design. In the Netherlands this safety margin is typically a

38
minimum of 50 centimeter. The freeboard (the area of the dike between the design flood level and the top of the dike) uses an extra margin ("overhoogte" in Dutch) on top of that, to account for settlement and shrinkage during the design period of the dike. If for instance a dike is expected to settle 1 cm per year and it is designed for 50 year, the over-height would amount to an additional 50 cm on top of the safety margin.
Figure 3.4 Engineering Safety Margin for a dike
The present safety margins mainly account for statistical uncertainty and unrecognized ignorance. Scenario uncertainty is accounted for in the design flood levels itself, not in the safety margin on top of that. A safety margin based on observed variability does not seem to be a good way to cope with recognized ignorance such as unknown probability high impact events and possible surprises like the possibility of accelerated sea level rise from the Greenland ice sheet and West Antartica.
These considerations add to the need to map the unknowns. This also brings to the forefront the concern that experience may no longer be a valid base for decisions, especially when changes go beyond the natural variability, as we know it from past experience. Most practitioners recognise the fallacy of arbitrarily set safety margins based on past experience. The use of Engineering Safety Margins is now rather out-dated. Dike design in the Netherlands has for some time been based upon reliability analysis rather than safety margins (CUR/TAW 1990).
3.4.2 Anticipating design An innovative way to take uncertainty of the type "recognized ignorance" into account in the design of dikes is anticipating design. If we have the 'surprise free' KNMI or IPCC scenario's to choose the design flood level, but we also want to anticipate the possibility of a substantial higher sea level rise such as the upper boundary of sea level rise indicated in the Nederland Later study of 1.5 meter per century, this uncertainty can be included in the design by building a foundation for the dike strong enough to carry a dike for a design flood level corresponding to that upper boundary, but dimensioning the dike itself using the design flood
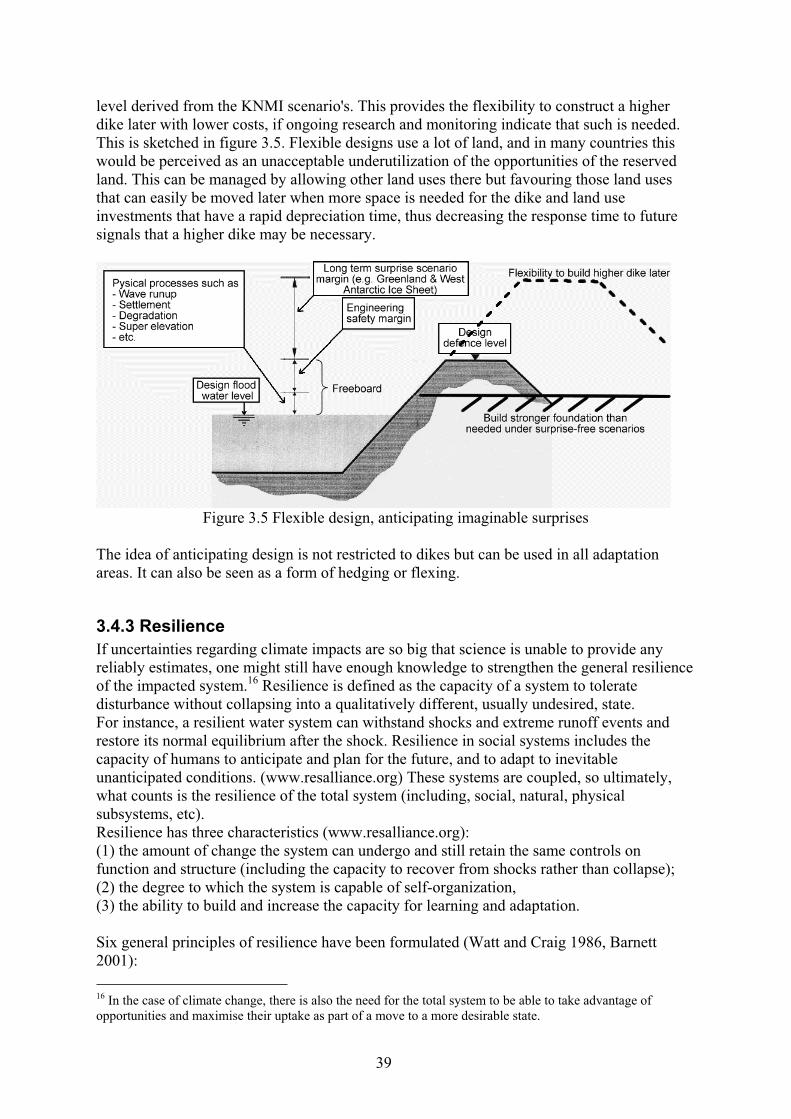
39
level derived from the KNMI scenario's. This provides the flexibility to construct a higher dike later with lower costs, if ongoing research and monitoring indicate that such is needed. This is sketched in figure 3.5. Flexible designs use a lot of land, and in many countries this would be perceived as an unacceptable underutilization of the opportunities of the reserved land. This can be managed by allowing other land uses there but favouring those land uses that can easily be moved later when more space is needed for the dike and land use investments that have a rapid depreciation time, thus decreasing the response time to future signals that a higher dike may be necessary.
Figure 3.5 Flexible design, anticipating imaginable surprises
The idea of anticipating design is not restricted to dikes but can be used in all adaptation areas. It can also be seen as a form of hedging or flexing.
3.4.3 Resilience If uncertainties regarding climate impacts are so big that science is unable to provide any reliably estimates, one might still have enough knowledge to strengthen the general resilience of the impacted system.16 Resilience is defined as the capacity of a system to tolerate disturbance without collapsing into a qualitatively different, usually undesired, state. For instance, a resilient water system can withstand shocks and extreme runoff events and restore its normal equilibrium after the shock. Resilience in social systems includes the capacity of humans to anticipate and plan for the future, and to adapt to inevitable unanticipated conditions. (www.resalliance.org) These systems are coupled, so ultimately, what counts is the resilience of the total system (including, social, natural, physical subsystems, etc). Resilience has three characteristics (www.resalliance.org): (1) the amount of change the system can undergo and still retain the same controls on function and structure (including the capacity to recover from shocks rather than collapse); (2) the degree to which the system is capable of self-organization, (3) the ability to build and increase the capacity for learning and adaptation.
Six general principles of resilience have been formulated (Watt and Craig 1986, Barnett 2001):
16 In the case of climate change, there is also the need for the total system to be able to take advantage of opportunities and maximise their uptake as part of a move to a more desirable state.

40
Homeostasis (multiple feedback loops stabilize the system); Omnivory (external shock mitigated by diversification of resources and means); High flux (a fast rate of movement of resources through the system ensures fast mobilisation of these resources to cope with perturbation); Flatness (hierarchical level relative to base should not be top-heavy, overly hierarchical systems are less flexible and hence less able to cope with surprise and adjust behaviour); Buffering (systems with a capacity in excess of its need are more resilient); Redundancy (overlapping functions, if one fails, others can take over).
These principles could perhaps be made operational in sets of resilience indicators by which we can measure how different adaptation policy options influence the overall resilience of the system. Further, such indicators could be used in for instance the State of Environment reports (Milieubalans), the Environmental Outlook, and the Sustainability Outlook, to monitor and explore overall trends in resilience of the Netherlands to changes in the climate.
For various sub-systems attempts have been made to develop resilience indicators. Examples can be found in Adger (2000), Carpenter et al. (2001) and Villa and McLeod (2002) and De Bruijn (2004b, 2004a). For the purpose of flood risk management, De Bruijn (2004a) proposed for instance indicators covering three aspects of resilience: amplitude, graduality and recovery: The amplitude covers the severity of flood impacts and can be quantified as the expected average damage and the expected average number of casualties per year. The graduality, defined as the increase of impacts with increasingly severe flood waves, shows the discontinuities in the discharge-damage relationship, which point at thresholds and the possible occurrence of disasters. The recovery rate is estimated by means of an analysis of the recovery capacity of the system, which is a fairly qualitative approach. With a hypothetical case study, De Bruijn (2004a) showed that with these indicators the resilience of different flood risk management systems can be assessed systematically.
In addition to the concept of resilience, there are also benefits from designs that “fail safely” – in other words provision for failure is integrated within the design.
3.4.4 Adaptive management Adaptive management is an iterative feedback and learning based strategy to cope with risk in decision making in a context of uncertainty. Developed by ecologists Holling (1978), Walters (1986) and others, the concept of adaptive management incorporates an explicitly experimental approach to learning as a way to reduce uncertainty. The main emphasis is on process and continuous learning (trial and error, small step->evaluate->adjust). It seeks to maximise flexibility, keep many options open and avoid lock-in. This strategy is especially useful in small scale systems. However, there are not many successful applications of adaptive management in the literature (for exceptions see, for example, the ecosystem restoration program of the Florida Everglades or the restoration of the Upper Mississippi and the Missouri River systems). Gregory et al. (2006) argue that this is due to the lack of evaluation frameworks for adaptive management. Despite these shortcomings, other scholars have recently argued for the use of adaptive management for the problem of climate change (Arvai et al. 2006).

41
The main criticism to using this strategy to adapt to climate change is that it is likely to fail in case of surprises and discontinuities in system response (if past experience from which you learned is not a key to the future).
Beck et al (2002) proposed a concept of adaptive community learning. It involves an iterative, cyclical process entailing the following elements, and largely in this sequence: (i) identifying stakeholder concerns for the future; (ii) developing mathematical models, as maps of the current science base (with all its uncertainties, knowns, partially knowns, and unknowns), to assist in exploring those concerns; (iii) formal, computational assessment of the stakeholder-generated, potential futures; (iv) communicating to stakeholders the plausibility or otherwise of their feared=hoped-for futures; (v) identifying the key scientific unknowns (critical model parameters) on which realisation of the potential future outcomes may crucially turn; and (vi) designing further experimental and field tests to reduce the uncertainty of the key unknowns, in turn to reduce the uncertainty of any forecast future outcomes.
3.4.5 Human development approaches There is increasing recognition that climate change is as much a development problem as it is an environmental one, but also that climate change will have an impact on development efforts (see Washington et al. 2006). For this reason, Burton and van Aalst (1999) examined how the World Bank can integrate climate change vulnerability and adaptation into its work. They investigated climate change from a development perspective so their starting point is to assess the success of present adaptation to existing climate variability. They argue that steps to improve present levels and types of adaptation to reduce present vulnerability are essential to tackle climate change in the future. Therefore, climate scenarios play no role in this framework. Instead, the focus is on exposure to existing climatic hazards and on the determinants of adaptive capacity including: the availability of financial resources (wealth); the availability of technology and a trained body of persons to utilise it effectively; access to information; and the existence of legal, social, and organisational arrangements. Examples of human development adaptation solutions include poverty reduction and risk-spreading through income diversification (see, e.g., Kelly and Adger 2000).
3.5 Mixed approaches and alternative approaches
3.5.1 The Adaptation Policy Framework
As the literature moved from impacts assessment to adaptation priorities, the need for an Adaptation Policy Framework (APF) emerged (Burton et al. 2002). The APF, developed by the United Nations Development Programme (UNDP), aims to provide guidance to developing countries for formulating national policy options for adaptation to climate change. It builds on the IPCC approach, but presupposes adaptation to short-term climate variability and extreme events will reduce vulnerability to longer-term climate change (UNDP, 2004). ‘‘The essential starting point is the present’’ (Burton et al. 2002, 154pp). The APF is composed of five basic components, where engaging stakeholders and enhancing adaptive capacity are crosscutting components:

42
1. defining project scope; 2. assessing current vulnerability; 3. characterising future climate risks; 4. developing an adaptation strategy; 5. continuing the adaptation process.
Within the third component, one of the usual outputs will be a set of future climate scenarios and an analysis of associated risk. Climate scenarios certainly play a role in the APF, but the uncertainty in predicting future climate has led the APF to anchor adaptation assessments firmly with an understanding of current climate risk. According to the APF, this helps to provide a roadmap from known territory into uncertain futures. The APF is perhaps the most mixed approach since it builds on the IPCC approach, it contains risk-based approaches (step 3) and human development approaches (steps 2, 4 and 5).
3.5.2 Robust decision making
Robustness analysis as applied by Dessai (2005) assesses adaptation strategies against climate change and other uncertainties, assuming the uncertainties cannot be quantified using probabilities. The IPCC defines robustness as “strength; degree to which a system is not given to influence” (p. 894). Lempert and Schlesinger (2000) propose that society should seek strategies that are robust against a wide range of plausible climate change futures. For these authors, robust strategies are “insensitive” in the sense that they yield satisfactory (but not optimal) performance to uncertainty about the future. There can be a trade-off between optimality and robustness. Willows and Connell (2003) define robustness analysis as follows:
“Robustness analysis may be used to help determine the robustness of the answers within an options appraisal to possible uncertainties as to the values of key sensitive variables and parameters (as identified from the sensitivity analysis). It identifies the extent to which the decision-maker might be exposed to potential costs and errors if some uncertain eventualities regarding these parameters should arise in future. Robustness analysis is sometimes used to investigate the impact on the decision of a ‘reasonable’ range of input values for the key parameters identified by the sensitivity analysis, or a range of values that is considered plausible” (p. 134-135).
In other words, robustness analysis systematically explores the uncertainty space (spanned up by the plausible ranges of parameters in the parameter space) to find out where in that space each option works or fails. A fully robust option would give satisfactory performance in the entire uncertainty space.
Through sensitivity analysis (see Dessai and Hulme 2007), Dessai (2005) identified regional climate change response and climate change impacts as the most important climate change uncertainties to which water resources in the East of England were sensitive to. Dessai (2005) assessed whether a water company adaptation strategy (with a planning horizon until 2030) would be successful (in securing public water supplies at the specified levels of service) under a wide uncertainty range for the variables identified. Figure 3.6 shows that in areas above 25 Ml/d (marked in red, brown and black) the water company’s plan would be insufficient to cope with the uncertainties associated with the impacts of climate change.

43
However, for most of the uncertainty space sampled, the Water Resources Plan would work.
25 20 15 10 5 0 -5 -10 -15 -20 -25 -30 -35 -40 -45 -50
-50
-25
0
25
50
Regional climate response uncertainty (%)
Hydrologicalmodelling
uncertainty (%)
-75--50 -50--25 -25-0 0-25 25-50 50-75 75-100
Figure 3.6 Additional water required (in intervals in Ml/d) in order to maintain levels of service by the 2030s in the East Suffolk and Essex Water Resource Zone under the water company’s demand projection as a function of regional climate response uncertainty (represented by summer precipitation change in the horizontal from a 25% increase to a 50% decrease) and climate impacts uncertainty (represented by hydrological modelling uncertainty in the vertical from -50% to 50%).
Under this approach models are often used to characterise systems, etc, but instead of using them to predict, they are used to assess the robustness of decisions to various uncertainties and surprises. Scientists at the RAND Corporation have been developing these methods under the umbrella of “robust decision making” (Bankes 1993, Bankes et al. 2002, Lempert et al. 2002, Lempert et al. 2003, Lempert et al. 2006, Groves and Lempert 2007). They go beyond the robustness analysis conducted by Dessai (2005) because once vulnerabilities are found for a particular candidate strategy, an interactive process is conducted with decision-makers in order to find other strategies until a robust strategy (least sensitive to uncertainties) is identified. Other methods such as information-gap decision theory (Ben-Haim 2006) are starting to be applied to climate impact related areas such as flood management (Hine and Hall 2006) and conservation management (Regan et al. 2005). An info-gap is the disparity between what is known and what needs to be known in order to make a well-founded decision. Info-gap decision theory is a non-probabilistic decision theory seeking to optimize robustness to failure, or opportunity of windfall. This differs from classical decision theory, which typically maximizes the expected utility.

44
4. Methods and tools to assess climate change uncertainties relevant for adaptation planning
4.1 Prediction approach
Various tools and techniques have been mentioned in the previous section in the context of the prediction (top-down) approach. Here we elaborate on how these tools and techniques have been used to tackle climate change uncertainties relevant for adaptation planning. In order to assess what adaptation is necessary now or in anticipation of expected changes in the future, the prediction approach requires knowledge of the future impacts of climate change and therefore knowledge of how the climate will change. Figures 4.1 shows the cascade of uncertainties involved in climate change prediction and impact assessment. Accumulation of uncertainty from each step going from emission scenarios, to carbon cycle response, to global climate response, to regional climate scenarios to produce a range of possible local impacts involves what one might call an “uncertainty explosion” (IPCC 2001a).
Figure 4.1 Cascade of uncertainties in climate change prediction. The dashed line encompasses the climate simulation segment of the cascade (from Giorgi 2005).
Given that the issues mentioned above are the major uncertainties in impact assessments, we next review the literature in each of these areas elaborating on the methods and tools used to deal with uncertainty.17
17 The authors are unaware of any studies that have tackled all these uncertainties consistently in the context of adaptation.

45
4.1.1 Greenhouse gas emissions
The uncertainty associated with future greenhouse gas (GHG) emissions has often been characterised using scenarios (e.g., IPCC 1992, Nakicenovic et al. 2000). Dessai and Hulme (2004) have argued that this has been the case and should continue to be the case because of the presence of what they call ‘human reflexive uncertainty’. Emissions of GHGs due to the burning of fossil fuel and deforestation depend on humans. Reflexive uncertainty only applies to human systems because natural systems are not reflexive to information about the future (predictions). The fact that humans are part of the system being researched in the case of the climate change problem therefore makes the uncertainty irreducible in the context of prediction; it makes all probabilities ‘provisional’ because the outcome of the assessment will influence human choice and therewith the main driver of what was assessed. According to Slaughter (1994) predictions (with explicit or implicit probability evaluations) are of limited use in the context of social systems where qualitative phenomena relating to human choice are dominant.
Nevertheless, uncertainty in certain key drivers of greenhouse gas emissions have been explored in probabilistic terms, namely population growth (Lutz et al. 1997, 2001) and technological change (Gritsevskyi and Nakicenovic 2000). However, rarely have these been combined to produce probabilistic greenhouse gas emissions, mainly because the probability distribution functions (pdfs) for a number of key drivers (e.g., per capita income, hydrocarbon resource use and land-use change) are unavailable/unknown and the interconnection between drivers is complex. One exception is a study that developed a consistent set of emissions scenarios with known probabilities based on a computable general equilibrium model of the world economy (Webster et al. 2002). They performed a sensitivity analysis to identify the most important parameters, whose uncertain pdfs were constructed through expert elicitation (by five in-house economists) and drawing from the literature. The uncertainty of the eight independent sets of input parameters (e.g., labour productivity growth, autonomous energy efficiency improvement rate, and several sources of GHGs) was propagated into the model. Through a Monte Carlo simulation, pdfs of GHG emissions for each time period were produced. Figure 4.2 shows probabilistic estimates of carbon dioxide and methane emissions using this method. Webster et al. (2002) note that in 2100 the CO2 emissions from the SRES scenarios (5-30 GtC)18 spread much of the 95% range (7-39 GtC), but they argue that SRES has a lower bias among its scenarios, because four of the six SRES scenarios are below the median emissions (20 GtC). Since the SRES exercise uses scenarios (no associated probability) and the Webster study uses probabilities their comparison is unfair. If well constructed, we expect a set of scenarios to have a reasonable coverage of the possibility space.
18 This range is actually wider if all 40 scenarios in the six scenario groups is considered (3-37 GtC).
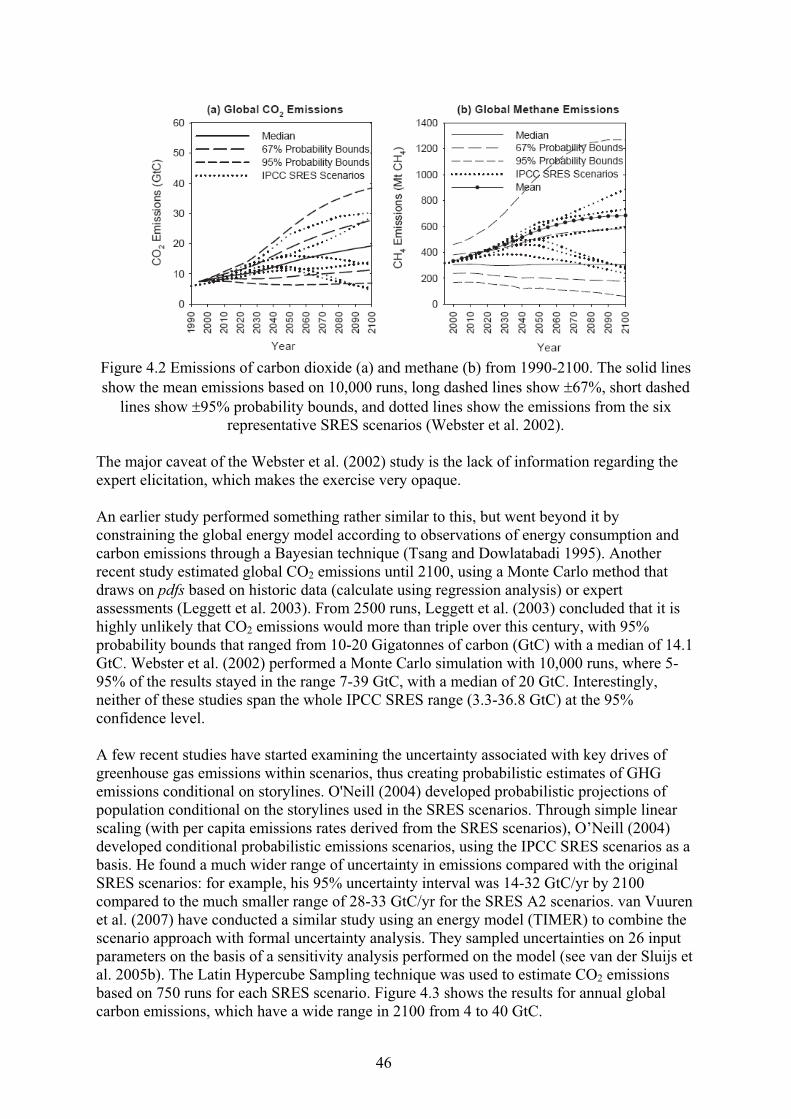
46
Figure 4.2 Emissions of carbon dioxide (a) and methane (b) from 1990-2100. The solid lines show the mean emissions based on 10,000 runs, long dashed lines show 67%, short dashed
lines show 95% probability bounds, and dotted lines show the emissions from the six representative SRES scenarios (Webster et al. 2002).
The major caveat of the Webster et al. (2002) study is the lack of information regarding the expert elicitation, which makes the exercise very opaque.
An earlier study performed something rather similar to this, but went beyond it by constraining the global energy model according to observations of energy consumption and carbon emissions through a Bayesian technique (Tsang and Dowlatabadi 1995). Another recent study estimated global CO2 emissions until 2100, using a Monte Carlo method that draws on pdfs based on historic data (calculate using regression analysis) or expert assessments (Leggett et al. 2003). From 2500 runs, Leggett et al. (2003) concluded that it is highly unlikely that CO2 emissions would more than triple over this century, with 95% probability bounds that ranged from 10-20 Gigatonnes of carbon (GtC) with a median of 14.1 GtC. Webster et al. (2002) performed a Monte Carlo simulation with 10,000 runs, where 5-95% of the results stayed in the range 7-39 GtC, with a median of 20 GtC. Interestingly, neither of these studies span the whole IPCC SRES range (3.3-36.8 GtC) at the 95% confidence level.
A few recent studies have started examining the uncertainty associated with key drives of greenhouse gas emissions within scenarios, thus creating probabilistic estimates of GHG emissions conditional on storylines. O'Neill (2004) developed probabilistic projections of population conditional on the storylines used in the SRES scenarios. Through simple linear scaling (with per capita emissions rates derived from the SRES scenarios), O’Neill (2004) developed conditional probabilistic emissions scenarios, using the IPCC SRES scenarios as a basis. He found a much wider range of uncertainty in emissions compared with the original SRES scenarios: for example, his 95% uncertainty interval was 14-32 GtC/yr by 2100 compared to the much smaller range of 28-33 GtC/yr for the SRES A2 scenarios. van Vuuren et al. (2007) have conducted a similar study using an energy model (TIMER) to combine the scenario approach with formal uncertainty analysis. They sampled uncertainties on 26 input parameters on the basis of a sensitivity analysis performed on the model (see van der Sluijs et al. 2005b). The Latin Hypercube Sampling technique was used to estimate CO2 emissions based on 750 runs for each SRES scenario. Figure 4.3 shows the results for annual global carbon emissions, which have a wide range in 2100 from 4 to 40 GtC.

47
Figure 4.3 Carbon dioxide emissions from 1970-2100 using the SRES scenario storylines and uncertainty quantification. In red is the A1 scenario, in pink the A2, in green the B1 and in
blue the B2 (van Vuuren et al. 2007).
van Vuuren et al. (2007) conclude that conditional probabilistic scenario analysis can be used as a way to introduce statistical methods of uncertainty analysis, while recognising deep uncertainties. It bridges the gap between scenario approaches and probabilistic approaches. Van Vuuren et al. (2007) note that the probabilistic approach operates from the positivist engineering/control paradigm, whereas the scenario approach positions itself more in a constructivist social science tradition.
Another method that has tried to bridge the scenario probability gap is the imprecise probability approach. Fuzzy set theory deals with the inherent vagueness in linguistic statements. Hall et al. (2007) applied fuzzy set theory to deal with SRES emission scenarios. They also proposed a non-probabilistic approach to dealing with the problem of aggregating different emissions scenarios. Imprecise probability theory can be thought of as a generalisation of probability and fuzzy sets and has been used to deal with climate model uncertainties whilst avoiding the strong assumptions of recent probabilistic interpretations of ensemble experiments (Ha Duong 2003, Kriegler and Held 2005, Hall et al. 2007).
Van der Sluijs et al. (2002, 2005b) applied the NUSAP method (Numeral Unit Spread Assessment Pedigree, an analytical and notational system to qualify quantitative information proposed by Funtowicz and Ravetz, 1990) to the TIMER B1 emission scenario. The NUSAP system for multidimensional uncertainty assessment (Funtowicz and Ravetz 1990, van der Sluijs et al. 2005a) aims to provide an analysis and diagnosis of uncertainty in science for policy. The basic idea is to qualify quantities by using the five qualifiers of the NUSAP acronym: numeral, unit, spread, assessment, and pedigree. NUSAP complements quantitative analysis (numeral, unit, spread) with expert judgement of reliability (assessment) and systematic multi-criteria evaluation of the different phases of production of a given knowledge base (pedigree). Pedigree criteria can be: proxy representation, empirical basis, methodological rigor, theoretical understanding, and degree of validation. In the application to the TIMER model and its B1 scenario, a global sensitivty analysis was combined with a

48
systematic pedigree analysis of the 40 (out of 300) most sensitive model parameters. The pedigree analysis was done interactively in a workshop involving 18 experts. This has been the first test of NUSAP on a model of such complexity, and the authors show that the method can be usefully applied to such models. A discussion of methods to ensure the pedigree of complex decision processes is provided by Davis and Hall (2003).
In terms of adaptation planning and to our knowledge, no studies have moved beyond using scenarios to quantify uncertainties in greenhouse gas emissions. However, it can be argued that emission uncertainty only matters for adaptation decisions where a timescale beyond mid century is relevant.
4.1.2 Global climate change
Most of the work on quantifying uncertainties has been performed at the global climate system level, particularly looking at key uncertain parameters such as climate sensitivity, heat uptake by the oceans or aerosol forcing. This has been done using a variety of methods such as expert elicitation and various uncertainty analysis techniques using the entire hierarchy of climate models from simple to intermediate complexity to coupled atmosphere/ocean general circulation models (AOGCMs).
One of the earliest studies that explored the uncertainty of key climate variables was that of Morgan and Keith (1995), who interviewed a number of US climate experts to elicit subjective PDFs of climate sensitivity. Their results showed a diversity of expert opinion, which led them to conclude that the overall uncertainty of climate change is not likely to be reduced dramatically in the next few decades (a prediction so far borne out).19 Using a number of different methods researchers have run their previously deterministic climate models in a probabilistic manner (Zapert et al. 1998, Visser et al. 2000, Webster and Sokolov 2000, Dessai and Hulme 2001, Wigley and Raper 2001). It is important to note that within this approach the output likelihood is dependent on the subjective prior PDFs attached to uncertain model parameters (these are mostly based on expert judgement). Likelihoods also depend on the ability of the Energy Balance Models to emulate the global mean temperature series of GCMs.
Another strand of research that complements earlier efforts and attempts to reduce uncertainty is the method of constraining certain climate parameters, in particular climate sensitivity, by using recent observed changes in the climate system (Tol and de Vos 1998, Allen et al. 2000, Forest et al. 2000, Andronova and Schlesinger 2001, Forest et al. 2001, Forest et al. 2002, Gregory et al. 2002, Knutti et al. 2002, Stott and Kettleborough 2002, Jones et al. 2003a, Knutti et al. 2003, Frame et al. 2005, Forest et al. 2006). This is essentially a Bayesian approach that will prove most useful as more observed data are gathered in the future. Paleoclimate data have also been used to constrain climate sensitivity (Annan et al. 2005, Hegerl et al. 2006, Schneider von Deimling et al. 2006). Uncertainties in climate change detection and attribution have also been articulated and quantified using a formal probabilistic protocol (Risbey et al. 2000, Risbey and Kandlikar 2002).
Uncertainty in General Circulation Models (GCMs) has been mainly explored through means of intercomparison and validation statistics between model results and observed climatology
19 This expert elicitation will be repeated soon.

49
(Lambert and Boer 2001). There are also a few examples of evaluating GCM output with impact models (Williams et al. 1998). However, with computational power on the increase there are a few studies that have started to run large ensembles of GCMs in order to quantify uncertainty in the climate response (Murphy et al. 2004, Stainforth et al. 2005). Murphy et al.(2004) performed a local sensitivity analysis for a selection of parameters of the HadAM3 climate model (an atmospheric general circulation model coupled to a ‘slab’ ocean) to generate a PDF for climate sensitivity. Parameter selection and the range over which parameters were varied was based on expert elicitation.20 In constructing the climate sensitivity PDF, a “climate prediction index” that weights ensemble members according to degree of correspondence with observations was applied. Their 95% confidence range for climate sensitivity was 2.4-5.4ºC. The Stainforth et al. (2005) study uses the same model but runs many more simulations (over two thousand) and does not attempt to constrain the results.21 They found climate sensitivities that ranged from less than 2ºC to more than 11ºC.
Figure 4.4 shows PDFs of climate sensitivity as constrained by past historical transient evolution of surface temperature, upper air temperature, ocean temperature, estimates of the radiative forcing, satellite date, proxy data over the last millennium or a subset thereof (panel a and b). There is agreement in the lower bound that climate sensitivity is very unlikely below 1.5ºC; there is less agreement in the upper bound because of a nonlinear relationship between climate sensitivity and the feedbacks such as enhanced release of terrestrial carbon due to rising soil temperatures, and is further hampered by limited length of the observational record and uncertainties in the observations, which are particularly large for ocean heat uptake and for the magnitude of the aerosol radiative forcing (Meehl et al. 2007).
20 To the knowledge of the authors no formal protocol of elicitation (as in Morgan and Keith 1995, Risbey et al. 2000) was followed to, for example, ‘de-bias’ experts, etc. 21 But that is on-going work.
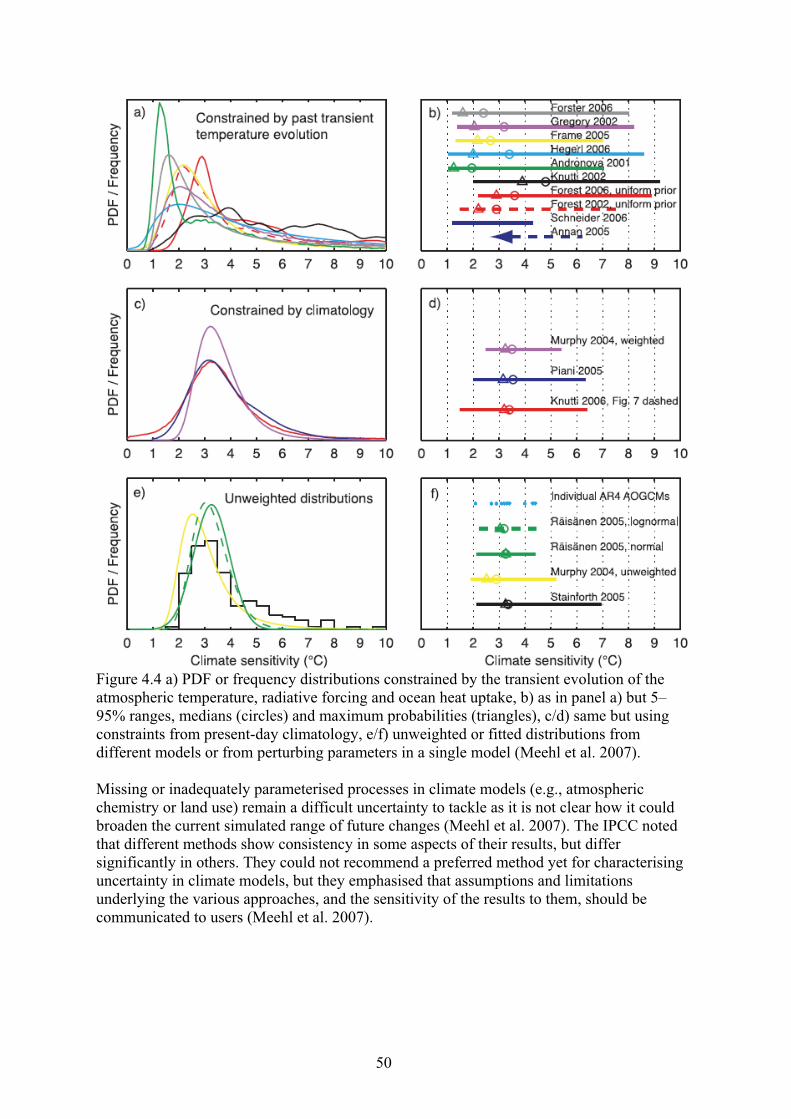
50
Figure 4.4 a) PDF or frequency distributions constrained by the transient evolution of the atmospheric temperature, radiative forcing and ocean heat uptake, b) as in panel a) but 5–95% ranges, medians (circles) and maximum probabilities (triangles), c/d) same but using constraints from present-day climatology, e/f) unweighted or fitted distributions from different models or from perturbing parameters in a single model (Meehl et al. 2007).
Missing or inadequately parameterised processes in climate models (e.g., atmospheric chemistry or land use) remain a difficult uncertainty to tackle as it is not clear how it could broaden the current simulated range of future changes (Meehl et al. 2007). The IPCC noted that different methods show consistency in some aspects of their results, but differ significantly in others. They could not recommend a preferred method yet for characterising uncertainty in climate models, but they emphasised that assumptions and limitations underlying the various approaches, and the sensitivity of the results to them, should be communicated to users (Meehl et al. 2007).

51
4.1.3 Global climate change impacts
Quantification of uncertainty has been carried out for global climate change impacts such as sea level rise (Patwardhan and Small 1992, Titus and Narayanan 1996), the collapse of the West Antarctic Ice Sheet (Vaughan and Spouge 2002), the global carbon cycle (Craig and Holmen 1995, Shackley et al. 1998, Jones et al. 2003b), global economic impact (Nordhaus 1994), and the overturning of the thermohaline circulation (Mastrandrea and Schneider 2001, Vellinga and Wood 2002, Zickfeld et al. 2007)22. These approaches have relied heavily on expert judgement techniques because of the difficulty in quantifying low probability/high impact events. Figure 4.5 shows the result of an expert elicitation exercise that assessed the contribution of West Antarctic Ice Sheet to global sea level rise based on the Delphic technique. It shows that there is disagreement between experts, which leads to large uncertainties in the estimation of global sea level rise from West Antarctic Ice Sheet.
Figure 4.5 The combined predictions (based on a Delphic panel of 11 experts) of the likely contribution to sea level rise from the West Antarctic Ice Sheet. The upper and lower bounds bracket the 90% confidence estimate (Vaughan and Spouge 2002).
There are numerous other studies that deal with global impacts such as the large-scale eradication of coral reef systems, biome migration or changes in ENSO, but few have represented uncertainty explicitly through probabilities. For example, Scholze et al. (2006) quantified the risks of changes in key ecosystem processes on a global scale, over the 21st century, by grouping 16 GCM runs into three sets of model runs. Another approach is to tabulate impacts associated with progressively higher global mean/ regional temperatures as in Warren et al. (2006). Often, analysis of global impacts of climate change are conducted using integrated assessment models using damage functions for various impacted sectors (Hitz and Smith 2004). Few analysis have included uncertain damage functions (for an exception see Roughgarden and Schneider 1999). Due to the high level of aggregation of
22 Mastrandrea and Schneider (2001) and Vellinga and Wood (2002) do not estimate likelihood, but explore a ‘forced’ temporary collapse.

52
climate impacts (spatially and temporally) in integrated assessment models (in the order of hundreds of kilometres) these analyses are rarely useful to local or regional decision-makers needing to take decisions on adaptation to climate change.
The IPCC has recently assessed “key” vulnerabilities to climate change on the basis of the following criteria: magnitude of impacts (large-scale), timing of impact (soon) including rate of change (fast), persistence and irreversibility, likelihood and confidence (high), potential for adaptation, distribution of impacts across regions and populations groups, and importance of the vulnerable system or system property (Schneider et al. 2007). They use “potential for adaptation” as one of the criteria for selecting “key” vulnerabilities. The authors note that the lower the availability and feasibility of effective adaptations, the more likely such impacts would be characterised as “key vulnerabilities”. In terms of key vulnerabilities, Schneider et al. (2007) mention the uncertain adaptation potential for Greenland and West Antarctic Ice Sheets. In the case of climate change impacts on water supply, extreme adaptations such as out migration (medium confidence) are mentioned.23 For coastal resources, a global mean temperature increase of 2-4ºC above 1990 means adaptation becomes more expensive and less satisfactory and above 4ºC many communities become too expensive to protect, with out migration necessary (medium to high confidence). There is limited adaptation possible for ocean systems (e.g., coral reefs) even for low rates of global warming. In terms of biodiversity there could be a loss of up to a quarter of species and almost half of ecosystems cannot adapt (medium confidence) for global warming under 2ºC. Between 2-4ºC global warming, there could be a loss of one-third of species and about two thirds of ecosystems cannot adapt (medium confidence). Above 4ºC widespread extinctions are foreseen.Adaptations in rivers and closed lakes may be expensive and have ecological consequences.
4.1.3 Regional climate change (including downscaling methods) The compounding of uncertainty at the global climate level is already considerable (see section 4.1.2 and Figures 4.1), which is why quantification of uncertainty at the regional climate change level has been less explored, but even this literature is growing quickly. Validation statistics (e.g. mean, standard deviation, pattern correlation, etc.) have traditionally been used to explore regional uncertainties in future climate (Kittel et al. 1998, Giorgi et al. 2001). This has led to a summary measure, which calculates average, uncertainty range, and reliability of regional climate changes from GCM simulations, proposed by Giorgi and Mearns (2002), named the Reliability Ensemble Averaging method. Some researchers, however, have looked at probabilistic methods for regional climate. New and Hulme (2000) used a simple climate model to sample uncertainty in the global climate and then used the ‘pattern-scaling’ technique to propagate this uncertainty to the regional level using 14 runs of GCMs as a ‘super-ensemble’. Räisänen and Palmer (2001) ignored the upstream uncertainties and considered 17 GCMs a probabilistic multimodel ensemble projection of future regional climate. Giorgi and Mearns (2003) extended their Reliability Ensemble Averaging method to calculate the probability of regional climate change exceeding given thresholds using nine GCM simulations under SRES A2 and B2. This method goes beyond previous studies by using the reliability factor to estimate the probability of future regional climate change. Tebaldi et al. (2004, 2005) took this work one step further by developing a Bayesian statistical model that combines multimodel ensembles of AOGCMs and observations to estimate probabilities of regional climate change using the same criteria as Giorgi and Mearns (2002), namely bias and convergence. Other Bayesian approaches using multimodel
23 Costly adaptations such as irrigation and desalinisation are also mentioned.
53
ensembles have been developed using different assumptions about the independence of AOGCMS (Greene et al. 2006, Furrer et al. 2007). Resampling techniques have also been applied to multimodel ensembles (Dettinger 2006, Räisänen and Ruokolainen 2006). Another method used to explore uncertainties at the regional scale is the use of large perturbed physics ensembles (Barnett et al. 2004, Clark et al. 2006, Harris et al. 2006). This quantifies modelling uncertainties by varying poorly constrained parameters within the formulation of a single model (in this case the Hadley Centre model). For more information on probabilistic approaches to regional climate change see a special issue of Philosophical Transactions of the Royal Society (Collins 2007) and the IPCC (Christensen et al. 2007, Meehl et al. 2007).
Given the coarse resolution of most AOGCMs,24 downscaling is often used for impact and adaptation assessments. The two main approaches are dynamical and statistical downscaling. Dynamical downscaling uses high resolution climate models, often called regional climate models (RCMs), with the boundary conditions of observed or lower resolution AOGCM data. Dynamical downscaling has the potential for capturing mesoscale nonlinear effects and providing coherent information among multiple climate variables. These models are formulated using physical principles and they can credibly reproduce a broad range of climates around the world, which increases confidence in their ability to downscale realistically future climates. The main drawbacks of dynamical models are their computational cost and that in future climates the parametrization schemes they use to represent sub-grid scale processes may be operating outside the range for which they were designed. Statistical downscaling methods start by establishing a relationship between large-scale atmospheric variables (predictors) and local/regional climate variables (predictands) using observed records.25 This relationship is then applied to AOGCM results to estimate future changes at the local/regional scale. Statistical downscaling methods have the advantage of being computationally inexpensive, able to access finer scales than dynamical methods and applicable to parameters that cannot be directly obtained from the RCM outputs. They require observational data at the desired scale for a long enough period to allow the method to be well trained and validated. The main drawbacks of statistical downscaling methods are that they assume that the derived cross-scale relationships remain stable when the climate is perturbed, they cannot effectively accommodate regional feedbacks and, in some methods, can lack coherency among multiple climate variables. There are numerous RCMs available (see e.g., http://prudence.dmi.dk/) and various statistical downscaling algorithms. Like the IPCC TAR, AR4 concluded that each downscaling approach has distinctive strengths and weaknesses, and that the methods are comparable (Christensen et al. 2007). For a review of new developments in the downscaling field specifically for hydrological impacts see Fowler et al. (2007). These authors propose a method that links probabilistic climate change scenarios to a weather generator downscaling method. Goodess et al. (2007) provides a useful discussion of local decision making with probabilistic climate information.
Given the increasing emphasis on probabilistic climate scenarios, it is important to remember that such information is highly conditional on a variety of factors including: the model(s) being used (in particular its completeness), the observed data used (say for constraining results), the method used to compute the probability distributions and the emissions scenarios (Dessai and Hulme 2004, Hall 2007). Blind application of probabilistic climate scenarios could lead to bad adaptation decisions (Hall 2007).
24 In the order of hundreds of kilometres. 25 Statistical downscaling methods can be further classified into three groups: regression models, weather typing schemes and weather generators.

54
4.1.4 Regional/local impacts There are a plethora of impact studies that have used one or a few more climate change scenarios to represent uncertainties from climate projections (IPCC 2001a). This is clearly insufficient (see Katz 2002, for a review of uncertainty techniques in this area), but few studies have ventured into the probabilistic realm for the same reasons as given earlier, in particular the compounding and management of uncertainty. Similarly, Schimmelpfennig (1996) noted that uncertainty has been poorly represented in the economic models of climate change impacts, suggesting that a full probabilistic analysis be conducted. Because quantification of uncertainty in climate assessments is problematic, Risbey (1998) performed a qualitative sensitivity analysis that showed that water-planning decisions were sensitive to uncertainty in the range of GCMs simulated for the Sacramento basin in California. Though only a few GCMs were used and a simple scenario matrix approach taken for adaptation decisions, this study is nonetheless ground-breaking because it links future climate with planning decisions of today under a range of plausible scenarios. Most of the other local impact studies reviewed lack this important component – the sensitivity of adaptation decisions to upstream uncertainties – even though uncertainty is sometimes quantified in terms of probability.
However, in most studies, uncertainty is not comprehensively covered, especially with respect to climate change scenarios. For example, Woodbury et al. (1998) used four different GCMs to derive what they call a “probabilistic climate change scenario”, Venkatesh and Hobbs (1999) used four climate scenarios, while Scherm (2000) used a fuzzy scenario. A more comprehensive approach is provided by Jones (2000), who has a similar approach to New and Hulme (2000), but extended this to numerous impact models using critical impact thresholds. In Jones and Page (2001) an uncertainty analysis was carried out to assess the contribution of global warming vis-à-vis other components, as well as a Bayesian analysis to test the sensitivity of the results to initial assumptions. For the water resources of the Macquarie river catchment, 25% of the uncertainty originates from global warming whereas precipitation changes contribute 64%. The Bayesian analysis showed that the risk of threshold exceedance is rather insensitive to changes in the input assumptions for rainfall or global warming.
Another study combined the results of New and Hulme (2000; i.e., 25,000 climate scenarios randomly generated by a Monte Carlo simulation using several GCMs, SRES-98 emission scenarios and climate sensitivities) with a hydrological model to quantify uncertainties of climate change impact on the flood regime of five small catchments in Great Britain (Prudhomme et al. 2003). The analysis showed a large variation of results (varying by a factor of 10), but most scenarios showed an increase in both the magnitude and frequency of flood events, generally not greater than natural variability (which in this study constituted 95%-confidence intervals of historical data). The largest uncertainty was attributed to the GCM used rather than emissions scenarios or climate sensitivity, though the former starts playing a larger role by the 2080s. Uncertainties in the hydrological model itself or downscaling were not explored so it is not possible to make definitive recommendations on where further research should be targeted based on this study.
More recently, Wilby and Harris (2006) estimated future low-flows in the River Thames by combining information from four GCMs, two greenhouse gas emission scenarios, two statistical downscaling techniques, two hydrological model structures, and two sets of hydrological model parameters (see Wilby 2005 for an exploration of the last uncertainty). The GCMs and the hydrological model structures and parameters were weighted by

55
performance whereas the emission scenarios and downscaling methods were unweighted. The framework was implemented using the Monte Carlo approach. The results were most sensitive to uncertainty in the GCMs and the downscaling.
Dessai and Hulme (2007) assessed the robustness of a water company’s Water Resource Plan26 in the East of England against numerous climate change uncertainties in a probabilistic framework. A local sensitivity analysis (a `one-at-a-time' experiment) was performed on the various elements of the modelling framework (e.g., emissions of greenhouse gases, climate sensitivity and global climate models) in order to determine whether or not a decision to adapt to climate change is sensitive to uncertainty in those elements. Water resources are found to be sensitive to uncertainties in regional climate response (from GCMs and dynamical downscaling), in climate sensitivity and in climate impacts.
Some studies have started appraising hypothetical adaptation strategies within a modelling framework (Whitehead et al. 2006), while others have focused on combining a number of increasing complex models in the cascade of a climate change impact assessment (Wilby et al. 2006). Overall, there seems to be some evidence (Dessai 2005, Wilby and Harris 2006, Dessai and Hulme 2007) to show that the largest climate change uncertainties from an impact/adaptation perspective come from the AOGCMs, followed by the downscaling method.
4.2 Wild cards and surprises
"Much of the work to date has been based, implicitly or explicitly, on an evolutionary paradigm - the gradual, incremental unfolding of the world system in a manner that can be described by surprise-free models, with parameters derived from a combination of time series and crosssectional analysis of the existing system. ... The focus on surprise-free models and projections is not the result of ignorance or reductionism so much as of the lack of practically usable methodologies to deal with discontinuities and random events. The multiplicity of conceivable surprises is so large and heterogeneous that the analyst despairs of deciding where to begin, and instead proceeds in the hope that in the longer sweep of history surprises and discontinuities will average out, leaving smoother long-term trends that can be identified in retrospect and can provide a basis for reasonable approximations in the future" (Brooks 1986).
Surprise can play a role in every step of the causal chain and can come as unforeseen events or unforeseen impacts. Examples from the past of unforeseen events are the 2003 heat wave in Europe, tropical cyclone Andrew in 1992, which caused a then unprecedented damage (US$ 15.5 billion) (PCS 1996). More recently this damage was set in the shade by hurricane Katrina in 2005 (damage $81.5 billion). The natural system also has surprises such as the volcanic eruption of Mt. Pinatubo in June 1991, which is believed to be responsible for the observed discontinuity in the trends in atmospheric concentrations of CO2, CO and CH4 and in temperature (McCormick et al. 1995). Volcanic eruptions or abrupt changes in ocean conditions could also “dent” decadal forecasts such as Smith et al. (2007).
26 Their adaptation strategy to cope with climate change and various other risks and uncertainties over the next 25 years.

56
An example of unforeseen (local) impacts is a collapse of a dike in the Netherlands (August, 2003) in a period of extreme drought, leading to the flooding of a village. The dike was made of local soil and it turned out that peat in the dike had dried out by which it had lost so much weight that the dike could no longer withstand the pressure of the water. It was then realized that the Netherlands has thousands of kilometres of dike made of local soil that contains peat. A large scale monitoring system has now been set up to ensure early detection of peat-drying in dikes. Never in history had this type of dike been exposed to such extreme drought and nobody had thought of this scenario. Another example of analysis of flooding under extreme conditions is provided by Dawson et al. (2005). They quantified the likely flood impacts in the Thames estuary for a number of plausible, but unlikely, sea-level rise scenarios.27
Because models anticipate climate change well beyond the natural variability of the climate in the past millennia, the climate may move outside of the part of the so called “parameter hyper space” on which our knowledge of the dynamics of the present climate system is based. This implies that more unanticipated impacts and surprises need to be anticipated.
A further issue is that non-linear stochastic systems such as the earths climate system might have contra-intuitive future states which are missed if the system representation is inadequate. Such an inadequacy can be the neglect of feedbacks in the climate models. Another problem that might make predictive climate models inadequate is that in real-world stochastic complex systems, the variable probability values of many climate parameters are constantly in flux. Further, the natural stochasticity in nature constantly alters the relationships between system components, and new external variables are added regularly, which change the natural conditions for the overall system. For instance, the introduction of human-made substances, such as CFCs, into the atmosphere has dramatically changed stratospheric chemistry. As another example, the emission of a certain component can change the atmospheric chemistry pathways of a range of other components. These categories of "dynamic system dynamics" are not represented or are only poorly represented in current models. The simplifications made to model complex systems despite our limited understanding might well rule out certain characteristics of system dynamics such as the existence and nature of attractors in the system, which might be crucial in the evaluation of future behaviour of the system (Van der Sluijs 1997).
Given the absence of adequate methodology to model surprise, a systematic search for examples of non-linearities from the past might be the prelude to a search for possible future surprises (Brooks, 1986). Other strategies that can help us to understand surprise include focusing on the underlying principles of surprise, which is what happens in surprise theory (Holling 1986) and systematic ’thinking the unthinkable’ by imagining unlikely future events followed by the construction of plausible scenarios by which they might be realized (Kates and Clark 1996).
When addressing the question how soon (big) surprises might occur, one indicator could be the acceleration of record-breaking. As discussed in box 1.1 Hansen (2007) suggests to take the observed pattern of nonlinearity (acceleration) in ice sheet disintegration as an early warning signal of rapid sea level rise. The observed record-breaking pattern in Central England Temperature (Figure 4.6) could also be an early indicator that more surprises should be anticipated.
27 See also the UK Environment Agency’s Thames Estuary 2100 project: http://www.environment-agency.gov.uk/te2100/ (Lavery and Donovan 2005).

57
10.60
10.80
11.00
11.20
11.40
11.60
11.80
1 2 3 4 5 6 7 8 9 10 11 12 13 14 15 16 17 18 19 20
Rank
Mea
n C
ET (o
C)
Apr
il 20
07
Oct
199
5
May
200
7
June
200
7
Mar
ch 2
007
Feb
2007
Jan
199 7
Sep
t 199
5
Apr
il 19
90
Dec
200
6
Apr
il 19
48
Feb
1998
May
199
0
June
199
8
May
199
8
Mar
194
8
Mar
199
8
July
182
2
Nov
199
5Last updated: 3rd August 2007Source: Met Office - Hadley Centre for Climate Change
1659 - 1989
1990 - 2006
2007
July
200
7
Figure 4.6 Mean 12 month Central England Temperature (CET in ºC) ranks (top 20 warmest 12 month periods ending with month shown 1659-2007).
In the field of future studies, a promising contribution has been made by a German Science Fiction author couple with their book "Wild Cards, Wenn das Unwahrscheinliche eintritt" (Wild Cards, if the unlikely occurs) (Steinmuller and Steinmuller 2004). This book is a catalogue of surprise scenarios or "wild cards" applying to all fields of life, with a two page description of each wild cards, a discussion of it's plausibility and an exploration of its possible impact on society would it occur.
We recommend to explore the possibilities of developing a similar catalogue of wild cards of relevance for climate adaptation policy making. Wild cards could include events that are excluded from the main stream scenario studies such as the IPCC and KNMI scenario's and could include for instance:
Shut down of the ocean circulation; Collapse of the West Antartic Ice Sheet: Accelerated melting of the Greenland ice sheet; Massive plagues and diseases in agriculture; Terrorist attack on the coastal defence system during unprecedented storm tide; Dengue epidemic in the Netherlands; Rotterdam Harbor frozen during cold wave; Chemical accident upstream the Rhine during period of extreme drought and water scarcity pollutes the river with a highly toxic pollutant; Large-scale failure of essential infrastructure such as water/energy supplies and transportation networks (as witnessed by the summer 2007 flash-floods in the UK) Etc.
Such wild cards can then be used in resilience analysis to explore how different sectors of the Netherlands economy might be impacted in case that surprise scenario would occur, and whether there are options to decrease vulnerability or increase resilience to limit the harm that might follow from each wild card. The thought experiment is: suppose the wildcard occurs in the future, would we wish then that our decision now was taken differently, such that we

58
could respond then faster, more adequate, and at lower costs? We could think here of all kind of details in the decision, ranging from a more flexible wording in a permit for the construction of a dike, to a faster depreciation time of investments (compare to the high fluxprinciple of resilience) to increase the policy response time to a surprise.

59
5. Synthesis and Case study
5.1 Mapping methods, decision frameworks and uncertainty levels to each other
In the previous sections we reviewed existing frameworks for decision making under uncertainty (section 3) and existing approaches and methods for the assessment of uncertainty in the knowledge base (section 4). In section 4 we found that the current practice of uncertainty assessment in climate risk assessment uses a mixture of various uncertainty methods, tools and approaches. In various other publications these uncertainty tools have been described separately, such as in the MNP Tool Catalogue for Uncertainty Assessment (van der Sluijs et al. 2004) and in review papers of uncertainty tools such as Katz (2002), Refsgaard et al. (2007a) and the web based catalogue of uncertainty tools at www.floodrisknet.org.uk/methods. Despite the mixed use of uncertainty methods in the climate change literature we have attempted to classify certain methods in order to draw some insights from this work. From the review in section 4, we identified the following tools as being of particular relevance for supporting climate adaptation policy making (in random order):
Scenario analysis ("surprise-free") Expert elicitation Sensitivity analysis Monte Carlo Probabilistic multi model ensemble Bayesian methods NUSAP / Pedigree analysis Fuzzy sets / imprecise probabilities Stakeholder involvement Quality Assurance / Quality Checklists Extended peer review (review by stakeholders) Wild cards / surprise scenarios
Both the frameworks for decision making under uncertainty and the methods for uncertainty assessment differ in the extent to which they can deal with each of the three levels of uncertainty (section 1, box 2): statistical uncertainty, scenario uncertainty and recognized ignorance & surprises. In table 5.1 we summarized in an indicative way how well each of the Frameworks for decision making under uncertainty and each of the uncertainty assessment methods deals with each of the three uncertainty levels. This table can assist in the selection of an appropriate decision making framework and appropriate methods for uncertainty analysis for a given climate adaptation decision making problem. An essential step will then be a well argued judgment on the policy-relevance of each of the three levels of uncertainty - along with a judgement of their relative importance - to the particular decision making problem at hand. Context matters so place-based handling of uncertainty will be necessary according to the characteristics of different localities. Different approaches will be required in Rotterdam, Scheveningen and Texel, for example.

60
Statistical uncertainty
Scenariouncertainty
Recognizedignorance &
surprisesFrameworks for decision making under uncertainty IPCC approach + ++ -- Risk approaches ++ + -- Engineering safety margin ++ - Anticipating design ++ + + Resilience + ++ Adaptive management ++ - -- Prevention Principle ++ -- Precautionary Principle + ++ ++ Human development approaches + + Adaptation Policy Framework + + + Robust decision making + ++ +
Uncertainty assessment methods Scenario analysis ("surprise-free") ++ - Expert elicitation + + + Sensitivity analysis + Monte Carlo ++ - - Probabilistic multi model ensemble ++ + Bayesian methods ++ - NUSAP / Pedigree analysis + + ++ Fuzzy sets / imprecise probabilities + + Stakeholder involvement + + Quality Assurance / Quality Checklists + + ++ Extended peer review (review by stakeholders) + ++ Wild cards / surprise scenarios - + ++ Table 5.1 A qualitative indication of how well each of the Frameworks for decision making under uncertainty and each of the uncertainty assessment methods deals with each of the three uncertainty levels. ++ very good; + good; somewhat; - bad; -- very bad
61
To further assist in the selection of tools we have made a first attempt to map the various tools to the various decision making frameworks (Table 5.2). For the mapping we made a distinction between methods that are key for a given decision making framework, methods that are complementary to a given framework and methods that do not match a given framework. We also looked for what we see as natural combinations of tools and frameworks and marked them using shaded cells in the table 5.2. Note that other literature also provides guidance in selecting appropriate uncertainty methods for a given problem (see e.g., Hall 2002, van der Sluijs et al. 2004, Refsgaard et al. 2007b).
We must make a side-note here however, that this mapping is indicative and may be sensitive to the mapper's epistemic view on the phenomenon of uncertainty. The mapping in the table has been done from the author's complex system view or post-normal view of uncertainty28. It may well be that those scholars who see uncertainty as a temporary deficit of the knowledge and who have a strong belief in the Modern perfectibility-view of science29 would do the mapping somewhat different and may contest some of the mismatch labels that we placed.
28 The complex systems view or post-normal view sees uncertainty as intrinsic to complex systems and inherent to the method of modelling. It acknowledges that not all uncertainties can be quantified, asks for openly dealing with deeper dimensions of uncertainty such as problem framing indeterminacy, ignorance, assumptions, value loadings, institutional dimensions and advocates tools for Knowledge Quality Assessment and deliberative negotiated management of risk (Funtowicz 2006, Van der Sluijs 2006). 29 The Modern View assumes that facts determine correct policy: the true entails the good; It assumes that there are no limits to progress of our control over the environment; no limits to material and moral progress of humankind: science informs policy by producing objective, valid and reliable knowledge and a tendency to technocratic governance (Funtowicz 2006, Van der Sluijs 2006).

62
Unc
erta
inty
ass
essm
ent
met
hods
Fram
ewor
ks fo
r de
cisi
on m
akin
g
unde
r unc
erta
inty
Scenario analysis ("surprise-free")
Expert elicitation
Sensitivity analysis
Monte Carlo
Probabilistic multi model ensemble
Bayesian methods
NUSAP / Pedigree analysis
Fuzzy sets / imprecise probabilities
Stakeholder involvement
Quality Assurance / Quality Checklists
Extended peer review (review by stakeholders)
Wild cards / surprise scenarios
Top-
dow
n ap
proa
ches
• P
reve
ntio
n Pr
inci
ple
c c
c ke
yke
yc
c c
c c
c m
m
• IPC
C a
ppro
ach
key
cc
cc
cc
c c
c c
mm
• Ris
k ap
proa
ches
ke
yc
c ke
yke
yke
yc
c c
c c
mm
B
otto
m-u
p ap
proa
ches
• P
reca
utio
nary
Prin
cipl
e c
c c
c c
mm
key
key
key
key
key
• Eng
inee
ring
safe
ty m
argi
n c
key
c c
c c
c c
c c
c m
m
• Ant
icip
atin
g de
sign
c
key
cc
cc
c c
c c
c ke
y• R
esili
ence
ke
yc
key
cc
cc
cke
yc
cke
y• A
dapt
ive
man
agem
ent
c c
c c
c c
c c
key
c c
mm
M
ixed
and
alte
rnat
ive
appr
oach
es
• Hum
an d
evel
opm
ent a
ppro
ache
s c
c c
c c
c c
c ke
yc
c c
• Ada
ptat
ion
Polic
y Fr
amew
ork
key
c c
c c
c c
c ke
yc
c ke
y• R
obus
t dec
isio
n m
akin
g ke
yc
key
c c
c c
c c
c c
c Ta
ble
5.2
Mat
ch a
nd m
ism
atch
bet
wee
n Fr
amew
orks
for d
ecis
ion
mak
ing
unde
r unc
erta
inty
and
met
hods
for u
ncer
tain
ty a
sses
smen
t. K
ey =
m
etho
d of
key
impo
rtanc
e; c
=com
plem
enta
ry m
etho
d; m
m=m
ism
atch
(bet
wee
n th
e ty
pe o
f unc
erta
inty
info
rmat
ion
that
the
asse
ssm
ent m
etho
d yi
elds
and
the
type
of u
ncer
tain
ty in
form
atio
n th
at th
e de
cisi
on fr
amew
ork
need
s). S
hade
d ce
lls a
re c
ombi
natio
ns th
at to
our
opi
nion
go
wel
l ha
nd in
han
d.

5.2 A hypothetical case study
This section tries to demonstrate, in a hypothetical sense, how the methods and tools reviewed in the previous section could be applied to actual adaptation decisions. Given that about two-thirds of the Netherlands are below sea level it is not surprising that flood safety is a national issue. A pertinent question to ask could be: how much do dikes need to be raised in order to maintain the current level of safety? In more general terms the question would be how can the Netherlands adapt flood management to a changing climate.
If one takes the prediction oriented approach and if say we just focus on river flooding, the focus turns into how will peak discharge change in the future. The main climatic driver of peak discharge is precipitation, which can be analysed using climate models. Since the KNMI scenarios already take a multi-model perspective on future climate, here we use a large perturbed physics ensemble of the Hadley Centre model as it offers the opportunity for a ‘probabilistic’ approach to assessing regional and local climate change impacts.
We used the initial results from the climateprediction.net (CP.net) experiment described in detail by Stainforth et al. (2005). The data from the experiment represent 2700 individual simulations with the HadSM3 climate model; each simulation comprises three 15 year periods: a calibration phase, followed by a 15 year 1xCO2 ‘control’ simulation, and a doubled CO2 simulation, in which the model moves towards an equilibrium response to doubling of CO2. Within this subset of the full first experiment, seven physics parameter values are perturbed and there are 449 unique combinations of perturbations. For most perturbations, there is more than one simulation, with each simulation differing only in initial conditions. The total number of simulations in the 449 initial conditions ensembles adds up to 2700 simulations in ‘grand ensemble’.
CP.net simulations are equilibrium experiments but the climate system is likely to never reach equilibrium, especially not in terms of adaptation planning horizons of 20-50 years. Therefore it is necessary to put these experiments into some time scale context. Given current knowledge of carbon cycle uncertainties and using the Bern-CC fast carbon cycle model (see IPCC 2007), a doubling of carbon dioxide emissions could occur as early as 2040 (under SRES A1FI) or it could never be reached (under SRES B1). To make them comparable to the KNMI scenarios it is worth examining 2050. Given carbon cycle uncertainties, doubling of carbon dioxide emissions could happen in SRES A1FI, A2, A1B and A1T, but most likely under A1FI.
Figure 5.1 shows the probability of seasonal average winter precipitation change (in percentage, 2xCO2 compared to 1xCO2) for the Netherlands using the CP.net ensemble. Also shown are the KNMI scenarios. The uncertainty range of the CP.net results is much larger than the KNMI scenarios, ranging from -25 to +75%. It is important to note that the CP.net ensemble is still highly conditional on the GCM structure and the assumed emissions scenario; therefore, it does not represent the full range of uncertainty.

64
0
0.02
0.04
0.06
0.08
0.1
0.12
0.14
-50 -25 0 25 50 75 100Precipitation change (%)
Pro
babi
lity
CP.netGG+WW+
Figure 5.1 Probability density function of winter mean precipitation change (2xCO2 compared to 1xCO2) over the Netherlands. Also shown are the KNMI scenarios (G, G+, W
and W+).
The uncertainty associated with summer mean precipitation is even larger (from almost -100% to +25%), despite larger uncertainties in the KNMI scenarios (Figure 5.2).
0
0.01
0.02
0.03
0.04
0.05
0.06
0.07
0.08
-100 -75 -50 -25 0 25 50
Precipitation change (%)
Prob
abili
ty
CP.netGG+WW+
Figure 5.2 Probability density function of summer mean precipitation change (2xCO2 compared to 1xCO2) over the Netherlands. Also shown are the KNMI scenarios (G, G+, W
and W+).
Figures 5.3 and 5.4 show the cumulative probability of mean temperature and precipitation change for the Netherlands (again comparing 2xCO2 with 1xCO2) for all seasons. According to this model, it is likely (around 89% for both seasons) that winters will get wetter and that summers will get drier. For spring it is likely (around 68%) that precipitation will increase whereas for autumn it is about as likely as not, with 55% probability of drier conditions. There is certainty that temperature will increase in the future in the Netherlands according to

65
this model (Figure 5.4). Summer temperatures are expected to increase the most compared to the other seasons and spring the least.
0
0.1
0.2
0.3
0.4
0.5
0.6
0.7
0.8
0.9
1
-100 -75 -50 -25 0 25 50 75 100
Precipitation change (%)
Cumulative probability
DJFMAMJJASON
Figure 5.3 Cumulative density function of seasonal mean precipitation change (2xCO2 compared to 1xCO2) over the Netherlands for the winter (DJF), spring (MAM), summer (JJA) and Autumn (SON) seasons.
00.10.20.30.40.50.60.70.80.9
1
0 2.5 5 7.5 10 12.5 15 17.5 20
Temperature change (ºC)
Cum
ulat
ive
prob
abili
ty
DJFMAMJJASON
Figure 5.4 Cumulative density function of seasonal mean temperature change (2xCO2 compared to 1xCO2) over the Netherlands for the winter (DJF), spring (MAM), summer (JJA) and Autumn (SON) seasons.
This probabilistic climate information could be combined with an observational data set to serve as the input to a hydrological model of Dutch rivers. The probability of exceeding a certain threshold of river discharge (e.g., 16000 m3/sec) could then be calculated in order to assess the adaptation required to maintain certain levels of safety.

66
A few side comments need to be made here. First, the KNMI scenarios are conditional on the GCM structures and assumed emission scenarios, so they do not represent the full range of uncertainty. Second, the climateprediction.net results have not been validated against past climate for the relevant grid cell. Third, the grid cell used as proxy for the Netherlands is not the most relevant focus of analysis, because what matters is precipitation (rainfall and snow separately) for the catchment of concern (e.g. Rhine basin). In Appendix 2 we reflect in more detail on the differences between the KNMI scenario range and the CP.net range.
A complementary approach to the same problem would be to focus on vulnerability (a resilience oriented approach). This approach assumes that reducing current vulnerability will help to deal with future vulnerability, which is plagued with uncertainty. Under this approach we would want to examine the current (instead of future) vulnerability of the river system by, for example, developing indicators of population at risk, adaptive capacity, flooding risk, etc. The focus is on the present rather than the future. While there is uncertainty associated with developing the indicators (see e.g., Adger and Vincent 2005, Vincent 2007) the adaptation strategies are not entirely climate driven as they are focused at reducing vulnerability (e.g., they could suggest moving people from harm’s way, although in practice this can have tremendous economic social and cultural implications).
A final approach that is worth mentioning is robust decision making (Lempert et al. 2006). Under this approach, the first task is to collate a large number of adaptation options for river flooding. A candidate strategy (say current policy) is then assessed against a number of climate and other uncertainties in order to determine whether the policy is vulnerable or not to the uncertainties. If the policy is found to be vulnerable then other candidate adaptation options are explored until the least sensitive, i.e., the robust adaptation option, has been identified. An example of a robustness analysis of alternatives for flood risk management is provided by Hine and Hall (2007).

67
6. Conclusion In the Netherlands it is now widely recognized that adaptation to climate change has become unavoidable. Adaptation decisions are needed or expected in a wide range of sectors of Dutch society, such as water, nature, agriculture, energy, transport, housing and infrastructure, recreation, fisheries, and health. Many actors are involved in adaptation decision making. In the Netherlands, the main players now work together in the National Program on Spatial Planning and Adaptation to Climate Change, (ARK): the national government (especially the ministries VROM, V&W, LNV, EZ ), the regional governments and local governments are jointly developing an adaptation strategy for the next 100 years. Science is also strongly involved, mainly through three major national research programmes: Climate Changes Spatial Planning, Living with Water and Habiforum. Other key players include the corporate sector and NGO's. At the sectoral level there is a large diversity of actors and interests. Adaptation to climate change is a complex societal process, facing long time scales and all kinds of uncertainties, and it is in this context that scientific analysis should help adaptation decision making.
This report reviews and brings together a very wide literature on uncertainty and climate change adaptation. The climate is changing worldwide and in The Netherlands. There are already various observable impacts of these changes in a number of natural and human systems. This has led to some consideration of adaptation to climate change in coastal and river flooding policy. We have shown that the existence of different attitudes to risk and uncertainty lead to different decision making frameworks existing in various adaptation contexts. The various decision making frameworks call for different decisions analysis frameworks and different tools for uncertainty analysis. We have grouped decision frameworks and analysis tools into two schools of thought: the predictive top-down approach and the resilience bottom-up approach. Some mixed approaches were also discussed. Given that much more attention has been given to the prediction oriented approach we reviewed various tools, techniques and methods used in the various steps of climate change impact and adaptation assessments and how these are currently being applied in the fields of climate risk assessment and climate adaptation decision making.
Our project identified and selected the following strategies to account for uncertainty in decision making and frameworks for decision making under uncertainty of relevance for adaptation decisions (for details see section 3):
Top down approaches o Prevention Principle o IPCC approach o Risk approaches
Bottom up approaches o Precautionary Principle o Engineering safety margin o Anticipating design o Resilienceo Adaptive management
Mixed and alternative approaches o Human development approaches o Adaptation Policy Framework o Robust decision making

68
Further, we identified and selected the following tools for uncertainty analysis of relevance for informing adaptation decision making processes and discourses (for details, see section 4, along with Van der Sluijs et al. 2004, Refsgaard et al. 2007):
Scenario analysis ("surprise-free") Expert elicitation Sensitivity analysis Monte Carlo Probabilistic multi model ensemble Bayesian methods NUSAP / Pedigree analysis Fuzzy sets / imprecise probabilities Stakeholder involvement Quality Assurance / Quality Checklists Extended peer review (review by stakeholders) Wild cards / surprise scenarios
Both for the frameworks for decision making under uncertainty, and for the tools for uncertainty assessment, we mapped how well each of them can cope with the three levels of uncertainty distinguished in this report: statistical uncertainty, scenario uncertainty and recognized ignorance. Roughly, the top down - prediction oriented approaches are strong in statistical uncertainty and the resilience and robustness type of bottom up approaches are strong in coping with recognized ignorance and surprises.
An essential first step in the selection of an appropriate decision making framework and appropriate methods for uncertainty analysis for a given climate adaptation decision making problem will thus be a well argued judgment on the policy-relevance of each of the three levels of uncertainty - along with a judgment of their relative importance - to the particular decision making problem at hand.
We also mapped the various uncertainty assessment tools to the various frameworks for decision making under uncertainty (table 5.2, section 5.1), indicating methods that are key for a given decision making framework, methods that are complementary to a given framework and methods that do not match a given framework.
A hypothetical case-study sketched how these tools might be applied in practice. The case study highlights a remarkable difference in uncertainty range for precipitation changes between the latest KNMI scenarios and results from a perturbed physics ensemble using a general circulation model. To further explore the usefulness of various tools for effectively informing decisions on various adaptation challenges, a follow-up with real case studies is recommended.
Additional spatial and temporal resolution and further quantification of uncertainty of climate models, in an effort to achieve perfect foresight, will not solve adaptation problems on its own. Similarly, enhancing the resilience of society to cope with a changed climate by increasing general adaptive capacity may not deal with the problem sufficiently. The main conclusion of this report is that there is no ‘silver bullet’ to the problem of uncertainty and adaptation to climate change. Adaptation to climate change is extremely context dependent. This leads to a wide range of institutional decision making settings shaped by history, culture and various social norms, that favour certain types of analysis, for example risk analysis or

69
cost-benefit analysis. The epistemological orientation of the analyst is also important in how uncertainty is tackled in the context of adaptation to climate change. The report has shown numerous tools and techniques on how to deal with various climate change uncertainties. Our tentative recommendation is that a plurality of approaches (using both schools of thought) need to be tried in different contexts in order to learn what works and what doesn’t.
Still, our review and analysis enables us to identify a few niches in the field of uncertainty and climate change adaptation and allows us to articulate a few suggestions for a research agenda.
Climate adaptation provides opportunities to account for those uncertainties that are hard to take on board in climate mitigation decision making. In particular, adaptation can account for deeper dimensions of uncertainty such as recognized ignorance of the type "poorly known probability - high impact events", mainly via the resilience approach and by increasing adaptive capacity. Given the deep uncertainties associated with long term climate change impacts and other drivers of adaptation to climate change, robust decision making methods are worth exploring, especially where there is a large portfolio of adaptation options available.Sets of resilience indicators could be developed by which one can "measure" how different adaptation policy options influence the overall resilience of the system. An example of an indicator could be the typical response-time by which a coastal defence system can be re-dimensioned when needed, or the speed by which an existing area that might be needed for water storage in the future can be converted to a water storage area. That response time is larger if there are many land uses that are hard to move and shorter if the investments that need to be moved have a shorter depreciation time and if there are less legal and procedural barriers to be overcome. Such resilience indicators could be used in for instance the State of Environment reports (Milieubalans), the Environmental Outlook, and the Sustainability Outlook, to monitor and explore overall trends in resilience of the Netherlands to changes in the climate and to evaluate different adaptation policy strategies and options.The possibilities could be explored of developing a catalogue of Wild Cards ("surprise scenario's") of relevance for climate adaptation policy making. Wild cards could include events that are excluded from the 'surprise-free' scenario studies such as the IPCC and KNMI scenarios but that still have relevance for decision making. Examples of such wild cards could be: shut down of the ocean circulation; collapse of the West Antarctic Ice Sheet; Accelerated melting of the Greenland ice sheet; Massive plagues and diseases in agriculture etc. The catalogue of wild cards can then be used in resilience analysis to explore how different sectors of the Netherlands economy might be impacted in case a selected set of surprise scenarios would occur, and whether there are options to increase resilience to limit the harm that might follow from each wild card. Of course one cannot protect against every wild card but without such analysis we may overlook many options (including simple and no-cost options) to increase resilience and limit possible harm. Available probabilistic climate predictions such as the ones from climateprediction.net can be better utilized in Netherlands adaptation decision making, to complement the KNMI scenarios. It is striking that the KNMI scenarios seem to underestimate the range of relevant outcomes of key climate parameters when compared to the climateprediction.net findings (see section 5.2 and appendix 2). This difference requires more reflection in the climate adaptation research and policy communities. Explore alternative frameworks in the context of increasing knowledge and experience with the adaptation process.

70
Increase understanding of adaptation and its knowledge needs in practice through case studies.
A final comment concerns our attempt to map “frameworks for decision making under uncertainty” to “uncertainty assessment methods” (table 5.2). This table is potentially useful to improve knowledge utilization and relevance of science for policy, but the present version is a first go based on our personal views. A useful follow-up might be a focussed expert consultation workshop with key experts to complete, validate and further elaborate this analysis of match and mismatch of supply and demand of uncertainty information.

71
7. Acknowledgements
This work was funded by The Netherlands Environmental Assessment Agency (MNP) and contributes to MNP project: “S/550032/01/OK: Onzekerheden, Transparantie en Communicatie – Onzekerheden Klimaatadaptatie”. Members of the steering group (MNP: Arthur Petersen, Leo Meyer, Bart Strengers, Arjan Wardekker, Joost Knoop and Willem Ligtvoet; KNMI: Bart van den Hurk, Jeanette Bessembinder) are thanked for their input and encouragement. Saskia Werners, Jeroen Veraart, Bart van den Hurk, Jeanette Bessembinder, Geert Lenderink, Jelle van Minnen and Detlef van Vuuren are thanked for useful discussions. Ana Lopez is thanked for extracting the climateprediction.net data. We thank Jim Hall, Roger Street and Rob Wilby for their thorough and thoughtful review-comments. We thank Mike Hulme, Arjan Wardekker, Arthur Petersen, Bruce Beck and Tony Patt for various comments on earlier versions of this report.

72
8. References
Adger, W. N. 2000. Social and ecological resilience: are they related? Progress in Human Geography 24:347-364.
Adger, W. N., S. Agrawala, M. Mirza, C. Conde, K. O'Brien, J. Pulhin, R. S. Pulwarty, B. Smit, and K. Takahashi. 2007. Assessment of adaptation practices, options, constraints and capacity. Pages 717-743 in IPCC, editor. Climate Change 2007: Impacts, Adaptation and Vulnerability. Cambridge University Press, Cambridge.
Adger, W. N., N. W. Arnell, and E. L. Tompkins. 2005. Successful adaptation to climate change across scales. Global Environmental Change-Human and Policy Dimensions 15:77-86.
Adger, W. N., and K. Vincent. 2005. Uncertainty in adaptive capacity. Comptes Rendus Geoscience 337:399-410.
Aerts, J., and S. Werners. 2007. Adaptation portfolios in water management.(in preparation). Allen, M. R., P. A. Stott, J. F. B. Mitchell, R. Schnur, and T. L. Delworth. 2000. Quantifying
the uncertainty in forecasts of anthropogenic climate change. Nature 407:617-620.Andronova, N. G., and M. E. Schlesinger. 2001. Objective estimation of the probability
density function for climate sensitivity. Journal of Geophysical Research-Atmospheres 106:22605-22611.
Annan, J. D., J. C. Hargreaves, R. Ohgaito, A. Abe-Ouchi, and S. Emori. 2005. Efficiently constraining climate sensitivity with ensembles of paleoclimate simulations. SOLA 1:181-184.
Arnell, N. W., and E. K. Delaney. 2006. Adapting to climate change: Public water supply in England and Wales. Climatic Change 78:227-255.
Arvai, J., G. Bridge, N. Dolsak, R. Franzese, T. Koontz, A. Luginbuhl, P. Robbins, K. Richards, K. S. Korfmacher, B. Sohngen, J. Tansey, and A. Thompson. 2006. Adaptive management of the global climate problem: Bridging the gap between climate research and climate policy. Climatic Change 78:217-225.
Bankes, S. 1993. Exploratory Modeling for Policy Analysis. Operations Research 41:435-449.Bankes, S., R. Lempert, and S. Popper. 2002. Making computational social science effective -
Epistemology, methodology, and technology. Social Science Computer Review 20:377-388.
Barg, S., P. Bhandari, J. Drexhage, U. Kelkar, S. Mitra, D. Swanson, S. Tyler, and H. D. Venema. 2006. Introduction. Pages 1-8 in IISD, TERI, and IDRC, editors. Designing policies in world of uncertainty, change and surprise: adaptive policy-making for agriculture and water resources in the face of climate change, Winnipeg and New Delhi.
Barnett, D. N., S. J. Brown, J. M. Murphy, D. M. H. Sexton, and M. J. Webb. 2004. Quantifying uncertainty in the relative frequency of extreme climatic events under increased atmospheric CO2 using a large ensemble of GCM simulations. Climate Dynamics 26:489-511.
Barnett, J. 2001. Adapting to climate change in Pacific Island Countries: The problem of uncertainty. World Development 29:977-993.
Beck, M.B., B.D. Fath, A.K. Parker, O.O. Osidele, G.M. Cowie, T.C. Rasmussen, B.C. Patten, B.G. Norton, A. Steinemann, S.R. Borrett, D. Cox, M.C. Mayhew, X.-Q. Zeng AND W. Zeng, 2002, Developing a Concept of Adaptive Community Learning: Case Study of a Rapidly Urbanizing Watershed, Integrated Assessment, 3 (4) 299–307.
73
Bell, M. L., B. F. Hobbs, E. M. Elliott, H. Ellis, and Z. Robinson. 2000. An evaluation of multicriteria decision-making methods in integrated assessment of climate policy. Research and Practice in Multiple Criteria Decision Making 487:228-237.
Ben-Haim, Y. 2006. Info-gap decision theory : decisions under severe uncertainty, 2nd edition. Academic, Oxford.
Berkes, F. 2007. Understanding uncertainty and reducing vulnerability: lessons from resilience thinking. Natural Hazards:(in press).
BJI, and MJA. 2006. Climate change impacts and risk management: a guide for business and government. Broadleaf Capital International and Marsden Jacob Associates, Canberra.
Brooks, H. 1986. The Typology of Surprises in Technology, Institutions and Development. Pages 325-348 in W. C. Clark and R. E. Munn, editors. Sustainable Development of the Biosphere. Cambridge University Press, New York.
Burton, I., S. Huq, B. Lim, O. Pilifosova, and E. L. Schipper. 2002. From impacts assessment to adaptation priorities: the shaping of adaptation policy. Climate Policy 2:145-159.
Burton, I., and M. van Aalst. 1999. Come hell or high water - integrating climate change vulnerability and adaptation into Bank work. in World Bank Environment Department Paper No. 72.
Carpenter, S., B. Walker, J. M. Anderies, and N. Abel. 2001. From metaphor to measurement: Resilience of what to what? Ecosystems 4:765-781.
Carter, T. R., R. Jones, X. Lu, S. Bhadwal, C. Conde, L. O. Mearns, B. C. O'Neill, M. Rounsevell, and M. Zurek. 2007. New assessment methods and the characterisation of future conditions. Pages 133-171 in IPCC, editor. Climate Change 2007: Impacts, Adaptation and Vulnerability. Cambridge University Press, Cambridge.
Carter, T. R., M. Parry, H. Harasawa, and S. Nishioka. 1994. IPCC technical guidelines for assessing climate change impacts and adaptation. Department of Geography, University College London, UK and the Centre for Global environmental Research, National Institute for Environmental Studies, Japan.
CEC. 2007. Adapting to climate change in Europe – options for EU action. COM(2007) 354 final, Comission of the European Communities, Brussels.
Christensen, J. H., B. Hewitson, A. Busuioc, A. Chen, X. Gao, I. Held, R. Jones, R. K. Kolli, W.-T. Kwon, R. Laprise, V. M. Rueda, L. Mearns, C. G. Menéndez, J. Räisänen, A. Rinke, A. Sarr, and P. Whetton. 2007. Regional Climate Projections. Pages 847-940 inS. Solomon, D. Qin, M. Manning, Z. Chen, M. Marquis, K. B. Averyt, M. Tignor, and H. L. Miller, editors. Climate Change 2007: The Physical Science Basis. Cambridge University Press, Cambridge.
Clark, R., S. Brown, and J. Murphy. 2006. Modelling Northern Hemisphere summer heat extreme changes and their uncertainties using a physics ensemble of climate sensitivity experiments. Journal of Climate 19:4418–4435.
Collins, M. 2007. Ensembles and probabilities: a new era in the prediction of climate change. Philosophical Transactions of the Royal Society a-Mathematical Physical and Engineering Sciences 365:1957-1970.
Commissie, D. 1960. Rapport van de Delta Commissie, Deel 1. The Hague. Craig, S. G., and K. J. Holmen. 1995. Uncertainties in Future CO2 Projections. Global
Biogeochemical Cycles 9:139-152.CUR/TAW. 1990. Probabilistic Design of Flood Defences. Report 141, Centre for Civil
Engineering Research and Codes/ Technical Advisory Committee on Water Defences, Gonda.
Davidson, M. D. 2002. Treating future generations as equals with respect to risk and uncertainty. in paper presented at Risk and Uncertainty in Environmental and Resource Economics, Wageningen.

74
Davis, J. P., and J. W. Hall. 2003. A software-supported process for assembling evidence and handling uncertainty in decision-making. Decision Support Systems 35:415-433.
Dawson, R. J., J. W. Hall, P. D. Bates, and R. J. Nicholls. 2005. Quantified analysis of the probability of flooding in the Thames estuary under imaginable worst-case sea level rise scenarios. International Journal of Water Resources Development 21:577-591.
De Bruijn, K. M. 2004a. Resilience and flood risk management. Water Policy 6:53-66.De Bruijn, K. M. 2004b. Resilience indicators for flood risk management systems of lowland
rivers. Intl. J. River Basin Management 2:199–210.de Sadeleer, N. 2002. Environmental Principles. Oxford University Press, Oxfrod. Dessai, S. 2005. Robust adaptation decisions amid climate change uncertainties. PhD.
University of East Anglia, Norwich. Dessai, S., and M. Hulme. 2001. Climatic implications of revised IPCC emission scenarios,
the Kyoto Protocol and quantification of uncertainties. Integrated Assessment 2:159-170.
Dessai, S., and M. Hulme. 2004. Does climate adaptation policy need probabilities? Climate Policy 4:107-128.
Dessai, S., and M. Hulme. 2007. Assessing the robustness of adaptation decisions to climate change uncertainties: A case study on water resources management in the East of England. Global Environmental Change 17:59-72.
Dessai, S., X. F. Lu, and J. S. Risbey. 2005. On the role of climate scenarios for adaptation planning. Global Environmental Change-Human and Policy Dimensions 15:87-97.
Dettinger, M. 2006. A Component-Resampling Approach for Estimating Probability Distributions from Small Forecast Ensembles. Climatic Change 76:149-168.
Douglas, M., and A. B. Wildavsky. 1982. Risk and culture : an essay on the selection of technical and environmental dangers. University of California Press, Berkeley.
EEA. 2007. Climate change and water adaptation issues. EEA Technical Report No. 2/2007, Copenhagen.
Fankhauser, S., J. B. Smith, and R. S. J. Tol. 1999. Weathering climate change: some simple rules to guide adaptation decisions. Ecological Economics 30:67-78.
Feenstra, J. F., I. Burton, J. B. Smith, and R. S. J. Tol, editors. 1998. Handbook on methods for climate change, impact assessment and adaptation strategies. UNEP and IVM.
Few, R., K. Brown, and E. L. .Tompkins. 2007. Public participation and climate change adaptation: avoiding the illusion of inclusion. Climate Policy:(in press).
Forest, C. E., M. R. Allen, A. P. Sokolov, and P. H. Stone. 2001. Constraining climate model properties using optimal fingerprint detection methods. Climate Dynamics 18:277-295.
Forest, C. E., M. R. Allen, P. H. Stone, and A. P. Sokolov. 2000. Constraining uncertainties in climate models using climate change detection techniques. Geophysical Research Letters 27:569-572.
Forest, C. E., P. H. Stone, and A. P. Sokolov. 2006. Estimated PDFs of climate system properties including natural and anthropogenic forcings. Geophysical Research Letters 33:-.
Forest, C. E., P. H. Stone, A. P. Sokolov, M. R. Allen, and M. D. Webster. 2002. Quantifying uncertainties in climate system properties with the use of recent climate observations. Science 295:113-117.
Fowler, H. J., S. Blenkinsop, and C. Tebaldi. 2007. Linking climate change modelling to impacts studies: recent advances in downscaling techniques for hydrological modelling. International Journal of Climatology 27:1547-1578.

75
Frame, D. J., B. B. B. Booth, J. A. Kettleborough, D. A. Stainforth, J. M. Gregory, M. Collins, and M. R. Allen. 2005. Constraining climate forecasts: The role of prior assumptions. Geophysical Research Letters 32:-.
Funtowicz, S. O. 2006. Why knowledge assessment? in Â. G. Pereira, S. G. Vaz, and S. Tognetti, editors. Interfaces between Science and Society. Green Leaf Publishing.
Funtowicz, S. O., and J. R. Ravetz. 1990. Uncertainty and quality in science for policy. Kluwer Academic Publishers, Dordrecht ; Boston.
Furrer, R., S. R. Sain, D. W. Nychka, and G. A. Meehl. 2007. Multivariate Bayesian analysis of atmosphere-ocean general circulation models. Environ. Ecol. Stat.:(in press).
Gagnon-Lebrun, F., and S. Agrawala. 2006. Progress on adaptation to climate change in developed countries: an analysis of broad trends. ENV/EPOC/GSP(2006)1/FINAL,OECD, Paris.
Geluk, A. 1977. Hoe hou je 't hoofd boven water? De lage landen voeren een eeuwige strijd tegen een vochtige vijand. in K. Aartsma, editor. 1977 Nederland en de Zee, Een Eeuwigdurende Strijd. Zomer & Keuning, Wageningen.
Giorgi, F. 2005. Climate change prediction. Climatic Change 73:239-265.Giorgi, F., and L. O. Mearns. 2002. Calculation of average, uncertainty range, and reliability
of regional climate changes from AOGCM simulations via the "reliability ensemble averaging'' (REA) method. Journal of Climate 15:1141-1158.
Giorgi, F., and L. O. Mearns. 2003. Probability of regional climate change based on the Reliability Ensemble Averaging (REA) method. Geophysical Research Letters 30:art.no.-1629.
Giorgi, F., P. H. Whetton, R. G. Jones, J. H. Christensen, L. O. Mearns, B. Hewitson, H. von Storch, R. Francisco, and C. Jack. 2001. Emerging patterns of simulated regional climatic changes for the 21st century due to anthropogenic forcings. Geophysical Research Letters 28:3317-3320.
Goodess, C. M., J. W. Hall, M. Best, R. Betts, L. Cabantous, P. D. Jones, C. G. Kilsby, A. Pearman, and C. Wallace. 2007. Climate scenarios and decision making under uncertainty. Built Environment 33:10-30.
Greene, A. M., L. Goddard, and U. Lall. 2006. Probabilistic multimodel regional temperature change projections. Journal of Climate 19:4326–4343.
Gregory, J. M., R. J. Stouffer, S. C. B. Raper, P. A. Stott, and N. A. Rayner. 2002. An observationally based estimate of the climate sensitivity. Journal of Climate 15:3117-3121.
Gregory, R., L. Failing, and P. Higgins. 2006. Adaptive management and environmental decision making: A case study application to water use planning. Ecological Economics 58:434-447.
Gritsevskyi, A., and N. Nakicenovic. 2000. Modeling uncertainty of induced technological change. Energy Policy 28:907-921.
Groves, D. G., and R. J. Lempert. 2007. A new analytic method for finding policy-relevant scenarios. Global Environmental Change 17:73-85.
Ha Duong, M. 2003. Imprecise probability bridges scenario-forecast gap. (unpublished manuscript).
Hall, J. 2007. Probabilistic climate scenarios may misrepresent uncertainty and lead to bad adaptation decisions. Hydrological Processes 21:1127-1129.
Hall, J., G. Fu, and J. Lawry. 2007. Imprecise probabilities of climate change: aggregation of fuzzy scenarios and model uncertainties. Climatic Change 81:265-281.
Hall, J. W. 2002. A contingency approach to choice. Civil Engineering and Environmental Systems 19:87-118.

76
Hammitt, J. K., R. J. Lempert, and M. E. Schlesinger. 1992. A Sequential-Decision Strategy for Abating Climate Change. Nature 357:315-318.
Hansen, J. E. 2007. Scientific reticence and sea level rise. Environmental Research Letters 2:024002 (024006pp).
Harris, G. R., D. M. H. Sexton, B. B. B. Booth, M. Collins, J. M. Murphy, and M. J. Webb. 2006. Frequency distributions of transient regional climate change from perturbed physics ensembles of general circulation model simulations. Climate Dynamics 27:357-375.
Hegerl, G. C., T. J. Crowley, W. T. Hyde, and D. J. Frame. 2006. Climate sensitivity constrained by temperature reconstructions over the past seven centuries. Nature 440:1029-1032.
Held, H. & Kleinen, T. Detection of climate system bifurcations by degenerate fingerprinting. Geophysical Research Letters 31, L23207 (2004).
Hennessy, K., I. Macadam, and P. Whetton. 2006. Climate change scenarios for initial assessment of risk in accordance with risk management guidance. CSIRO Marine and Atmospheric Research, Apendale.
Hickox, W. H., and M. D. Nichols. 2003. Climate research. Issues in Science and Technology 19:6-7.
Hine, D., and J. W. Hall. 2007. Analysing the robustness of engineering decisions to hydraulic model and hydrological uncertainties. Pages 10 in Harmonising the Demands of Art and Nature in Hydraulics: Proc. 32nd Congress of IAHR, Venice, 1-6 July 2007.
Hitz, S., and J. Smith. 2004. Estimating global impacts from climate change. Global Environmental Change-Human and Policy Dimensions 14:201-218.
Hobbs, B. J., P. T. Chao, and B. N. Venkatesh. 1997. Using decision analysis to include climate change in water resources decision making. Climatic Change 37:177-202.
Holling, C. S., editor. 1978. Adaptive environmental assessment and management. Wiley, Chichester ; New York.
Holling, C. S. 1986. The Resilience of Terrestrial Ecosystems: Local Surprise and Global Change. Pages 292-317 in W. C. Clark and R. E. Munn, editors. Sustainable Development of the Biosphere. Cambridge University Press, New York.
Hurk, B. J. J. M. v. d., A. M. G. K. Tank, G. Lenderink, A. P. v. Ulden, G. J. v. Oldenborgh, C. A. Katsman, H. W. v. d. Brink, F. Keller, J. J. F. Bessembinder, G. Burgers, G. J. Komen, W. Hazelege, and S. S. Drijfhout. 2006. KNMI Climate Change Scenarios 2006 for the Netherlands. WR 2006-01, KNMI, De Bilt.
IPCC. 1990. Climate Change: The IPCC Scientific Assessment. Cambridge University Press, Cambridge.
IPCC. 1992. Climate change 1992 : the supplementary report to the IPCC scientific assessment. Cambridge University Press, Cambridge ; New York.
IPCC. 2001a. Climate change 2001: impacts, adaptation, and vulnerability. Cambridge University Press, Cambridge.
IPCC. 2001b. Climate change 2001: the scientific basis. Cambridge University Press, Cambridge.
IPCC. 2007a. Climate Change 2007: Mitigation. Cambridge University Press, Cambridge. IPCC. 2007b. Climate Change 2007: the physical science basis. Cambridge University Press,
Cambridge. IPCC-TGCIA. 1999. Guidelines on the Use of Scenario Data for Climate Impact and
Adaptation Assessment. Version 1. Intergovernmental Panel on Climate Change, Task Group on Scenarios for Climate Impact Assessment.

77
Janssen, P. H. M., A. C. Petersen, J. P. van der Sluijs, J. S. Risbey, and J. R. Ravetz. 2005. A guidance for assessing and communicating uncertainties. Water Science and Technology 52:125-131.
Jones, C. D., P. Cox, and C. Huntingford. 2003a. Uncertainty in climate-carbon-cycle projections associated with the sensitivity of soil respiration to temperature. Tellus Series B-Chemical and Physical Meteorology 55:642-648.
Jones, C. D., P. M. Cox, R. L. H. Essery, D. L. Roberts, and M. J. Woodage. 2003b. Strong carbon cycle feedbacks in a climate model with interactive CO2 and sulphate aerosols. Geophysical Research Letters 30:art. no.-1479.
Jones, R. N. 2000. Analysing the risk of climate change using an irrigation demand model. Climate Research 14:89-100.
Jones, R. N. 2001. An environmental risk assessment/management framework for climate change impact assessments. Natural Hazards 23:197-230.
Jones, R. N., and C. M. Page. 2001. Assessing the risk of climate change on the water resources of the Macquire river catchment. Pages 673-678 in F. Ghassemi, P. H. Whetton, R. Little, and M. Littleboy, editors. Integrating models of natural resources management across disciplines, issues and scales. Modelling and Simulation Society of Australia and New Zealand, Canberra.
Kates, R. W., and W. C. Clark. 1996. Expecting the unexpected. Environment 38:6-11 and 28-34.
Katz, R. W. 2002. Techniques for estimating uncertainty in climate change scenarios and impact studies. Climate Research 20:167-185.
Kelly, P. M., and W. N. Adger. 2000. Theory and practice in assessing vulnerability to climate change and facilitating adaptation. Climatic Change 47:325-352.
Kittel, T. G. F., F. Giorgi, and G. A. Meehl. 1998. Intercomparison of regional biases and doubled CO2-sensitivity of coupled atmosphere-ocean general circulation model experiments. Climate Dynamics 14:1-15.
Klein, F., J. Dijkman, and W. Silva. 2001. Room for the Rhine in the Netherlands: Summary of research results. RIZA, Delft.
Klein Tank, A. M. G., J. J. F. Bessembinder, B. J. J. M. v. d. Hurk, G. Lenderink, A. P. v. Ulden, G. J. v. Oldenborgh, C. A. Katsman, H. W. v. d. Brink, F. Keller, G. Burgers, G. J. Komen, W. Hazeleger, and S. S. Drijfhout. 2006. Climate in the 21st century: four scenarios for the Netherlands. KNMI brochure, KNMI, De Bilt.
Klein Tank, A. M. G., T. A. Buishand, J. J. Beersma, and G. P. Können. 1995. Climate Change scenarios for impact studies in The Netherlands. in Z. e. al., editor. Climate Change Research: Evaluation and Policy Implications. Elsevier.
Knutti, R., T. F. Stocker, F. Joos, and G. K. Plattner. 2002. Constraints on radiative forcing and future climate change from observations and climate model ensembles. Nature 416:719-723.
Knutti, R., T. F. Stocker, F. Joos, and G. K. Plattner. 2003. Probabilistic climate change projections using neural networks. Climate Dynamics 21:257-272.
Können, G. P. 2001. Climate Scenarios For Impact Studies In The Netherlands;. KNMI, De Bilt.
Kors, A. G., F.A.M. Claessen, J. W. Wesseling, and G. P. Können. 2000. Scenario’s externe krachten voor WB21. WL|Delft Hydraulics; Koninklijk Nederlands Meteorologisch Instituut (KNMI); Ministerie van Verkeer en Waterstaat, Rijkswaterstaat, Rijksinstituut voor Integraal Zoetwaterbeheer en Afvalwaterbehandeling (RWS, RIZA).
Kriegler, E., and H. Held. 2005. Utilizing belief functions for the estimation of future climate change. International Journal of Approximate Reasoning 39:185-209.

78
Kwadijk, J., F. Klijn, M. A. v. Drunen, D. d. Groot, G. Teisman, P. Opdam, and N. Asselman. 2006. Klimaatbestendigheid van Nederland: nulmeting. WL|Delft Hydraulics.
Lambert, S. J., and G. J. Boer. 2001. CMIP1 evaluation and intercomparison of coupled climate models. Climate Dynamics 17:83-106.
Lavery, S., and B. Donovan. 2005. Flood risk management in the Thames Estuary looking ahead 100 years. Philosophical Transactions of the Royal Society A: Mathematical, Physical and Engineering Sciences 363:1455-1474.
Leggett, J., W. Pepper, A. Sankovski, J. B. Smith, R. S. J. Tol, and T. M. L. Wigley. 2003. Climate change risk analysis framework (CCRAF) - a probabilistic tool for analyzing climate change uncertainties. in Poster presented at the EGS-AGU-EUG Joint Assembly, Nice, France.
Lempert, R., S. Popper, and S. Bankes. 2002. Confronting surprise. Social Science Computer Review 20:420-440.
Lempert, R. J., D. G. Groves, S. W. Popper, and S. C. Bankes. 2006. A general, analytic method for generating robust strategies and narrative scenarios. Management Science 52:514-528.
Lempert, R. J., S. W. Popper, and S. C. Bankes. 2003. Shaping the next one hundred years: new methods for quantitative, long-term policy analysis. RAND, Santa Monica, CA.
Lempert, R. J., and M. E. Schlesinger. 2000. Robust strategies for abating climate change. Climatic Change 45:387-401.
Lenderink, G., A. v. Ulden, B. v. d. Hurk, and F. Keller. 2007. A study on combining global and regional climate model results for generating climate scenarios of temperature and precipitation for the Netherlands. Climate Dynamics: 29 (2-3), pp. 157-176.
Lonsdale, K. G., T. E. Downing, R. J. Nicholls, D. Parker, A. T. Vafeidis, R. J. Dawson, and J. W. Hall. 2008. Plausible responses to the threat of rapid sea-level rise for the Thames Estuary. Climatic Change:(in press).
Louisse, C. 1990. General Strategy on Coastline Protection - The Dutch Case. in K. W. Pilaczyk, editor. Coastal Protection: proceedings of the short course on Coastal Protection, Balkema Rotterdam.
Lutz, W., W. Sanderson, and S. Scherbov. 1997. Doubling of world population unlikely. Nature 387:803-805.
Lutz, W., W. Sanderson, and S. Scherbov. 2001. The end of world population growth. Nature 412:543-545.
Marx, S. M., E. U. Weber, B. S. Orlove, A. Leiserowitz, D. H. Krantz, C. Roncoli, and J. Phillips. 2007. Communication and mental processes: Experiential and analytic processing of uncertain climate information. Global Environmental Change 17:47-58.
Mastrandrea, M. D., and S. H. Schneider. 2001. Integrated assessment of abrupt climatic changes. Climate Policy 1:433-449.
McCormick, M. P., L. W. Thomason, and C. R. Trepte. 1995. Atmospheric Effects of the Mt Pinatubo Eruption. Nature 373:399-404.
McKenzie-Hedger, M. 2005. Learning from experience: evolving responses to flooding events in the UK. Pages 225-234 in W. Kirch, B. Menne, and R. Bertollini, editors. Extreme weather events and public health responses. Springer, Heidelberg.
Mearns, L. O., F. Giorgi, P. Whetton, D. Pabon, M. Hulme, and M. Lal. 2003. Guidelines for Use of Climate Scenarios Developed from Regional Climate Model Experiments. IPCC TGCIA.
Meehl, G. A., T. F. Stocker, W. D. Collins, P. Friedlingstein, A. T. Gaye, J. M. Gregory, A. Kitoh, R. Knutti, J. M. Murphy, A. Noda, S. C. B. Raper, I. G. Watterson, A. J. Weaver, and Z.-C. Zhao. 2007. Global Climate Projections. Pages 747-845 in S. Solomon, D. Qin, M. Manning, Z. Chen, M. Marquis, K. B. Averyt, M. Tignor, and H.

79
L. Miller, editors. Climate Change 2007: The Physical Science Basis. Cambridge University Press, Cambridge.
Mercer, J. H. 1978. West Antarctic ice sheet and CO2 greenhouse effect: a threat of disaster. Nature 271:321-325.
Metroeconomica. 2004. Costing the impacts of climate change in the UK: overview of guidelines. UKCIP, Oxford.
Middelkoop, H., M. B. A. Van Asselt, S. A. Van't Klooster, W. P. A. Van Deursen, J. C. J. Kwadijk, and H. Buiteveld. 2004. Perspectives on flood management in the Rhine and Meuse rivers. River Research and Applications 20:327-342.
MNP. 2005. The effects of climate change in the Netherlands. 773001037, Netherlands Environmental Assessment Agency, Bilthoven.
MNP. 2007. Nederland Later, Tweede Duurzaamheidsverkenning deel Fysieke leefomgeving Nederland. in, Netherlands Environmental Assessment Agency (in Dutch). Available online: http://www.mnp.nl/bibliotheek/rapporten/500127001.pdf.
Morgan, M. G., and D. W. Keith. 1995. Climate-Change - Subjective Judgments by Climate Experts. Environmental Science & Technology 29:A468-A476.
Mukheibir, P., and G. Ziervogel. 2007. Developing a Municipal Adaptation Plan (MAP) for climate change: the city of Cape Town. Environment and Urbanization 19:143-158.
Murphy, J. M., D. M. H. Sexton, D. N. Barnett, G. S. Jones, M. J. Webb, M. Collins, and D. A. Stainforth. 2004. Quantifying uncertainties in climate change from a large ensemble of general circulation model predictions. Nature 430:768-772.
Nakicenovic, N., J. Alcamo, G. Davis, B. de Vries, J. Fenhann, S. Gaffin, K. Gregory, A. Grübler, T. Y. Jung, T. Kram, E. L. La Rovere, L. Michaelis, S. Mori, T. Morita, W. Pepper, H. Pitcher, L. Price, K. Raihi, A. Roehrl, H.-H. Rogner, A. Sankovski, M. Schlesinger, P. Shukla, S. Smith, R. Swart, S. van Rooijen, N. Victor, and Z. Dadi. 2000. Emissions Scenarios. A Special Report of Working Group III of the Intergovernmental Panel on Climate Change. Cambridge University Press, Cambridge.
New, M., and M. Hulme. 2000. Representing uncertainty in climate change scenarios: a Monte-Carlo approach. Integrated Assessment 1:203-213.
New, M., A. Lopez, S. Dessai, and R. Wilby. 2007. Challenges in using probabilistic climate change information for impact assessments: an example from the water sector. Philosophical Transactions of the Royal Society a-Mathematical Physical and Engineering Sciences 365:2117-2131.
Nordhaus, W. D. 1994. Expert Opinion on Climatic-Change. American Scientist 82:45-51.Osidele, O.O. and M.B. Beck, 2003, An Inverse Approach to the Analysis of Uncertainty in
Models of Environmental Systems, Integrated Assessment, 4 (4) 265–282. Oldenborgh, G. J. v., and A. V. Ulden. 2003. On the relationship between global warming,
local warming in the Netherlands and changes in circulation in the 20th century. International Journal of Climatology 23:1711-1724.
Olsthoorn, A. A., P. E. v. d. Werff, L. M. Bouwer, and D. Huitema. 2005. Neo-Atlantis: Dutch Responses to Five Meter Sea Level Rise. in Working Paper FNU75.
O'Neill, B. C. 2004. Conditional probabilistic population projections: An application to climate change. International Statistical Review 72:167-184.
Oppenheimer, M., B. C. O'Neill, M. Webster, and S. Agrawala. 2007. Climate change - The limits of consensus. Science 317:1505-1506.
Paavola, J., and W. N. Adger. 2006. Fair adaptation to climate change. Ecological Economics 56:594-609.
Parry, M., N. Arnell, M. Hulme, R. Nicholls, and M. Livermore. 1998. Adapting to the inevitable. Nature 395:741-741.

80
Parry, M. L., and T. R. Carter. 1998. Climate impact and adaptation assessment: a guide to the IPCC approach. Earthscan, London.
Paté-Cornell, M. E. 1996. Uncertainties in risk analysis: Six levels of treatment. Reliability Engineering & System Safety 54:95-111.
Pater, F. d., and M. A. v. Drunen. 2006. Casestudies en Hotspots. Klimaatcentrum Vrije Universiteit, Amsterdam.
Patt, A. G. 1999. Extreme outcomes: the strategic treatment of low probability events in scientific assessments. Risk Decision and Policy 4:1-15.
Patt, A. G., and C. Gwata. 2002. Effective seasonal climate forecast applications: examining constraints for subsistence farmers in Zimbabwe. Global Environmental Change-Human and Policy Dimensions 12:185-195.
Patwardhan, A., and M. J. Small. 1992. Bayesian Methods for Model Uncertainty Analysis with Application to Future Sea-Level Rise. Risk Analysis 12:513-523.
PCS. 1996. Hurricane Record 1949-1995: Report Prepared for International Institute for Applied Systems Analysis. Property Claim Services.
Pielke Jr., R. A. 1998. Rethinking the role of adaptation in climate policy. Global Environmental Change-Human and Policy Dimensions 8:159-170.
Pielke Jr., R. A., G. Prins, S. Rayner, and D. Sarewitz. 2007. Lifting the taboo on adaptation. Nature 445:597-598.
Prato, T. 2007. Accounting for risk and uncertainty in determining preferred strategies for adapting to future climate change. Mitigation and Adaptation Strategies for Global Change:(in press).
Prudhomme, C., D. Jakob, and C. Svensson. 2003. Uncertainty and climate change impact on the flood regime of small UK catchments. Journal of Hydrology 277:1-23.
Räisänen, J., and T. N. Palmer. 2001. A probability and decision-model analysis of a multimodel ensemble of climate change simulations. Journal of Climate 14:3212-3226.
Räisänen, J., and L. Ruokolainen. 2006. Probabilistic forecasts of near-term climate change based on a resampling ensemble technique. Tellus.
Refsgaard, J. C., J. P. v. d. Sluijs, A. L. Højberg, and P. A. Vanrolleghem. 2007a. Uncertainty in the environmental modelling process – A framework and guidance. Environmental Modelling & Software:22 (11), 1543-1556.
Refsgaard, J. C., J. P. van der Sluijs, A. L. Hojberg, and P. A. Vanrolleghem. 2007b. Uncertainty in the environmental modelling process - A framework and guidance. Environmental Modelling & Software 22:1543-1556.
Regan, H. M., Y. Ben-Haim, B. Langford, W. G. Wilson, P. Lundberg, S. J. Andelman, and M. A. Burgman. 2005. Robust decision-making under severe uncertainty for conservation management. Ecological Applications 15:1471-1477.
Risbey, J., and M. Kandlikar. 2002. Expert assessment of uncertainties in detection and attribution of climate change. Bulletin of the American Meteorological Society 83:1317-1326.
Risbey, J. S. 1998. Sensitivities of water supply planning decisions to streamflow and climate scenario uncertainties. Water Policy 1:321-340.
Risbey, J. S., M. Kandlikar, and D. J. Karoly. 2000. A protocol to articulate and quantify uncertainties in climate change detection and attribution. Climate Research 16:61-78.
Roughgarden, T., and S. H. Schneider. 1999. Climate change policy: quantifying uncertainties for damages and optimal carbon taxes. Energy Policy 27:415-429.
Scherm, H. 2000. Simulating uncertainty in climate-pest models with fuzzy numbers. Environmental Pollution 108:373-379.

81
Schimmelpfennig, D. 1996. Uncertainty in economic models of climate-change impacts. Climatic Change 33:213-234.
Schneider, S. H., S. Semenov, A. Patwardhan, I. Burton, C. Magadza, M. Oppenheimer, A. B. Pittock, A. Rahman, J. B. Smith, A. Suarez, and F. Yamin. 2007. Assessing Key Vulnerabilities and the Risk from Climate Change. Pages (in press) in IPCC, editor. Climate Change 2007: Impacts Adaptation and Vulnerability. Cambridge University Press, Cambridge.
Schneider von Deimling, T., H. Held, A. Ganopolski, and S. Rahmstorf. 2006. Climate sensitivity estimated from ensemble simulations of glacial climate. Climate Dynamics 27:149-163.
Scholze, M., W. Knorr, N. W. Arnell, and I. C. Prentice. 2006. A climate-change risk analysis for world ecosystems. Proceedings of the National Academy of Sciences of the United States of America 103:13116-13120.
Selten, F., M. Kliphuis, and H. Dijkstra. 2003. Transient coupled ensemble climate simulations to study changes in the probability of extreme events. CLIVAR Exchanges 8:11-13.
Selten, F. M., G. Branstator, M. Kliphuis, and H. A. Dijkstra. 2004. Tropical origins for recent and future Northern Hemisphere climate change. Geopgysical Research Letters 31:L21205.
Shackley, S., P. Young, S. Parkinson, and B. Wynne. 1998. Uncertainty, complexity and concepts of good science in climate change modelling: Are GCMs the best tools? Climatic Change 38:159-205.
Slaughter, R. A. 1994. Why we should care for future generations now. Futures 26:1080.Smit, B., O. Pilifosova, I. Burton, B. Challenger, S. Huq, R. J. T. Klein, and G. Yohe. 2001.
Adaptation to Climate Change in the Context of Sustainable Development and Equity. Pages 877-912 in J. J. McCarthy, O. F. Canziani, N. A. Leary, D. J. Dokken, and K. S. White, editors. Climate Change 2001: Impacts, Adaptation, and Vulnerability. Cambridge University Press, Cambridge.
Smith, D. M., S. Cusack, A. W. Colman, C. K. Folland, G. R. Harris, and J. M. Murphy. 2007. Improved Surface Temperature Prediction for the Coming Decade from a Global Climate Model. Science 317:796-799.
Smith, J. B. 1997. Setting priorities for adapting to climate change. Global Environmental Change-Human and Policy Dimensions 7:251-264.
Smits, A., A. M. G. K. Tank, and G. P. Können. 2005. Trends in storminess over the Netherlands, 1962-2002. International Journal of Climatology 25:1331-1344.
Stainforth, D. A., T. Aina, C. Christensen, M. Collins, N. Faull, D. J. Frame, J. A. Kettleborough, S. Knight, A. Martin, J. M. Murphy, C. Piani, D. Sexton, L. A. Smith, R. A. Spicer, A. J. Thorpe, and M. R. Allen. 2005. Uncertainty in predictions of the climate response to rising levels of greenhouse gases. Nature 433:403-406.
Steinmuller, A., and K. Steinmuller. 2004. Wild Cards: Wenn das Unwarscheinliche eintritt. Murmann Verlag, Hamburg.
Stern, N. 2007. The Economics of Climate Change: The Stern Review. Cambridge University Press, Cambridge.
Stone, D. A., and M. R. Allen. 2005. The end-to-end attribution problem: From emissions to impacts. Climatic Change 71:303-318.
Stott, P. A., and J. A. Kettleborough. 2002. Origins and estimates of uncertainty in predictions of twenty- first century temperature rise. Nature 416:723-726.
Stott, P. A., D. A. Stone, and M. R. Allen. 2004. Human contribution to the European heatwave of 2003. Nature 432:610-614.
82
Tebaldi, C., L. O. Mearns, D. Nychka, and R. L. Smith. 2004. Regional probabilities of precipitation change: A Bayesian analysis of multimodel simulations. Geophysical Research Letters 31:L24213.
Tebaldi, C., R. L. Smith, D. Nychka, and L. O. Mearns. 2005. Quantifying uncertainty in projections of regional climate change: A Bayesian approach to the analysis of multi-model ensembles. Journal of Climate:1524-1540.
Titus, J. G., and V. Narayanan. 1996. The risk of sea level rise. Climatic Change 33:151-212.Tol, R. S. J., and A. F. de Vos. 1998. A Bayesian statistical analysis of the enhanced
greenhouse effect. Climatic Change 38:87-112.Tompkins, E. L., and W. N. Adger. 2004. Does adaptive management of natural resources
enhance resilience to climate change. Ecology and Society 9:10.Toth, F. 2000. Decision analysis frameworks. Pages 53-68 in R. K. Pachauri, T. Taniguchi,
and K. Tanaka, editors. Guidance papers on the cross cutting issues of the third assessment report of the IPCC. IPCC, Geneva.
Tsang, F. T., and H. Dowlatabadi. 1995. A Bayesian Technique for Refining the Uncertainty in Global Energy-Model Forecasts. International Journal of Forecasting 11:43-61.
Turnpenny, J. R., A. Haxeltine, and T. O'Riordan. 2004. A scoping study of user needs for integrated assessment of climate change in the UK context: Part 1 of the development of an interactive integrated assessment process. Integrated Assessment:(in press).
UKCIP. 2006. Identifying adaptation options. UK Climate Impacts Programme, Oxford. UNESCO. 2005. The Precautionary Principle. UNESCO World Commission on the Ethics of
Scientific Knowledge (COMEST), Paris. van der Sluijs, J., M. Craye, S. Funtowicz, P. Kloprogge, J. Ravetz, and J. Risbey. 2005a.
Experiences with the NUSAP system for multidimensional uncertainty assessment. Water Science and Technology 52:133-144.
Van der Sluijs, J. P. 1997. Anchoring amid uncertainty; On the management of uncertainties in risk assessment of anthropogenic climate change. Ph.D. Thesis. Universiteit Utrecht, Utrecht.
Van der Sluijs, J. P. 2006. Uncertainty, assumptions, and value commitments in the knowledge-base of complex environmental problems. Pages 67-84 in Â. G. Pereira, S. G. Vaz, and S. Tognetti, editors. Interfaces between Science and Society. Green Leaf Publishing.
van der Sluijs, J. P., M. Craye, S. Funtowicz, P. Kloprogge, J. Ravetz, and J. Risbey. 2005b. Combining quantitative and qualitative measures of uncertainty in model-based environmental assessment: The NUSAP system. Risk Analysis 25:481-492.
van der Sluijs, J. P., P. H. M. Janssen, A. C. Peterson, P. Kloprogge, J. S. Risbey, W. Tuinstra, and J. R. Ravetz. 2004. RIVM/MNP Guidance for Uncertainty Assessment and Communication: Tool Catalogue for Uncertainty Assessment. NWS-E-2004-37, Copernicus Institute & RIVM, Utrecht/Bilthoven.
van der Sluijs, J. P., J. Potting, J. Risbey, D. v. Vuuren, B. d. Vries, A. Beusen, P. Heuberger, S. C. Quintana, S. Funtowicz, P. Kloprogge, D. Nuijten, A. Petersen, and J. Ravetz. 2002. Uncertainty assessment of the IMAGE/TIMER B1 CO2 emissions scenario, using the NUSAP method. Dutch National Research Program on Climate Change, Bilthoven.
van der Sluijs, J. P., and W. Turkenburg. 2006. Climate Change and the Precautionary Principle. Pages 352 in E. Fisher, J. Jones, and R. v. Schomberg, editors. Implementing The Precautionary Principle, Perspectives and Prospects. Edward Elgar Publishing.

83
Van der Veen, C. J., and J. Oerlemans. 1987. Dynamics of the West Antarctic Ice Sheet. inproceedings of a workshop held in Utrecht, May 6-8, 1985. D. Reidel Publishing Company.
Van Drunen, M. A. 2006. Naar een klimaatbestendig Nederland, Samenvatting routeplanner. Pages 32 in, Wageningen.
Van Ierland, E. C., K. d. Bruin, R. B. Dellink, and A. Ruijs. 2007. A qualitative assessment of climate adaptation options and some estimates of adaptation costs. Wageningen Universiteit en Research, Wageningen.
van Ulden, A. P., and G. J. van Oldenborgh. 2006. Large-scale atmospheric circulation biases and changes in global climate model simulations and their importance for climate change in Central Europe. Atmospheric Chemistry and Physics 6:863-881.
van Vuuren, D. P., B. De Vries, A. Beusen, and P. Heuberger. 2007. Uncertainty ranges for the IPCC SRES scenarios: probabilistic estimates conditional on the storyline.(in preparation).
Vaughan, D. G., and J. R. Spouge. 2002. Risk estimation of collapse of the West Antarctic Ice Sheet. Climatic Change 52:65-91.
Vellinga, M., and R. A. Wood. 2002. Global climatic impacts of a collapse of the Atlantic thermohaline circulation. Climatic Change 54:251-267.
Venkatesh, B. N., and B. F. Hobbs. 1999. Analyzing investments for managing Lake Erie levels under climate change uncertainty. Water Resources Research 35:1671-1683.
Veraart, J., P. Opdam, C. Nijburg, B. Makaske, S. Brinkman, F. d. Pater, J. Luttik, J. Meerkerk, H. Leenaers, J. Graveland, M. Wolsink, E. H. Klijn, J. Neuvel, and P. Rietveld. 2006. Quickscan, Kennisaanbod en -leemten in Klimaatbestendigheid, Effecten, adaptatiestrategieën en maatschappelijke inbedding. Wageningen Universiteit en Research.
Villa, F., and H. McLeod. 2002. Environmental vulnerability indicators for environmental planning and decision-making: Guidelines and applications. Environmental Management 29:335-348.
Vincent, K. 2007. Uncertainty in adaptive capacity and the importance of scale. Global Environmental Change 17:12-24.
Visser, H., R. J. M. Folkert, J. Hoekstra, and J. J. De Wolff. 2000. Identifying key sources of uncertainty in climate change projections. Climatic Change 45:421-457.
Vlek, C. 2004. Environmental versus individual risk taking: perception, decision, behaviour. in C. Spielberger, editor. Encyclopedia of Applied Psychology. Academic Press, San Diego.
Vliet, A. J. H. v., A. Overeem, R. S. D. Groot, A. F. G. Jacobs, and F. T. M. Spieksma. 2002. The influence of temperature and climate change on the timing of pollen release in the Netherlands. International Journal of Climatology 22:1757-1767.
Walker, W. E., P. Harremoës, J. Rotmans, J. P. van der Sluijs, M. B. A. van Asselt, P. H. M. Janssen, and M. P. K. von Krauss. 2003. Defining uncertainty: a conceptual basis for uncertainty management in model-based decision support. Integrated Assessment 4 (1),5-17.
Walters, C. 1986. Adaptive Management of Renewable Resources. MacMillan, New York. Warren, R., N. Arnell, R. Nicholls, P. Levy, and J. Price. 2006. Understanding the regional
impacts of climate change. Research report prepared for the Stern Review on the Economics of Climate Change. Working Paper 90, Tyndall Centre for Climate Change Research.
Washington, R., M. Harrison, D. Conway, E. Black, A. Challinor, D. Grimes, R. Jones, A. Morse, G. Kay, and M. Todd. 2006. African climate change - Taking the shorter route. Bulletin of the American Meteorological Society 87:1355-+.
84
Watt, K. E. F., and P. P. Craig. 1986. System Stability Principles. Systems Research 3:191-201.
Webster, M. D., M. Babiker, M. Mayer, J. M. Reilly, J. Harnisch, R. Hyman, M. C. Sarofim, and C. Wang. 2002. Uncertainty in emissions projections for climate models. Atmospheric Environment 36:3659-3670.
Webster, M. D., and A. P. Sokolov. 2000. A methodology for quantifying uncertainty in climate projections. Climatic Change 46:417-446.
Weiss, C. 2003. Scientific Uncertainty and Science-Based Precaution. International Environmental Agreements: Politics, Law and Economics 3:137-166.
Weiss, C. 2006. Can there be science-based precaution? Environmental Research Letters 1:014003.
Werners, S., J. Verhagen, and A. Gerritsen. 2004. Adaptation to Climate Change in the Netherlands: Report prepared for Ministry of Agriculture, Nature and Food Quality. WUR, Wageningen.
Whitehead, P. G., R. L. Wilby, D. Butterfield, and A. J. Wade. 2006. Impacts of climate change on in-stream nitrogen in a lowland chalk stream: An appraisal of adaptation strategies. Science of the Total Environment 365:260-273.
Wigley, T. M. L., and S. C. B. Raper. 2001. Interpretation of high projections for global-mean warming. Science 293:451-454.
Wilby, R. L. 2005. Uncertainty in water resource model parameters used for climate change impact assessment. Hydrological Processes 19:3201-3219.
Wilby, R. L., S. P. Charles, E. Zorita, B. Timball, P. Whetton, and L. O. Mearns. 2004. Guidelines for use of climate scenarios developed from statistical downscaling methods. Intergovernmental Panel on Climate Change.
Wilby, R. L., and I. Harris. 2006. A framework for assessing uncertainties in climate change impacts: Low-flow scenarios for the River Thames, UK. Water Resources Research 42:W02419, doi:02410.01029/02005WR004065.
Wilby, R. L., P. G. Whitehead, A. J. Wade, D. Butterfield, R. J. Davis, and G. Watts. 2006. Integrated modelling of climate change impacts on water resources and quality in a lowland catchment: River Kennet, UK. Journal of Hydrology 330:204-220.
Williams, L. J., D. Shaw, and R. Mendelsohn. 1998. Evaluating GCM output with impact models. Climatic Change 39:111-133.
Willows, R. I., and R. Connell, editors. 2003. Climate adaptation: Risk, Uncertainty and Decision-making. UKCIP, Oxford.
Woodbury, P. B., J. E. Smith, D. A. Weinstein, and J. A. Laurence. 1998. Assessing potential climate change effects on loblolly pine growth: A probabilistic regional modeling approach. Forest Ecology and Management 107:99-116.
World Bank Group, 2006. Managing Climate Risk: Integrating Adaptation into World Bank Group Operations. Global Environment Facility Program, Washington, pp32.
WRR. 2006. Klimaatstrategie - tussen ambitie en realisme (Climate Strategy - Between Ambition And Realism). Amsterdam University Press, Amsterdam.
Yohe, G., N. Andronova, and M. Schlesinger. 2004. Climate - To hedge or not against an uncertain climate. Science 306:416-417.
Yohe, G. W. 1991. Uncertainty, Climate Change and the Economic Value of Information - an Economic Methodology for Evaluating the Timing and Relative Efficacy of Alternative Response to Climate Change with Application to Protecting Developed Property from Greenhouse Induced Sea-Level Rise. Policy Sciences 24:245-269.
Zapert, R., P. S. Gaertner, and J. A. Filar. 1998. Uncertainty propagation within an integrated model of climate change. Energy Economics 20:571-598.

85
Zickfeld, K., A. Levermann, M. Morgan, T. Kuhlbrodt, S. Rahmstorf, and D. Keith. 2007. Expert judgements on the response of the Atlantic meridional overturning circulation to climate change. Climatic Change 82:235-265.
Zwiers, F. W. 2002. Climate change - The 20-year forecast. Nature 416:690-691.

86
App
endi
x 1
Ove
rvie
w o
f ada
ptat
ion
issu
es b
y se
ctor
Non
-exh
aust
ive
inve
ntor
y of
sect
ors o
f soc
iety
and
eco
nom
y w
here
pla
nned
ada
ptat
ion
to c
limat
e ch
ange
may
hav
e ne
t soc
ieta
l ben
efits
, bul
lets
in
all
colu
mns
are
illu
stra
tive
exam
ples
. We
do n
ot p
rete
nd to
pro
vide
a c
ompl
ete
over
view
of r
elev
ant s
ecto
rs, p
aram
eter
s, co
ncer
ns, a
nd
optio
ns.
Impa
ct a
rea/
sect
orA
dapt
to c
hang
es in
: C
once
rns:
A
dapt
atio
n op
tions
W
ater
R
iver
runo
ffSe
a le
vel
Tida
l am
plitu
de
Stor
m su
rges
Su
rfac
e w
ater
le
vel
Soil
moi
stur
e G
roun
d w
ater
ta
bles
Rai
nfal
l pat
tern
s Sa
lt w
ater
in
trusi
on
Inte
nse
prec
ipita
tion
even
tsD
urat
ion
and
freq
uenc
y of
dr
ough
tsW
ater
dem
and
Peak
runo
ff ri
vers
Low
flow
(riv
ers)
Fl
oodi
ngs
Gro
und
wat
er p
ress
ure
Salin
atio
n of
gro
undw
ater
W
ater
shor
tage
Se
curit
y of
drin
king
wat
er
supp
ly
Livi
ng ri
vers
w
ater
stor
age
/ buf
ferin
g flo
od p
rote
ctio
n de
crea
se v
ulne
rabi
lity
of in
fras
truct
ure
in fl
ood
plan
es
flood
insu
ranc
e in
crea
se c
apac
ity to
surv
ive
flood
dis
aste
rs
Emer
genc
y m
anag
emen
t pla
ns
Incr
ease
resi
lienc
e of
wat
er sy
stem

87
Impa
ct a
rea/
sect
orA
dapt
to c
hang
es in
: C
once
rns:
A
dapt
atio
n op
tions
Tr
ansp
ort
Wat
er le
vel i
n riv
ers
Froz
en h
arbo
urs
(afte
r TH
C
colla
pse)
Fo
gFr
eezi
ng ra
in
("ijz
el")
W
indr
egim
e /
Stor
ms
Freq
uenc
y of
st
roke
s of
light
ning
Extre
me
prec
ipita
tion
even
tsSm
og
Low
wat
er in
rive
r ham
pers
in
land
wat
erw
ays s
hipp
ing
Slip
perin
ess /
free
zing
rain
on
road
sFo
g ha
mpe
ring
traff
ic
(Sch
ipho
l, ro
ads,
ship
) Tr
ansp
ort s
afet
y Se
nsiti
vity
of t
rain
syst
em to
w
eath
er (r
ail d
efor
mat
ion
in
heat
wav
es, l
eave
s on
the
rail,
froz
en "
wis
sels
")
Mel
ting
of ta
r-ro
ads o
n ho
t da
ysD
amag
e to
car
s (fr
om h
ail)
Traf
fic re
stric
tions
dur
ing
smog
-ala
rm
desi
gn sh
ips t
hat c
an c
arry
sam
e fr
ight
in sh
allo
w w
ater
In
crea
se re
silie
nce
of tr
ansp
ort s
yste
m
Coa
stal
Zon
e Se
a Le
vel
Coa
stal
Def
ence
St
orm
surg
es
Sand
dyn
amic
s (s
ea fl
oor,
shor
e,
dune
s)W
ind
regi
mes
flood
ings
dam
age
to c
oast
C
oast
al d
efen
se sy
stem
In
crea
se re
silie
nce
of c
oast
al sy
stem

88
Impa
ct a
rea/
sect
orA
dapt
to c
hang
es in
: C
once
rns:
A
dapt
atio
n op
tions
H
uman
Hea
lth
Spre
ad o
f di
seas
esH
eat w
aves
W
eath
erco
nditi
ons
("in
vers
ion"
) tha
t fa
vor s
mog
and
ai
r pol
lutio
n bu
ild-u
p
Hay
feve
r M
orta
lity
durin
g he
at w
aves
Li
me
dise
ase
Men
ingo
ence
falit
is F
MTE
In
cide
ntal
mal
aria
D
engu
eW
eath
er-r
elat
ed m
orta
lity
of
hom
eles
s and
dru
nks
Car
diov
ascu
lar d
isea
ses a
nd
lung
dis
ease
s fro
m sm
og a
nd
air p
ollu
tion
Incr
ease
resi
lienc
e of
hea
lth sy
stem
D
isea
se c
ontro
l pla
ns
Incr
ease
resi
lienc
e of
pop
ulat
ion
to h
ealth
stre
ssor
s
Infr
astru
ctur
e In
tens
epr
ecip
itatio
n ev
ents
Win
d re
gim
e St
orm
inte
nsity
St
orm
freq
uenc
y Fr
eque
ncy
of
stro
kes o
f lig
htni
ngTe
mpe
ratu
re
Floo
ding
Col
laps
e of
flat
-roo
f bu
ildin
gs (a
ccum
ulat
ion
of
snow
and
wat
er)
Cap
acity
pro
blem
s sew
erag
e sy
stem
s
Impr
ove
build
ing
code
A
ctiv
ely
mai
ntai
n co
mpl
ianc
e to
bui
ldin
g co
de
Re-
dim
ensi
on se
wer
age
syst
em
Do
not b
uild
vul
nera
ble
infr
astru
ctur
e in
floo
d pl
anes
In
crea
se re
silie
nce
of in
fras
truct
ure

89
Impa
ct a
rea/
sect
orA
dapt
to c
hang
es in
: C
once
rns:
A
dapt
atio
n op
tions
Sp
atia
l Pla
nnin
g G
eogr
aphi
cal
dist
ribut
ion
of
flood
risk
s
Exce
edin
g flo
od ri
sk
stan
dard
s for
citi
es
Shor
tage
of s
pace
requ
ired
for w
ater
stor
age
and
buff
er
zone
svu
lner
abili
ty o
f cap
ital
stoc
ks (i
ndus
try p
lant
s, bu
ildin
gs, r
oads
) U
rban
hea
t isl
ands
Ran
dsta
d ->
Zan
dsta
d N
ot b
uild
ing
in fl
ood
plan
es
Floo
d re
sist
ant i
nfra
stru
ctur
e In
crea
se re
silie
nce
Nat
ure
Clim
ate
zone
s (s
hifti
ng p
ole-
war
d)Fr
eque
ncy
and
dura
tion
of
drou
ghts
Freq
uenc
y an
d du
ratio
n of
hea
t w
aves
Bio
dive
rsity
Fros
t day
s H
ydro
logy
Leng
th o
f gro
wth
se
ason
Extre
me
wea
ther
ev
ents
Spec
ies E
xtin
ctio
nH
abita
t des
truct
ion
Inva
sive
spec
ies
Fore
st fi
re
Plag
ues,
pest
s, di
seas
es
dist
urbe
d m
igra
tion
of b
irds
"mis
-syn
chro
nisa
tion"
of
spec
ies t
hat d
epen
d on
eac
h ot
her (
e.g.
but
terf
lies -
flo
wer
s; b
irds-
cat
erpi
llars
)
Switc
h to
oth
er sp
ecie
s in
fore
stry
(dro
ught
resi
stan
t, sa
lt re
sist
ant)
Hum
an-a
ctiv
ity-e
xten
sive
buf
fer z
ones
aro
und
natu
re a
reas
R
egul
ar u
pdat
e of
end
ange
red
spec
ies l
ist
Incr
ease
het
erog
enei
tyC
onne
ct fr
agm
ente
d na
ture
are
as, f
acili
tate
spec
ies m
igra
tion
"O
ntpo
lder
ing"
(to
fight
salin
atio
n)
Cha
nge
our p
erce
ptio
n of
nat
ure
"nat
uurb
eeld
" (f
rom
stat
ic to
dy
nam
ic)
Incr
ease
resi
lienc
e of
nat
ure
area
s

90
Impa
ct a
rea/
sect
orA
dapt
to c
hang
es in
: C
once
rns:
A
dapt
atio
n op
tions
A
gric
ultu
reLe
ngth
of g
row
th
seas
onEx
trem
e w
eath
er
even
tsFr
ost d
ays
Dro
ught
sH
eat w
aves
A
ll cl
imat
e co
nditi
ons
rele
vant
for c
rops
Rai
nfal
l flo
odin
g Pl
ague
s, pe
sts,
and
(vet
erin
ary)
dis
ease
s Sa
linat
ion
Dam
age
from
ext
rem
e w
eath
er e
vent
s D
rain
age
prob
lem
s (ro
tting
cr
ops)
Shor
tage
of i
rrig
atio
n w
ater
St
orm
dam
age
Fros
t dam
age
Impr
ove
disc
harg
e ca
paci
ty a
nd d
rain
age
Dro
ught
resi
stan
t cro
ps
Salt
resi
stan
t cro
ps
Fros
t res
ista
nt c
rops
C
hang
es in
agr
icul
tura
l pra
ctic
es
Impr
ove
proc
edur
es fo
r dis
ease
con
trol
Div
ersi
ficat
ion
of c
rops
In
crea
se re
silie
nce
of a
gric
ultu
ral s
yste
m
Fres
h w
ater
supp
lyFr
esh
wat
er
avai
labi
lity
Shor
tage
of d
rinki
ng w
ater
Sh
orta
ge o
f irr
igat
ion
wat
er
Buf
ferin
gN
ew te
chni
ques
for w
ater
pro
duct
ion
Emer
genc
y m
anag
emen
t pla
ns
Incr
ease
resi
lienc
e of
wat
er su
pply
syst
em
Mig
ratio
nN
umbe
r of
envi
ronm
enta
l re
fuge
es
Exce
edin
g of
cap
acity
to
acco
mm
odat
e m
igra
nts
Incr
ease
resi
lienc
e of
soci
al sy
stem
Elec
trici
tyge
nera
tion
Coo
ling
wat
er
avai
labi
lity
Cha
nges
in p
eek
dem
and
Bla
ck o
ut
Cha
nges
in p
erfo
rman
ce o
f w
ind,
sola
r and
hyd
ro e
nerg
y (a
ll cl
imat
e de
pend
ent)
Div
ersi
fy c
oolin
g te
chni
ques
In
crea
se re
silie
nce
of e
nerg
y su
pply
syst
em
Early
war
ning
syst
ems a
nd e
mer
genc
y pl
an fo
r maj
or b
lack
ou
t

91
Appendix 2 Discussion climateprediction.net v.s. KNMI scenarios
This appendix tries to explain why there is a discrepancy between the KNMI scenarios and the CP.net results shown in section 5.2. The KNMI scenarios have no emissions scenarios associated with them. They are based on either a 1 or 2ºC global mean temperature change by 2050, which is derived from five GCMs with an adequate skill in terms of large-scale pressure patterns. The CP.net results also do not have associated emissions scenarios and are more basic in the sense that the simulations comprise of equilibrium experiments at one and two times CO2. Despite being an equilibrium experiment, it is possible to attach a time dimension to the CP.net results by using fast simple climate models such as the ones shown in Figure A.1. These models (Bern-CC and ISAM) show when doubling of CO2 (550ppm) could occur under different SRES emission scenarios in the 21st century.
Figure A.1 Projected CO2 concentrations resulting from six SRES scenarios. The SRES scenarios represent the outcome of different assumptions about the future course of economic development, demography and technological change. Panel (a) shows CO2 emissions for the selected scenarios and panels (b) and (c) show resulting CO2 concentrations as projected by two fast carbon cycle models, Bern-CC and ISAM. The ranges represent effects of different

92
model parametrizations and assumptions. For each model, and each scenario the reference case is shown by a black line, the upper bound (high-CO2 parametrization) is indicated by the top of the coloured area, and the lower bound (low-CO2 parametrization) by the bottom of the coloured area or (where hidden) by a dashed coloured line (IPCC 2001).
While the CP.net experiments are basic compared to transient GCM simulations, they are advanced because of the large number of runs, which allows the quantification of parameter uncertainty in seven physics parameter values of the Hadley Centre model (the threshold of relative humidity for cloud formation, the cloud-to-rain conversion threshold, the cloud-to-rain conversion rate, the ice fall speed, the cloud fraction at saturation and the convection entrainment rate coefficient). This is why it is not straightforward to compare these results with the KNMI scenarios, which are based on deterministic GCM results (i.e., they do not explore parameter uncertainty within one GCM). In order to do as close a comparison as possible between the CP.net results and the KNMI scenarios, Figure A.2 shows seasonal temperature and precipitation change for the Netherlands against global mean temperature change for each simulation of the CP.net results and for the KNMI scenarios (the only relevant results for the KNMI scenarios are those for 1 and 2ºC global mean temperature change). Most noticeable is the absence of global mean temperature changes below 2ºC in the CP.net sample. However, even around 2ºC of global warming the ranges provided by CP.net for changes in the Netherlands are much wider than the KNMI scenarios. We believe this occurs because of the sampling of parameter uncertainty. The skill of the CP.net simulations in representing the large-scale atmospheric features over the Netherlands is unknown because the necessary data is not available, so some of the simulations could be deemed more plausible than others. However, this assumes that models that represent features of the current climate are better are representing future conditions, which in itself is a subjective assumption. In summary, it is difficult to compare the CP.net results with the KNMI scenarios, but the former sample a much wider uncertainty range that should be taken into consideration in adaptation planning.
0
2
4
6
8
10
12
14
0 2 4 6 8 10 12 14
Global temperature change (ºC)
Win
ter t
empe
ratu
re c
hang
e (ºC
)
cp.netKNMIKNMI +
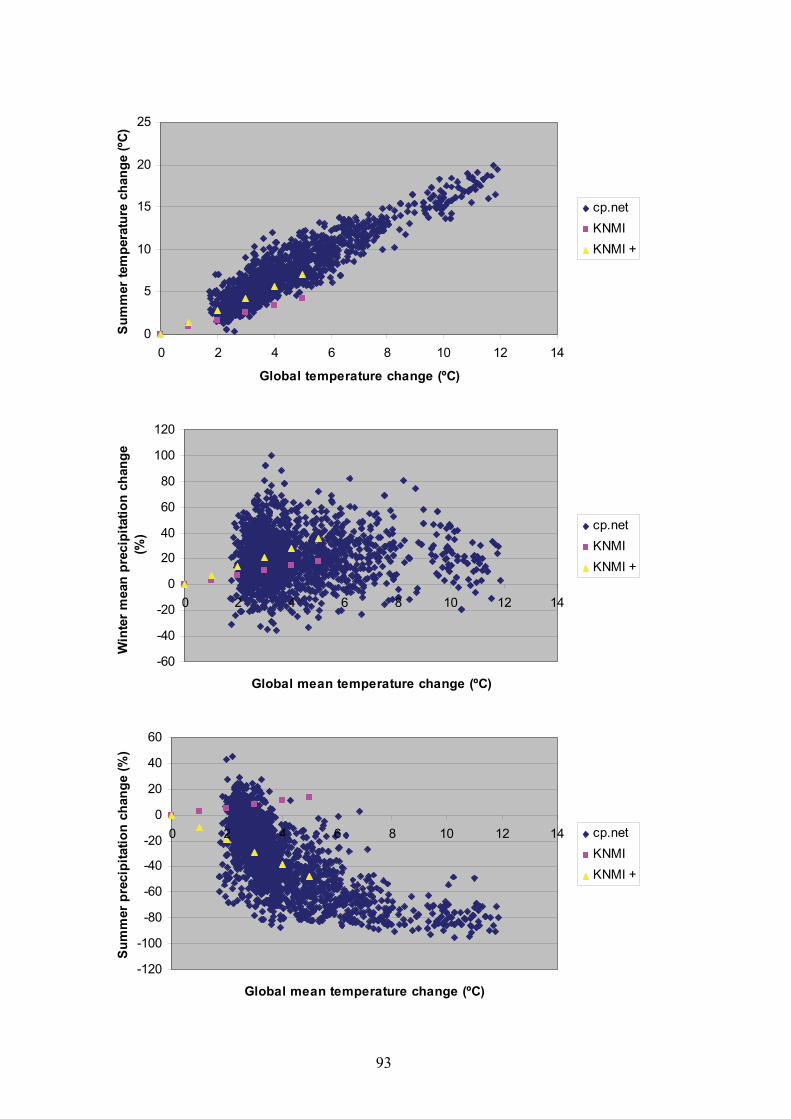
93
0
5
10
15
20
25
0 2 4 6 8 10 12 14
Global temperature change (ºC)
Sum
mer
tem
pera
ture
cha
nge
(ºC)
cp.netKNMIKNMI +
-60
-40
-20
0
20
40
60
80
100
120
0 2 4 6 8 10 12 14
Global mean temperature change (ºC)
Win
ter m
ean
prec
ipita
tion
chan
ge
(%)
cp.netKNMIKNMI +
-120
-100
-80
-60
-40
-20
0
20
40
60
0 2 4 6 8 10 12 14
Global mean temperature change (ºC)
Sum
mer
pre
cipi
tatio
n ch
ange
(%)
cp.netKNMIKNMI +

94
Figure A.2 Seasonal (winter and summer) temperature and precipitation change versus global mean temperature change for each simulation of CP.net and ranges used in the KNMI scenarios.

95
Appendix 3 List of acronyms and abbreviations
AOGCM Atmosphere Ocean General Circulation Model APF Adaptation Policy Framework ARK National Program on Spatial Planning and Adaptation to Climate Change CDF Cumulative (probability) Density Function COP Conference of Parties (to the UNFCC) CP.net climateprediction.net DJF December January February ESPACE European Spatial Planning Adapting to Climate Events EU European Union EZ Netherlands Ministry of Economic Affairs GCM General Circulation Model GHG GreenHouse Gas IMAGE Integrated Model to Assess the Global Environment IPCC Inter Governmental Panel on Climate Change IPO Inter Provinciaal Overleg (umbrella organisation of Netherlands Provinces) JJA June July August KNMI Royal Netherlands Meteorological Institute LNV Netherlands Ministry of Agriculture, Nature and Food Quality MAM March April May MNP Netherlands Environmental Assessment Agency NGO Non Governmental Organisation NL Netherlands NUSAP Numeral Unit Spread Assessment Pedigree PDF Probability Density Function RIKZ National Institute for Coastal and Marine Management RIZA Institute for Inland Water Management and Waste Water Treatment SON September October November SRES Special Report on Emission Scenarios TIMER TARGTES IMAGE Energy Model UK United Kingdom UNDP United Nations Development Programme UNFCCC United Nations Framework Convention on Climate Change V&W Netherlands Ministry of Transport, Public Works and Water Management VNG Vereniging Nederlandse Gemeenten (umbrella organisator of Netherlands municipalities)VROM Netherlands Ministry of Housing, Spatial Planning and the Environment WAIS West Antarctic Ice Sheet WB21 Water Management in the 21st Century (policy document) WRR Netherlands Scientific Council for Government Policy