UNC Diversity Plan Report 2011-2012
49
Committed to a Diverse and Inclusive Campus Community The University of North Carolina at Chapel Hill Diversity and Multicultural Affairs 2011 - 2012
-
Upload
unc-diversity -
Category
Documents
-
view
215 -
download
1
description
Based on the 2006 UNC Diversity Plan and the 2011 Academic Plan, this report is prepared by UNC Diversity and Multicultural Affairs under the direction of Dr. Taffye Benson Clayton, vice provost and chief diversity officer. The Diversity Plan Report compiles data from the UNC Office of Institutional Research and Assessment and reports from units across campus regarding efforts made toward meeting the University's five diversity goals.
Transcript of UNC Diversity Plan Report 2011-2012

Committed to a Diverse and Inclusive Campus Community
The University of North Carolina at Chapel Hill
Diversity and Multicultural Affairs
2011 - 2012

acknowledgement

This report was prepared by
Diversity and Multicultural
Affairs under the direction of
Dr. Taffye Benson Clayton.
We would like to thank all of
the unit administrators and
diversity liaisons for providing
the initial reports from which
this publication was derived.
Special thanks to the Office
of Institutional Research and
Assessment for providing
the institutional data, and
the 2010 University diversity
assessment data.acknowledgement

Diversity is an imperative for today’s
universities to compete on a national and
global level. At DMA, we strive to enrich lives
and to build a better, more inclusive, and more
diverse campus environment. Our commitment
to excellence permeates the Carolina campus
and extends to broader communities.
about: DIVERSITY AND MULTICULTURAL AFFAIRS (DMA)
WEB: unc.edu/diversity
FACEBOOK: facebook.com/DMAUNC
ADDRESS: Diversity and Multicultural Affairs | Campus Box 9125 | South Building Cameron Avenue | The University of North Carolina at Chapel Hill Chapel Hill, NC 27599-9125
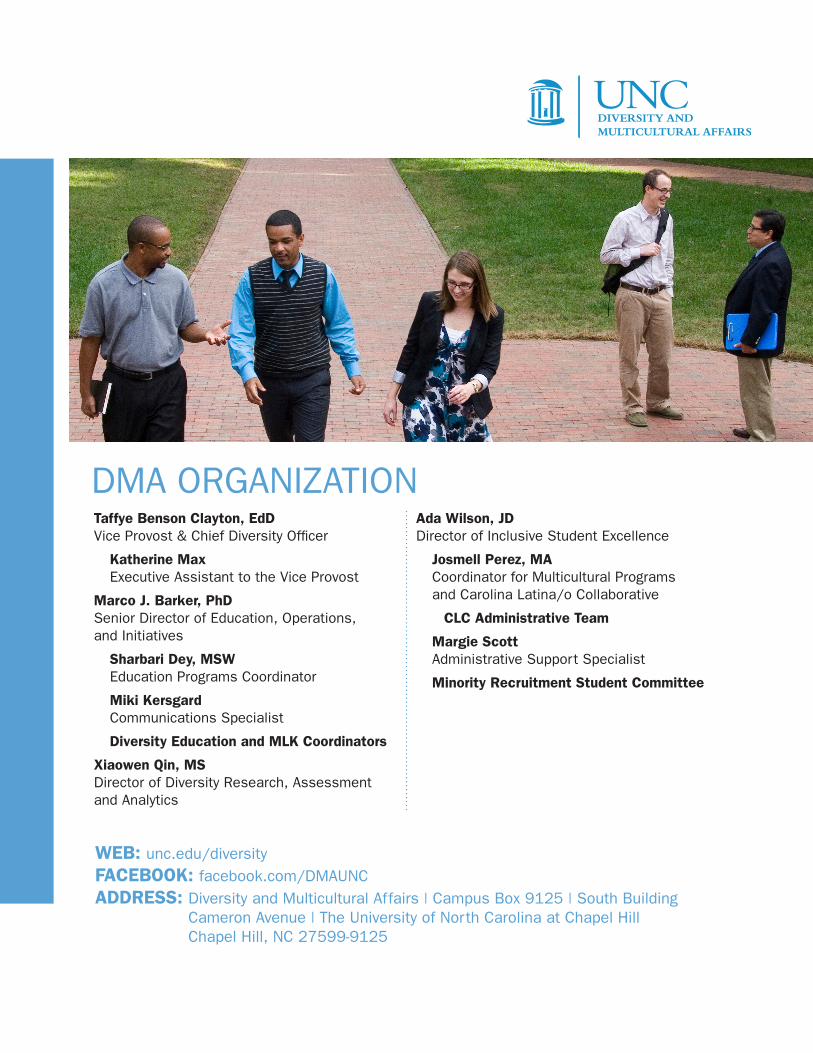
Taffye Benson Clayton, EdDVice Provost & Chief Diversity Officer
Katherine Max Executive Assistant to the Vice Provost
Marco J. Barker, PhDSenior Director of Education, Operations, and Initiatives
Sharbari Dey, MSW Education Programs Coordinator
Miki Kersgard Communications Specialist
Diversity Education and MLK Coordinators
Xiaowen Qin, MSDirector of Diversity Research, Assessment and Analytics
Ada Wilson, JDDirector of Inclusive Student Excellence
Josmell Perez, MA Coordinator for Multicultural Programs
and Carolina Latina/o Collaborative
CLC Administrative Team
Margie Scott Administrative Support Specialist
Minority Recruitment Student Committee
DMA ORGANIZATION

chancellor’sdiversity
statement
The 2011 Academic Plan calls for Carolina to aspire to be an “increasingly inclusive
educational institutions that attracts, retains, and values talented people from all
backgrounds.” The Academic Plan is our roadmap and we place a high value on
diversity in it because we want our faculty, staff and students to excel. We know that
an environment of respect for different perspectives is key to their success. We also
know that effectively addressing big, complex problems in today’s society requires
a wide variety of perspectives and experiences at the table.
In this year’s report we learn about the areas where we have made progress and
areas for further improvement. The report provides recommendations about key
areas that require our attention and action.
A commitment to attracting a diverse group of people, while important, is not
enough. Diversity alone does not ensure a community that values student well-
being, respect for different perspectives, and a passion for excellence in research.
So we are committed to making sure that we have a welcoming and inclusive
campus community.
The staff of the Office of Diversity and Multicultural Affairs is responsible for helping
us implement our plans and meet these goals. I commend Dr. Taffye Benson Clayton
and her colleagues for their dedication on behalf of the entire Carolina community.
Sincerely,
APRIL 2013
HOLDEN THORPCHANCELLOR

This report is the fourth report describing Carolina’s state of diversity. It builds on the diversity plan reports submitted by the academic and administrative units in 2012, institutional data pertaining to the gender and racial/ethnic diversity of the campus community, undergraduate students’ completion and persistence data for gender and racial/ethnic groups, and the recruiting and retention outcomes of faculty and EPA staff.
The majority of the academic and administrative units continued to make concerted efforts to improve diversification of students, faculty and staff. Carolina has made continuous improvement in recruiting and enrolling minority students, particularly Hispanic and Asian students, but students’ academic achievement in terms of completion and persistence between gender and racial/ethnic groups vary remarkably. In contrast to the student population, faculty and staff populations did not make noticeable improvements in the area of racial/ethnic diversity. Efforts were made to recruit and hire minority faculty and EPA staff; however, the University lost a similar amount of minority faculty, and EPA staff within the same period of time, resulting in little improvements in increasing faculty and EPA staff racial/ethnic diversity.
In 2010, Carolina conducted its second diversity assessment. There was over 92 percent agreement in responses from student, faculty, and staff that the campus community was well aware of the University’s commitment to diversity. The majority of the respondents agreed that the University demonstrated a commitment to respecting differences of opinion. Approximately 70 percent of the respondents felt that they were valued by the University. However, African American and Hawaiian/Pacific Islander student and faculty respondents, as well as American Indian faculty respondents were much more likely to experience situations in which they felt marginalized at the University. These minority faculty respondents were also more likely to disagree with the statements that the “tenure and promotion processes in the University were free from bias based on personal characteristics”, and “retention efforts in the University reflect a commitment to maintaining a diverse faculty”.
Compared to the previous unit reports, more reporting units engaged in diversity education and training. Schools incorporated or highlighted diversity content in their courses. Administrative units offered, and in some instances required various diversity training programs and seminars such as Safe Zone to their students and staff. The Office of the Vice Chancellor for Finance and Administration required all their employees to complete diversity training.
EXECUTIVESUMMARY

Units utilized assessment in measuring diversity efforts. Units noted how assessment assisted with measuring diversity training outcomes and enhanced cultural knowledge. Units reported how research on promising practices assisted with making gains in recruiting students, faculty and staff from underrepresented groups, and improving workplace climate. Some units initiated programs or published data based on results from diversity assessment.
Units conducted diversity related research and secured funds to support diversity related research. For instance, the Center for Civil Rights conducted research on the impact of diversity on K-12 education, and the Office of Undergraduate Research received funds from the Howard Hughes Medical Foundation to support the HHMI Undergraduate Research for Future Scientists and Clinicians (HHMI-FSC) program. This program empowers high-ability Carolina Covenant Scholars to undertake original research under the supervision of research-active faculty, graduate students, and postdoctoral mentors. The Office of Undergraduate Education published papers on how Undergraduate Education’s academic interventions have served students with diverse needs.
Units noted the diversity goals and metrics undertaken to address diversity in the reports. However, there is a lack of alignment of the goals and metrics. In addition, formative evaluation or assessment on units’ goals and objectives were missing in most of the units reports. Without formative assessment, it is difficult to determine to what extent goals/objectives stated in the reports have been achieved. Assessment is a systematic process involving planning, assessing, and using the results. The current plan report template itself may not be structured in a way that allows the campus’ units to incorporate planning, assessing and using the results in the report systematically.
On the basis of our analysis, we recommend:
• Building an assessment mechanism, that incorporates setting achievable diversity goals/objectives (short term) and measurable expected outcomes in the planning phase. The assessment mechanism should be part of a retooled process that also incorporates conducting self-evaluation of the actual outcomes. Additionally, the use of a revised reporting template to capture self-evaluation results in the reporting phase can help to measure success and improve efforts in a more effective and systematic way.
• Increasing resources to enhance academic support to minority students and to evaluate the effectiveness of existing programs or initiatives focused on student retention and academic support.
• Developing an institutional plan and strategy to effectively recruit and retain faculty from targeted minority populations.
EXECUTIVE SUMMARY

The University’s Diversity Goals resulted from 2005 diversity assessment conducted by the Chancellor’s Task Force on Diversity and have served as the foundation of UNC-CH’s diversity plan since August 2006.
To achieve a diverse and inclusive campus community, Carolina established five common goals for aligning and assessing diversity across the campus:
INTRODUCTION
GOAL 1
GOAL 2
GOAL 4
GOAL 5
GOAL 3
Clearly define and publicize the University’s commitment to diversity.
Achieve the critical masses of underrepresented populations necessary to ensure the educational benefits of diversity in faculty, staff, students and executive, administrative and managerial positions.
Create and sustain a climate in which respectful discussions of diversity are encouraged and take leadership in creating opportunities for interaction and cross group learning.
Support further research to advance the University’s commitment to diversity and to assess the ways in which diversity advances the University’s mission.
Make high quality diversity education, orientation, and training available to all members of the university community.
DIVERSITY AT CAROLINA WEAVES A RICH TAPESTRY OF TALENT, CULTURE,
INTELLECT, AND INQUIRY. THE TERM “DIVERSITY” ITSELF INVOKES DIFFERENT
IMAGES AND PERCEPTIONS DEPENDING ON INDIVIDUAL EXPERIENCES, OUTLOOK,
AND DEMOGRAPHIC CHARACTERISTICS. DIVERSITY AT CAROLINA IS EXPLORED IN
VARIOUS WAYS: DIVERSITY OF PRESENCE, COMMITMENT TO DIVERSITY, DIVERSITY
EDUCATION, INCLUSIVE CLIMATE, AND DIVERSITY RESEARCH.

The term “presence” is used to refer to the individual demographics and characteristics of members of the campus community, such as, but not limited to race, ethnicity, gender, sexual orientation, gender identity or expression, religion, creed, national origin, political philosophy, age, disability status, veteran status and socioeconomic status. Although all these characteristics are important, consistent with tradition, this report mainly focuses on diversity pertaining to gender, race/ethnicity and historically underserved student populations. In subsequent years, with the benefit of additional assessment tools and data, there will be a broader and more inclusive report of the state of diversity on our campus.
Commitment is defined as the public acknowledgement of the University’s commitment to diversity; Diversity Education refers to the opportunity to access diversity education programs and training; and Inclusive Climate represents the extent to which the campus community acknowledges, encourages, and supports all of its members – faculty, staff and students.
We consider “research” to encompass every unit’s self-reported assessments on diversity climate, efforts to conduct sessions on diversity issues, and units’ research on promising practices to recruit and retain underrepresented students, faculty, and staff, and to better promote academic success among students, particularly underserved students.
DIVERSITYRESEARCH:
DIVERSITYOF PRESENCE:
COMMITMENT TODIVERSITY, DIVERSITY EDUCATIONAND INCLUSIVE CLIMATE:

This report serves as a summary of
the diversity presence among students,
faculty, and staff, the leadership team,
particularly among underrepresented
populations. This report does not attempt
to highlight all activities, programs, and
initiatives on our campus that address
diversity, but provides a compilation of
the efforts of various campus academic
and administrative units. In addition,
the report will provide an analysis of
and commentary about data regarding
diversity presence and units’ diversity
plan reports. Finally, this report will make
suggestions for amelioration of the most
persistent difficulties and challenges.
DIVERSITYPLAN REPORT
1

Student Diversity: Diversification in Enrollment
Progress in achieving student diversity in enrollment was found in both undergraduate and graduate/professional student enrollment, particularly in Hispanic and Asian student enrollment.
In fall 2011, slightly over 66 percent of the undergraduate students were white, and 28.3 percent were African American, American Indian, and Hispanic. Students with two or more races and who did not report their race/ethnicity made up 5.5 percent of the total undergraduate student body. Among graduate and professional students, 63 percent were white, while African American, Asian, and Hispanic students accounted for 25.2 percent. There were 4.5 percent graduate and professional students with more than one race and 6.9 percent did not report their race and ethnicity. The presence of American Indian students and Hawaiian Native students was below one percent for both student populations.
Female students exceeded male students by about 16.5 percent for both undergraduate and graduate and professional student bodies. In fact, these two groups had almost identical gender breakdowns. Please refer to Graph 1 for more detailed information.
Graph 1. 2011 Student Diversity by Race/Ethnicity and Gender
Data source: Data is provided by the Office of Institutional Research and Assessment.
In addition to student diversity in the 2011-2012 academic year, we also examined the changes of student diversity in race/ethnicity and gender for the past five years (from 2007 to 2011). Graph 2 presents the breakdown of undergraduate enrollment by race/ethnicity from fall 2007 to fall 2011.
Diversity of PresenceSection 1:
In the 2011-2012 academic year, thirty (30) academic and administrative
units submitted diversity plan reports. Among them, ninety-seven percent
(29 out of 30) reported efforts and actions for increasing racial, ethnic and
gender compositional diversity on campus. (Goal 2). Since the inception
of the Diversity Plan, Goal 2 has been the goal most often chosen as a
priority by both academic and administrative units. Section 1 will present the
diversity of our students, faculty, and staff, as well as activities reported by
the various campus units to address Goal 2.
2

SECTION 1
Graph 2. 2007-2011 Undergraduate Diversity by Race/Ethnicity
Data source: Data is provided by the Office of Institutional Research and Assessment.
As revealed by Graph 2, UNC has experienced an overall, steady increase in minority and underrepresented student enrollment over the past five years. While enrollment rates of African American and American Indian students have not changed significantly, Hispanic and Asian student enrollment has grown over the past five years. We have combined the Hawaiian Native, Two or More Races and Race/Ethnicity Unknown categories into the category “Other” for the 2011 data to remain in consistent categories from previous years.
Graph 3. Graduate/Professional Race/Ethnicity Diversity
Data source: Data is provided by the Office of Institutional Research and Assessment.
3
SECTION 1
Graduate and professional student enrollment mirrored the growth of undergraduate student enrollment. Again, there were no significant changes for African American and American Indian categories, but Asian and Hispanic student enrollment continued to grow. Other ethnic/minority populations experienced a rapid increase, which may be explained by the increase in students self-reporting as more than one races/ethnicity or not reporting their race/ethnicity. The Other group breakdown for the 2011 data is presented in Graph 1.
Comparing the undergraduate and graduate/professional student five-year enrollment rates, we see that both undergraduate and graduate/professional populations had somewhat similar enrollment trends for white and American Indian students, but undergraduate programs had relatively higher enrollment for African Americans.
The gender diversity for both undergraduate and graduate/professional student populations remained consistent over the five years (Table 1). Female students exceeded male students by over 16 percent.
Table 1. Student Gender Breakdowns from 2007-2011
Year
Undergraduate Graduate/Professional
Male Female Male Female
2007 41.3 58.7 41.5 58.5
2008 41.5 58.5 41.3 58.7
2009 41.0 59.0 40.7 59.3
2010 41.1 58.9 41.1 58.9
2011 41.8 58.2 41.7 58.3
Data source: Data is provided by the Office of Institutional Research and Assessment.
A majority of units on campus continued to identify Goal 2 as a priority, and some units reported their efforts to secure funding to support programs, for example, Carolina First, and Carolina Student Transfer Excellence Program, that focused on recruiting underrepresented, underserved or low family income students. Overall, data indicates that Carolina has made gains in increasing the presence of underrepresented and historically underserved populations in the student body.
Actions Reported to Achieve Student Diversity
School of DentistryThe School of Dentistry continues to be on the forefront for the number of minority students enrolled at a predominately white dental school. Currently, the School is tied for the 3rd for the most African American students enrolled in a dental school. The #1 and #2 dental schools were Howard and Meharry, two historically black institutions. Members of the Admissions team regularly participate in recruiting fairs held specifically to recruit under-represented minority (URM) students. In an effort to reduce “access to education” challenges that many students of color face, the School increased the amount of scholarship money specifically designated for incoming URM dental students.
Gillings School of Public HealthThis school’s development staff secured funding for several endowed scholarships as well as additional expendable funds for student scholarships. The School has framed these as being especially for diverse and underserved students.
4

SECTION 1
Office of Undergraduate Admissions (OUA)OUA sought and received grant funding to hold Carolina Firsts, a special recruitment program that focuses on first-generation students, and to increase the number of partner community colleges in the Carolina Student Transfer Excellence Program (C-STEP). C-STEP recruits talented low- to moderate-income students to Carolina by guaranteeing their admission provided they complete the program and earn an appropriate associate’s degree. Among first-year students who enrolled last fall, 18 percent were first-generation college students, 12 percent were Carolina Covenant Scholars. Among those enrolled, there were 2 percent international students, two percent as American Indian or Alaska Native students, 11 percent as African American; 7 percent as Latino or Latina; and 12 percent as Asian American or Pacific Islander. Among transfer students enrolled last fall, 24 percent were first-generation college students, and 12 percent were Covenant Scholars.
Office of Scholarships and Student AidThe Office of Scholarships and Student Aid continued to promote the C-Step program and provide resources for new and current C-Step students. This Office partners with C-Step to recruit and successfully transfer to Chapel Hill students who attend Wake Technical Community College, Alamance Community College, Carteret Community College, Central Carolina Community College, Craven Community College, Fayetteville Technical Community College or Durham Technical Community College and who are at, or below, 300 percent of the federal poverty guidelines. The Office continued to conduct on-site visits and provided financial aid workshops specifically designed to help C-Step students make the transition from financing a community college education to planning and budgeting for a four-year, public university education.
Diversity and Multicultural Affairs (DMA)DMA conducted outreach and recruitment programs for underserved student populations. Project Uplift, High School Honor Days, UNC Scholar Days, Native American Recruitment, Hispanic/Latino Recruitment, and NC Renaissance were planned, organized and implemented by the DMA staff.
School of EducationAs part of the Recruitment Day, the School’s Teaching Fellows program invited minority regional finalists and their parents for a campus visit to learn more about the program and hear minority upperclassmen describe the experience of being a minority student at UNC-CH. Another means of recruiting minority students is through Licensure-Only and Lateral-Entry efforts. These programs offer late afternoon and online classes which provide flexibility for diverse non-traditional candidates. The School worked with the NC Community College System, the Carolina Student Transfer Excellence Program (C-STEP), and Carolina Covenant administrators to encourage more students from low and moderate income homes to attend UNC-CH as junior transfers and graduate debt-free.
The Graduate SchoolIn collaboration with the Provost’s office, The Graduate School contributes travel funds to bring applicants from underrepresented populations (including women in the physical sciences) to campus for recruitment visits. Nine different academic programs utilized diversity travel awards from The Graduate School during 2010-2011 to bring applicants from underrepresented groups to campus. Approximately 50 percent of the prospective students who received these awards to visit the campus matriculated in fall 2011.
5

SECTION 1
School of Journalism and Mass CommunicationThe School continues seeking and expanding opportunities to increase minority and underrepresented students in graduate programs. The School also plans to further evaluate factors affecting minority applicant selections for graduate programs.
Kenan-Flagler Business SchoolEnhanced recruiting and programming efforts have been made to increase the pool of qualified female applicants and students to the full-time MBA program. A number of activities occurred in an effort to increase female enrollment in the full-time MBA program. Five receptions were held for women in major cities with the greatest applicant volume potential: New York, Washington D.C., Atlanta, Los Angeles and San Francisco. In addition, the MBA program exhibited at ten Forte receptions held in nine major cities. The Forte receptions were hosted by the Forte Foundation, a consortium of major corporations and top business schools aimed at increasing the number of women in business.
School of PharmacySeventeen percent of current students were admitted into the School of Pharmacy from minority serving institutions. The following represent the total number of students that participated in the School of Pharmacy programs and were admitted: 1) 103 from Leadership Excellence and Development Program (LEAD), 2) 100 from PCAT Review, 3) 43 from pipeline programs, and 4) 7 from Carolina Pre-Pharmacy Club.
School of MedicineThe School of Medicine created two new pipeline programs, modeled after the MED program, to increase diversity recruitment — one to retain the best medical students and one to recruit the best post-graduate trainees.
School of Social WorkAs a part of the School of Social Work’s 5-year plan, additional outreach communication from students and faculty of color for highly competitive diverse doctoral applicants continued. Efforts included professional networking at national conferences and personal communications encouraging candidates to apply. Evaluations show an increase in applications from students of color to the doctoral program as compared to the previous year. As an additional benefit, the School has accepted more students of color this year than last.
Student Diversity: Persistence and Completion
Undergraduates’ 6-year graduation rates for fall cohorts of 2004, 2005, 2006 and 2007 were stable, but the gap in graduation rates between gender, and racial/ethnic groups was significant.
Units reported efforts to not only increase student diversity, but also to assist the students of racially and ethnically underrepresented groups or from low income families to succeed at the University. Student retention rates and graduation rates are two key indicators of an institution’s success. We examined the University undergraduate graduation and retention data and paid special attention to the graduation and attrition rates of students. Attrition rates are another way to examine graduation rates. Attrition means a deduction in number as a result of transfers, and dropouts. The attrition rate in this report is the average of attrition rate of students from a specific cohort who left the University without getting a degree. A cohort here includes only those who were first-time, first-year students who entered the University in a fall semester or the previous summer. There is a relationship between the attrition rate and graduation and retention rates. The higher the attrition rate, the lower the graduation rate or retention rate.
6

SECTION 1
In Table 2, the time-to-degree and attrition rates were presented for the fall 2004, 2005, 2006 and 2007 cohorts separately. In Tables 3, 4, and 5, the attrition rate presented is based on the average attrition rates of the students from the fall 2004, 2005, 2006 and 2007 cohorts who left the University without getting a degree. It is possible that the numbers in the tables may not sum to 100 percent as those students who graduated in a period longer than six years were not included. One thing to be noted here is that the graduation rates presented in tables 3, 4, and 5 are the average rates of the four undergraduate cohorts (cohort 2004, 2005, 2006 and 2007), and the impact of the units’ efforts and actions presented above may merge until several years later.
As indicated in Table 2, 6-year graduation rate between 2004 and 2007 cohorts were stable. Numbers in Table 3 show that American Indian undergraduates have the lowest four-year graduation rate and the highest attrition rate, which is more than three times higher than white and Asian undergraduates. The four-year graduation rate of African American undergraduates is the second lowest among all groups and the attrition rate is almost double white or Asian students.
Table 2. Undergraduate Time to Degree and Attrition Rate for Cohort 2004, 2005, 2006, 2007
Term
4 Years or Less
5 Years 6 Years 7 Years or More
Attrition Rate Total
% % % % % N
Fall 2004 75.95 87.36 89.51 90.60 9.40 3584
Fall 2005 77.13 88.28 89.65 90.29 9.71 3747
Fall 2006 77.02 87.77 89.51 89.67 10.33 3795
Fall 2007 81.08 88.62 89.37 89.37 10.63 3875
Data source: Data is provided by the Office of Institutional Research and Assessment.
Table 3. Undergraduate Average Time to Degree of Cohorts 2004, 2005, 2006, 2007 and Attrition Rate by Race/Ethnicity
Race/Ethnicity 4 Years or Less 5 Years 6 Years Attrition Rate Total N
Race Unknown 81.78 89.27 90.54 9.04 708
White 79.99 89.60 90.99 8.76 10634
Asian 76.68 88.20 89.90 8.85 1119
Hispanic 72.55 84.17 85.71 13.03 714
African American 67.10 80.62 82.57 16.48 1687
American Indian 60.43 69.06 71.22 28.06 139
Data source: Data is provided by the Office of Institutional Research and Assessment.
Table 4 compares the four-year graduation and attrition rates between female and male undergraduate students. The data in the table indicates that female students tend to graduate quicker than male students for almost all the racial/ethnic undergraduates except American Indian female students. The African American female’s four-year graduation rate is nearly 18 percent higher than their male counterparts. In terms of attrition, the African American female attrition rate is approximately 10 percent lower than the African American male rate. In contrast, Hispanic females’ four-year graduation and attrition rates are higher than that of Hispanic males.
7

SECTION 1
Table 4. Undergraduate 4-Year Graduation Rate and Attrition Rate Comparison by Gender and Race/Ethnicity
Race/Ethnicity
Graduation Rate (4 Years or Less)
4-Year Rate Diff. Between
M&F
Attrition Rate Attrition Rate Diff. Between
M&F
Total N
Female Male Female Male
White 83.19 75.43 7.76 7.48 10.6 -3.12 10634
African American
73.07 55.16 17.91 13.16 23.13 -9.97 1687
American Indian
59.6 62.5 -2.9 27.27 30 -2.73 139
Asian 79.87 72.46 7.41 7.08 11.18 -4.1 1119
Hispanic 74.41 69.79 4.62 13.15 12.85 0.3 714
Race Unknown
83.15 79.38 3.77 9.09 8.95 0.14 708
Data source: Data is provided by the Office of Institutional Research and Assessment.
Many units reported their efforts to recruit first-generation students and students from low-income families. According to the National Center for Educational Statistics (NCES) Statistical Analysis Report (1998), the first-generation students are defined as “undergraduates whose parents never enrolled in postsecondary education”. The authors of the NCES Report pointed out that “first-generation students persisted in postsecondary education and attained credentials at lower rates than their non-first-generation counterparts”. “Even when controlling for many of the characteristics that distinguished them from their peers, such as socioeconomic status, institution type, and attendance status, first-generation student status still had a negative effect on persistence and attainment” (Nuzez & Cuccaro-Alamin, 1998, IV).
Table 5 compared the graduation and attrition rates between the first-generation and non-first-generation undergraduates, and between African American male and African American male Covenant Scholars. When we compare the four-year graduation rate between first-generation and non-first-generation students (Table 5), we found that 10 percent more non-first-generation students attained their degrees in four years or less, compared to their first-generation peers. Furthermore, the attrition rate of first-generation students is nearly twice as high as their non-first-generation counterparts, which is consistent with national trends (NCES 98-082).
Covenant Scholars are a special group of students who are from low-income-status families. Low income is defined at or below 200 percent of the federal poverty level. Carolina has committed to support this group of students with grants, scholarships and/or federal work study to ensure they complete their education debt free and with mentors to ensure they are connected with the University.
As data in Table 5 shows, on average, African American male Covenant scholars’ 4-year graduation rate is slightly over 5 percent higher than their non-covenant scholar counterparts and their attrition rate is also lower by 3.5 percent.
8
SECTION 1
Table 5. Covenant Scholars and First Generation College Students Average Time to Degree for the 2004-2007 Cohorts
Demographic 4 Years or Less 5 Years 6 Years Attrition Rate Total N
First-Generation 69.40 81.02 82.77 16.46 2624
Non-First-Generation 79.63 89.50 90.93 8.67 12377
African American (Male) 54.05 71.40 74.77 23.87 444
African American Covenant Scholars (Male)
59.32 78.81 78.81 20.34 118
Data source: Data is provided by the Office of Institutional Research and Assessment.
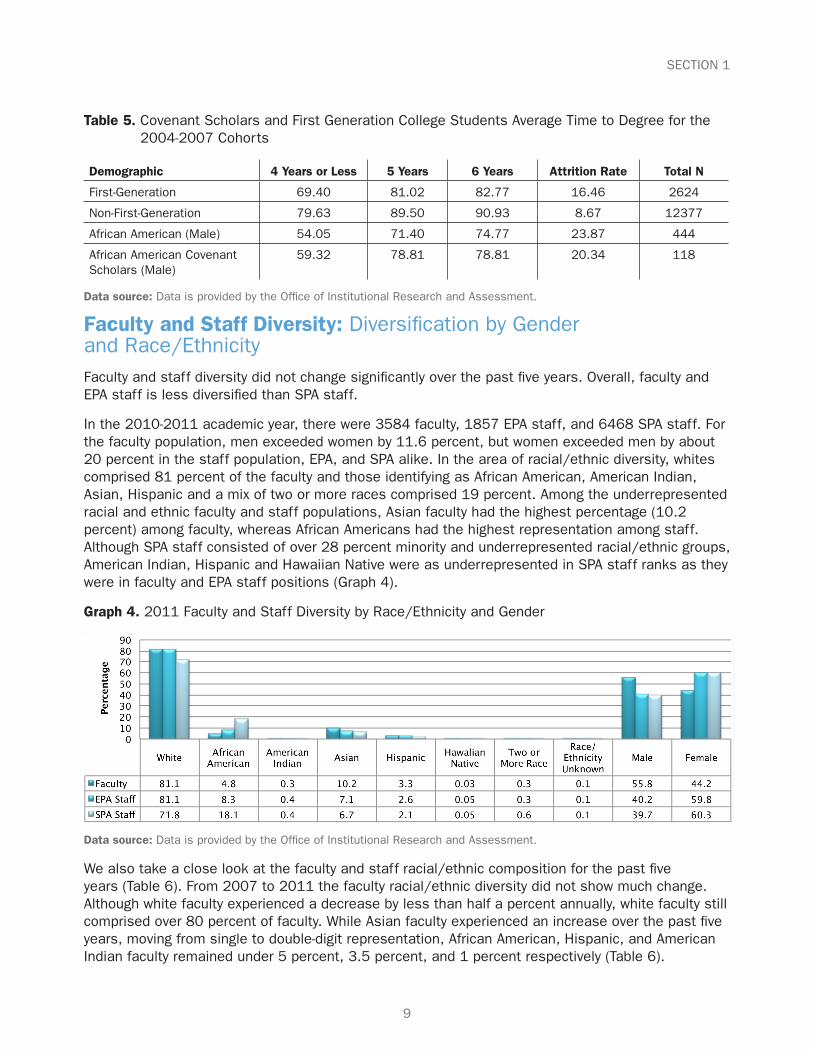
Faculty and Staff Diversity: Diversification by Gender and Race/Ethnicity
Faculty and staff diversity did not change significantly over the past five years. Overall, faculty and EPA staff is less diversified than SPA staff.
In the 2010-2011 academic year, there were 3584 faculty, 1857 EPA staff, and 6468 SPA staff. For the faculty population, men exceeded women by 11.6 percent, but women exceeded men by about 20 percent in the staff population, EPA, and SPA alike. In the area of racial/ethnic diversity, whites comprised 81 percent of the faculty and those identifying as African American, American Indian, Asian, Hispanic and a mix of two or more races comprised 19 percent. Among the underrepresented racial and ethnic faculty and staff populations, Asian faculty had the highest percentage (10.2 percent) among faculty, whereas African Americans had the highest representation among staff. Although SPA staff consisted of over 28 percent minority and underrepresented racial/ethnic groups, American Indian, Hispanic and Hawaiian Native were as underrepresented in SPA staff ranks as they were in faculty and EPA staff positions (Graph 4).
Graph 4. 2011 Faculty and Staff Diversity by Race/Ethnicity and Gender
Data source: Data is provided by the Office of Institutional Research and Assessment.
We also take a close look at the faculty and staff racial/ethnic composition for the past five years (Table 6). From 2007 to 2011 the faculty racial/ethnic diversity did not show much change. Although white faculty experienced a decrease by less than half a percent annually, white faculty still comprised over 80 percent of faculty. While Asian faculty experienced an increase over the past five years, moving from single to double-digit representation, African American, Hispanic, and American Indian faculty remained under 5 percent, 3.5 percent, and 1 percent respectively (Table 6).
9

SECTION 1
Table 6. Faculty Racial/Ethnic Diversity from 2007-2011
Year White African American
American Indian
Asian Hispanic Other
2007 83.26 4.34 0.27 8.88 3.25 0
2008 82.41 4.72 0.26 9.39 3.13 0.09
2009 81.86 4.65 0.37 9.64 3.25 0.23
2010 81.70 4.60 0.30 9.70 3.20 0.45
2011 81.05 4.80 0.28 10.18 3.26 0.42
Data source: Data is provided by the Office of Institutional Research and Assessment.
Similar to faculty data, all staff (EPA and SPA) racial/ethnic diversity from 2007 to 2011 did not show remarkable change. Data in Table 7 indicates little movement in white and American Indian staff, but slight improvement in Asian and Hispanic staff except in 2011 for Asian staff. Although African American staff had much higher representation, its representation decreased gradually between 2007 and 2011.
Table 7. Staff (EPA & SPA) Racial/Ethnic Diversity from 2007-2011
Year White African American
American Indian
Asian Hispanic Other
2007 73.86 17.57 0.34 6.24 1.74 0.25
2008 74.02 16.99 0.38 6.49 1.82 0.30
2009 74.26 16.48 0.39 6.73 1.85 0.30
2010 73.83 16.02 0.40 6.87 2.11 0.77
2011 73.91 15.94 0.41 6.81 2.22 0.71
Data source: Data is provided by the Office of Institutional Research and Assessment.
In the area of gender diversity, Table 8 indicates how gender diversity remained relatively consistent for both faculty and staff. On average, male faculty representation exceeded female faculty representation by approximately 13 percent, while female staff exceeded male staff by roughly 20 percent.
Table 8. Faculty and Staff Gender Breakdowns from 2007-2011
Year Faculty Staff
Male Female Male Female
% % % %
2007 57.3 42.7 39.4 60.6
2008 56.7 43.3 39.9 60.2
2009 56.6 43.4 39.9 60.1
2010 56.5 43.5 40.2 59.8
2011 55.8 44.2 39.8 60.2
Data source: Data is provided by the Office of Institutional Research and Assessment.
10

SECTION 1
University Leadership Team Diversity
Table 9. 2011 University Leadership Team Diversity by Gender & Race/Ethnicity
Position Total Female Male African American
Hispanic White Hawaiian Native
Chancellor 1 0 1 0 0 1 0
Provost 1 0 1 0 0 1 0
Vice Chancellors
7 3 4 2 0 5 0
Associate Vice Chancellors
15 7 8 1 1 13 0
Associate Provosts
5 3 2 1 0 4 0
Deans 15 6 9 0 0 15 0
Associate Deans
26 15 11 1 0 24 1
Total N 70 34 36 5 1 63 1
% 46.58 49.32 6.85 1.37 86.3 1.37
Data source: Data is provided by the Office of Institutional Research and Assessment.
While there have not been remarkable changes in overall faculty and staff racial/ethnic diversity over the past five years, there has been some variation at the unit level. Tables 10 and 11 below highlight the academic and administrative units whose diversification make-up was somewhat different from, or better than the University average.
Table 10. 2011 Faculty Diversity by Race/Ethnicity at Selected Unit Level
Department
White African American
American Indian
Asian Hispanic Two or More Races
Total
% % % % % % N
College of Arts & Sciences
78.60 5.70 0.60 9.20 5.70 0.20 984
School of Education
79.20 11.30 1.90 5.70 1.90 53
School of Dentistry
73.80 4.70 14.00 7.50 107
Centers and Institutes
57.10 28.60 14.30 7
Data source: Data is provided by the Office of Institutional Research and Assessment.
11

SECTION 1
Table 11. 2011 Staff Diversity by Race/Ethnicity at Selected Unit Level
Department
White African American
American Indian
Asian Hispanic Hawaiian Native
Two or More Races
Race/Ethnicity Unknown
Total
% % % % % % % % N
School of Law 70.2 19.0 2.4 3.6 2.4 1.2 1.2 84
School of Social Work
71.7 23.9 4.3 46
School of Dentistry
71.1 20.2 0.7 3.6 2.9 0.7 0.7 277
School of Medicine
74.3 12.8 0.3 9.4 2.6 0.4 0.1 2,186
School of Nursing
73.0 8.8 0.8 6.1 5.0 3.6 2.8 363
School of Pharmacy
71.3 9.6 1.1 16.0 2.1 94
Office of the Provost
68.0 25.1 4.4 1.5 1.0 203
Finance & Administration
60.4 26.6 0.3 9.8 2.3 0.4 0.2 1,592
Student Affairs 70.7 21.2 4.0 3.3 0.7 273
Data source: Data is provided by the Office of Institutional Research and Assessment.
Many units continued to make concerted efforts to recruit and retain faculty and staff from underrepresented groups. The following are some of the actions, and strategies reported by the units to increase faculty and staff diversity.
Actions Reported to Achieve Faculty and Staff Diversity
Student AffairsPosition descriptions are broadly circulated internally and externally to leverage networks to foster a diverse candidate pool. Department and program areas in Student Affairs continue to be intentional in their outreach to recruit and hire diverse students and full-time staff. Information about campus and community diversity resources are included in staff recruitment packages.
Office of University CounselThe Office of University Counsel assisted with review of faculty promotion and tenure actions to assure compliance with diversity and non-discrimination requirements.
School of Information & Library SciencesInclusive language was included in the faculty position announcement for one assistant faculty to be hired in 2011 indicating that we are seeking faculty with “an appreciation for cultural diversity” and specifically encouraging women and minorities to apply.
12

SECTION 1
College of Arts and SciencesThe College of Arts and Sciences actively encourages its units to increase faculty diversity by participating in the Provost’s Target of Opportunity Diversity Initiative on faculty hiring and the Carolina Post-Doctoral Program for Faculty Diversity. The College hired more new faculty from under-represented populations in 2011/12 than the previous year, through regular faculty searches, the Target of Opportunity Diversity Initiatives and the Carolina Post-Doctoral Program. Despite significant state budget cuts, 15 faculty members from under-represented minorities during 2011/12 were hired, which is a 67 percent increase from 9 minority faculty hires the previous year. Among the 43 new faculty hires in the College, 34.8 percent (15) are from under-represented populations: 7 are Asian, 5 are African American and 3 are Hispanic/Latino. More than 60 percent (26) are women.
School of EducationAs part of the School of Education’s continuing commitment to hiring minority faculty and administrators, the Dean met with the search committee chairs. The purpose of these meetings was to convey to the search committee the unit’s commitment to minority hiring. Potential ways to recruit minorities were discussed at the deans’ meeting with the chairs. There was minority representation on all searches. The School provided support for advertising, networking, and direct contacts and liaison to intensify such efforts. As finalists were brought to the dean for review, he asked to see the committee’s choice(s) for top-ranking minority candidates’ applications. As a result, The School of Education had a highly successful year hiring a diverse faculty. The School hired three Latino/a scholars through these search processes who joined the School in July 2011, two at the assistant professor level and one as a distinguished professor. Additionally, the School of Education was successful in the targeted hire of an African American male scholar at the associate professor (with tenure) level who will begin in July 2012.
School of Journalism and Mass CommunicationThe School of Journalism and Mass Communication encourages faculty and staff to make referrals to help widen diversity among applicants and hiring pools and supports promotions for a diverse faculty. One African American male and one Latina female were among the three faculty members promoted from assistant professor to associate professor.
Kenan-Flagler Business SchoolThe Kenan-Flager Business School continues to develop and implement a strategy for attracting and hiring more underrepresented minorities for faculty positions. To attract and hire more underrepresented minorities for faculty positions, a combined ad for all academic areas was placed in the Journal of Blacks in Higher Education and Web-based Diverse Issues in Higher Ed. From FY10/11 recruitments, Kenan-Flager hired three tenure-track Asian males; one tenured Asian male; one tenure-track Asian female, and one tenured Caucasian female. Additionally, in the same recruitment year, Kenan-Flager hired a fixed-term male faculty that self-identifies as Hispanic.
School of NursingThe School of Nursing actively recruited and retained minority faculty and staff members and had recruited and hired one minority nurse faculty member.
School of PharmacyThe number of underrepresented faculty in the School of Pharmacy increased from one to four.
13

SECTION 1
Equal Opportunity/ADA OfficeThe Equal Opportunity/ADA Office met with Office of Human Resources staff to discuss coordination of efforts and to clearly define each unit’s role in the process. The Office monitored searches to ensure that appropriate advertising outreach was done to reach underrepresented populations. The Office also established contact with the local vocational rehabilitation service to reach individuals with disabilities interested in employment.
Office of the Vice Chancellor for Finance and AdministrationFacilities Services utilized a wide variety of recruitment sources including APPA, Burlington Times-News, Craigslist.com, Durham Herald Sun, Employment Security Commission, Monster.com, NACElink, and the Raleigh News and Observer to advertise open positions. The Department of Public Safety hired 5 African American and 1 Hispanic employee and promoted 1 African American employee to supervisory positions. EHS hired 1 new African American employee into professional positions, and hired 2 Asian, 4 African American, and 1 Hispanic temporary employee. Energy Services hired 1 African American employee. Facilities Services hired 1 African American supervisor and 2 Hispanic skilled trade employees.
Information Technology Services (ITS)ITS continues to advertise open positions in all nationwide hiring publications (including recruiters) that also place these opportunities directly in underrepresented arenas. ITS currently uses leadership and administrative directives to guide its strategies that emphasize the importance of diversity in hiring all JOMC faculty and staff positions.
Department of Human ResourcesThe Department of Human Resources promoted more active utilization of diversity recruitment sources to ensure diverse applicant pools. As the department moves forward with the current and continued implementation of PeopleAdmin, it will provide departments with a mechanism for determining the demographics of their applicant pools, as appropriate. Human Resources will work with departments to identify specialized recruitment avenues to target underrepresented populations in the desired professional areas such as career fairs that target veterans, minorities, and the disabled.
Office of the Vice Chancellor for ResearchThe Office of the Vice Chancellor for Research works to enhance and support the Carolina Postdoctoral Program for Faculty Diversity (CPPFD) to increase the number of direct hires of CPPFD scholars at UNC through improvements in support of post-doctoral programs, departments, schools, administrators, and mentors.
Student AffairsThe data holds steady with regard to diverse hires in Student Affairs. The percentage breakdown by ethnic code for all Student Affairs employees is as follows: 3.5 percent Asian, 21.67 percent African American, 3.5 percent Hispanic/Latino, .7 percent multiracial, and 70.5 percent white. Some of the key hires in Student Affairs this year were from diverse ethnic backgrounds.
School of LawThe School of Law has hired five new full-time faculty members for a new first-year writing and research program, to begin on July 1, 2012. One of those, a male, will become the School’s first Latino professor. Another will be an Asian American female. Three of the five hires will be female. In the spring of 2011, the School of Law hired a full-time faculty member for its clinical program, an African American female. In the staff, the School made some diversity gains as well. The School
14

SECTION 1
hired a Director of Human Resources who is an African American female and a Program Assistant in the Clinic who is a Latino male. The School hired a director of law school financial aid (with a primary appointment in Dept. 2448) who is an Asian American female.
Department of AthleticsFor the first time ever, a Cuban American was hired to be the head coach of a sport program, in this case, men’s soccer. He achieved immediate success by leading the team to win the national championship last fall. As a result of NCAA allegations with the football program, the former head coach was removed and the defensive coordinator, an African American, was interviewed and selected to be the interim head coach for the fall 2011 football season. The Department also hired a Hispanic male to head the department’s strength and conditioning program.
School of DentistryThe School ensured that all School of Dentistry EPA and SPA job vacancies are posted in a wide range of media such as the Chronicle of Higher Education, HigherEdJobs.com, and dental related magazines, journals to encourage a diverse and highly qualified applicant pool. The School continues to concentrate recruitment efforts at several community colleges in the state that have Dental assisting programs. The primary purpose of this effort is to attract graduates of these programs to apply for School of Dentistry job vacancies. This also assists the School in its diversity efforts by drawing applicants from a wider geographic area that not only promotes racial diversity, but also other aspects such as cultural, economic, etc.
Faculty and Staff Diversity: Recruiting and Retention
Many units reported efforts and strategies to reach underrepresented racial/ethnic populations to attract qualified applicants for open positions, and to retain faculty from underrepresented populations.
To examine faculty and EPA staff retention and hiring trend in recent years, we compared the termination data of faculty and EPA staff with their corresponding new hires data. From 2009 to 2011, the total number of faculty on average was 3,536 and the average turnover counts were 122 (Table 12). The average annual faculty turnover rate from 2009 to 2011 is 3.45 percent (122/3536), which is low, meaning that Carolina has a stable faculty body. As the numbers in Table 12 were small, we collapsed all racial/ethnic groups into one group named minority. (Although numbers were collapsed for this particular table, our unit advances a philosophy that every number/person counts no matter how small the number is for any particular group.) As shown in Table 12, males and females seem to have similar turnover rates, but considering the gender breakdowns for faculty population in Table 8, the male faculty turnover rate on average was lower than the female faculty turnover rate proportionally. From the minority percentage column, the data shows that the minority faculty turnover rate was down in two consecutive years. (The turnover rate in this report is the rate of those employees who left the University divided by the total number of employees.)
Table 12. Faculty Termination Counts and Percentage from 2009-2011
Year
Male Female White Minority Total Male Female White Minority
N N N N N % % % %
2009 58 48 81 25 106 54.7 45.3 76.4 23.6
2010 57 72 101 28 129 44.2 55.8 78.3 21.7
2011 70 62 105 27 132 53 47 79.5 20.5
Average 61.7 60.7 95.7 26.7 122.3 50.6 49.4 78.1 21.9
Data source: Data is provided by the Office of Institutional Research and Assessment.
15
SECTION 1
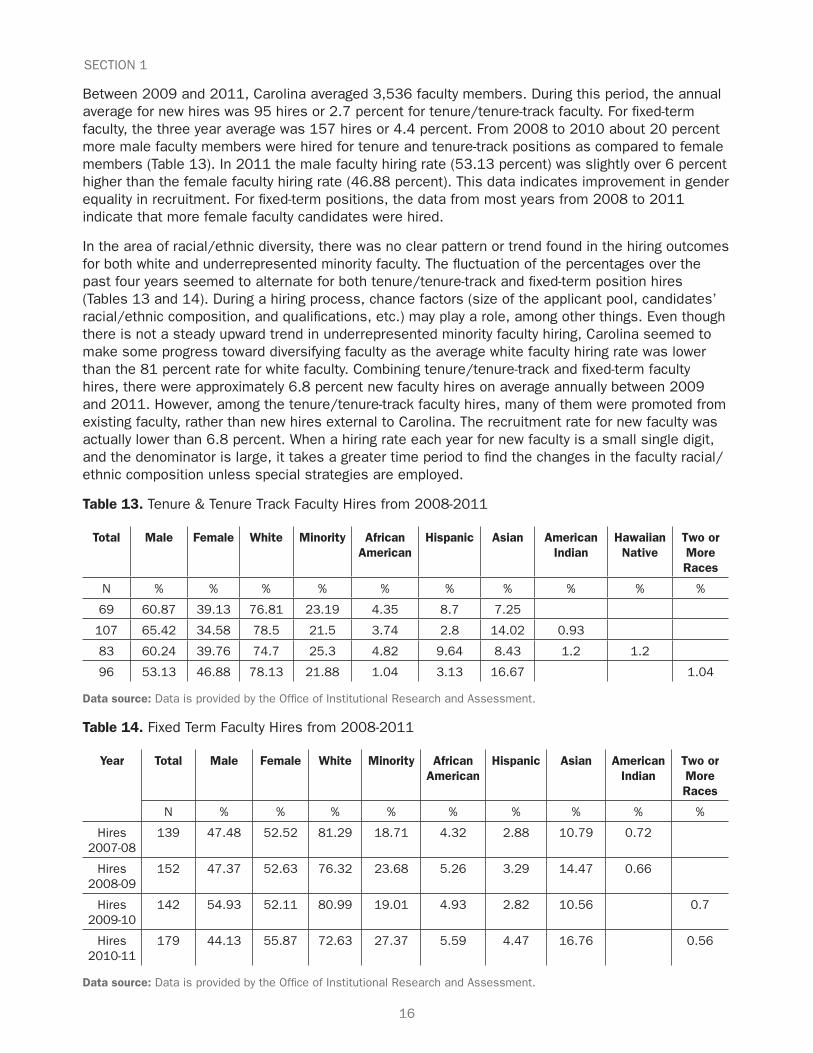
Between 2009 and 2011, Carolina averaged 3,536 faculty members. During this period, the annual average for new hires was 95 hires or 2.7 percent for tenure/tenure-track faculty. For fixed-term faculty, the three year average was 157 hires or 4.4 percent. From 2008 to 2010 about 20 percent more male faculty members were hired for tenure and tenure-track positions as compared to female members (Table 13). In 2011 the male faculty hiring rate (53.13 percent) was slightly over 6 percent higher than the female faculty hiring rate (46.88 percent). This data indicates improvement in gender equality in recruitment. For fixed-term positions, the data from most years from 2008 to 2011 indicate that more female faculty candidates were hired.
In the area of racial/ethnic diversity, there was no clear pattern or trend found in the hiring outcomes for both white and underrepresented minority faculty. The fluctuation of the percentages over the past four years seemed to alternate for both tenure/tenure-track and fixed-term position hires (Tables 13 and 14). During a hiring process, chance factors (size of the applicant pool, candidates’ racial/ethnic composition, and qualifications, etc.) may play a role, among other things. Even though there is not a steady upward trend in underrepresented minority faculty hiring, Carolina seemed to make some progress toward diversifying faculty as the average white faculty hiring rate was lower than the 81 percent rate for white faculty. Combining tenure/tenure-track and fixed-term faculty hires, there were approximately 6.8 percent new faculty hires on average annually between 2009 and 2011. However, among the tenure/tenure-track faculty hires, many of them were promoted from existing faculty, rather than new hires external to Carolina. The recruitment rate for new faculty was actually lower than 6.8 percent. When a hiring rate each year for new faculty is a small single digit, and the denominator is large, it takes a greater time period to find the changes in the faculty racial/ethnic composition unless special strategies are employed.
Table 13. Tenure & Tenure Track Faculty Hires from 2008-2011
Total Male Female White Minority African American
Hispanic Asian American Indian
Hawaiian Native
Two or More Races
N % % % % % % % % % %
69 60.87 39.13 76.81 23.19 4.35 8.7 7.25
107 65.42 34.58 78.5 21.5 3.74 2.8 14.02 0.93
83 60.24 39.76 74.7 25.3 4.82 9.64 8.43 1.2 1.2
96 53.13 46.88 78.13 21.88 1.04 3.13 16.67 1.04
Data source: Data is provided by the Office of Institutional Research and Assessment.
Table 14. Fixed Term Faculty Hires from 2008-2011
Year
Total Male Female White Minority African American
Hispanic Asian American Indian
Two or More Races
N % % % % % % % % %
Hires 2007-08
139 47.48 52.52 81.29 18.71 4.32 2.88 10.79 0.72
Hires 2008-09
152 47.37 52.63 76.32 23.68 5.26 3.29 14.47 0.66
Hires 2009-10
142 54.93 52.11 80.99 19.01 4.93 2.82 10.56 0.7
Hires 2010-11
179 44.13 55.87 72.63 27.37 5.59 4.47 16.76 0.56
Data source: Data is provided by the Office of Institutional Research and Assessment.
16

SECTION 1
From 2009 to 2011, UNC lost approximately 8.5 percent (159/1866) EPA staff per year (Table 15), which was higher than the faculty turnover rate. Although the female EPA staff turnover rate (61 percent) was about 20 percent higher on average than the male EPA staff turnover rate, it was proportional to the gender breakdowns for the EPA population (Table 8). For racial/ethnic categories over the same 3-year period, the fluctuation was within 2 points for both white (69.6 percent) and minority and underrepresented (30.4 percent) groups. However, compared to the 2011 EPA staff racial/ethnic splits (81 percent white, 19 percent minority), the minority/underrepresented EPA staff turnover rate was much higher than that of the white EPA staff proportionally.
Table 15. EPA Staff Termination Counts and Percentage from 2009-2011
Year
Male Female Whit Minority Total Male Female White Minority
N N N N N % % % %
2009 58 82 99 41 140 41.4 58.6 70.7 29.3
2010 51 103 105 49 154 33.1 66.9 68.2 31.8
2011 78 105 128 55 183 42.6 57.4 69.9 30.1
Average 62.3 96.7 110.7 48.3 159.0 39.0 61.0 69.6 30.4
Data source: Data is provided by the Office of Institutional Research and Assessment.
UNC averaged 1,866 EPA staff members between 2010 and 2011. The average EPA staff hires per year were 213 or 11.4 percent (213/1866). EPA staff hiring outcomes in Table 16 shows a very slow decreasing trend in minority/underrepresented EPA staff hiring. Among the minority groups, African American and Asian hires were down, but Hispanic hires increased by almost 2 percent in 2011.
Table 16. EPA Staff Hires from 2008-2011
Year
Total Male Female White Minority African American
Hispanic Asian American Indian
Hawaiian Native
Two or More Races
N % % % % % % % % % %
Hires 2007-
08
309 36.25 63.75 76.38 23.62 13.59 2.59 7.12 0.32
Hires 2008-
09
246 32.93 67.07 76.42 23.17 12.2 1.22 9.76
Hires 2009-
10
192 42.19 57.81 79.69 20.31 10.42 1.56 7.29 1.04
Hires 2010-
11
233 37.34 62.66 79.83 20.17 9.44 3.43 6.44 0.43 0.43
Data source: Data is provided by the Office of Institutional Research and Assessment.
17
Commitment to Diversity, Diversity Education, and Inclusive Climate
Section 2:
As the core mission of the University is to serve the people of the state of
North Carolina, UNC-Chapel Hill has committed to building and sustaining a
diverse and inclusive campus community. In 2005, the University conducted
its first Diversity Assessment as part of the work of the Chancellor’s Task
Force on Diversity, resulting in the development of a Diversity Plan. In 2010,
the University conducted its second Diversity Assessment. The assessment
survey was administered to students, faculty, and staff. The survey response
rate was 36.2 percent for students, 51 percent for faculty, and 48 percent
for staff, which was much higher than the 2005 survey response rate (27
percent average). Because the survey items were not consistent, we did not
attempt to make a comparison between the two survey results.
In the 2010 diversity assessment, students, faculty, and staff were surveyed
with separate forms. There were common items in the student, faculty, and
staff surveys assessing the extent to which respondents perceived Carolina’s
commitment to diversity. Judging the responses from students, faculty, and
staff, the campus community was well aware of the University commitment to
diversity as the respondents’ agreement rate ranged from 92 to 96 percent.
Most of the respondents also agreed that the University demonstrated
a commitment to respect for differences of opinion. When asked if the
University community showed adequate respect for the minority perspectives,
staff and students seemed to have higher agreement rate than that of
faculty. On average, 70 percent of the respondents felt that they were valued
by the University, while 23 percent did not feel valued and approximately
seven percent said they did not know if they were valued.
18

SECTION 2
Table 17. 2010 University Diversity Assessment Survey Selected Items
Survey Item
Agreement Rate
Student Faculty Staff
The University is publicly committed to diversity. 92.4 92.4 96.5
The University demonstrates a commitment to respect for differences of opinion. 91.3 88.8 91.3
The University community shows adequate respect for the minority perspectives. 86.4 76.5 88.7
I feel valued by the University 70 70.8 69.9
Data source: Data is provided by the Office of Institutional Research and Assessment.
Diversity Education and Training
Diversity education and training includes courses centrally or partially focused on diversity issues, cultural matters, inequality, diversity workshops, seminars and discussions. In the 2010 assessment surveys, 75 percent of the staff respondents agreed with the statement that they had access to opportunities for diversity education, compared to 47 percent of faculty respondents. However, over 50 percent of the faculty respondents did not agree, or said they did not know of such opportunities for diversity education and training. Among faculty respondents, 75 percent agreed that the curriculum in the department adequately represented the academic contributions of diverse groups of people, and 68 percent agreed that the curriculum adequately represented the cultural contributions of diverse groups of people. Furthermore, the majority of faculty respondents (61 percent) felt encouraged to include diversity in their course content, while 12 percent did not feel encouraged and 27 percent “did not know” if they were encouraged. From the student perspective, approximately 58 percent of student respondents felt cultural diversity courses were beneficial to their educational experiences at the University, while about 28 percent respondents reported that diversity courses were “slightly” or “not at all beneficial”. Female students were more likely to agree that cultural diversity courses were beneficial than their male counterparts.
Diversity Dialogue and Climate
Several items in the assessment survey were designed to assess to what extent a favorable climate for diversity was present. Eighty percent of the student respondents felt comfortable discussing diversity at the University, but faculty respondents indicated 61 percent of the students in their classes seemed comfortable discussing issues of diversity. Although only 59 percent of the faculty respondents felt readily engaged in discussion and dialogues concerning diversity issues, they tended to be more comfortable discussing diversity issues with students out of the classroom than in the classroom. Most of the faculty and staff respondents felt they were encouraged to share their opinions in the workplace, and they felt that their workplace was generally a comfortable and inclusive environment. About 42 percent of the student respondents said that they had experienced situations in the University in which they felt marginalized. This rate was 12 to 25 percent higher for African American (54 percent) and Hawaiian or Pacific Islander (67 percent) respondents. Thirty-six percent of the faculty respondents said that they also experienced situations in which they felt marginalized. Again, this rate was higher for African American faculty respondents (51.5 percent), but was also higher for American Indian faculty respondents (87.5 percent N=8).
19

SECTION 2
When asked if “tenure and promotion processes in the University were free from bias based on personal characteristics,” 21 percent of the faculty respondents disagreed and around 27 percent chose “don’t know. The disagreement rate to this statement was 42 percent for African American and 66.7 percent (N=3) for Hawaiian or Pacific Islander respondents. The majority of faculty respondents (53.5 percent) agreed that ‘retention efforts in the University reflect a commitment to maintaining a diverse faculty’. However, 50 percent for American Indian (N=8), 47 percent for African American, and 66.7 percent for Hawaiian or Pacific Islanders (N=3) respondents disagreed with there being evidence of retention efforts to maintain a diverse faculty. A great portion of the faculty seemed unaware that “adequate processes were in place to address diversity based grievances” as 45 percent of the faculty respondents chose “don’t know” for this item.
The 2010 diversity assessment data provides some sense of the campus community’s perception regarding the University’s commitment to diversity, diversity education, and overall inclusive climate. In the next few pages, we will present the efforts, actions, strategies, and accomplishments reported by the units on the campus during the 2011-2012 academic year.
Commitment to Diversity
Twenty-four of the 31 reporting units (80 percent) reported their efforts to address Goal 1. Many of the units publicized their diversity commitment statement on their respective websites, in admissions materials, and at new student orientations. Units’ commitment to diversity also was reflected in lecture and performance sponsorships designed to raise awareness of the influence of diverse cultures, outreach programs to serve underserved areas, fundraising efforts to promote campus accessibility and institutional initiatives for transfer students, first-generation students, and Covenant Scholars.
Actions Reported to Publicize Commitment to Diversity
Carolina Performing Arts/Office of Director of the ArtsCarolina Performing Arts engagement and residency programs are rapidly expanding, and that creates opportunities for dialogue, education and awareness on issues of diversity. January and February of 2012, CPA held three talks in the series: “African American Legacies in the Performing Arts, Then and Now.” As of the end of 2011, they had engaged nearly 1000 people in activities beyond the performances that deepened and contextualized the performances. Many of these activities focused on particular cultural and historical contexts, to highlight and raise awareness of the impact and influences of diverse cultures from around the globe, and here in the United States.
Student AffairsThe Vice Chancellor announced the accessibility inventory initiative at the Student Affairs kick-off event in August, and each of its units is working with a staff member in Disability Services to conduct an accessibility inventory. Inclusion and accessibility is a core value within Student Affairs. The commitment to inclusion and accessibility is articulated within the mission and goal statements at both the organization and department level and are clearly visible on Student Affairs and departmental websites and printed publications. This core value is interwoven throughout Student Affairs’ programs and services.
20

SECTION 2
School of LawThe School of Law continued many of its traditional efforts, including Diversity Law Day, the Minority Alumni Breakfast, the CLEO Womble Carlyle Road to Law School Program, and its admissions outreach to diverse students. The School incorporated, as it has always done, messages about diversity in its admissions materials.
University AdvancementUniversity Relations has consistently promoted campus accessibility and affordability initiatives including: the Carolina Covenant, Carolina Student Transfer Excellence Program (C-STEP), and the Carolina Advising Corps. University Development has been instrumental in raising funds to sustain C-STEP. C-STEP helps qualified low-income, high-performing community college students gain access into and graduate successfully from Carolina. Advancement also supports the Scholars Latino Initiative (SLI) and other initiatives. SLI targets Latina/o immigrant students, a marginalized and growing population in North Carolina.
Office of University CounselThe Office of University Counsel’s ongoing primary goals are both to be knowledgeable regarding developments in the law related to how best to achieve a diverse faculty and staff and diverse student body and also to share that knowledge with appropriate administrators as programs are developed and implemented. Its secondary goal is to regularly collaborate with campus administrative offices that have direct responsibilities in the area of diversity.
School of DentistryDuring the 2010-2011 academic year, the Dean’s Task Force on Diversity and Inclusivity was created to explore the climate of the dental school and its related programs. In several media announcements, the School of Dentistry’s commitment to diversity was again projected as part of its continuing programs including the DISC Program (Dentistry in Service to Communities), the First Health program, and the Tri-County Family Dental Center. As part of the DISC program, senior dental students spend a minimum of eight weeks in community clinical sites. The rotation time is divided evenly between a community hospital setting and a non-hospital setting. Non-hospital settings include community health centers, Indian Health Services, military bases, prisons, and residential facilities for physically and mentally challenged populations.
Diversity Education
Twenty-one of the 30 reporting units (70 percent) indicated that Goal 3 was one of the priorities in 2011-2012. Providing students, faculty and staff with opportunities of diversity training, and offering diversity related courses to students and employees were among the diversity education related themes frequently mentioned in the reports. Some units required their faculty, staff, and new students to attend diversity training programs.
21

SECTION 2
Actions Reported to Offer Diversity Education and Training
Student AffairsDepartments and programs currently integrate multicultural competencies into existing trainings or offer specialized diversity trainings for staff (student and full-time) to participate in. Student employees and staff are also highly encouraged to participate in ongoing trainings such as Safe Zone Training, Haven Training, Diversity 101, etc.
College of Arts and SciencesThe Center for the Study of the American South offered a peer mentoring opportunity to more than 400 minority first-year undergraduates. About 337 (82 percent) participated voluntarily in this Minority Advisory Program. The Economics Department taught a class on Women and Economics. Asian Studies and the Carolina Asia Center collaborated with NC State and Duke to establish a Triangle Center for Japanese Studies.
Diversity and Multicultural AffairsStaff professionals from Diversity and Multicultural Affairs, taught two classes for Human Resources: Diversity in the Workplace for Employees, Diversity in the Workplace for Supervisors.
School of EducationAt Teaching and Learning Area meetings, the School encouraged faculty to consider ways of expanding attention to diversity within program and course offerings, and made great effort to place its student teachers in high-minority public schools. Students in its educational leadership programs accomplished internships in a variety of district types including urban, suburban, and rural, low, medium and high socio-economic status, and majority-single-race as well as more racially/ethnically diverse districts and schools.
University LibraryApproximately 40 library staff attended the 2011 summer film series that tied into the campus’ reading of Eating Animals by Jonathan Safran Foer. About the same number of staff from the library and faculty and students from the School of Information and Library Science attended the Diversity webinars in December 2011.
School of NursingNine Courageous Dialogue sessions were held. Ninety-eight percent faculty and staff participated in the dialogue. Thirty five faculty and staff attended and successfully completed Safe Zone training.
Office of University CounselOne of the Office of University Counsel’s attorneys annually teaches a semester-long course in the School of Law entitled “Legal Issues in Higher Education” which incorporates discussions of diversity and affirmative action in the employment and admissions contexts.
School of DentistryThe School of Dentistry continued with several courses that highlight diversity as part of the course content. Several courses are taught every year that include content directly pertaining to diversity education including Social and Ethical Issues in Dental Practice (DENT 100) and Behavior, Communication, and Culture (DENT 210).
22

SECTION 2
College of Arts and SciencesThe Department of History sponsors an annual African American History month lecture, a graduate workshop on African American History (part of its efforts to recruit diverse graduate students), and an annual graduate student conference on African American History and Culture, which draws graduate students from other universities.
Equal Opportunity/ADA OfficeTraining has led to increased awareness and understanding of harassment and discrimination and increased awareness of disability and accessibility. The Equal Opportunity Office worked with Diversity and Multicultural Affairs and the Center for Faculty Excellence to sponsor a workshop called “Teaching So Everyone Learns: Managing culturally difficult topics and situations in the classroom”.
Office of the Vice Chancellor for Finance and AdministrationAll new employees are still expected to attend, within a 12-month period, a diversity training program.
In Public Safety, all non-sworn law enforcement employees attended 7 hours of training on Working Together According to Different Types, and 4 hours of Cultural Diversity Training. All sworn law enforcement officers attended a Juvenile Minority Sensitivity Training and training sessions on diversity, mental illness and developmental disabilities. More than 96 percent of all existing Finance employees have completed required diversity training. The remaining 4 percent who have not taken the training plan to take it within the next month. Employees are instructed to complete diversity training within one year of hire date as training availability allows.
University LibraryThe Library continues to build collections that reflect the diversity of the UNC academic programs and community, and partners with HBCU libraries to increase access to African American archival resources.
Department of Human ResourcesHuman Resources examines diversity training needs as part of the Department’s assessment of its current training curricula. The Department continues to offer a variety of classes specifically regarding diversity in the workplace, both for individual contributors and for supervisors. In addition, Employee and Management Relations began working with the LGBTQ Center to help promote their Safe Zone Ally program to employees.
School of MedicineData reveals that since the program, Opening Doors, began at UNC, almost 20 percent of all participants have been faculty. This is an important statistic that reveals a degree of participation by the faculty that has not been clear in the past, and which marks a significant milestone of support for the program.
School of Social WorkStructured and facilitated discussions on diversity issues, climate, and the classroom occurred during two faculty senate meetings, with a focus on race/ethnicity, LGBTQ issues, and effective strategies for creating classroom climates that support dialogue on issues of diversity.
23
SECTION 2
GlobalGlobal fostered cross cultural learning by ensuring diversity of presenters at events, symposium, and conferences and by promoting these activities to under-represented groups in international studies.Under the goal of “Opening Access”, Global also includes disciplinary diversity as exemplified by a Curriculum Development grant Global made to Wei You to completely update Polymer Chemistry through an online collaboration between UNC and University of Science & Technology of China. Students now have a much better understanding of polymer chemistry, and students and faculty have forged international friendships. This was 1 out of the 19 courses that were developed.
Inclusive Climate
Twenty-four of 30 reporting units (80 percent) selected Goal 4 as one of the priority goals in 2011-2012. Overall, the campus community understood the importance of a respectful campus climate. Many units strove to provide opportunities to students, faculty, and staff to discuss diversity related topics, to hold discussion sessions for fostering diversity related conversations and to invite faculty, staff, and students to tell stories and make presentations regarding diversity and inclusion. Some units discussed diversity issues through social media (e.g., Facebook).
Actions Reported to Achieve an Inclusive Climate
Department of AthleticsThe Department has had programs and events where diversity and inclusion were part of the discussion, not only for staff and coaches, but for student-athletes, as well. The Carolina Leadership Academy’s CREED program invited Dave Lohse, Associate Director of Athletic Communications, to tell his story of being an openly gay male in the field of athletics. Dave also spoke to the SAAC (Student-Athlete Advisory Council about his experiences). These presentations led to the development of the video “It Gets Better”. The video featured several student-athletes, Dave Lohse, coaches and administrators, including the Director of Athletics. The “It Gets Better” group still finds ways to discuss issues through their Facebook page.
School of Information & Library Services (SILS)The newly created SILS Taskforce on Diversity partnered with the SILS Diversity Committee to support faculty and students in the development of diversity-related programming, educational content, recruitment efforts, and raised the level of discourse and awareness around diversity-related topics. Each SILS student group was asked to host at least one event which focused on a diversity-related topic.
The faculty and staff completed a survey focused on better understanding attitudes toward diversity within the SILS community.
School of DentistryThe School of Dentistry hosted the Dean’s Luncheon for Under-represented Minorities on Feb. 10, 2012. During this event, all under-represented minority students who had been admitted to the class of 2016 were invited to meet the administration, faculty, and students of the School. Although many of the faculty who participated in the event were under-represented minorities themselves, majority as well as under-represented minority faculty and administration gathered with the purpose of presenting the School’s strong commitment to diversity in its student body, faculty, and staff.
24

SECTION 2
College of Arts and SciencesAs part of undergraduate retention efforts, the Office of Undergraduate Education is creating a climate where individual differences are celebrated. Students are encouraged to define their own paths to success. Training, publications, and informational materials have been developed to normalize help-seeking behavior and create an inclusive, safe environment where students can learn to make informed choices to support their academic success.
Office of the Vice Chancellor for Finance and AdministrationCarolina Dining Services coordinated with the Carolina Latina/o Collaborative to host a Hispanic Heritage Month Dinner with special menus, decorations, and themes. Carolina Dining Service also coordinated with the Black Student Movement to feature special food stations for lunch and dinner at both board plan venues during Black History Month, and hosted a dinner highlighting influential African Americans on the campus with a menu jointly developed with the Black Student Movement.
The Graduate SchoolDialogues with faculty and students emphasize how the Graduate School contributes to, as well as benefits from, a welcoming, honest, and diverse environment. The First Nations Graduate Circle (Native American) and The Black Graduate and Professional Student Association (BGPSA) continue to provide support for student members and programming to the UNC community. The Graduate School is currently providing support for the establishment of an Asian Graduate and Professional Student group and fielding suggestions for other groups. Topical interest groups have also been established in order to provide students an opportunity to engage in intellectual conversation and networking around ethnically related topics.
Office of the Vice Chancellor for ResearchThere has been a significant increase in interaction between the program Manager and departments or chairs reflecting an increased awareness and focus of schools/departments to address faculty diversity needs. Calls and emails from departments and chairs have more than doubled this year, regarding advertising, recruiting assistance, nomination guidance, hiring or Target of Opportunity information, and discussions on underrepresentation identification and needs. The Office has improved awareness and understanding of UNC’s diversity and inclusion goals, and encourages thoughtful discussion of diversity issues.
School of PharmacyCross Cultural Communication Modules were developed and administered to first through third professional year students to help facilitate a welcoming environment, promote professionalism, and to produce culturally competent practitioners.
School of Social WorkThe School continues to foster a welcoming climate for diverse students by offering orientation sessions for entering MSW students which included specific content that emphasizes the School’s commitment to teach and to address issues of diversity in the classroom. Specifically, the School included diversity discussion in workshops focused on ethics, assessment, and leadership.
GlobalUNC Global created and publicized a process for addressing disrespectful behaviors, harassment, and discrimination.
25

Actions Reported to Conduct Diversity Related Research
Student AffairsNew Student and Carolina Parent Programs (NSCPP) student leaders take a pre- and post- assessment that measures their diversity knowledge and growth after participating in a student leadership role. Intentional demographic questions and inclusive language are used in all NSCPP program evaluations to gain further insight on the experiences of underrepresented populations.
School of LawThe Center for Banking and Finance, along with several faculty members, continued to conduct research related to the impact of having diversity on corporate boards. In addition, the Center for Civil Rights has continued to conduct research on the impact of diversity on K-12 education, and the cascading negative effects on schools that are racially and socioeconomically homogeneous. This effort will help inform advocates and school districts that are wrestling with these issues.
University AdvancementCorporate and Foundation Relations (CFR) continued to support the efforts of the Office of Undergraduate Research (OUR) to engage students from diverse backgrounds in research and associated programming. OUR’s multi-year grant from the Howard Hughes Medical Foundation facilitates the HHMI Undergraduate Research for Future Scientists and Clinicians (HHMI-FSC)
Diversity ResearchSection 3:
Similar to the previous years, Goal 5 was addressed by 17 of 30 reporting
units or 58 percent, the lowest percentage among the five goals. The
most frequently mentioned research in the reports was unit level surveys
or assessments. Units assessed the diversity knowledge of students
and employees after they attended diversity training programs. Units also
surveyed their students and employees to assess their workplace climate.
Units reported the use of assessment data in programming, or in forming
a diversity committee or task force to address the diversity-related issues.
Some units conducted research on promising practices to effectively recruit
students, faculty, and staff from underrepresented and/or underserved
populations. Partnerships with external research centers or institutes
enabled some units to conduct diversity-related research. The following is
a presentation of some of the actions and accomplishments from the unit
reports for Goal 5.
26

SECTION 3
program. This program empowers high-ability Carolina Covenant Scholars to undertake original research under the supervision of research-active faculty, graduate student, and postdoctoral mentors. Over two consecutive summers, these Scholars will engage in research and associated programming designed to help them overcome financial, social, and cultural barriers as they prepare for careers in biomedical fields.
School of DentistryThe School of Dentistry initiated and concluded a climate survey of all faculty, staff, and students. The School used the results of the climate survey to establish any needed programming or processes that do not currently exist and/or to modify ones that do currently exist. As a result of the Task Force, a climate survey was completed by staff, faculty, and students and the results shared with the dental school community. Based upon the recommendations of the Task Force and in response to the survey results, in 2011 the Task Force recommended that a standing committee be created to continue to address the needs of the School of Dentistry.
College of Arts and SciencesThe College of Arts and Sciences conducts an annual survey of diversity activities across the College as well as supports departmental activities and relevant research. The Retention Coordinator in the Office of Undergraduate Education (UE) has worked with the National Research Center on Rural Education (located at UNC-CH) and the Southern Historical Society to research the needs of first-generation college students and rural students at Carolina. UE’s programming with first-generation college students has been presented at national conferences. Papers on how UE academic interventions have served students with diverse needs have been published in several research publications. Faculty and graduate students across the College are engaged in extensive research activities that address issues of race, ethnicity, gender, and diversity.
Office of Scholarships & Student AidThe Carolina Covenant staff and Advisory Board continue to evaluate the program and research ways to improve the services that the Office offers to students. The Office, working with Institutional Research and with the oversight of the faculty Committee on Scholarships, Awards and Student Aid, produced several other reports from the Unit Record data, so that the Office can better understand the effect of student aid policies on various cohorts of students. This information enables the Office to further (1) assist in the recruitment, retention, and graduation of a diverse student body; (2) continually improve service to students; and (3) support long-range enrollment and planning goals in support of the instructional mission of the University.
School of EducationThe School of Education followed up on a strategic planning effort begun in 2011-2012 where social justice was identified as a core value by faculty. By gathering data through intensive conversations with students and through work with faculty and staff on campus, specifically those in Diversity and Multicultural Affairs, the School of Education has begun a planning effort for the design and implementation of a full-scale climate survey in the School of Education in spring 2012.
27

SECTION 3
Equal Opportunity/ADA OfficePRM Consulting was brought in to conduct a climate assessment of the housekeeping department. The firm issued a report of its findings and recommendations this past fall. Work is currently underway to implement the recommendations made by the consultants.
School of NursingAccelerated BSN student Mary Carter and MSN student Christine Weeks are the 2011 recipients of the Pauline W. Brown diversity scholarship award. Carter’s winning submission was the paper “Exile and reintegration among rape survivors in the Democratic Republic of Congo: Factors influencing rejection and acceptance.” She performed a secondary analysis of data to examine the cultural factors that influence whether women that experience rape are then exiled or accepted by their husbands. Weeks won the award with her review paper “Factors influencing self-care behaviors of African American adults with type 2 diabetes.” She examined research in which the study population contained at least 15 percent African Americans and directly addressed factors affecting self-care behaviors.
Department of Human ResourcesEEO Compensation metrics reports will be gleaned from the data warehouse for review by both the Vice Chancellor for Human Resources and the EEO Advisory Committee. HR, EEO and Institutional research are collaborating to conduct a pay equity study for the Housekeeping unit where issues of diversity were of greatest concern. A draft EPA Non-Faculty salary structure has been developed in conjunction with the EPA Non-Faculty HR unit. Employee and Management Relations worked closely with PRM Consulting as they conducted over 400 in-depth interviews with housekeeping management and staff members. Upon completion of those interviews, PRM produced a comprehensive report describing their interview methods, findings, and recommendations for addressing a wide spectrum of diversity-related concerns based upon its extensive knowledge of HR best practices.
Office of the Vice Chancellor for ResearchThe Office of the Vice Chancellor for Research continues the research activities of the Institute on Aging’s Aging and Diversity Research Program with a focus on various diversity issues. These activities, through research and training, address health disparities in later life and provide a forum to discuss and examine ethnic, racial and cultural variations. Research findings are disseminated to both the academic and lay community. Diversity-related research in the IOA’s other research programs includes Healthy Aging and Workforce Aging, which allows for diversity research within the context of other important aspects of aging.
School of PharmacyA second alumni summit was conducted to provide a pathway to gain a broader scope of perspectives and to strengthen relationships with alumni. Two presentations were conducted and four peer-reviewed abstracts were published and presented pertaining to best practices regarding the recruitment and retention of underrepresented students and faculty at the American Association Colleges of Pharmacy Annual Meeting in San Antonio, Texas July 9-13, 2011.
28

SECTION 3
School of Social WorkThis year two Pfouts awards were given for diversity and vulnerable population focused research—one on Latino immigrant issues and a second on African American adoption/foster care. In addition, two Armfield-Reeves awards were given for diversity and vulnerable population focused research—one on immigrant challenges in NC and China, and the other on engagement and retention of Black youth in clinical mental health services.
GlobalCGI must also be mindful of socio-economic diversity as some students can’t afford formal study abroad programs. One wrote: “It is great that CGI offers such opportunities for undergraduates to travel abroad and do research. I was never able to study abroad because of finances but thanks to CGI I was able to finally get to go abroad and do work for my thesis. This experience of doing research abroad was much more rewarding for me than just studying abroad.” Given CGI students’ strong interests in service-learning (28 percent said their funded projects were service-learning), a student suggested “Expanding funding to support student’s self-designed global service-learning experiences, as you do for internship and research experiences, would be a valuable way to expand CGI’s reach and involvement with global engagement.”
29

30
Analysis, Commentary and RecommendationsSection 4:
After six years of implementing the University’s diversity plan, improvements
are noted in the enrollment of diverse students; and the recruitment of
historically underrepresented and underserved students such as first-
generation students. However, there remains growth opportunity in the
areas of attrition and graduation rates for underrepresented and historically
underserved student populations. Particularly, Carolina has an opportunity
to reduce attrition rates, with particular focus on African American males,
American Indian students, and first-generation students. Increasing
graduation rates and narrowing the disparity between the aforementioned and
other underrepresented student populations should be in concert with the
future priorities of the institution.
Faculty and staff data do not show much evidence that faculty and staff
diversification has achieved noticeable improvements during the recent
years. UNC units reported their efforts to intentionally diversify faculty and
staff for open positions. However, the previous lack of improvement in the
areas of faculty and EPA staff diversification calls for further investigation and
special strategies. Achieving numerical improvements in the diversification
of faculty and EPA staff may prove challenging as Carolina maintains a
fairly stable faculty workforce. The annual turnover rate for faculty between
2009 and 2011 was 3.5 percent (Table 12). Given that the hiring rate for
faculty averages under 6 percent (not accounting for promotions of tenure-
track or fixed-term faculty), it will take a substantive number of years before
UNC experiences a quantitatively-measured increase in faculty diversity
– unless aggressive and innovative efforts are taken. However, faculty
diversification of any magnitude may have immediate impact on departmental
climate, curriculum, research, and faculty, staff, and student composition
and experience. The same applies to the diversity of EPA staff, although
diversification seems more attainable for EPA staff as its hiring rate is
approximately 11.5 percent (Table 16) between 2009 and 2011.

SECTION 4
31
Similar to the student body, recruiting or hiring of diverse faculty or staff is only one part of what is necessary to achieve diversity; whether the institution can retain the faculty and staff and more intentionally leverage the diversity as a strength toward the success of the individual units, the campus and the greater community are other aspects of the solution. Tables 13, 14, and 15 illustrate that among the faculty hired between 2009 and 2011, 23 percent were hired from minority groups. However, the University lost nearly 21 percent of minority faculty within the same period. The tables also indicate that a net gain of 33 minority faculty were hired, which accounted for one percent of the total faculty. For EPA staff hires, Carolina had 20 percent new minority hires. However, among the EPA turnovers, minority staff consisted of 30 percent, resulting in a net loss of minority EPA staff. These statistics coupled with the slow growth of faculty from the minority populations indicate little improvements in diversifying faculty and staff. This area requires further research to more clearly determine the reasons why underrepresented faculty and EPA staff depart the University. In some instances, underrepresented faculty and EPA staff may be departing for growth opportunities, however, these reasons need to be determined and better understood.
Climate is tied closely with retention. In the 2010 diversity assessment, African American, and Hawaiian/Pacific Islander student respondents were much more likely to say they experienced situations at the University in which they felt marginalized. African American, Hawaiian/Pacific Islander, and American Indian faculty respondents were also more likely to feel marginalized. Minority faculty respondents were also more likely to disagree with the statements “tenure and promotion processes in the University were free from bias based on personal characteristics”, and “retention efforts in the University reflect a commitment to maintaining a diverse faculty”. Among the respondents, student, faculty, and staff alike, about 23 percent said they did not feel valued by the University, and seven percent said they did not know if they were valued. As people feel marginalized or undervalued, the desire to seek a more supportive environment can come into play and may lead to departure. Data indicates that some students of color have unique experiences that can be different than their white counterparts.
Diversity education and training was a significant approach that units used to promote a diverse and inclusive climate. In the 2010 diversity assessment survey, 30 percent of the faculty respondents noted that they had not been offered the opportunity to access diversity training and approximately 24 percent said they did not know of such opportunity. Twenty percent of the faculty respondents were unaware that the University encourages faculty to include diversity in their course content, and 12 percent did not agree that the University actually offers encouragement to incorporate diversity into course content. During this report period, more reporting units engaged in diversity education and training. Some schools noted incorporating or highlighting diversity content in their courses, and some administrative units reported various diversity training programs and seminars to their students, faculty and staff. The Office of the Vice Chancellor for Finance and Administration required all their employees to complete diversity training.

SECTION 4
Diversity Research at Carolina is moving forward. Among the reporting units, more units conducted diversity assessments on diversity knowledge of their students and employees after offering diversity education programs. An increased number of units conducted research on the promising practices for effective recruitment of students, faculty, and staff from underrepresented groups, and on ways to improve the workplace climate. They utilized the assessment data and research findings to guide future efforts and actions. The Office of Undergraduate Education published papers on how their office’s academic interventions have better served students with diverse needs. The School of law, School of Social Work, and other units conducted diversity related research, and supported students with diversity related research projects.
In the 2011-2012 diversity plan reports submitted by the units, goals and/or objectives were stated and metrics and results were reported or listed by most of the units. However, formative evaluations or assessments of the goals or objectives were not included. Without evaluation or assessment, it is hard to determine to what extent that the goals/objectives have been achieved. Assessment is a systematic process involving planning, assessing, and using the results. It is possible that the current reporting template itself is not structured in a way that allows units to incorporate planning, assessing, and using the assessment results in the report in a systematic way.
Recommendations
1. The University should consider developing an assessment mechanism that will include achievable goal and objective setting, measurable expected outcomes and self-evaluation of actual outcomes in a reporting template to measure success and improve efforts effectively and systematically.
2. Additional resources should be allocated to enhance academic support and student retention programs, and to evaluate the effectiveness of existing programs or initiatives focused on academic support and student retention. It is important to utilize an evidence based approach to determine which strategies or interventions are working, how they work and why they work, so that the best practices can be shared with and used by other schools or colleges.
3. Additional resources should be allocated to employ special strategies for recruiting and retaining faculty from targeted underrepresented groups. The Diversity and Multicultural Affairs unit should be a key facilitative resource and should offer guidance and consultation in this regard.
4. Strategies to increase communication and participation of faculty in diversity and inclusion education and search education programs should be developed and implemented. Better communication regarding processes and procedures for tenure and promotion and for handling biased treatment in such processes is also an area for further examination and strategy.
32

33
Appendix 1Section 5:
Reporting Units
Academic Initiatives Global School of Nursing
Undergraduate Admissions Graduate School Eshelman School of Pharmacy
University Advancement Office of Human Resources Gillings School of Global Public Health
College of Arts and Sciences School of Information & Library Science
Research & Economic Development
Office of the Executive Director of the Arts
Information Technology Services
Scholarships & Student Aid
Office of University Counsel
School of Journalism & Mass Communication
School of Education
School of Dentistry Kenan-Flagler Business School School of Social Work
Department of Athletics School of Law Student Affairs
Equal Opportunity/ADA Office Libraries Summer School
Finance & Administration School of Medicine

Committed to a Diverse and Inclusive Campus Community
DIVERSITYPLANREPORT
2011 - 2012


Visit us online at unc.edu/diversity