
Unbundling the Incumbent and Entry into Fiber: Evidence ... · PDF fileUnbundling the...
34
Unbundling the Incumbent and Entry into Fiber: Evidence from France Marc Bourreau * Lukasz Grzybowski † Maude Hasbi ‡ Preliminary version. Please, do not cite Abstract We use panel data on 36,080 municipalities in metropolitan France over the period 2010- 2014 to estimate two models of entry into local markets by: (i) the incumbent and two other operators using fibre technology and (ii) operators seeking wholesale access to the legacy telecommunications network via local loop unbundling (LLU). We find that local market presence of LLU operators has a positive impact on entry by fibre operators. We observe in the data that the deployment of fibre is always proceeded by the entry via LLU. Based on the estimation results the decision to deploy fibre by the incumbent and competitors is also positively influenced by the presence of other LLU operators. High speed fiber broadband allows firms to differentiate their offer from DSL-based services. Moreover, the presence of cable operator stimulates deployment of fibre. Firms using DSL technology fear losing consumers and being preempted by cable operator and deploy fibre technology in areas covered by cable. We also find that the deployment of VDSL technology which allows higher Internet speed on copper network slows down the deployment of fibre. Thus, firms choose to upgrade copper lines on the legacy network instead of investing in fibre networks. We use the estimates to calculate entry thresholds into local markets, which are much lower for broadband provision via LLU than via fibre and decrease over time. The deployment of fibre becomes cheaper over time but is unprofitable for the vast majority of municipalities in France. * Telecom ParisTech, Department of Economics and Social Sciences, 46 rue Barrault, 75013 Paris, France. E-mail: [email protected] † Telecom ParisTech, Department of Economics and Social Sciences, 46 rue Barrault, 75013 Paris, France. E-mail: [email protected] ‡ Corresponding author: Telecom ParisTech, Department of Economics and Social Sciences, 46 rue Barrault, 75013 Paris, France. E-mail: [email protected] 1
Transcript of Unbundling the Incumbent and Entry into Fiber: Evidence ... · PDF fileUnbundling the...

Unbundling the Incumbent and Entry into Fiber:
Evidence from France
Marc Bourreau∗ Lukasz Grzybowski† Maude Hasbi‡
Preliminary version. Please, do not cite
Abstract
We use panel data on 36,080 municipalities in metropolitan France over the period 2010-
2014 to estimate two models of entry into local markets by: (i) the incumbent and two other
operators using fibre technology and (ii) operators seeking wholesale access to the legacy
telecommunications network via local loop unbundling (LLU). We find that local market
presence of LLU operators has a positive impact on entry by fibre operators. We observe in
the data that the deployment of fibre is always proceeded by the entry via LLU. Based on
the estimation results the decision to deploy fibre by the incumbent and competitors is also
positively influenced by the presence of other LLU operators. High speed fiber broadband
allows firms to differentiate their offer from DSL-based services. Moreover, the presence
of cable operator stimulates deployment of fibre. Firms using DSL technology fear losing
consumers and being preempted by cable operator and deploy fibre technology in areas
covered by cable. We also find that the deployment of VDSL technology which allows higher
Internet speed on copper network slows down the deployment of fibre. Thus, firms choose
to upgrade copper lines on the legacy network instead of investing in fibre networks. We
use the estimates to calculate entry thresholds into local markets, which are much lower for
broadband provision via LLU than via fibre and decrease over time. The deployment of
fibre becomes cheaper over time but is unprofitable for the vast majority of municipalities
in France.
∗Telecom ParisTech, Department of Economics and Social Sciences, 46 rue Barrault, 75013 Paris, France.E-mail: [email protected]†Telecom ParisTech, Department of Economics and Social Sciences, 46 rue Barrault, 75013 Paris, France.
E-mail: [email protected]‡Corresponding author: Telecom ParisTech, Department of Economics and Social Sciences, 46 rue Barrault,
75013 Paris, France. E-mail: [email protected]
1

1 Introduction
Investments in next generation access networks are a priority for policymakers in all industri-
alized countries. The roll-out of fiber-optic networks delivering superfast broadband access to
the Internet is expected to improve productivity and stimulate growth and job creations (see
Roller and Waverman 2000; Czernich et al. 2011; Ahfeldt et al. 2015). In the US, the National
Broadband Plan aims at providing 100 Mbit/s connections to 100 million American households
by 2020.1 In Europe, the European Commission has set as a target that half of European house-
holds should have the ability to access the Internet at speeds of 100 Mbit/s or more by 2020.2
The roll-out costs of next generation access networks are, however, significant. For example, the
European Commission has estimated that it would cost between 181 and 268 billion euros to
achieve its target.3 Private operators deploying fiber also face the competition from the previous
broadband technology, which has been promoted in Europe through specific regulations.
Telecommunications have been subject to regulation since the opening to competition in the
1990’s, to limit the exercise of market power by incumbent operators and allow competition to
emerge. In particular, to foster entry and competition in the broadband market, Europe has
implemented in the early 2000’s wholesale access to the incumbents’ local network, a regulatory
policy known as “local loop unbundling” (or LLU). LLU requires incumbents to grant access to
their physical local copper infrastructure, at regulated prices, to enable entrants to provide DSL
(“digital subscriber line”) broadband services.
The introduction of LLU has generated heated policy debates. While LLU can facilitate
entry of alternative operators and allow the new entrants to acquire market experience progres-
sively, some (in particular incumbent) operators have argued that it may undermine investment
incentives for both incumbent and entrant operators.
Recently, the regulatory debate has centered on the impact of LLU on firms’ incentives to
roll-out next generation access networks. Due to their high deployment costs, fiber-optic access
infrastructures are likely to coexist with the legacy copper networks for some time. A report
commissioned by the European Competitive Telecommunication Association (WIK 2011) argued
1“Connecting America: The National Broadband Plan, Federal Communications Commission,” March 20102“A Digital Agenda for Europe,” European Commission, COM(2010) 245.3See COM(2010) 472 final.
2

that promoting LLU via low access prices would foster investments in fiber, while another report
written for European Telecommunications Network Operators (Plum 2011) concluded that it
would rather discourage fiber deployment.
Therefore, governments and regulators face a complex trade-off between encouraging com-
petition on the legacy copper network via LLU and providing industry players with the proper
incentives to roll-out fiber networks. However, even though this question is critical for both pol-
icymakers and academics, so far there exist only limited and a very high level empirical evidence
on the impact of regulation of legacy network on the roll-out of fiber networks.
In this paper, we analyze the impact of LLU on fiber investments using panel data on 36,080
municipalities in metropolitan France in years 2010-2014. The French market is interesting for
such analysis for the following reasons. First, the regulation of wholesale broadband access via
LLU in France has encouraged entry and competition since early 2000’s. Second, in the last years
fibre broadband has been deployed by the former telecommunications incumbent Orange and its
two main rivals, SFR and Free, which are also active in the provision of mobile services. Third,
there is a single cable network operator, Numericable, which has been upgrading its network
to a hybrid fiber-coaxial architecture allowing for Internet speeds comparable to fibre. Fourth,
since 2013 Orange and other DSL operators have been upgrading copper network towards VDSL
technology, which is more advanced than ADSL and provides consumers with Interne speed up
to 50 Mbp/s.
Following Xiao and Orazem (2011) and Nardotto, Valletti and Verboven (2015) we use panel
data on 36,080 municipalities in metropolitan France over the period 2010-2014 to estimate
two models of entry into local markets by: (i) the incumbent and two other operators using
fibre technology and (ii) operators seeking wholesale access to the legacy telecommunications
network via local loop unbundling (LLU). We estimate the role of sunk costs in entry decisions
using reduced form specification of profit function. In the model of fiber entry, we allow the
entry decision to depend on the local market presence of competing LLU operators, which
entered in the earlier periods and therefore may be considered as exogenous. We also consider
the impact of local market presence of cable operator on both fibre and LLU entry. When
estimating the models we take into account the role of observable local market characteristics
3

which are represented by population size, density of population, income, etc. and unobservable
characteristics represented by market-specific random effects.
We find that local market presence of LLU operators has a positive impact on entry by fibre
operators. We observe in the data that the deployment of fibre is always proceeded by the entry
via LLU. Based on the estimation results the decision to deploy fibre by the incumbent and
competitors is also positively influenced by the presence of other LLU operators. High speed
fiber broadband allows firms to differentiate their offer from DSL-based services. Moreover, the
presence of cable operator stimulates deployment of fibre. Firms using DSL technology fear
losing consumers and being preempted by cable operator and deploy fibre technology. This
also suggests that firms recognize that consumers care about the speed of connection and at
the same time being first in the market matters for building consumer base and recouping the
cost of investment. We also find that the deployment of VDSL technology which allows higher
Internet speed on copper network slows down the deployment of fibre. Thus, firms choose to
upgrade copper lines on the legacy network instead of investing in fibre networks.
We also find that market characteristics significantly impact the mode of entry. The main
variable influencing entry is the market size measured by the number of households in the
local market. Also, population density has a positive impact on fiber investment but its impacts
decreases over time, which means that operators are able to enter less densely populated markets
with time. We also find that the share of flats influences positively the probability of deploying
fiber, reflecting the lower cost of connecting a block of flats rather than single houses. Besides,
we show a positive effect of the quality of demand, in terms of purchasing market power, with the
positive impact of the income. We use the estimates to compute the entry thresholds for fibre
and LLU operators and how they change over time. The entry thresholds for LLU operators
are much smaller than for fibre operators, which reflects the scale of investment needed to enter
the market. Since LLU operators to a large extent rely on incumbent’s infrastructure the scale
of investment is much smaller.
Our results have important policy implications as they show that LLU regulation does not
impede fiber entry. Moreover, we show that the main variable that influences fiber deployment
is the market size. The market size required for an operator and for an additional operator
4

to enter the market is decreasing over time, which makes entry easier to enter less densely
populated municipality easier. However, fibre provision will remain unprofitable in the vast
majority of smaller municipalities in France. There is a critical role for public policy to foster
operators’ incentives to deploy fiber and enter less densely populated municipalities by means
of co-investment or cost-sharing.
The remainder of the paper is organized as follows. In Section 2, we review the relevant
literature on regulation and investment in the telecommunications industry. Section 3 intro-
duces the broadband industry in France. Section 4 presents the data. Section 5 introduces the
econometric framework. Section 6 presents the estimation results. Finally, Section 7 concludes.
2 Literature Review
Universal access to superfast broadband is on top of the public policy agenda in the European
Union. The contribution of this paper is to analyze how broadband provision on the incumbent’s
legacy copper network via local loop unbundling (LLU) influences entry and deployment of fiber
infrastructures. To the best of our knowledge, this is the first paper which at a granular local level
analyzes the deployment of fiber infrastructures and the impact of legacy broadband networks on
the deployment of next generation access infrastructures. Our results shed light on the ongoing
debate on the impact of LLU and the optimal policies to achieve universal access to high speed
broadband.
The linkage between access regulation and investment incentives has long been recognized in
the theoretical literature (see, for example, Valletti 2003; Hori and Mizuno 2006; Klumpp and Su
2010).4 A few recent studies look more specifically at the effect of access regulation on investment
incentives when the new infrastructure coexists with the legacy infrastructure (Inderst and Peitz
2012; Bourreau, Cambini and Dogan 2012 and 2014). They show that regulation of access to
the legacy network (via LLU, for example) has ambiguous effects on the incentives to roll-out
new infrastructures.
4See also Guthrie (2006) and Cambini and Jiang (2009) for comprehensive surveys. The relation betweenaccess and investment has generated heated policy debates, and a large number of policy papers have also addressedthis question; see, among others, Crandall, Ingraham and Sidak (2004), Hausman and Sidak (2005) and Hazlettand Bazelon (2005).
5

The empirical literature on fiber investments is rather scant. Many studies have analyzed
the effects of regulation and competition between technologies on the diffusion of the previous
generation of broadband using aggregate country-level data.5 Only few studies rely on more
fine-grained data; Dauvin and Grzybowski (2014) use NUTS 1 level data for the EU countries,
while Nardotto, Valletti and Verboven (2015) use microdata at the local level for the UK. In
general, competition is found to have a significant and positive impact on broadband diffusion
but with some differences with respect to the importance of inter- (when entrants build their
own infrastructure) and intra-platform (when entrants lease access to incumbents’ facilities)
competition. Only very few papers analyze investments in superfast broadband infrastructures.
Bacache, Bourreau and Gaudin (2014) analyze the migration from LLU to fiber in 15 European
Member States over the period 2002-2010. Briglauer (2015) studies the determinants of fiber
investments for the 27 EU Members over the period 2004-2013.6 These two studies use aggre-
gate country-level data. There are only two recent papers which use local market data. In a
recent paper, Minamihashi (2012) uses municipality-level data for Japan in years 2005-2009 and
finds that unbundling regulations imposed on the Japanese incumbent operator have prevented
entrants from self-deploying new broadband infrastructures. According to a counterfactual ex-
ercise unbundling regulation leads to a 24% decrease in the incidence of new infrastructure
builders. However, the incumbent’s NGA investments were not hindered by the unbundling reg-
ulation. In another paper, Fabritz and Falck (2013) use data on local exchange areas in the UK
in years 2007-2013 to analyze how the introduction of geographically differentiated regulation
of the wholesale broadband access influences investment in NGA network by the incumbents.
They find that deregulation has a positive effect on the roll-out of fibre.
Another growing body of literature analyzes competition between broadband technologies
from a consumer perspective. For instance, Cardona, Schwarz, Yurtoglu and Zulehner (2009)
use household survey data for Austria to estimate discrete choice models, and find that cable
modem and mobile access are close substitutes to DSL and therefore that they are in the same
market as DSL. Srinuan, Srinuan and Bohlin (2012) use survey data for Sweden to estimate
5See, among others, Distaso, Lupi and Manenti (2006), Denni and Gruber (2007), Lee and Brown (2008),Bouckaert, Dijk and Verboven (2010), Lee et al. (2011), Gruber and Koutroumpis (2013).
6See also Grajek and Roller (2012), who study the impact of pro-entry regulation on incumbents’ and entrants’aggregate investments.
6

a discrete choice model, and find that mobile broadband and fixed broadband technologies
are close substitutes when they are locally available. Finally, Grzybowski, Nitsche, Verboven
and Wiethaus (2014) estimate a mixed logit model using survey data for Slovakia, and find
that mobile broadband should be included in the relevant market for internet access based on
fixed broadband technologies. These studies provide evidence of competition between DSL and
other broadband technologies, but do not analyze how DSL regulation via LLU influences the
incentives to invest into fiber or into other high speed broadband technologies.
The literature on entry is mature and was excellently reviewed by Berry and Reiss (2007).
There are only few studies which analyze entry into telecommunications markets. This is due
to a lack of appropriate local-level data and the fact that the opening of telecommunications to
competition is relatively recent. Facility-based entry requires substantial capital investment to
materialize. Most of the studies focus on entry into local telecommunications markets in the US
prior to the FCC decision in 2004 to reverse its open access policy (see Greenstein and Mazzeo
2006; Economides, Seim and Viard 2008; Xiao and Orazem 2009 and 2011; Goldfarb and Xiao
2011), at a time when broadband was still in its infancy. Finally, Nardotto et al. (2015) study
the deployment of the broadband technology in the last decade in the UK. However, they do
not observe entry in high-speed broadband (fiber) in their period of analysis.
3 Broadband Industry in France
In France, five main operators compete in the retail broadband market: Orange, SFR, Free,
Bouygues Telecom and Numericable. Orange is the historical fixed-line incumbent operator.
It owns the legacy copper network, that it uses to provide voice and broadband services to
its customers, using the DSL technology. SFR, Bouygues Telecom and Free are alternative
operators, which do not possess their own copper network. To provide broadband services, they
have to lease access to the incumbent’s (Orange) local access network, via local loop unbundling
(LLU).7
Broadband can be delivered with different technologies: DSL, fibre, cable, Wifi and mobile
7There is also a competitive fringe of small private or public broadband operators, which often target specificmarket segments (e.g., business consumers).
7

broadband. In 2014, the respective market shares were 88% for the DSL technology, 3.6% for
fibre, 6.6% for cable modem, and 1.8% for other broadband technologies, such as WiFi, mobile
broadband and satellite.8
3.1 DSL
In France and in the European Union, the wholesale access to the copper local loop is regu-
lated. LLU has played a critical role in promoting broadband diffusion in France by enabling
competition between the incumbent and alternative operators which do not possess developed
local telecommunications infrastructure.9 Based on the ladder of investment theory, a phase of
service-based competition or intra-platform competition is a prerequisite for alternative opera-
tors to enter the broadband market. They can get information on the market, constitute their
customer’s databases and then they will have incentive to build their own network.
Figure (2) presents the architecture of local loop unbundling, also referred to as wholesale
local access. The copper network can typically be divided into three parts: access, backhaul
connections and core networks. The access network (often called local loop or “the last mile”)
establishes the connection between the end user’s premises and a main distribution frame (MDF)
at a MDF site, passing through a first network aggregation point, called street cabinet. These
elements belong to the incumbent operator. In order to provide Internet services, the alternative
operator builds its own backhaul connection and core network down to the incumbent’s MDF.
Then it connects its customers to its own broadband equipment (DSLAM) located within the
MDF, next to the incumbent’s DSLAM.
There are in total 16,315 Main Distribution Frames (MDFs) distributed across metropolitan
France, excluding Corsica, with about 33 million copper line connections, all of which as of 2014
8Source: ARCEP observatory - High and very-high speed Internet Retail market; SFR-Numericable 2014annual results.
9Pursuant to the 2000 European Community Regulation on unbundled access to the local loop, ’the localloop is the physical twisted metallic pair circuit in the fixed public telephone network connecting the networktermination point at the subscriber’s premises to the main distribution frame or equivalent facility’. Two typesof unbundled access to the local loop, namely full or shared unbundling can be implemented. The first one refersto ’the provision to a beneficiary of access to the local loop or local sub loop of the notified operator authorizingthe use [...] of the twisted metallic pair’. The latter one consists in ’the provision to a beneficiary of access to thelocal loop or local sub loop of the notified operator, authorizing the use of the non-voice band frequency spectrumof the twisted metallic pair; the local loop continues to be used by the notified operator to provide the telephoneservice to the public’.
8

are eligible to a DSL technology. In December 2014, more than half of the MDFs have been
unbundled, i.e., at least one alternative operator has installed its own active equipment inside.
Hence, almost 90% of the metropolitan population has access to unbundling offers. Until 2015,
SFR has been the main alternative operators, in terms of unbundled MDFs. In March 2015,
Free had unbundled 6,980 MDFs compared to 6,764 for SFR. In contrast, Bouygues Telecom had
only unbundled 985 MDFs. Unlike SFR and Free, the third biggest alternative DSL operator,
Bouygues Telecom, favored DSLAM renting. Instead of unbundling Orange local loop, it rents
a broadband access to another operator, either the incumbent or an unbundling operator.
In order to increase the speed delivered through the copper network, a faster technology,
called VDSL has been implemented.10 It requires deploying fiber downstream to the sub local
loop (between the MDF and street cabinet), where the DSLAM will then be located. In October
2013, the French telecommunications regulator ARCEP authorized the use of a second generation
of VDSL, called VDSL2, which can deliver speed superior or equal to 30MB/s.11 VDSL2 is
cheaper to deploy than FttH network because the copper local loop or the last mile is still
used, i.e. between the street cabinet and the customer’s premises. See Figure 1 for better
understanding. According to ARCEP in the fourth quarter of 2014, approximately 8,500 MDFs,
covering 91% of the population, have been equipped with VDSL2.12
3.2 Optical Fiber
From 2010 onwards, DSL operators have started to invest in Fiber to the Home network (FttH)
in order to provide high speed broadband services on the retail market. Fiber optic networks
are rolled-out up to the customer’s premises and can carry video, data, voice and interactive
video-telephone services.
Orange and SFR are the most active in FttH deployment. They deploy not only in very high
10VDSL stands for very high bit rate digital subscriber line. This technology is also called Fiber to theNeighborhood (FttN).
11In 2013, the authorization to implement VDSL2 only concerned lines in direct distribution, i.e, only the lineswhich are directly connected to a MDF.Since October 2014, ARCEP generalized the use of VDSL2 to all eligiblelines, i.e., all lines connected to a street cabinet.
12Another solution which has been implemented by Orange to improve broadband speed in rural areas, wheresome lines were not eligible to ADSL, was the creation of MDF shadow zones. The idea was to reduce the linedistance by creating a new MDF next to the street cabinet, where the DSLAM would be placed. However, thissolution has been stopped with the development of VDSL.
9

density areas, but also in less densely populated areas. In January 2010, Orange and SFR signed
a co-investment agreement, mostly to deploy FttH in areas which are less densely populated.13
In October 2014, Numericable aquired SFR threatening the viability of the 2010 co-investment
agreement since some areas are also covered by the cable network of Numericable.14
Numericable, is the cable-operator. It provides broadband services on the retail market
using its co-axial cable network. Its footprint is, however, somehow limited, as only 30% of
the population, mostly located in urban area, are within its coverage. From 2007 onwards,
Numericable has started to upgrade its cable network by using DOCSIS 3.0 standard. Unlike
FttH operators, Numericable does not deploy a new network, instead it brings fiber downstream,
until the last amplifier (Fiber to the Last Amplifier or FttLA). It keeps relying on its co-axial
local loop to provide broadband services to its customers. Numericable is at present, the biggest
operators on the high speed broadband segment.
Free deploys its own FttH network in very high density areas and co-invests in less densely
populated areas. In July 2011, Free signed a co-investment agreement with Orange to deploy
FttH in 60 agglomerations located in less densely populated areas. In 2014, another 20 munici-
palities have been added to the list. Since August 2012, Free has almost stopped deploying its
optical distribution frames. In December 2014 it had deployed its optical distribution frames
(ODF) in 230 sites as compared to 226 in August 2012. At the same time Free has intensified
its unbundling strategy and transfers its DSL subscriber towards the VDSL2 protocol.
Bouygues Telecom does not deploy its own FttH network, but rather offers retail fiber services
by subscribing to Numericable’s bitstream offer on its ugraded cable or FttLA network. In
addition, in December 2010, Bouygues Telecom has signed a co-investment agreement with
SFR to cover few agglomerations in very high density areas. In January 2012, it has also
signed a co-investment agreement with Orange concerning FttH deployment in both less densely
populated and very high density areas. As of December 2014, Bouygues Telecom fiber offers were
commercially available in 6 agglomerations, namely Paris, Lyon, Marseille, Toulouse, Bordeaux
13In frame of a co-investment agreement, there is one leading operator, which deploys the FttH network. Theother operator participates to the financial cost in proportion of the market share it wants to obtain. However, wecould not get information on the local market share targeted by the co-investors. We also do not have informationon the municipalities covered by any of the co-investment agreements.
14In April 2014, Numericable aquired SFR. The merger has been cleared by the Competition Authority in the27th October 2014
10

and Nice. Bouygues Telecom keeps also unbundling Orange’s MDFs. However, due to a lack
of data on the municipalities concerned by Bouygues Telecom FttH co-investment and FttLA
bitstream access, it has been excluded from the scope of the study.
Other smaller private operators concentrate their investments in large municipalities or
medium municipalities located in less densely populated areas. Many municipalities or de-
partments across the country deploy FttH network or a mix of technologies, such as FttH,
VDSL2, satellite or wireless local access to provide high speed Internet connection into rural
areas. However, the analysis of public investment or its impact on private investment is out of
the scope of the paper.
The roll-out of the horizontal segment of FttH networks is well undergone. According to
ARCEP observatory, in December 2014, 4,064,000 housings were eligible to FttH and 356,000
households had subscribed to an FttH offer, i.e. a rise of 37% and 91% respectively compared to
December 2013. Besides, 8,707,000 households were eligible to Numericable’s FttLA offer. All
fiber operators have chosen to apply a 5 euros mark up on the retail market compared to the
price of broadband offers. As such, customer’s migration toward FttH or FttLA Internet offers
is enhanced.
3.3 Regulatory Framework
Legal certainty is of prime importance for private investments to occur. Onward 2008, with the
adoption of the Law on Modernising the Economy, public authorities have adopted a series of
measures to facilitate the roll-out of next generation access network, especially fiber network
and achieve full coverage of the French territory by 2022.
ARCEP has contributed to define a secure and clear regulatory framework which includes
both symmetrical obligations, i.e., which apply to all operators, and asymmetrical obligations,
i.e. which apply only to Orange. In this respect, in its 2008 market analysis of markets 4 and 5,
ARCEP has compelled Orange to provide access to its civil engineering, ducts and pole, under
transparent, non-discriminatory and cost-oriented conditions and to publish a reference offer.15
15Market 4 of Wholesale (physical) network infrastructure access (including shared or fully unbundled access) ata fixed location. Market 5 of Wholesale broadband and ultra-fast broadband network access including bitstream’access at a fixed location.
11

Access to existing infrastructure is seen as a prerequisite to ensure dynamic competition in the
deployment of FttH network. Civil engineering represents the highest costs of deployment, the
FttH council has estimated, in 2014, that “about 2.5 billion Euros was saved over five years
by eliminating civil works for new cables in France, and similar savings could be made in the
coming five years. The huge cost savings from duct sharing can dramatically improve the return
on investment for FTTH projects”.16
In addition, to avoid the pitfall of monopolisation, ARCEP has imposed symmetrical access
obligations to all operators deploying a fiber optical network.17 Hence, any operators deploying
an FttH network must grant access to its network, access prices are defined commercially by
the operators and a public offer shall be published. Besides, to take account of geographical
differentiation and promote investment, France has been segmented in two zones: the very high
density areas and the other areas.
In very high density area, where dynamic competition already exists, ARCEP promotes
infrastructure-based competition. In these areas, it is economically feasible for several operators
to deploy their own network until the consumers’ premises.18 On the contrary, in less densely
populated areas, ARCEP promotes co-investment for the last mile of the network from the optical
distribution frame to alleviate the costs of FttH roll-out. In these areas, it is not economically
feasible for several operators to deploy their own fiber network, however, network co-investment
between two or more operators leads to cost-cutting and improve profitability. As a result,
operators wishing to deploy an FttH network in these less densely populated areas have to
publish a call for co-investment and co-invest with any operators interested.
Yet, in some sparsely populated areas, despite co-investment, private investment is unlikely
to occur. In some of those non-profitable areas, where a lack of private incentive to invest has
been assessed, local governments can deploy their own public network.19 We do not address the
question of public intervention in this analysis.
In December 2009, ARCEP had identified 148 municipalities located in very high density
16Source: White Paper: Innovative FTTH Deployment Technologies By the Deployment & Operations Com-mittee
17ARCEP is enabled to define general obligations which apply uniformly to all stakeholders as soon as theseobligations have been homologated by the Minister in charge of telecommunications
18ARCEP Decision Nr 2009-1106 from the 22nd December 200919Call for manifestation of incentive to invest 2009
12

areas, representing 5.54 million households.20 In 2013, taking into account practical considera-
tions and the technical and financial conditions surrounding fiber deployment, ARCEP removes
43 municipalities, corresponding to 547,000 households from the list of high density areas. This,
in turns, strengthens the principle of co-investment or cost-sharing on these municipalities facil-
itating the roll-out of fiber network. On the contrary, one municipality, Poitier, has been added
to the list of the very high density area, based on the deployment that had already happened.
The 2013 Decision brings also a modification inside the definition of the very high density ar-
eas, by identifying low-density pockets. Inside low-density pockets, the principle of network
co-investment also applies. The localization of the concentration point and the condition of
vertical deployment differs from the other areas.21
4 The Data
The main data on optical fiber deployment constitutes a panel of fiber deployment in metropoli-
tan France (Corsica excluded) over 5 years, from 2010 to 2014. They have been extracted from
Orange’s Information System and from SFR’s website. Both databases provide information at
the municipality level with each municipality identified by a unique geographic code (the INSEE
code). We have information on 36,080 French municipalities out of the 36,192 municipalities
counted in metropolitan France in 2014. The Corsican region and the French overseas territories
are excluded from the database due to a lack of information. For each municipality, we know
whether Orange and/or SFR has deployed an FttH network. In the original dataset from Or-
ange’s Information System, we had information on the deployment state of each concentration
point. For the year 2014, the data have been extracted only when the concentration point was
20The list of very high density area has been defined following a socio-economic approach (instead of anadministrative one) starting from the agglomeration level (instead of the municipality level). Only the principalFrench agglomerations densely populated, whose urban units count more than 250,000 inhabitants and wherebuildings of more than 12 flats represent at least 20% of housing (single houses included). 20 agglomerationsrepresenting 148 municipalities have been identified as very high density zone in 2009.
21As regards vertical deployment, the Law on Modernising the Economy imposes to co-invest in the last mileof the network deployed in-building. Only one operator, the building operator, deploys fiber in the building. Inits 2009 decision, ARCEP imposes to building operators to deploy in very high density areas a dedicated fiber fortheir competitors, if they asked for and co-finance it. This solution aims at reducing the costs of deployment andremedies to the inconvenience of having multiple interventions in the same building. This regulation comes withthe creation of a right of access or right of use of the vertical fiber network by commercial operators. Therefore,customers have the choice between different competing high broadband offers.
13

declared as “deployed”. The two other states “in deployment” and “planned” have been ex-
cluded as no timeline was given for their actual deployment. However, their exclusion does not
lessen the relevance of the final dataset. Indeed, for each municipality in which an FttH network
is deployed, several concentration points coexist. As a result, we assume that, in a municipality
where a horizontal network has been deployed, there is at least one concentration point declared
as deployed.
Regarding the data extracted on SFR’s website, two sources have been used. First, SFR has
published on its website a map of France and a list of municipalities in which it has deployed
or will deploy an FttH network. For each municipality, we know whether SFR has planned
to deploy its network alone or in co-investment with another operator. However, for the year
2014, no timeline was provided for the deployment. As a result, to determine whether SFR has
effectively deployed an FttH network in the municipality, we crossed these data with a press
release, published on its website, listing the municipality where households can subscribe to its
FttH offers as of October 2014.
Regarding Free’s data, they have been extracted on an unofficial website updated by Free’s
users community. The data are consistent with information gathered on other websites, as well
as with Free’s Annual Reports. For each municipality, we know whether there are active fiber
connections.
This database has been completed with four other sources. First, variables on the copper
network have been taken from two databases coming from Orange’s Information System for the
years 2010 to 2014. They inform us on the number and identity of the unbundling operator as
well as on the number of VDSL lines both at the Main Distribution Frame (MDF) and at the
municipality level.
Second, data on cable upgrade to FttLA have been extracted from Numericable’s website
for the years 2010 to 2014. For each municipality, we know whether Numericable has upgraded
its cable network to provide very high broadband services.
Third, socio-demographic characteristics come from INSEE, the French National Institute
for Statistics and Economics Studies. INSEE publishes data at the municipality level such as
population density, population, number of housing and economic data such as the unemployment
14

rate. Some municipality characteristics are also extracted from INSEE databases, such as the
municipal urbanization degree, the type of economic or political zones with the employments
zones and the canton-ville zones. These information have all been collected by INSEE for the
years 2008 to 2012 and have been published 2 years later. As such, lagged values have been
created, as it could be considered that to make their decision, operators take account of the most
recent information they can get. Data on the average fiscal income per municipality has been
collected on the General Direction of Public Finance’s website (Gouvernment Taxes Services,
DGFIP) for the years 2010 to 2014.
The different databases have been merged using the INSEE code which uniquely identifies
a municipality. This code was nevertheless not included in the dataset coming from SFR,
Numericable and SNCF. As a substitute, we use the name of the municipality associated with
the department number in the merging process.
After merging the databases, we have information on 99.7% of the French metropolitan mu-
nicipalities (excluding Corsica). There are 112 municipalities out of the 36,192 counted in 2014
which are missing from the final dataset, which is due to evolution of the administrative scope
of these municipalities between 2012 and 2014. In the meantime, some municipalities have been
split into two different new municipalities and some others have been merged, resulting in a mod-
ification of the name and INSEE code of the municipalities. The latest socio-demographic and
municipality characteristics data are from 2012, whereas the lastest data on FttH deployment,
cable upgrade and on the copper network are from 2014, as reported in Table (??)
5 Econometric Model
In this section we derive a model of entry of providers of broadband services in France. We use
the model to answer the main question of our paper which is whether LLU has an impact on
the entry and deployment of FttH. Moreover, we analyze what are the determinants of entry
into local markets with broadband services via FttH and LLU.
As discussed in Section (3), to provide Internet services the alternative operator builds its
own backhaul connection and core network down to the incumbent’s MDF and then connects
customers to its own broadband equipment (DSLAM), which is located within the MDF, next
15

to the incumbent’s DSLAM. There are therefore capital investments needed to enter local mar-
kets via LLU. The deployment of FttH requires even greater capital investments because every
household needs to be connected to the backbone with optical fiber. The infrastructure fixed
costs can be divided into country- and local market costs. The country-level fixed entry costs
are related to the deployment and maintenance of backbone infrastructure, administration, mar-
keting, etc. The local market entry fixed costs are related to the connection of the backbone
infrastructure to the local market and deployment of the network within the local market. These
costs differ locally because of factors such as geographic area to be covered as well as the size and
distribution of population. After the infrastructure is deployed the marginal costs are relatively
small and may include modem rental expenditures and customer services. There are therefore
economies of scale both on the country and local market level since the average costs decline
with the number of connected consumers. The presence of economies of scale implies that only
a certain number of entrants can be accommodated by a market of given size, which is more
stringent when the price is fixed on the country-level.
The previous literature on entry into provision of broadband services considered that the
investments made by LLU operators are sunk (see Xiao and Orazem (2011) and Nardoto et al.
(2015)). We estimate two models with and without sunk entry costs. In the model with sunk
entry costs, their identification is based on a comparison of entry thresholds for markets which
have experienced entry to thresholds for markets experiencing no entry. There is a difference
in the decision problem of the entrant and incumbent. While the entrant will only enter when
market size is big enough to cover their entry costs, incumbent firms do not take entry costs
into consideration when deciding whether to continue operations. The existence of sunk entry
costs means that it takes less demand to sustain an incumbent than to support a new entrant.
In France, we do not observe fibre operators exiting local markets but there are some exists of
LLU entrants, as shown in Tables (1) and (2). Since we observe that firms always continue to
operate fibre network, the fixed costs of maintaining the local network must be relatively small.
In an extreme case, when fixed costs are zero, firms would never exit.
As discussed in Section 3, there are four main market players: Orange, SFR, Free and
Numericable, which differ with respect to the broadband technology deployed and the timing
16

of entry. The previous fixed-line incumbent operator, Orange, covered the whole country with
xDSL technology by 2007 and deploys FttH alone or in co-investment with SFR or Free. SFR
provides xDSL services based on the incumbent’s copper infrastructure via LLU and deploys
FttH alone or in co-investment with Orange or Free. Similarly, Free provides xDSL services
via LLU and deploys fibre network alone or in co-investment with Orange or SFR. Finally,
Numericable owns cable network which has been upgraded to provide broadband services and
provides xDSL services via LLU. In April 2014, Numericable acquired SFR and since then these
two firms should be considered as a single profit maximizer. Table (1) shows the number of
municipalities in which these three operators entered with FttH and Numericable upgraded its
cable network. The remaining firms on the market provide xDSL broadband via LLU or mobile
broadband.
The following facts matter for the decision of broadband operators to enter local market.
Operators sets nationwide prices without geographic differentiation in dependence on the num-
ber of other entrants. Since there is usually a single broadband connection to a household, the
total demand in local market is defined by the number of households. Consumers can substitute
between broadband access via xDSL or FttH connections, where the latter offers higher connec-
tion speed and therefore higher quality. Moreover, we observe that SFR and Free deploy fiber
only in markets in which they also provide broadband services via xDSL.
First, we consider operator’s decision to deploy fiber technology. Market demand is stochas-
tic. At the end of each time period, firms decide whether to enter new local markets and whether
to operate in the old ones in the next period. They form expectations about market demand,
cost levels and competition with other firms. The expectations are fulfilled in equilibrium. The
number of fiber entrants in municipality i at time t is denoted by Nit = n, where n = {0, 1, 2, 3}.
Following Xiao and Orazem (2011) and Nardotto et al. (2015), with n-1 competitors, the dis-
counted value of future profits of nth firm in market i at time t can be written as:
πnit = πnit + εit ≡ αtlnSit +Xitβ + Zitγ − µnI(Nit = n) + ηi + εit (1)
where Sit is the potential market size approximated by the local population size, Zit is a vector
of other demographic and geographic characteristics of municipalities which are potential profit
17

determinants, such as the density of population, share of flats in the total number of residencies,
income, the rate of unemployment and the number of firms which are registered locally, µnt is
a fixed effect describing the negative profit effect from the nth firm and εit is an i.i.d. standard
normal random variable, capturing unobserved profit determinants. Our model differs from Xiao
and Orazem (2011) and Nardotto et al. (2015) in that we include market-specific effects denoted
by νi, which should control for unobserved to us but observed by the firms market-specific factors
which determine entry. We estimation both a model with and without market fixed effects and
comment on their importance.
In addition, the profits of FttH operators are affected by substitution/complementarity with
other technologies either provided by themselves or competitors, which are denoted by Xit. We
create a variables which is the number of LLU entrants locally including SFR and Free. Since
SFR and Free deploy FttH only in areas in which they are already present with LLU offer,
there must be a positive effect of entry via LLU on FttH deployment by the same firm. Their
effect on the FttH deployment by Orange may be negative or positive. A negative effect may
be due to lower incentives of Orange to invest in areas in which it has to provide LLU access. A
positive effect may be due to incentives to differentiate via provision of higher quality services.
The overall effect on the FttH entry is ambiguous. The effect of competitors’ LLU entry on the
deployment of fibre by Orange, SFR and Free is also ambiguous. Firms may stay away from
investing in markets with more competition or may invest more to differentiate their own offer
from competitors. The incentives to invest will certainly depend on the position of firms in
particular markets reflected in market shares on which we lack information. We consider the
number of LLU entrants to be exogenous since entry via LLU by SFR, Free and other firms
took place before the deployment of fibre technology. Moreover, the speed of xDSL services may
impact the willingness of consumer to switch to fiber and firms may be less willing to deploy
fiber in municipalities with a higher share of lines upgraded to VDSL. We have information on
the share of VDSL lines in a municipality but the upgrading process started only in 2013 and
the share is still too small to identify a significant effect. Instead, we create a dummy variable
for municipalities with nonzero share of VDSL lines. We also treat this variable as exogenous
even though firms may strategically decide not to deploy fibre and invest in upgrading xDSL
18

lines instead.
The equation (1) is reduced form and does not allow to distinguish how the number of
competitors affects the variable profits function and the fixed costs function, as in Bresnahan
and Reiss (1991). The model also does not allow for simultaneous entry and exit and instead
focuses on the marginal entering or existing firm’s expected profitability from operating in the
next period. Moreover, in the model with sunk entry costs we assume that all entrants incur
the same entry costs regardless of the order of entry.
The profits πnit include the non-sunk part of fixed costs. Firms also incur a sunk cost SC to
enter a market, which cannot be recouped when they exit. Profits are unobserved and πnit is a
latent variable but it is still possible to draw inferences on the profit determinants by assuming
a free entry equilibrium, where firms enter if and only if such move is profitable. There are three
possible situations that would generate the observation of n firms in market i at time t:
(1) One or more firms have entered and there were fewer than n firms at time t− 1, or Nmt >
Nmt−1. For the nth firm, the expected discounted value of entry exceeds sunk costs of entry,while
for the n+ 1st firm not. This can be expressed as:
Case 1, net entry: Nit > Nit−1 if πnit ≥ SC and πn+1it < SC (2)
(2) No firm has entered or exited a market with n firms, or Nmt = Nmt−1. The nth firm from
period t − 1 has decided to stay because its expected discounted values of continuation exceed
0, while the n+ 1st firm has expected a loss from entry:
Case 2, inaction: Nit = Nit−1 if πnit ≥ 0 and πn+1it < SC (3)
(3) One or more firms have exited and there were more than n firms at time t−1, orNmt < Nmt−1.
The market has become unprofitable when more than n firms stayed operating. The marginal
n + 1st firm expected that it would be unprofitable to stay in the market and when this firm
left, the nth firm expected otherwise:
Case 3, net exit: Nit < Nit−1 if πnit ≥ 0 and πn+1it < 0 (4)
19

We do not observe Case 3 in the case of FttH entry model, which as mentioned above may be
because the fixed costs component, which is not sunkm is relatively small.
Using the profit specification (1), the above inequalities can be combined to obtain the
following probability of observing Nit = n entrants in market i at time t:
Pr(Nit = n) = Φ(πnit − SC · I+it )− Φ(πn+1it − SC · (I+it + I0it)) (5)
where Φ(.) denotes the cumulative normal distribution function, and I+it ≡ I(Nit > Nit−1) are
indicator variables to denote whether entry increased (+) or remained constant (0).
Notice that if there are no sunk costs, SC = 0, then the model is static and reduces to a
standard ordered logit or probit. The parameter vector θ = [αt, β, γ, µn, η, ση] is estimated by
maximizing the following log-likelihood function:
LL(θ) =
M∑i=1
T∑t=1
N∑n=1
yit ln(Pr(Nit = n)|θ) (6)
where yit takes value of 1 if Nit = n and zero otherwise.
Since as shown in Table (3) Orange is the market leader in deployment of FttH, we also
estimate a model in which the 0-1 entry decision by Orange is regressed on the same set of
explanatory variables.22 In this way we analyze whether Orange is less likely to deploy FttH in
areas in which there is LLU and whether upgrading DSL lines to VDSL discourages deployment
of FttH.
Next, we analyze the determinants of entry via LLU, which in general took place before
the deployment of fiber. Table (2) shows the number of municipalities, in which SFR, Free,
Numericable and other operators entered via LLU. The discounted value of future profits may
be written in analogous way to (1), but in this case n = {0, 1, 2, 3, 4, 5}. Since there was a
small number of markets with more than five entries, we truncated the number of entries with
22In principle, whenever there is only one FttH operator in a municipality, the operator is Orange. Wheneverthere are two operators, with a small margin of mistake, the operators are Orange and SFR. We observe thatOrange is present in 804 out of 819 municipalities, in which there are two entrants, and in 429 out of 475municipalities with only one entrant. Furthermore, we observe that SFR is present in 781 out of 819 municipalitieswith two entrants and it is present alone only in 14 municipalities. Finally, Free is present in only 53 out of 819municipalities in which there are two entrants and it is a single operator in 32 out of 475 municipalities.
20

five. Even though the functional forms which we use are similar for xDSL and fiber, the costs
of entry are substantially lower in the case of LLU and the prices for xDSL are also lower due
to lower transfer speed. In the estimation, we use the same set of demographic and geographic
characteristics as determinants of profits, except the LLU-related variables denoted by Xit. We
also do not consider that the presence of FttH and cable in a municipality had impact on the
entry via LLU. In general, LLU entry took place before deployment of FttH and before cable
was upgraded to broadband provision.
6 Estimation Results
Table (6) shows the estimation results for FttH entry. Model I is estimated without sunk costs
(simple ordered logit model) and Model II allows for non-zero sunk cots [TO BE ESTIMATED].
The main variable which determines FttH entry is the market size, which is represented
by the number of households in the municipality. Also, the population density denoted by the
number of households divided by the surface has a significant positive impact on FttH entry,
which decreases over time. This means that FttH is more profitable in densely populated areas
but over time it becomes easier to enter less densely populated areas.
We find that the local market presence of competing technologies: xDSL, cable and VDSL
has a significant impact on FttH deployment. In particular, we observe in the data that the
deployment of fibre by SFR and Free is always proceeded by the entry via LLU. Overall, the
local market presence of SFR and Free via LLU has a positive impact on FttH entry by these
two firms and Orange. SFR and Free may have incentives to develop own fibre network to avoid
paying wholesale access charges and steal consumers from competitors which utilize copper
network. Thus, SFR and Free use LLU as a stepping stone into the provision of high speed
broadband services. On the other hand, the main investor in fibre network, Orange, may have
incentives to differentiate itself from the competitors xDSL offers of competitors. Our results
support the ladder of investment (LoI) theory suggesting that the main operators start providing
broadband services in selected municipalities using incumbent’s infrastructure via LLU, and then
follow up with FttH networks deployment. At the same time, the incumbent is not stopped from
investing in fibre network. Overall, the LLU entry has also a positive impact on fibre deployment
21

by Orange, SFR and Free. Also in this case firms have incentives to differentiate themselves
by providing consumers with high speed Internet services based on fibre. In the estimation, we
consider that LLU entry is exogenous, which is justified by the fact that SFR and Free entered
via LLU before deploying fibre services. A situation in which LLU entry does not take place
because fibre is being deployed in the local market is very unlikely. We also estimated a model
with lagged LLU presence variables which yields very similar results.
We also find that FttH entry is more likely in areas in which there the sole cable operator
Numericable upgraded its network to provide high speed broadband services. This result sug-
gests that fibre operators recognize that consumers care about the speed of connection and at
the same time being first in the market matters for building consumer base and recoup the cost
of investment. In practice, we observe that the marketing strategy of FttH operators to gain
customers is more aggressive in municipalities covered by cable. On the other hand, upgrading
DSL lines to VDSL tends to reduce incentives to deploy fiber. The fibre operators which provide
DSL services on the legacy network via LLU and invest in VDSL or VDSL2 technology offering
Internet speed up to 30 Mbp/s have lower incentives to deploy fibre network. The negative
effect suggests that FttH and VDSL connections are strategic substitutes. The deployment of
cable network and VDSL lines may be endogenous and correlated with the unobserved market
shocks. The endogeneity problem may be mitigated by inclusion of unobserved market specific
effects. Optimally, we should use instrumental variables estimation approach.
The scope of FttH deployment is limited by the local markets demographic and geographic
characteristics. The main variable influencing entry is the market size measured by the number
of households in the local market. Also, population density has a positive impact on fiber
investment but its impacts decreases through the years, which means that operators are able
to enter less densely populated markets with time. The share of flats in the total number of
residencies has a positive impact on FttH entry which may reflect lower cost of deploying fiber
in areas with many apartment blocks. Furthermore, we find that a higher level of income has
a positive impact on FttH entry, while unemployment is insignificant. These two variables
approximate the quality of demand in terms of purchasing power.
Table (7) shows the estimation results for LLU entry. Model I is estimated without sunk
22

costs and Model II allows for non-zero sunk costs. Based on the value of log-likelihood function
the preferred model is the model with sunk costs, which we use to interpret the estimation
results. Also in this case, the main variableS which determine LLU entry are the number of
households and density of population represented by the number of households divided by the
surface. The interaction terms of density with time dummy variables are significant but, contrary
to the estimates for fibre, do not indicate a particular trend. At the same time, the coefficients
of time dummies increase over time. The share of flats in the total number of residencies is not
significant. Furthermore, we find that a higher level of income has a positive impact on LLU
entry and surprisingly a higher unemployment rate also has a positive effect.
We use the estimates to compute entry thresholds for fibre and LLU operators and their
changes over time. For each market i at period t we calculate entry threshold for n = 1, 2, 3
FttH operators by solving for the critical market size which sets the mean profits to zero:
Snit = exp((Zitδ − µnt I(Nit = n) + Xitθ + νi)/γt). The thresholds are market specific due to
observed and unobserved market factors. The average thresholds are shown in Table (8). The
entry thresholds for LLU entry at particular points in time are shown in Table (9). The entry
thresholds for LLU operators are much smaller than for fibre operators which reflects the scale
of investment needed to enter the market. Since LLU operators rely mainly on incumbent’s
infrastructure the investments needed for entry are much lower.
7 Conclusion
In this paper, we analyze the impact of LLU on fiber investments using panel data on 36,080
municipalities in metropolitan France in years 2010-2014. We estimate two models of entry
into local markets by: (i) the incumbent and two other operators using fibre technology and
(ii) operators seeking wholesale access to the legacy telecommunications network via local loop
unbundling (LLU).
We find that local market presence of LLU operators has a positive impact on entry by fibre
operators. We observe in the data that the deployment of fibre is always proceeded by the entry
via LLU. Based on the estimation results the decision to deploy fibre by the incumbent and
competitors is also positively influenced by the presence of other LLU operators. High speed
23

fiber broadband allows firms to differentiate their offer from DSL-based services. Moreover, the
presence of cable operator stimulates deployment of fibre. Firms using DSL technology fear
losing consumers and being preempted by cable operator and deploy fibre technology. This
also suggests that firms recognize that consumers care about the speed of connection and at
the same time being first in the market matters for building consumer base and recouping the
cost of investment. We also find that the deployment of VDSL technology which allows higher
Internet speed on copper network slows down the deployment of fibre. Thus, firms choose to
upgrade copper lines on the legacy network instead of investing in fibre networks.
We also find that market characteristics significantly impact the mode of entry. The main
variable influencing entry is the market size measured by the number of households in the
local market. Also, population density has a positive impact on fiber investment but its impacts
decreases over time, which means that operators are able to enter less densely populated markets
with time. We also find that the share of flats influences positively the probability of deploying
fiber, reflecting the lower cost of connecting a block of flats rather than single houses. Besides,
we show a positive effect of the quality of demand, in terms of purchasing market power, with the
positive impact of the income. We use the estimates to compute the entry thresholds for fibre
and LLU operators and how they change over time. The entry thresholds for LLU operators
are much smaller than for fibre operators, which reflects the scale of investment needed to enter
the market. Since LLU operators to a large extent rely on incumbent’s infrastructure the scale
of investment is much smaller.
Our results have important policy implications as they show that LLU regulation does not
impede fiber entry. Moreover, we show that the main variable that influences fiber deployment is
the market size. The market size required for an operator and for an additional operator to enter
the market is decreasing over time, which makes entry easier to enter less densely populated
municipality easier. However, fibre provision will remain unprofitable in the vast majority of
smaller municipalities in France. The policy makers can stimulate deployment of FttH by
allowing firms to co-invest which will reduce entry costs and by ensuring that the investment
profitability will not reduced by wholesale access regulation. Private operators will be more
prone to invest into fiber in less densely populated area if they set commercially the wholesale
24

access fee and anticipate higher wholesale revenue. This finding confirms ARCEP policy, unlike
the European Commission recommendation to regulated NGA infrastructure access. In other
areas, where market characteristics show that the local market is not economically profitable,
there is a rationale for public investment. Eventually, private operators decisions of entry into
fiber are also based on the potential revenue expected from a local market and its “quality” in
terms of expected demand as well as on the cost of deployment. Therefore, there are grounds for
the use of demand stimulation policy, which by enhancing the demand, will indirectly enhance
operators incentives to invest.
25

References
Ahlfeldt, G., Koutroumpis, P. and T. Valletti (2014). “Speed 2.0 – Evaluating access to
universal digital highways,” Journal of the European Economic Association, forthcoming.
Bacache, M., Bourreau, M. and G. Gaudin (2014). “Dynamic Entry and Investment in New
Infrastructures: Empirical Evidence from the Fixed Broadband Industry,” Review of In-
dustrial Organization, 44(2), 179–209.
Berry, S. (1992). “Estimation of a Model of Entry in the U.S. Airline Industry,” Econometrica,
60(4), 889–917.
Berry, S. and P. Reiss (2007). “Empirical Models of Entry and Market Structure,” In: Arm-
strong, M. and R. Porter (eds), Handbook of Industrial Organization, Elsevier, Volume 3,
1845–1886.
Bouckaert, J., van Dijk, T. and F. Verboven (2010). “Access Regulation, Competition, and
Broadband Penetration: An International Study,” Telecommunication Policy, 34, 661–671.
Bourreau, M., Cambini, C. and P. Dogan (2012), “Access pricing, competition, and incentives to
migrate from “old” to “new” technology,” International Journal of Industrial Organization,
30(6), 713–723.
Bourreau, M., Cambini, C. and P. Dogan (2014), “Access regulation and the transition from
copper to fiber networks in telecoms,” Journal of Regulatory Economics, 45(3),233–258.
Bresnahan, T. and P. Reiss (1991a). “Entry and Competition in Concentrated Markets,”
Journal of Political Economy, 95, 977–1009.
Bresnahan, T. and P. Reiss (1991b). “Empirical models of discrete games,” Journal of Econo-
metrics, 48(1), 57–81.
Brito, D., Pereira, P. and J. Vareda (2012). “Incentives to invest and to give access to non-
regulated new technologies,” Information Economics and Policy, 24(34), 197–211.
26

Cardona, M., Schwarz, A., Yurtoglu, B.B. and Ch. Zulehner (2009). “Demand Estimation and
Market Definition for Broadband Internet Services,” Journal of Regulatory Economics,
35(1), 70–95.
Crandall, R., Ingraham, A. and H. Singer (2004). “Do unbundling policies discourage CLEC
facilities-based investment,” Topics in Economic Analysis & Policy, 4(1), Article 14.
Crandall, R. and G. Sidak (2007). “Is Mandatory Unbundling the Key to Increasing Broadband
Penetration in Mexico? A Survey of International Evidence,” Mimeo.
Czernich, N., Falck, O., Kretschmer, T., and L. Woessmann (2011). “Broadband Infrastructure
and Economic Growth,” The Economic Journal, 121, 505–532.
Dauvin, M. and L. Grzybowski (2014). “Estimating broadband diffusion in the EU using NUTS
1 regional data,” Telecommunications Policy, 38(1), 96–104.
Denni, M. and H. Gruber (2007). “The Diffusion of Broadband Telecommunications in the
U.S. – The Role of Different Forms of Competition,” Communications & Strategies, 68,
139–157.
Distaso, W., Lupi, P. and F.M. Manenti (2006). “Platform Competition and Broadband Up-
take: Theory and Empirical Evidence from the European Union,” Information Economics
and Policy, 18, 87–106.
Economides, N., Seim, K. and V.B. Viard (2008). “Quantifying the benefits of entry into local
phone service,” RAND Journal of Economics, 39, 699–730.
Goldfarb, A. and M. Xiao (2011). “Who Thinks about the Competition? Managerial Ability
and Strategic Entry in US Local Telephone Markets,” American Economic Review, 101(7),
3130-3161.
Grajek, M. and L.-H. Roller (2012), “Regulation and Investment in Network Industries: Evi-
dence from European Telecoms,” The Journal of Law and Economics, 55(1), 189–216.
27

Greenstein, S. and M. Mazzeo (2006). “The role of differentiation strategy in local telecom-
munication entry and market evolution: 1999-2002,” Journal of Industrial Economics, 54,
323–350.
Gruber, H. and P. Koutroumpis (2013). “Competition Enhancing Regulation and Diffusion of
Innovation: The Case of Broadband Networks,” Journal of Regulatory Economics, 43(2),
168–195.
Gruber, H. and F. Verboven (2001). “The Diffusion of mobile telecommunications services in
the European Union,” European Economic Review, 45, 577–588.
Grzybowski, L., Nitsche, R., Verboven, F. and L. Wiethaus (2014). “Market definition for
broadband internet in Slovakia Are fixed and mobile technologies in the same market?”
Information Economics and Policy, 28, 39–56.
Guthrie, G. (2006). “Regulating Infrastructure: The Impact on Risk and Investment,” Journal
of Economic Literature, 44, 925–972.
Hausman, J. and G. Sidak (2005). “Did Mandatory Unbundling Achieve its Purpose? Em-
pirical Evidence from Five Countries,” Journal of Competition Law and Economics, 1(1),
173–245.
Hausman, J., Sidak, G. and H. Singer (2001). “Cable Modems and DSL: Broadband Internet
Access for Residential Customers,” American Economic Review, 91, 302–307.
Hazlett, T. and C. Bazelon (2005). “Regulated Unbundling of Telecommunications Networks:
A Stepping Stone to Facilities-Based Competition?” Mimeo.
Lambrecht, A., Seim, K. and B. Skiera (2007). “Does uncertainty matter? Consumer behavior
under three-part tariffs,” Marketing Science, 26, 698–710.
Lee, S. and J.S. Brown (2008). “The Diffusion of Fixed Broadband: An Empirical Analysis,”
NET Institute Working Paper No. 08-19.
Lee, S., Lee, S. and M. Marcu (2011). “An empirical analysis of fixed and mobile broadband
diffusion,” Information Economics and Policy, 23, 227–233.
28

Miravete, E. (2002). “Estimation demand for local telephone service with asymmetric infor-
mation and optional calling plans,” Review of Economic Studies, 69, 943–971.
Miravete, E. and L.-H. Roller (2004). “Competitive nonlinear pricing in duopoly equilibrium:
The early US cellular telephone industry,” Working paper, University of Pennsylvania.
Narayanan, S., Chintagunta, P. and E. Miravete (2007). “The role of self selection, usage un-
certainty and learning in the demand for local telephone service,” Quantitative Marketing
and Economics, 5(1), 1–34.
Nardotto, M., Valletti, T. and F. Verboven (2015). “Unbundling the incumbent: Evidence
from UK broadband,” Journal of the European Economic Association, 13, 330–362.
Nitsche, R. and L. Wiethaus (2011). “Access regulation and investment in next generation
networks – A ranking of regulatory regimes,” International Journal of Industrial Organi-
zation, 29(2), 263–272.
Orazem, P., and M. Xiao (2006). “Do entry conditions vary over time? Entry and competition
in the broadband market: 1999-2003,” Working paper, University of Arizona.
Roller, L.-H. and L. Waverman (2001). “Telecommunications Infrastructure and Economic
Development: A Simultaneous Approach,” American Economic Review, 91(4), 909–923.
Srinuan, P., Srinuan, C. and E. Bohlin (2012). “Fixed and Mobile Broadband Substitution in
Sweden,” Telecommunications Policy, 36, 237–251.
Waverman, L., Meschi, M., Reillier, B., and K. Dasgupta (2007). “Access Regulation and
Infrastructure Investment in the Telecommunications Sector: An Empirical Investigation,”
September 2007.
Xiao, M. and P. Orazem (2009). “Is Your Neighbor Your Enemy? Strategic Entry into the US
Broadband Market,” Mimeo.
Xiao, M. and P. Orazem (2011). “Does the Fourth Entrant Make Any Difference? Entry and
Competition in the Early U.S. Broadband Market,” International Journal of Industrial
Organization, 29, 547–561.
29

Appendix
Table 1: Deployment of fiber in municipalities by Orange, SFR and Free
Orange SFR Free Total
2010 125 96 93 1372011 195 156 101 2062012 295 217 102 3042013 452 344 104 4612014 584 420 104 592
Table 2: Deployment of xDSL via LLU in municipalities by SFR, Free and Numericable
SFR Free Numericable Total
2010 6,395 8,473 1,857 12,8092011 7,727 10,706 1,997 15,2692012 9,570 12,870 2,041 17,3372013 13,001 16,077 1,929 20,8352014 14,119 19,463 1,937 23,179
30
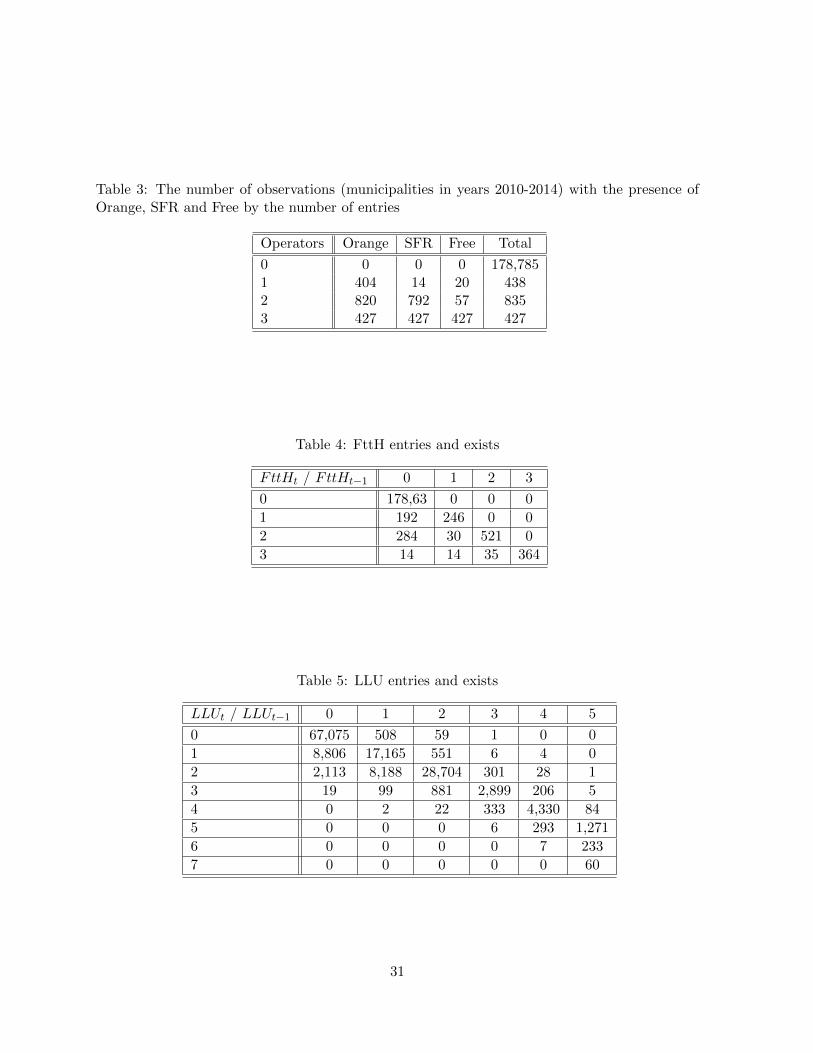
Table 3: The number of observations (municipalities in years 2010-2014) with the presence ofOrange, SFR and Free by the number of entries
Operators Orange SFR Free Total
0 0 0 0 178,7851 404 14 20 4382 820 792 57 8353 427 427 427 427
Table 4: FttH entries and exists
FttHt / FttHt−1 0 1 2 3
0 178,63 0 0 0
1 192 246 0 0
2 284 30 521 0
3 14 14 35 364
Table 5: LLU entries and exists
LLUt / LLUt−1 0 1 2 3 4 5
0 67,075 508 59 1 0 0
1 8,806 17,165 551 6 4 0
2 2,113 8,188 28,704 301 28 1
3 19 99 881 2,899 206 5
4 0 2 22 333 4,330 84
5 0 0 0 6 293 1,271
6 0 0 0 0 7 233
7 0 0 0 0 0 60
31

Table 6: Entry via FttH in municipalities
2011 2012 2013 2014 2012 2013 2014 2014
trend 1.0502*** 1.9485*** 2.8155*** 3.3105*** 2.5086*** 4.2590*** 6.2936*** 7.4097***(0.215) (0.197) (0.206) (0.215) (0.314) (0.319) (0.367) (0.400)
loghh 1.1142*** 2.7957***(0.051) (0.218)
Logdensity 1.6803*** -0.1712 -0.6621*** -1.0698*** -1.1603*** 3.6521*** -0.2606 -1.0263*** -1.6974*** -1.8840***(0.164) (0.203) (0.182) (0.173) (0.170) (0.330) (0.296) (0.282) (0.281) (0.280)
Logincome 1.6730*** 6.3138***(0.202) (0.866)
Share flat 1.7410*** 4.4919***(0.231) (0.915)
Unempl 0.0102 0.0060(0.020) (0.075)
ULL entrants 0.6411*** 0.9539***(0.041) (0.121)
VDSL -0.3384*** -0.6854***(0.104) (0.191)
Cable 0.3278*** 0.5537***(0.083) (0.208)
cut1 25.8177*** 82.3974***(2.140) (9.239)
cut2 26.5790*** 84.0790***(2.141) (9.253)
cut3 29.0167*** 90.6530***(2.150) (9.328)
Sigma2 22.1755***(2.174)
Observations 180,330 180,330LL -3738 -2837
Model I: ordered logit. Model II: random effects ordered logit.
32

Table 7: Entry via LLU in municipalities
y2011 y2012 y2013 y2014 y2012 y2013 y2014 y2014
trend 0.3863*** 0.6808*** 1.0802*** 1.2222*** 1.3486*** 2.3653*** 3.7945*** 4.4226***(0.053) (0.052) (0.052) (0.051) (0.076) (0.079) (0.084) (0.086)
loghh 0.3041*** 0.9543***(0.007) (0.044)
loghhdensity 2013 1.0035*** -0.0053 -0.0081 -0.0313** -0.0841*** 3.4018*** 0.0657*** 0.1055*** 0.1068*** -0.0108(0.014) (0.014) (0.014) (0.014) (0.013) (0.052) (0.020) (0.021) (0.021) (0.021)
logincome 3.5455*** 11.6056***(0.041) (0.255)
share flat 0.3184*** 1.8457***(0.046) (0.287)
unempl 0.0688*** 0.2645***(0.003) (0.015)
cut1 31.8784*** 104.4809***(0.417) (2.607)
cut2 33.0980*** 107.9415***(0.418) (2.610)
cut3 35.9339*** 116.9341***(0.419) (2.619)
cut4 36.6924*** 121.4477***(0.419) (2.626)
cut5 38.6533*** 129.9487***(0.420) (2.638)
cut6 41.2085*** 137.3586***(0.426) (2.651)
sigma2 u 31.6050***(0.476)
Observations 180,330 180,330LL -176522 -110596
Model I: ordered logit. Model II: random effects ordered logit.
33

Table 8: FttH entry thresholds
year entrant 1 entrant 2 entrant 3
2010 85,531 111,017 307,7392011 60,562 79,476 229,9772012 53,328 72,722 244,5002013 41,690 59,398 237,0212014 33,785 48,838 206,226
Without LLU
year entrant 1 entrant 2 entrant 3
2010 91,701 119,026 329,9412011 66,222 86,905 251,4722012 59,986 81,801 275,0252013 48,394 68,949 275,1352014 39,982 57,796 244,053
Table 9: FttH entry thresholds
year entrant 1 entrant 2 entrant 3 entrant 4 entrant 5 entrant 6
2010 502 1,112 8,759 24,687 173,780 952,2632011 389 850 6,494 18,023 123,242 658,4712012 307 667 5,005 13,765 92,526 487,0292013 217 470 3,529 9,702 65,180 342,9242014 168 372 2,948 8,330 58,924 324,253
34