Unaudited Semi-Annual Report - kamny.com€¦ · Consolidated Statement of Net Assets 6 ......
36
GLOBAL ADVANTAGE FUNDS, SICAV (Société d’Investissement à Capital Variable) Unaudited Semi-Annual Report for the period from 1 January 2009 to 30 June 2009 Subscriptions cannot be accepted on the basis of Annual and Semi-Annual Reports. Subscriptions can only be performed on the basis of the current Prospectus together with the last Annual Report and any Semi-Annual Report issued subsequent to the Annual Report.
Transcript of Unaudited Semi-Annual Report - kamny.com€¦ · Consolidated Statement of Net Assets 6 ......
GLOBAL ADVANTAGE
FUNDS, SICAV
(Société d’Investissement à Capital Variable)
Unaudited Semi-Annual Report
for the period from 1 January 2009
to 30 June 2009
Subscriptions cannot be accepted on the basis of Annual and Semi-Annual Reports. Subscriptions can
only be performed on the basis of the current Prospectus together with the last Annual Report and any Semi-Annual
Report issued subsequent to the Annual Report.


GLOBAL ADVANTAGE FUNDS
Table of contents
Page
Management and Administration 5
GLOBAL ADVANTAGE FUNDS
Consolidated Statement of Net Assets 6 MAJOR MARKETS H IGH VALUE SUBFUND
Statement of Net Assets 7 Change in Number of Units 8 Securities Portfolio 9-16 Geographical and Sector Allocation of the Securities Portfolio 17
EMERGING MARKETS H IGH VALUE SUBFUND
Statement of Net Assets 18 Change in Number of Units 19 Securities Portfolio 20-28 Geographical and Sector Allocation of the Securities Portfolio 29
Notes to the Semi-Annual Report as at 30 June 2009 30-33
3

GLOBAL ADVANTAGE FUNDS
5
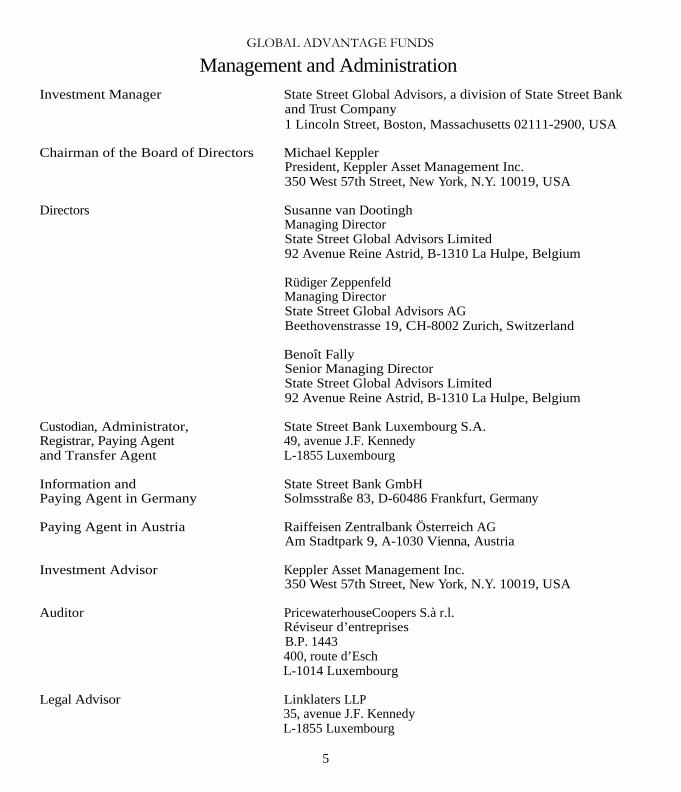
Management and Administration Investment Manager State Street Global Advisors, a division of State Street Bank
and Trust Company 1 Lincoln Street, Boston, Massachusetts 02111-2900, USA
Chairman of the Board of Directors Michael Keppler
President, Keppler Asset Management Inc. 350 West 57th Street, New York, N.Y. 10019, USA
Directors Susanne van Dootingh
Managing Director State Street Global Advisors Limited 92 Avenue Reine Astrid, B-1310 La Hulpe, Belgium
Rüdiger Zeppenfeld Managing Director State Street Global Advisors AG Beethovenstrasse 19, CH-8002 Zurich, Switzerland
Benoît Fally Senior Managing Director State Street Global Advisors Limited 92 Avenue Reine Astrid, B-1310 La Hulpe, Belgium
Custodian, Administrator, State Street Bank Luxembourg S.A. Registrar, Paying Agent 49, avenue J.F. Kennedy and Transfer Agent L-1855 Luxembourg
Information and State Street Bank GmbH Paying Agent in Germany Solmsstraße 83, D-60486 Frankfurt, Germany
Paying Agent in Austria Raiffeisen Zentralbank Österreich AG
Am Stadtpark 9, A-1030 Vienna, Austria Investment Advisor Keppler Asset Management Inc.
350 West 57th Street, New York, N.Y. 10019, USA
Auditor PricewaterhouseCoopers S.à r.l. Réviseur d’entreprises B.P. 1443 400, route d’Esch L-1014 Luxembourg
Legal Advisor Linklaters LLP
35, avenue J.F. Kennedy L-1855 Luxembourg

GLOBAL ADVANTAGE FUNDS
6
Consolidated Statement of Net Assets
as at 30 June 2009
ASSETS EUR
Securities portfolio at market value (purchase price EUR 1,079,113,477) (Note 2) 936,179,229 Bank balances 32,946,982 Receivable on units issued 10,233,350 Receivable on securities sold 6,646,049 Dividends receivable 2,497,381 Interest receivable 157 Other receivables 49,225
TOTAL ASSETS 988,552,373
LIABILITIES Payable on units redeemed 19,690,115 Payable on securities purchased 2,023,266 Other liabilities (Note 5) 1,790,804
TOTAL LIABILITIES 23,504,185
NET ASSETS AT THE END OF THE PERIOD 965,048,188
The accompanying notes form an integral part of this Semi-Annual Report.

GLOBAL ADVANTAGE FUNDS
7
MAJOR MARKETS HIGH VALUE SUBFUND
Statement of Net Assets
as at 30 June 2009
ASSETS EUR
Securities portfolio at market value (purchase price EUR 392,856,113) (Note 2) 317,471,708 Bank balances 19,665,737 Receivable on units issued 4,318,198 Dividends receivable 564,226 Receivable on securities sold 43,873 Interest receivable 95 Other receivables 3,337
TOTAL ASSETS 342,067,174
LIABILITIES
Payable on units redeemed 1,334,957 Other liabilities (Note 5) 458,787
TOTAL LIABILITIES 1,793,744
NET ASSETS AT THE END OF THE PERIOD 340,273,430 (equal to 235,828 units at EUR 1,442.89)
The accompanying notes form an integral part of this Semi-Annual Report.

GLOBAL ADVANTAGE FUNDS
8
MAJOR MARKETS HIGH VALUE SUBFUND
Change in Number of Units (unaudited)
For the
period from
1 January 2009 to
30 June 2009
For thefinancial year
from1 January 2008
to31 December
2008
For the financial year
from1 January 2007
to 31 December
2007
Number of units outstanding at the beginning of the period / financial year 228,235 250,275 154,322
Number of units issued 27,990 55,578 156,632 Number of units redeemed (20,397) (77,618) (60,679)
NUMBER OF UNITS OUTSTANDING AT THE
END OF THE PERIOD / FINANCIAL YEAR 235,828 228,235 250,275
EUR EUR EUR Net assets at the end of the period / financial year 340,273,430 305,359,933 580,416,579
Net asset value per unit at the end of the
period / financial year 1,442.89 1,337.92 2,319.12
The accompanying notes form an integral part of this Semi-Annual Report.

GLOBAL ADVANTAGE FUNDS
9
MAJOR MARKETS HIGH VALUE SUBFUND
Securities Portfolio
as at 30 June 2009 (in EUR)
Currency Description Quantity/ Nominal
Purchase price
Market value
% of net assets
Securities listed on an official stock exchange Shares
Belgium
EUR Fortis (VVPR) (1) 523,440
0 523 0.00
0 523 0.00
Germany
EUR
Adidas
32,821
1,313,801
889,449
0.26 EUR Allianz 36,475 3,838,919 2,393,854 0.70 EUR BASF 96,922 2,865,685 2,745,800 0.81 EUR Bayer 98,250 3,834,401 3,755,115 1.10 EUR Daimler 38,193 2,605,338 984,616 0.29 EUR Deutsche Boerse 47,468 2,502,899 2,624,031 0.77 EUR Deutsche Lufthansa 133,668 1,271,230 1,193,655 0.35 EUR Deutsche Telekom 280,159 3,542,409 2,353,336 0.69 EUR E.ON 166,064 4,754,406 4,188,134 1.23 EUR Fresenius 40,311 1,925,599 1,551,570 0.46 EUR Fresenius Medical Care 61,659 2,033,914 1,966,306 0.58 EUR Hannover Rueckversicherung 49,380 1,287,577 1,301,657 0.38 EUR Henkel KGaA (pref. shares) 36,237 1,252,257 805,549 0.24 EUR Linde 23,943 1,390,806 1,398,989 0.41 EUR MTU Aero Engines Holding 35,672 937,633 927,472 0.27 EUR Münchener Rückversicherungs-
Gesellschaft 16,929 1,830,510 1,628,401 0.48
EUR Porsche (pref. shares) 28,130 2,957,399 1,344,614 0.40 EUR RWE 66,983 5,121,860 3,757,076 1.10 EUR SAP 70,749 2,562,571 2,028,374 0.60 EUR Siemens 127,398 7,725,815 6,262,886 1.84
The accompanying notes form an integral part of this Semi-Annual Report.

GLOBAL ADVANTAGE FUNDS
10
MAJOR MARKETS HIGH VALUE SUBFUND
Securities Portfolio (Continued)
as at 30 June 2009 (in EUR)
The accompanying notes form an integral part of this Semi-Annual Report.
Currency Description Quantity/
NominalPurchase
PriceMarket
Value% of net
assets Germany (continued) EUR
Software 19,851 964,370 1,000,689 0.29
EUR ThyssenKrupp 38,025 1,242,573 672,662 0.20 57,761,972 45,774,235 13.45
France EUR
Air France-KLM 5,345 126,595 48,645 0.01
EUR Alstom 76,838 3,820,615 3,231,422 0.95EUR ArcelorMittal 82,041 1,884,491 1,918,939 0.56EUR AXA 160,326 5,119,929 2,146,765 0.63EUR BNP Paribas 103,808 5,749,836 4,801,120 1.41EUR Bouygues 63,400 2,458,130 1,699,120 0.50EUR Cap Gemini 10,417 473,505 273,342 0.08EUR Carrefour 5,721 293,111 174,033 0.05EUR Casino Guichard Perrachon 16,072 1,084,989 772,260 0.23EUR Christian Dior 17,979 978,386 955,943 0.28EUR Cie de Saint- Gobain 15,695 1,033,458 373,933 0.11EUR Danone 45,059 1,685,274 1,585,176 0.47EUR European Aeronautic Defence and Space 156,872 1,638,273 1,805,597 0.53EUR Eutelsat Communications 56,829 979,907 1,044,801 0.31EUR France Telecom 173,443 3,638,441 2,802,839 0.82EUR GDF Suez 96,918 3,521,922 2,572,204 0.76EUR L'Oreal 12,557 1,143,997 668,974 0.20EUR LVMH Moet Hennessy Louis Vuitton 10,951 945,985 595,734 0.18EUR Neopost 15,438 964,507 988,109 0.29EUR PEUGEOT 51,178 2,735,713 958,052 0.28EUR Sanofi-Aventis 123,533 7,186,214 5,172,327 1.52EUR Total 201,256 9,410,297 7,744,331 2.28EUR UBISOFT Entertainment 91,988 2,255,464 1,595,532 0.47

GLOBAL ADVANTAGE FUNDS
11
MAJOR MARKETS HIGH VALUE SUBFUND
Securities Portfolio (Continued)
as at 30 June 2009 (in EUR)
Currency Description
Quantity/Nominal
Purchase Price
Market Value
% of netassets
France (continued)
EUR
Unibail-Rodamco 7,993 1,015,366 848,537 0.25
EUR Vivendi 120,771 3,518,358 2,057,334 0.60 63,662,763 46,835,069 13.77
Great Britain GBP
Anglo American 54,132 1,067,578 1,115,525 0.33
GBP AstraZeneca 76,429 3,351,997 2,385,067 0.70GBP Autonomy 35,690 496,947 599,312 0.18GBP Aviva 244,972 2,470,184 977,591 0.29GBP BAE Systems 354,650 1,823,153 1,402,841 0.41GBP BHP Billiton 122,109 1,847,483 1,946,309 0.57GBP BP 1,021,596 8,222,292 5,703,943 1.68GBP British American Tobacco 51,984 928,853 1,016,285 0.30GBP Cable & Wireless 198,576 333,644 308,855 0.09GBP Carillion 166,378 507,671 490,430 0.14GBP Centrica 313,265 822,000 816,332 0.24GBP Cookson Group 122,814 1,152,525 374,932 0.11GBP G4S 362,254 796,886 882,611 0.26GBP GlaxoSmithKline 229,993 3,953,836 2,871,699 0.84GBP HSBC Holdings 658,617 4,172,930 3,867,398 1.14GBP IMI 161,313 560,812 587,659 0.17GBP Imperial Tobacco Group 50,088 1,659,610 923,614 0.27GBP Invensys 286,073 892,629 747,144 0.22GBP Michael Page International 173,682 1,288,684 483,546 0.14GBP Morrison Supermarkets 302,117 857,119 834,942 0.25GBP National Grid 128,038 1,524,231 819,168 0.24GBP Next 31,232 477,352 536,132 0.16GBP Pearson 94,422 736,858 672,507 0.20
The accompanying notes form an integral part of this Semi-Annual Report.
GLOBAL ADVANTAGE FUNDS
12
MAJOR MARKETS HIGH VALUE SUBFUND
Securities Portfolio (Continued)
as at 30 June 2009 (in EUR)
Currency Description
Quantity/Nominal
Purchase Price
Market Value
% of net assets
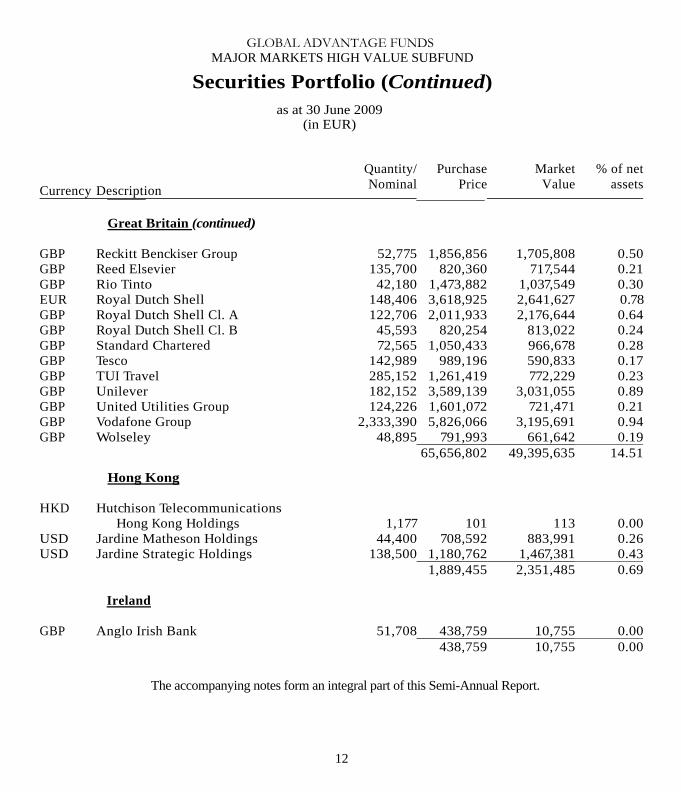
Great Britain (continued)
GBP
Reckitt Benckiser Group 52,775 1,856,856 1,705,808 0.50
GBP Reed Elsevier 135,700 820,360 717,544 0.21GBP Rio Tinto 42,180 1,473,882 1,037,549 0.30EUR Royal Dutch Shell 148,406 3,618,925 2,641,627 0.78GBP Royal Dutch Shell Cl. A 122,706 2,011,933 2,176,644 0.64GBP Royal Dutch Shell Cl. B 45,593 820,254 813,022 0.24GBP Standard Chartered 72,565 1,050,433 966,678 0.28GBP Tesco 142,989 989,196 590,833 0.17GBP TUI Travel 285,152 1,261,419 772,229 0.23GBP Unilever 182,152 3,589,139 3,031,055 0.89GBP United Utilities Group 124,226 1,601,072 721,471 0.21GBP Vodafone Group 2,333,390 5,826,066 3,195,691 0.94GBP Wolseley 48,895 791,993 661,642 0.19 65,656,802 49,395,635 14.51
Hong Kong HKD
Hutchison Telecommunications
Hong Kong Holdings 1,177 101 113 0.00USD Jardine Matheson Holdings 44,400 708,592 883,991 0.26USD Jardine Strategic Holdings 138,500 1,180,762 1,467,381 0.43 1,889,455 2,351,485 0.69
Ireland GBP
Anglo Irish Bank 51,708 438,759 10,755 0.00
438,759 10,755 0.00
The accompanying notes form an integral part of this Semi-Annual Report.

GLOBAL ADVANTAGE FUNDS
13
MAJOR MARKETS HIGH VALUE SUBFUND
Securities Portfolio (Continued)
as at 30 June 2009 (in EUR)
Currency Description
Quantity/Nominal
Purchase Price
Market Value
% of netassets
Italy
EUR
Alleanza Assicurazioni 153,230 835,975 748,912 0.22
EUR Assicurazioni Generali 166,391 4,954,172 2,464,251 0.72EUR Atlantia 56,370 646,742 811,728 0.24EUR Banca Monte dei Paschi di Siena 1,252,347 2,745,298 1,441,451 0.42EUR Banco Popolare 418,297 2,769,268 2,225,340 0.65EUR Davide Campari-Milano 129,816 674,272 740,600 0.22EUR Enel 1,592,042 10,230,981 5,524,386 1.62EUR ENI 659,076 14,076,924 11,105,431 3.26EUR Fiat 158,605 3,398,133 1,135,612 0.33EUR Finmeccanica 91,425 1,357,792 916,993 0.27EUR Intesa Sanpaolo 1,107,585 5,035,378 2,541,908 0.75EUR Italcementi 55,593 644,429 232,657 0.07EUR Mediaset 177,084 793,794 707,008 0.21EUR Mediobanca 188,086 3,327,024 1,595,910 0.47EUR Milano Assicurazioni 482,743 1,328,881 1,141,687 0.34EUR Prysmian 86,551 798,215 926,961 0.27EUR Saipem 57,768 1,048,104 1,001,697 0.29EUR Telecom Italia 2,326,841 3,509,714 2,291,938 0.67EUR Telecom Italia—RSP 1,195,387 805,430 836,173 0.25EUR Unione di Banche Italiane 71,994 799,636 667,384 0.20EUR UniCredito Italiano 3,159,163 14,100,238 5,670,698 1.67 73,880,400 44,728,725 13.14
New Zealand NZD
Auckland International Airport 695,300 863,644 517,240 0.15
NZD Contact Energy 366,046 1,620,569 974,919 0.29NZD Fisher & Paykel Healthcare 540,310 842,665 717,044 0.21
The accompanying notes form an integral part of this Semi-Annual Report.

GLOBAL ADVANTAGE FUNDS
14
MAJOR MARKETS HIGH VALUE SUBFUND
Securities Portfolio (Continued)
as at 30 June 2009 (in EUR)
Currency Description
Quantity/Nominal
Purchase Price
Market Value
% of net assets
New Zealand (continued)
NZD
Fletcher Building 356,291 1,659,031 1,050,376 0.31
NZD Telecom Corporation of New Zealand 1,294,926 2,606,249 1,623,351 0.48 7,592,158 4,882,930 1.44
Austria EUR
Erste Group Bank 481,690 9,771,410 9,262,899 2.72
EUR OMV 391,087 9,808,144 10,438,112 3.07EUR Raiffeisen International Bank Holding 99,664 2,724,242 2,466,684 0.72EUR Strabag 95,423 1,633,996 1,501,958 0.44EUR Telekom Austria 793,774 8,376,914 8,842,642 2.60EUR Österreichische Elektrizitätswirtschafts-
Aktiengesellschaft 168,639 6,553,853 6,118,223 1.80EUR Vienna Insurance Group 97,968 2,619,020 3,035,049 0.89EUR Voestalpine 286,119 4,890,533 5,593,626 1.64EUR Wienerberger 158,276 2,156,021 1,397,577 0.41 48,534,133 48,656,770 14.29
Singapore SGD
CapitaCommercial Trust 3,807,000 1,994,926 1,569,768 0.46
SGD CapitaLand 638,000 985,509 1,174,425 0.35SGD City Developments 203,000 626,958 867,936 0.26SGD ComfortDelgro Corp 1,982,000 1,361,929 1,255,066 0.37SGD DBS Group Holdings 1,199,500 5,706,788 7,053,919 2.07SGD Fraser and Neave 439,000 672,178 842,587 0.25SGD Golden Agri-Resources 2,207,000 403,892 417,096 0.12SGD Jardine Cycle & Carriage 202,000 1,089,106 1,933,568 0.57
The accompanying notes form an integral part of this Semi-Annual Report.

GLOBAL ADVANTAGE FUNDS
15
MAJOR MARKETS HIGH VALUE SUBFUND
Securities Portfolio (Continued)
as at 30 June 2009 (in EUR)
Currency Description
Quantity/Nominal
Purchase Price Market Value
% of net assets
Singapore (continued)
SGD
Keppel 850,000 2,547,286 2,908,205 0.85
SGD Olam International 461,000 458,182 547,633 0.16SGD Oversea- Chinese Banking 1,248,000 3,248,261 4,135,154 1.22SGD SembCorp Marine 723,000 1,011,184 975,988 0.29SGD Singapore Airlines 361,000 2,116,105 2,356,851 0.69SGD Singapore Exchange 238,000 641,767 847,010 0.25SGD Singapore Petroleum 540,000 652,761 1,648,760 0.48SGD Singapore Press Holdings 1,381,000 2,450,900 2,162,508 0.64SGD Singapore Technologies Engineering 581,000 687,679 701,592 0.21SGD Singapore Telecommunications 4,933,000 6,127,225 7,240,285 2.13SGD United Overseas Bank 712,000 4,926,932 5,130,733 1.51SGD UOL Group 687,000 709,952 1,112,869 0.33SGD Wilmar International 497,000 639,404 1,239,349 0.36 39,058,924 46,121,302 13.57
United States USD
Berkshire Hathaway Kl. A 448 34,380,747 28,669,979 8.43
34,380,747 28,669,979 8.43 Total shares 392,856,113 317,427,408 93.29
The accompanying notes form an integral part of this Semi-Annual Report.

GLOBAL ADVANTAGE FUNDS
16
MAJOR MARKETS HIGH VALUE SUBFUND
Securities Portfolio (Continued)
as at 30 June 2009 (in EUR)
Currency Description Quantity/Nominal
Purchase Price Market Value
% of net assets
Securities not listed on an official stock exchange
Rights
Belgium EUR Fortis
1,582,411 0 0 0.00
Italy EUR Unione di Banche Italiane - exp.
30/6/2011 71,994 0 3,960 0.00EUR Unione di Banche Italiane - exp.
3/7/2009 71,994 0 3,506 0.00 0 7,466 0.00
Singapore SGD
Golden Agri-Resources 375,190 0 36,834 0.01
Total rights 0 44,300 0.01
TOTAL SECURITIES PORTFOLIO 392,856,113 317,471,708 93.30 OTHER NET ASSETS
22,801,722 6.70 NET ASSETS 340,273,430 100.00
(1) VVPR : These securities are subject to a reduced investment income tax of 15% (instead of 25%)
payable on dividends.
The accompanying notes form an integral part of this Semi-Annual Report.

GLOBAL ADVANTAGE FUNDS
17
MAJOR MARKETS HIGH VALUE SUBFUND Geographical and Sector Allocation
of the Securities Portfolio % of net
assets
% of net assets
Geographical allocation
Great Britain 14.51 France 13.77 Austria 14.29 Singapore 13.58 Germany 13.45 Italy 13.14 United States 8.43 New Zealand 1.44 Hong Kong 0.69 Belgium 0.00 Ireland 0.00
93.30
OTHER NET ASSETS 6.70
NET ASSETS 100.00
Sector allocation Financial services 30.93 Energy 12.72 Industrial goods 11.33 Telecommunications 8.68 Utilities 7.49 Healthcare 5.42 Commodities 5.22 Consumer goods - staples 5.12 Consumer goods - elastic demand 4.43 Information technology 1.91 Other 0.05
93.30
OTHER NET ASSETS 6.70 NET ASSETS 100.00

GLOBAL ADVANTAGE FUNDS EMERGING MARKETS HIGH VALUE - TEILFONDS
18
Statement of Net Assets
as at 30 June 2009
ASSETS EUR
Securities portfolio at market value (purchase price EUR 686,257,364) (Note 2) 618,707,521 Bank balances 13,281,245 Receivable on securities sold 6,602,176 Receivable on units issued 5,915,152 Dividends receivable 1,933,155 Interest receivable 62 Other receivables 45,888
TOTAL ASSETS 646,485,199
LIABILITIES
Payable on units redeemed 18,355,158 Payable on securities purchased 2,023,266 Other liabilities (Note 5) 1,332,017
TOTAL LIABILITIES 21,710,441
NET ASSETS AT THE END OF THE PERIOD 624,774,758 (equal to 527,050 units at EUR 1,185.42)
The accompanying notes form an integral part of this Semi-Annual Report.

GLOBAL ADVANTAGE FUNDS EMERGING MARKETS HIGH VALUE - TEILFONDS
19
Change in Number of Units (unaudited)
For theperiod
from 1 January 2009
to 30 June
2009
For the financial year
from 1 January 2008
to31 December
2008
For the financial year
from1 January 2007
to 31 December
2007
Number of units outstanding at the beginning of the period / financial year
582,459 712,431 453,282Number of units issued 56,138 290,323 450,601Number of units redeemed (111,547) (420,295) (191,452)NUMBER OF SHARES OUTSTANDING AT THE END OF THE PERIOD / FINANCIAL YEAR 527,050 582,459 712,431
EUR EUR EURNet assets at the end of the period / financial year
624,774,758 559,128,695 1,376,189,613
Net asset value per unit at the end of the period / financial year
1,185.42 959.95 1,931.68
The accompanying notes form an integral part of this Semi-Annual Report.

GLOBAL ADVANTAGE FUNDS EMERGING MARKETS HIGH VALUE - TEILFONDS
20
Securities Portfolio
as at 30 June 2009 (in EUR)
Currency Description
Quantity/Nominal
Purchase Price
Market Value
% of netassets
Securities listed on an official stock exchange
Shares
Egypt
EGP Commercial International Bank 1,405,502 7,051,764 8,772,977 1.40EGP Egyptian Company for Mobile Services 143,072 3,924,410 3,529,602 0.56EGP Egyptian Financial Group-Hermes
Holding 1,465,965 3,601,135 4,192,294 0.67EGP El Ezz Steel 1,544,049 1,856,397 2,374,609 0.38EGP ElSwedy Cables Holding 435,257 3,292,055 3,761,839 0.60EGP Orascom Construction Industries 387,605 7,992,828 9,459,296 1.51EGP Orascom Telecom Holding 1,905,492 8,000,257 7,304,392 1.17EGP Sidi Kerir Petrochemcials 889,714 1,142,425 1,345,684 0.22EGP Talaat Moustafa Group 2,381,244 1,264,040 1,610,131 0.26EGP Telecom Egypt 2,628,832 6,128,530 5,272,486 0.84 44,253,841 47,623,310 7.61 Brazil USD
Cia Energetica de Minas Gerais ADR 333,633 2,971,036 3,188,417 0.51
BRL General Shopping Brasil 448,800 2,459,527 645,603 0.10USD Petroleo Brasileiro ADR 273,864 4,618,646 6,496,327 1.04BRL Souza Cruz 175,500 2,860,337 3,567,654 0.57USD Tele Norte Leste Participacoes ADR 300,270 2,768,616 3,174,898 0.51USD Vale ADR 264,394 2,987,412 2,887,440 0.46 18,665,574 19,960,339 3.19
The accompanying notes form an integral part of this Semi-Annual Report.
GLOBAL ADVANTAGE FUNDS EMERGING MARKETS HIGH VALUE - TEILFONDS
21
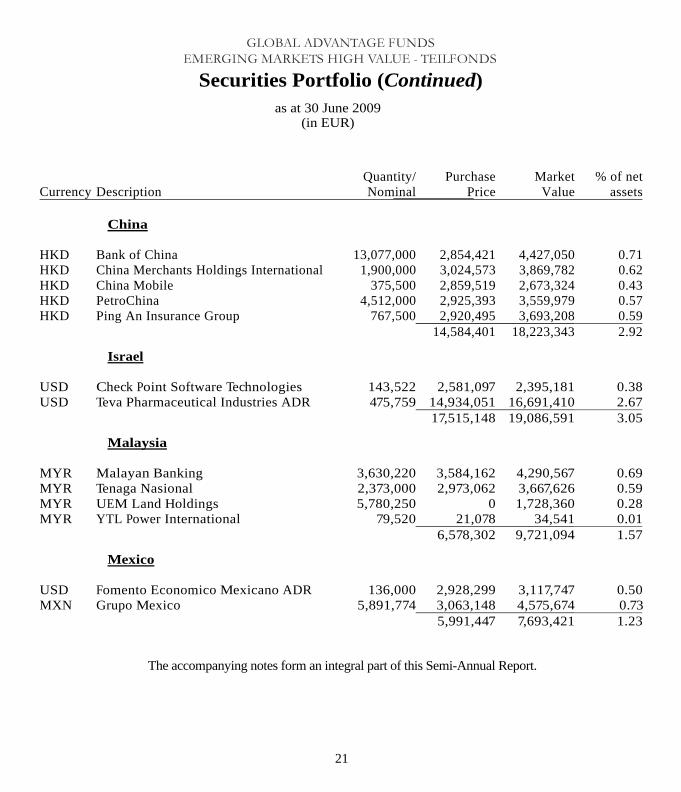
Securities Portfolio (Continued)
as at 30 June 2009 (in EUR)
Currency Description Quantity/Nominal
Purchase Price
Market Value
% of netassets
China
HKD
Bank of China 13,077,000 2,854,421 4,427,050 0.71
HKD China Merchants Holdings International 1,900,000 3,024,573 3,869,782 0.62HKD China Mobile 375,500 2,859,519 2,673,324 0.43HKD PetroChina 4,512,000 2,925,393 3,559,979 0.57HKD Ping An Insurance Group 767,500 2,920,495 3,693,208 0.59 14,584,401 18,223,343 2.92
Israel USD
Check Point Software Technologies 143,522 2,581,097 2,395,181 0.38
USD Teva Pharmaceutical Industries ADR 475,759 14,934,051 16,691,410 2.67 17,515,148 19,086,591 3.05
Malaysia MYR
Malayan Banking 3,630,220 3,584,162 4,290,567 0.69
MYR Tenaga Nasional 2,373,000 2,973,062 3,667,626 0.59MYR UEM Land Holdings 5,780,250 0 1,728,360 0.28MYR YTL Power International 79,520 21,078 34,541 0.01 6,578,302 9,721,094 1.57
Mexico USD
Fomento Economico Mexicano ADR 136,000 2,928,299 3,117,747 0.50
MXN Grupo Mexico 5,891,774 3,063,148 4,575,674 0.73 5,991,447 7,693,421 1.23
The accompanying notes form an integral part of this Semi-Annual Report.
GLOBAL ADVANTAGE FUNDS EMERGING MARKETS HIGH VALUE - TEILFONDS
22
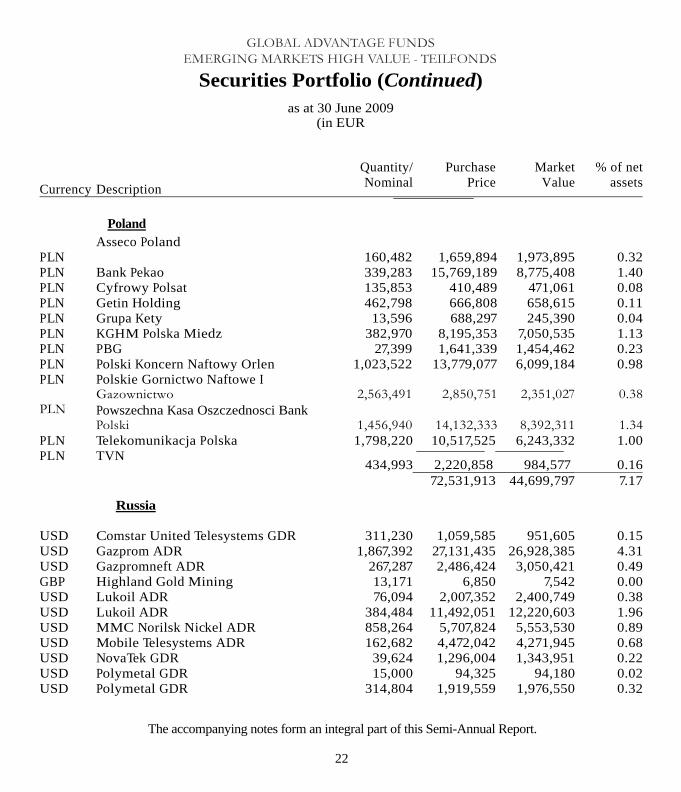
Securities Portfolio (Continued)
as at 30 June 2009 (in EUR
Currency Description
Quantity/Nominal
Purchase Price
Market Value
% of net assets
Poland PLN
Asseco Poland 160,482 1,659,894 1,973,895 0.32
PLN Bank Pekao 339,283 15,769,189 8,775,408 1.40PLN Cyfrowy Polsat 135,853 410,489 471,061 0.08PLN Getin Holding 462,798 666,808 658,615 0.11PLN Grupa Kety 13,596 688,297 245,390 0.04PLN KGHM Polska Miedz 382,970 8,195,353 7,050,535 1.13PLN PBG 27,399 1,641,339 1,454,462 0.23PLN Polski Koncern Naftowy Orlen 1,023,522 13,779,077 6,099,184 0.98PLN Polskie Gornictwo Naftowe I
Gazownictwo 2,563,491 2,850,751 2,351,027 0.38PLN Powszechna Kasa Oszczednosci Bank
Polski 1,456,940 14,132,333 8,392,311 1.34PLN Telekomunikacja Polska 1,798,220 10,517,525 6,243,332 1.00PLN TVN
434,993 2,220,858 984,577 0.16 72,531,913 44,699,797 7.17
Russia USD
Comstar United Telesystems GDR 311,230 1,059,585 951,605 0.15
USD Gazprom ADR 1,867,392 27,131,435 26,928,385 4.31USD Gazpromneft ADR 267,287 2,486,424 3,050,421 0.49GBP Highland Gold Mining 13,171 6,850 7,542 0.00USD Lukoil ADR 76,094 2,007,352 2,400,749 0.38USD Lukoil ADR 384,484 11,492,051 12,220,603 1.96USD MMC Norilsk Nickel ADR 858,264 5,707,824 5,553,530 0.89USD Mobile Telesystems ADR 162,682 4,472,042 4,271,945 0.68USD NovaTek GDR 39,624 1,296,004 1,343,951 0.22USD Polymetal GDR 15,000 94,325 94,180 0.02USD Polymetal GDR 314,804 1,919,559 1,976,550 0.32
The accompanying notes form an integral part of this Semi-Annual Report.

GLOBAL ADVANTAGE FUNDS EMERGING MARKETS HIGH VALUE - TEILFONDS
23
Securities Portfolio (Continued)
as at 30 June 2009 (in EUR)
Currency Description Quantity/Nominal
Purchase Price
Market Value
% of netassets
Russia (continued)
USD
Polyus Gold ADR 60,097 823,074 882,429 0.14
USD Rosneft Oil GDR 1,068,133 3,320,944 4,139,317 0.66USD Sistema GDR 237,233 1,382,277 2,036,054 0.33USD Surgutneftegaz ADR 446,398 2,557,013 2,206,042 0.35USD Surgutneftegaz ADR 381,663 628,767 746,310 0.12USD Tatneft ADR 212,026 2,246,791 3,693,704 0.59USD Uralkali GDR 196,940 1,736,559 2,254,585 0.36USD Vimpel- Communications ADR 326,759 3,632,280 2,734,708 0.44USD VTB Bank GDR 3,964,131 5,826,629 6,201,226 0.99USD Wimm-Bill-Dann Foods ADR 14,013 434,155 547,527 0.09 80,261,940 84,241,363 13.49
South Africa USD
Anglo American ADR 575,947 9,512,907 5,995,570 0.96
USD AngloGold ADR 215,559 6,778,369 5,614,485 0.90ZAR FirstRand 431,145 522,167 556,915 0.09ZAR Gold Fields ADR 881,356 11,036,050 7,551,709 1.21ZAR Impala Platinum Holdings 131,332 1,391,124 2,056,589 0.33ZAR Sasol 140,330 3,264,232 3,480,664 0.56ZAR Telkom 320,418 1,435,368 1,118,026 0.18ZAR Vodacom Group 320,418 1,449,794 1,683,809 0.27 35,390,011 28,057,767 4.50
South Korea KRW
Hite Brewery 82 10,370 7,268 0.00
KRW Hyundai Heavy Industries 24,476 4,893,434 2,698,017 0.43
The accompanying notes form an integral part of this Semi-Annual Report.
GLOBAL ADVANTAGE FUNDS EMERGING MARKETS HIGH VALUE - TEILFONDS
24
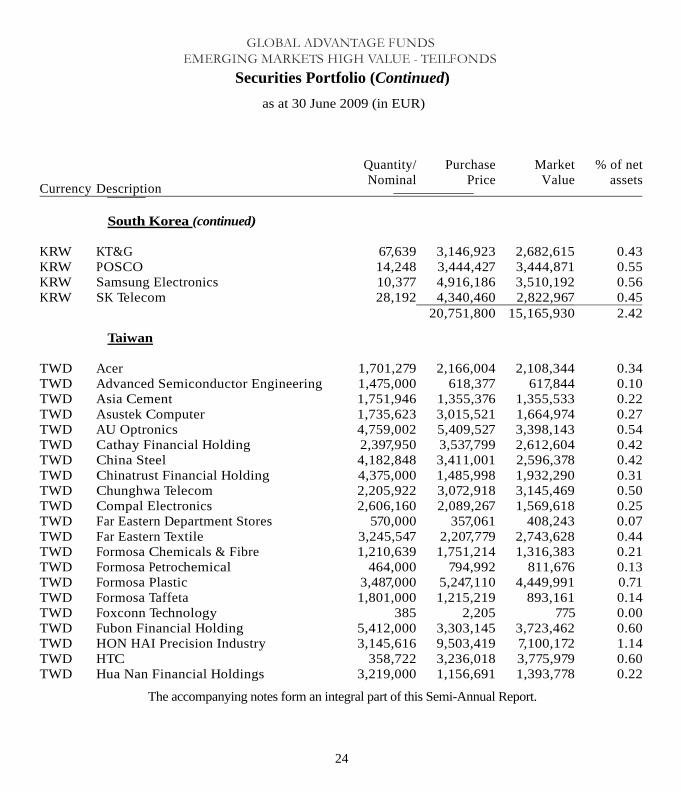
Securities Portfolio (Continued)
as at 30 June 2009 (in EUR)
Currency Description
Quantity/Nominal
Purchase Price
Market Value
% of netassets
South Korea (continued)
KRW
KT&G 67,639 3,146,923 2,682,615 0.43
KRW POSCO 14,248 3,444,427 3,444,871 0.55KRW Samsung Electronics 10,377 4,916,186 3,510,192 0.56KRW SK Telecom 28,192 4,340,460 2,822,967 0.45 20,751,800 15,165,930 2.42
Taiwan TWD
Acer 1,701,279 2,166,004 2,108,344 0.34
TWD Advanced Semiconductor Engineering 1,475,000 618,377 617,844 0.10TWD Asia Cement 1,751,946 1,355,376 1,355,533 0.22TWD Asustek Computer 1,735,623 3,015,521 1,664,974 0.27TWD AU Optronics 4,759,002 5,409,527 3,398,143 0.54TWD Cathay Financial Holding 2,397,950 3,537,799 2,612,604 0.42TWD China Steel 4,182,848 3,411,001 2,596,378 0.42TWD Chinatrust Financial Holding 4,375,000 1,485,998 1,932,290 0.31TWD Chunghwa Telecom 2,205,922 3,072,918 3,145,469 0.50TWD Compal Electronics 2,606,160 2,089,267 1,569,618 0.25TWD Far Eastern Department Stores 570,000 357,061 408,243 0.07TWD Far Eastern Textile 3,245,547 2,207,779 2,743,628 0.44TWD Formosa Chemicals & Fibre 1,210,639 1,751,214 1,316,383 0.21TWD Formosa Petrochemical 464,000 794,992 811,676 0.13TWD Formosa Plastic 3,487,000 5,247,110 4,449,991 0.71TWD Formosa Taffeta 1,801,000 1,215,219 893,161 0.14TWD Foxconn Technology 385 2,205 775 0.00TWD Fubon Financial Holding 5,412,000 3,303,145 3,723,462 0.60TWD HON HAI Precision Industry 3,145,616 9,503,419 7,100,172 1.14TWD HTC 358,722 3,236,018 3,775,979 0.60TWD Hua Nan Financial Holdings 3,219,000 1,156,691 1,393,778 0.22
The accompanying notes form an integral part of this Semi-Annual Report.
GLOBAL ADVANTAGE FUNDS EMERGING MARKETS HIGH VALUE - TEILFONDS
25
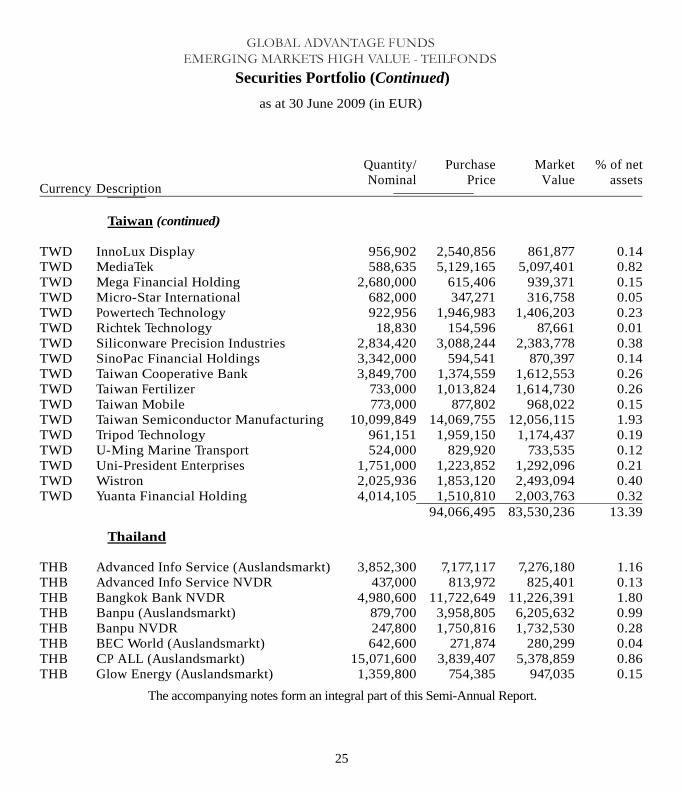
Securities Portfolio (Continued)
as at 30 June 2009 (in EUR)
Currency Description
Quantity/Nominal
Purchase Price
Market Value
% of netassets
Taiwan (continued)
TWD
InnoLux Display 956,902 2,540,856 861,877 0.14
TWD MediaTek 588,635 5,129,165 5,097,401 0.82TWD Mega Financial Holding 2,680,000 615,406 939,371 0.15TWD Micro-Star International 682,000 347,271 316,758 0.05TWD Powertech Technology 922,956 1,946,983 1,406,203 0.23TWD Richtek Technology 18,830 154,596 87,661 0.01TWD Siliconware Precision Industries 2,834,420 3,088,244 2,383,778 0.38TWD SinoPac Financial Holdings 3,342,000 594,541 870,397 0.14TWD Taiwan Cooperative Bank 3,849,700 1,374,559 1,612,553 0.26TWD Taiwan Fertilizer 733,000 1,013,824 1,614,730 0.26TWD Taiwan Mobile 773,000 877,802 968,022 0.15TWD Taiwan Semiconductor Manufacturing 10,099,849 14,069,755 12,056,115 1.93TWD Tripod Technology 961,151 1,959,150 1,174,437 0.19TWD U-Ming Marine Transport 524,000 829,920 733,535 0.12TWD Uni-President Enterprises 1,751,000 1,223,852 1,292,096 0.21TWD Wistron 2,025,936 1,853,120 2,493,094 0.40TWD Yuanta Financial Holding 4,014,105 1,510,810 2,003,763 0.32 94,066,495 83,530,236 13.39
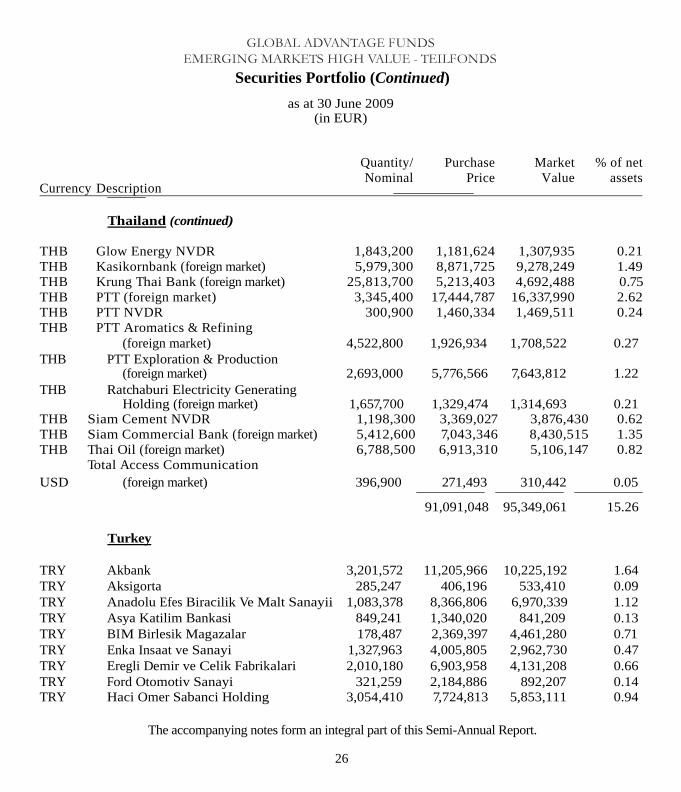
Thailand THB
Advanced Info Service (Auslandsmarkt) 3,852,300 7,177,117 7,276,180 1.16
THB Advanced Info Service NVDR 437,000 813,972 825,401 0.13THB Bangkok Bank NVDR 4,980,600 11,722,649 11,226,391 1.80THB Banpu (Auslandsmarkt) 879,700 3,958,805 6,205,632 0.99THB Banpu NVDR 247,800 1,750,816 1,732,530 0.28THB BEC World (Auslandsmarkt) 642,600 271,874 280,299 0.04THB CP ALL (Auslandsmarkt) 15,071,600 3,839,407 5,378,859 0.86THB Glow Energy (Auslandsmarkt) 1,359,800 754,385 947,035 0.15
The accompanying notes form an integral part of this Semi-Annual Report.
GLOBAL ADVANTAGE FUNDS EMERGING MARKETS HIGH VALUE - TEILFONDS
26
Securities Portfolio (Continued)
as at 30 June 2009 (in EUR)
Currency Description
Quantity/Nominal
Purchase Price
Market Value
% of netassets
Thailand (continued)
THB
Glow Energy NVDR 1,843,200 1,181,624
1,307,935 0.21
THB Kasikornbank (foreign market) 5,979,300 8,871,725 9,278,249 1.49THB Krung Thai Bank (foreign market) 25,813,700 5,213,403 4,692,488 0.75THB PTT (foreign market) 3,345,400 17,444,787 16,337,990 2.62THB PTT NVDR 300,900 1,460,334 1,469,511 0.24THB PTT Aromatics & Refining
(foreign market) 4,522,800 1,926,934 1,708,522 0.27 THB PTT Exploration & Production
(foreign market) 2,693,000 5,776,566 7,643,812 1.22 THB Ratchaburi Electricity Generating
Holding (foreign market) 1,657,700 1,329,474 1,314,693 0.21 THB Siam Cement NVDR 1,198,300 3,369,027 3,876,430 0.62THB Siam Commercial Bank (foreign market) 5,412,600 7,043,346 8,430,515 1.35THB Thai Oil (foreign market) 6,788,500 6,913,310 5,106,147 0.82 Total Access Communication USD (foreign market) 396,900 271,493 310,442 0.05
91,091,048 95,349,061 15.26
Turkey
TRY Akbank 3,201,572 11,205,966 10,225,192 1.64 TRY Aksigorta 285,247 406,196 533,410 0.09 TRY Anadolu Efes Biracilik Ve Malt Sanayii 1,083,378 8,366,806 6,970,339 1.12 TRY Asya Katilim Bankasi 849,241 1,340,020 841,209 0.13 TRY BIM Birlesik Magazalar 178,487 2,369,397 4,461,280 0.71 TRY Enka Insaat ve Sanayi 1,327,963 4,005,805 2,962,730 0.47 TRY Eregli Demir ve Celik Fabrikalari 2,010,180 6,903,958 4,131,208 0.66 TRY Ford Otomotiv Sanayi 321,259 2,184,886 892,207 0.14 TRY Haci Omer Sabanci Holding 3,054,410 7,724,813 5,853,111 0.94
The accompanying notes form an integral part of this Semi-Annual Report.

GLOBAL ADVANTAGE FUNDS EMERGING MARKETS HIGH VALUE - TEILFONDS
27
Securities Portfolio (Continued)
as at 30 June 2009 (in EUR)
Currency Description Quantity/Nominal
Purchase Price
Market Value
% of netassets
Turkey (continued)
TRY
KOC Holding 2,926,321 5,554,736 3,602,987 0.58
TRY Petrol Ofisi 85,003 240,791 202,629 0.03TRY Tekfen Holding 509,129 1,571,872 834,238 0.13TRY Tofas Turk Otomobil Fabrikasi 785,575 2,238,062 981,772 0.16TRY Tupras Turkiye Petrol Rafine 449,392 6,056,875 3,910,590 0.63TRY Turk Sise ve Cam Fabrikalari 2,041,082 1,542,058 1,190,392 0.19TRY Turk Telekomunikasyon 1,629,801 3,507,665 3,636,141 0.58TRY Turkcell Iletisim Hizmet 2,458,175 11,768,180 9,728,324 1.56TRY Turkiye Garanti Bankasi 5,104,326 13,458,608 9,875,834 1.58TRY Turkiye Halk Bankasi 1,407,766 4,061,584 3,974,838 0.64TRY Turkiye Is Bankasi Kl. C 4,213,929 12,409,567 8,855,277 1.42TRY Turkiye Vakiflar Bankasi Tao 760,600 885,209 820,297 0.13TRY Yapi ve Kredi Bankasi 5,156,191 9,077,261 5,441,554 0.87 116,880,315 89,925,559 14.40
Hungary HUF Magyar Telekom Telecommunications 6,855,460 18,573,678 14,436,546 2.31HUF MOL Hungarian Oil and Gas 398,918 27,919,707 17,580,942 2.81HUF OTP Bank 296,320 2,996,942 3,813,967 0.61HUF Richter Gedeon 152,703 18,025,009 19,598,255 3.14 67,515,336 55,429,710 8.87
Total shares 686,077,571 618,707,521 99.07
The accompanying notes form an integral part of this Semi-Annual Report.

GLOBAL ADVANTAGE FUNDS EMERGING MARKETS HIGH VALUE - TEILFONDS
28
Rights - Total 0 0 0.00SECURITIES PORTFOLIO IN TOTAL
686,257,364 618,707,521 99.07
OTHER NET ASSETS
6,067,237
0.93
Securities Portfolio (Continued) as at 30 June 2009
(in EUR)
Currency Description Quantity/Nominal
Purchase Price
Market Value
% of netassets
Securities not listed on an official stock exchange
Shares
Brazil
BRL Mesbla (pref. shares) 4,250,000 179,793 0 0.00
Shares - Total
179,793 0 0.00
Rights
BRL
Mesbla 8,439,343 0 0 0.00
The accompanying notes form an integral part of this Semi-Annual Report.
NET ASSETS 624,774,758 100.00

GLOBAL ADVANTAGE FUNDS EMERGING MARKETS HIGH VALUE - TEILFONDS
29
Geographical and Sector Allocation of Securities Portfolio
% of
net assets
% of net assets
Geographical allocation
Thailand 15.26 Turkey 14.40 Russia 13.49 Taiwan 13.39 Hungary 8.87 Egypt 7.61 Poland 7.17 South Africa 4.50 Brazil 3.19 Israel 3.05 China 2.92 South Korea 2.42 Malaysia 1.57 Mexico 1.23
99.07
OTHER NET ASSETS 0.93
NET ASSETS 100.00
Sector allocation Financial services 24.53 Energy 22.97 Telecommunications 13.22 Commodities 12.58 Information technology 7.78 Healthcare 5.85 Industrial goods 5.36 Consumer goods - staples 3.64 Consumer goods - elastic demand 1.81 Utilities 1.33
99.07 OTHER NET ASSETS 0.93 NET ASSETS 100.00
GLOBAL ADVANTAGE FUNDS
30
Notes to the Semi-Annual Report as at 30 June 2009
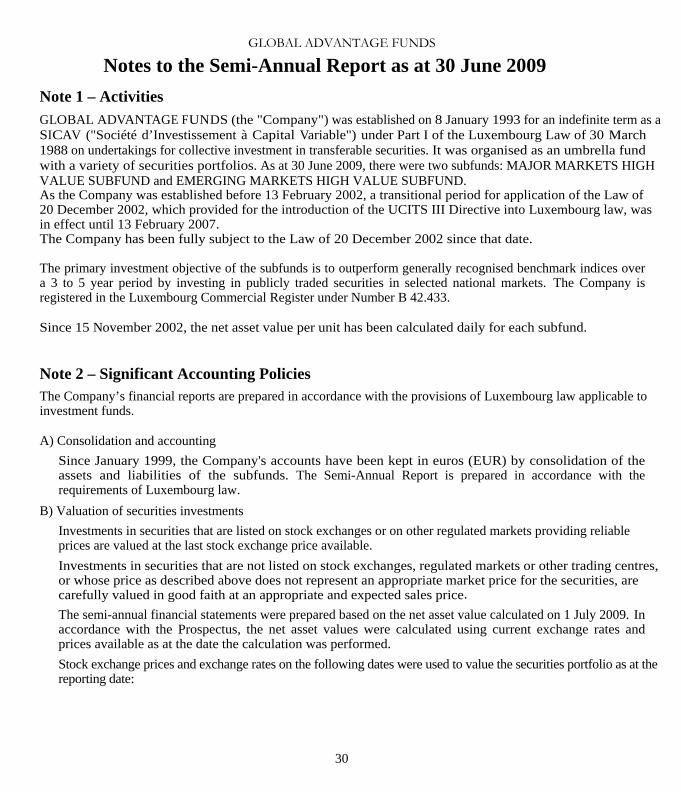
Note 1 – Activities GLOBAL ADVANTAGE FUNDS (the "Company") was established on 8 January 1993 for an indefinite term as a SICAV ("Société d’Investissement à Capital Variable") under Part I of the Luxembourg Law of 30 March 1988 on undertakings for collective investment in transferable securities. It was organised as an umbrella fund with a variety of securities portfolios. As at 30 June 2009, there were two subfunds: MAJOR MARKETS HIGH VALUE SUBFUND and EMERGING MARKETS HIGH VALUE SUBFUND. As the Company was established before 13 February 2002, a transitional period for application of the Law of 20 December 2002, which provided for the introduction of the UCITS III Directive into Luxembourg law, was in effect until 13 February 2007. The Company has been fully subject to the Law of 20 December 2002 since that date.
The primary investment objective of the subfunds is to outperform generally recognised benchmark indices over a 3 to 5 year period by investing in publicly traded securities in selected national markets. The Company is registered in the Luxembourg Commercial Register under Number B 42.433.
Since 15 November 2002, the net asset value per unit has been calculated daily for each subfund.
Note 2 – Significant Accounting Policies The Company’s financial reports are prepared in accordance with the provisions of Luxembourg law applicable to investment funds.
A) Consolidation and accounting
Since January 1999, the Company's accounts have been kept in euros (EUR) by consolidation of the assets and liabilities of the subfunds. The Semi-Annual Report is prepared in accordance with the requirements of Luxembourg law.
B) Valuation of securities investments Investments in securities that are listed on stock exchanges or on other regulated markets providing reliable prices are valued at the last stock exchange price available. Investments in securities that are not listed on stock exchanges, regulated markets or other trading centres, or whose price as described above does not represent an appropriate market price for the securities, are carefully valued in good faith at an appropriate and expected sales price. The semi-annual financial statements were prepared based on the net asset value calculated on 1 July 2009. In accordance with the Prospectus, the net asset values were calculated using current exchange rates and prices available as at the date the calculation was performed. Stock exchange prices and exchange rates on the following dates were used to value the securities portfolio as at the reporting date:
GLOBAL ADVANTAGE FUNDS
31
Notes to the Semi-Annual Report as at 30 June 2009 (Continued)
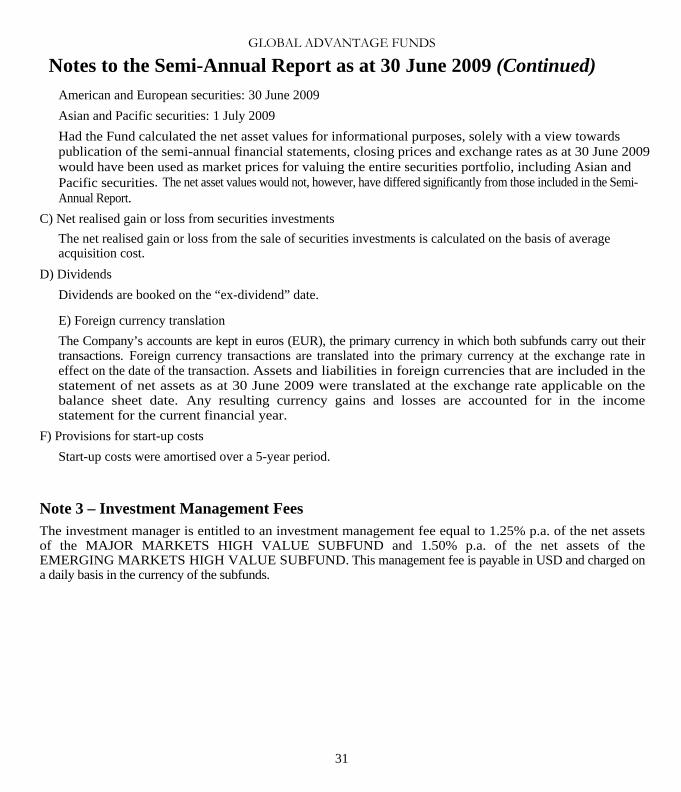
American and European securities: 30 June 2009 Asian and Pacific securities: 1 July 2009 Had the Fund calculated the net asset values for informational purposes, solely with a view towards publication of the semi-annual financial statements, closing prices and exchange rates as at 30 June 2009 would have been used as market prices for valuing the entire securities portfolio, including Asian and Pacific securities. The net asset values would not, however, have differed significantly from those included in the Semi-Annual Report.
C) Net realised gain or loss from securities investments The net realised gain or loss from the sale of securities investments is calculated on the basis of average acquisition cost.
D) Dividends Dividends are booked on the “ex-dividend” date.
E) Foreign currency translation The Company’s accounts are kept in euros (EUR), the primary currency in which both subfunds carry out their transactions. Foreign currency transactions are translated into the primary currency at the exchange rate in effect on the date of the transaction. Assets and liabilities in foreign currencies that are included in the statement of net assets as at 30 June 2009 were translated at the exchange rate applicable on the balance sheet date. Any resulting currency gains and losses are accounted for in the income statement for the current financial year.
F) Provisions for start-up costs Start-up costs were amortised over a 5-year period.
Note 3 – Investment Management Fees The investment manager is entitled to an investment management fee equal to 1.25% p.a. of the net assets of the MAJOR MARKETS HIGH VALUE SUBFUND and 1.50% p.a. of the net assets of the EMERGING MARKETS HIGH VALUE SUBFUND. This management fee is payable in USD and charged on a daily basis in the currency of the subfunds.

GLOBAL ADVANTAGE FUNDS
32
Notes to the Semi-Annual Report as at 30 June 2009 (Continued)
Note 4 – Other Liabilities MAJOR MARKETS H IGH VALUE SUBFUND EUR
Investment management fees 351,976 Management and custody fees 1,272 "Taxe d'abonnement" 41,880 Legal advice and auditing costs 32,007 Other liabilities 31,652
458,787
E M E RGI NG MARKETS H IGH VALUE SUBFUND EUR
Investment management fees 790,863 Management and custody fees 297,406 "Taxe d'abonnement" 76,232 Legal advice and auditing costs 34,161 Other liabilities 133,355
1,332,017
Note 5 – Taxation The Company is subject to Luxembourg tax law. Under the law, the Company is subject to an annual tax ("taxe d'abonnement") equal to 0.05% of the net assets, payable quarterly.
The Company reinvests the securities investment income that remains after deduction of the investment income tax of the countries concerned.
Note 6 – Changes in the Securities Portfolio A list of all purchases and sales performed for the securities portfolio during the financial year is available at no charge from the Company’s registered office and the German information agent.
GLOBAL ADVANTAGE FUNDS
33
Notes to the Semi-Annual Report as at 30 June 2009 (Continued)
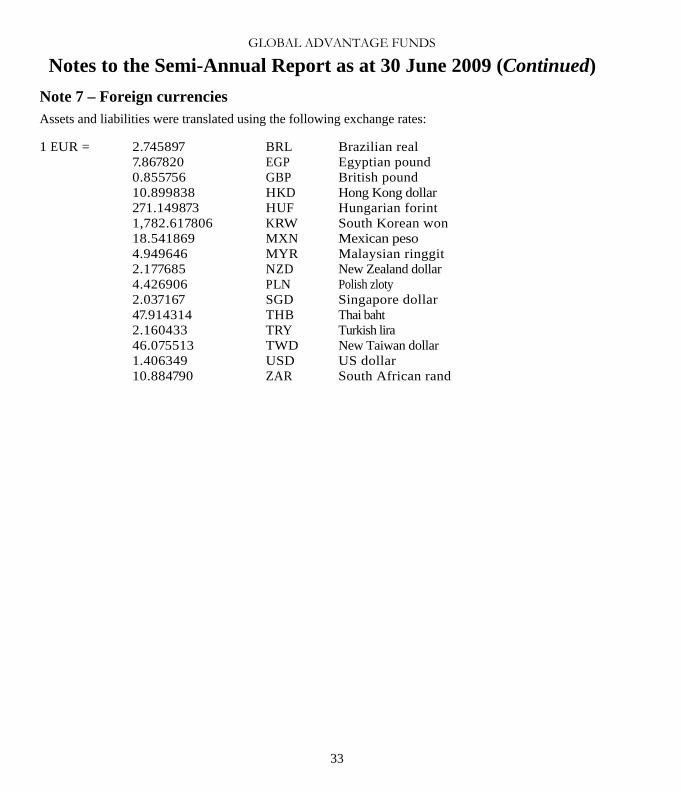
Note 7 – Foreign currencies Assets and liabilities were translated using the following exchange rates:
1 EUR = 2.745897 BRL Brazilian real 7.867820 EGP Egyptian pound 0.855756 GBP British pound 10.899838 HKD Hong Kong dollar 271.149873 HUF Hungarian forint 1,782.617806 KRW South Korean won 18.541869 MXN Mexican peso 4.949646 MYR Malaysian ringgit 2.177685 NZD New Zealand dollar 4.426906 PLN Polish zloty 2.037167 SGD Singapore dollar 47.914314 THB Thai baht 2.160433 TRY Turkish lira 46.075513 TWD New Taiwan dollar 1.406349 USD US dollar 10.884790 ZAR South African rand

GLOBAL ADVANTAGE FUNDS
34

GLOBAL ADVANTAGE FUNDS
35

GLOBAL ADVANTAGE FUNDS
36