Unaudited Financial Statements and Dividend … Comparative... · 1 Pacific Star Development...
15
1 Pacific Star Development Limited Blk 8 #08-05, 51 Benoi Road, Liang Huat Industrial Complex, Singapore 629908 T: (65) 6862 2228 F: (65) 6862 4962 www.pacificstar-dev.com Business Reg. No: 198203779D Second Quarter (“2Q2017”) and First Half (“1H2017”) Unaudited Financial Statements and Dividend Announcement for the Period Ended 30 June 2017 – Amendment to Comparative Numbers There is no change to the Group’s 2Q2017 and 1H2017 results and financial position as at 30 June 2017 and this announcement is being made solely for the purpose of an amendment to the comparative numbers for the corresponding periods ended 30 June 2016 (“2Q2016” and “1H2016” respectively) that were previously disclosed in the Group’s announcement dated 14 August 2017. The comparative numbers presented in this announcement are those of the Target Group (as defined herein) whereas the comparative numbers in the previously published announcement were those of the LH Group Limited. Going forward, the Group will present all comparative numbers as those of the Target Group. Furthermore, following the disposal on 25 May 2017 of Autotrax International Pte. Ltd. (“ Autotrax”), a 51%-owned subsidiary of the Company, the results of Autotrax and its wholly-owned subsidiary, Autovox Korea Co., Ltd., have since been classified as ‘Discontinued Operations’ in 2Q2017 and 1H2017 and are reflected as such in the financial statements contained in this announcement. Background Pacific Star Development Limited (the “Company” and together with its subsidiaries, the “Group”), formerly known as LH Group Limited, was formed through a reverse takeover (“RTO”) of the entire issued share capital of PSD Singapore Pte. Ltd. (formerly known as Pacific Star Development Pte. Ltd.) (the “Target” and together with its subsidiaries, the “Target Group”). The RTO was completed on 15 February 2017 and the Company changed its name to Pacific Star Development Limited. Please refer to the Company’ s Circular dated 30 December 2016 for further details of the RTO. The Target Group is a Singapore-based property developer which is engaged in the business of property development. It is engaged in luxury mixed-use property developments in ASEAN countries, currently in Malaysia and Thailand. Consolidated Financial Statements Following the completion of the RTO (“Completion”), the legal subsidiary, the Target, is regarded as the accounting acquirer and the Company as the accounting acquiree, in accordance with the provision of Singapore Financial Reporting Standard (the “FRS”) 103: Business Combination. As such, the consolidated financial statements have been prepared and presented as a continuation of the Target Group. Accordingly, the consolidated financial statements comprising the profit and loss and other comprehensive income, consolidated statement of financial position, consolidated statement of changes in equity and consolidated statement of cash flows for the second quarter period ended 30 June 2017 have been presented as a continuation of the Target Group’s financial results and operations, in accordance with the following: 1) The assets and liabilities of the accounting acquirer, the Target Group, are recognised and measured in the consolidated statement financial position at their pre-acquisition carrying amount; 2) The assets and liabilities of the accounting acquiree, the Company, are recognised and measured in the consolidated balance sheet at their acquisition-date fair values; 3) The retained earnings and other equity balances recognised in the consolidated financial statements of the Group are the retained earnings and other equity balances of the Target Group immediately before the RTO; 4) The amount recognised as issued equity interest in the consolidated financial statements of the Group is computed by adding to the issued equity of the Target Group immediately before the RTO. However, the equity structure presented in the consolidated financial statements of the Group (i.e. the number and type of equity instruments issued) shall reflect the equity structure of the Company, including the equity instruments issued by the Company to effect the combination; 5) The comparative figures presented in these consolidated financial statements of the Group are those of consolidated financial statements of the Target Group; and 6) The consolidated statement of comprehensive income reflects the full 3 months results of the Target Group together with the post- acquisition results of the Company. Following the Completion, the principal business of the Group is that of the Target Group. The consolidated financial statements of the Group have been prepared using the reverse acquisition accounting as set out in FRS 103. Separate Financial Statements Reverse acquisition accounting applies only to the consolidated financial statements.
Transcript of Unaudited Financial Statements and Dividend … Comparative... · 1 Pacific Star Development...

1
Pacific Star Development Limited
Blk 8 #08-05, 51 Benoi Road, Liang Huat Industrial Complex, Singapore 629908
T: (65) 6862 2228 F: (65) 6862 4962 www.pacificstar-dev.com Business Reg. No: 198203779D
Second Quarter (“2Q2017”) and First Half (“1H2017”) Unaudited Financial Statements and Dividend Announcement for the Period Ended 30 June 2017 – Amendment to Comparative Numbers
There is no change to the Group’s 2Q2017 and 1H2017 results and financial position as at 30 June 2017 and this announcement is being made solely for the purpose of an amendment to the comparative numbers for the corresponding periods ended 30 June 2016 (“2Q2016” and “1H2016” respectively) that were previously disclosed in the Group’s announcement dated 14 August 2017. The comparative
numbers presented in this announcement are those of the Target Group (as defined herein) whereas the comparative numbers in the previously published announcement were those of the LH Group Limited. Going forward, the Group will present all comparative numbers as those of the Target Group. Furthermore, following the disposal on 25 May 2017 of Autotrax International Pte. Ltd. (“Autotrax”), a 51%-owned subsidiary of the
Company, the results of Autotrax and its wholly-owned subsidiary, Autovox Korea Co., Ltd., have since been classified as ‘Discontinued Operations’ in 2Q2017 and 1H2017 and are reflected as such in the financial statements contained in this announcement. Background
Pacific Star Development Limited (the “Company” and together with its subsidiaries, the “Group”), formerly known as LH Group Limited, was formed through a reverse takeover (“RTO”) of the entire issued share capital of PSD Singapore Pte. Ltd. (formerly known as Pacific Star Development Pte. Ltd.) (the “Target” and together with its subsidiaries, the “Target Group”). The RTO was completed on 15
February 2017 and the Company changed its name to Pacific Star Development Limited. Please refer to the Company’s Circular dated 30 December 2016 for further details of the RTO.
The Target Group is a Singapore-based property developer which is engaged in the business of property development. It is engaged in luxury mixed-use property developments in ASEAN countries, currently in Malaysia and Thailand.
Consolidated Financial Statements
Following the completion of the RTO (“Completion”), the legal subsidiary, the Target, is regarded as the accounting acquirer and the
Company as the accounting acquiree, in accordance with the provision of Singapore Financial Reporting Standard (the “FRS”) 103: Business Combination. As such, the consolidated financial statements have been prepared and presented as a continuation of the Target Group. Accordingly, the consolidated financial statements comprising the profit and loss and other comprehensive income, consolidated statement of financial position, consolidated statement of changes in equity and consolidated statement of cash flows for the second quarter period ended 30 June 2017 have been presented as a continuation of the Target Group’s financial results and operations, in accordance with the following: 1) The assets and liabilities of the accounting acquirer, the Target Group, are recognised and measured in the consolidated statement
financial position at their pre-acquisition carrying amount; 2) The assets and liabilities of the accounting acquiree, the Company, are recognised and measured in the consolidated balance sheet
at their acquisition-date fair values; 3) The retained earnings and other equity balances recognised in the consolidated financial statements of the Group are the retained
earnings and other equity balances of the Target Group immediately before the RTO; 4) The amount recognised as issued equity interest in the consolidated financial statements of the Group is computed by adding to the
issued equity of the Target Group immediately before the RTO. However, the equity structure presented in the consolidated financial statements of the Group (i.e. the number and type of equity instruments issued) shall reflect the equity structure of the Company, including the equity instruments issued by the Company to effect the combination;
5) The comparative figures presented in these consolidated financial statements of the Group are those of consolidated financial statements of the Target Group; and
6) The consolidated statement of comprehensive income reflects the full 3 months results of the Target Group together with the post-acquisition results of the Company.
Following the Completion, the principal business of the Group is that of the Target Group. The consolidated financial statements of the Group have been prepared using the reverse acquisition accounting as set out in FRS 103. Separate Financial Statements
Reverse acquisition accounting applies only to the consolidated financial statements.
2
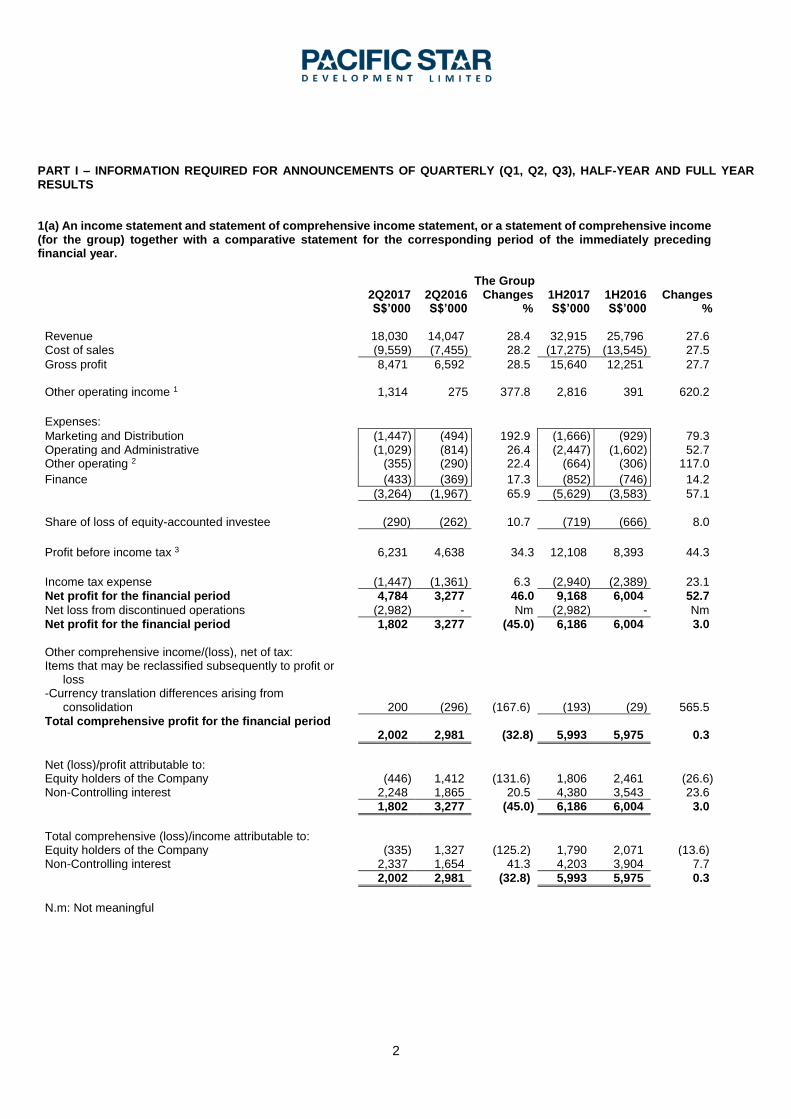
PART I – INFORMATION REQUIRED FOR ANNOUNCEMENTS OF QUARTERLY (Q1, Q2, Q3), HALF-YEAR AND FULL YEAR RESULTS 1(a) An income statement and statement of comprehensive income statement, or a statement of comprehensive income (for the group) together with a comparative statement for the corresponding period of the immediately preceding financial year.
The Group
2Q2017 2Q2016 Changes 1H2017 1H2016 Changes
S$’000 S$’000 % S$’000 S$’000 %
Revenue 18,030 14,047 28.4 32,915 25,796 27.6 Cost of sales (9,559) (7,455) 28.2 (17,275) (13,545) 27.5
Gross profit 8,471 6,592 28.5 15,640 12,251 27.7 Other operating income 1 1,314 275 377.8 2,816 391 620.2
Expenses:
Marketing and Distribution (1,447) (494) 192.9 (1,666) (929) 79.3 Operating and Administrative (1,029) (814) 26.4 (2,447) (1,602) 52.7 Other operating 2 (355) (290) 22.4 (664) (306) 117.0
Finance (433) (369) 17.3 (852) (746) 14.2
(3,264) (1,967) 65.9 (5,629) (3,583) 57.1
Share of loss of equity-accounted investee (290) (262) 10.7 (719) (666) 8.0
Profit before income tax 3 6,231 4,638 34.3 12,108 8,393 44.3
Income tax expense (1,447) (1,361) 6.3 (2,940) (2,389) 23.1
Net profit for the financial period 4,784 3,277 46.0 9,168 6,004 52.7
Net loss from discontinued operations (2,982) - Nm (2,982) - Nm
Net profit for the financial period 1,802 3,277 (45.0) 6,186 6,004 3.0
Other comprehensive income/(loss), net of tax: Items that may be reclassified subsequently to profit or
loss
-Currency translation differences arising from consolidation
200
(296)
(167.6)
(193)
(29)
565.5
Total comprehensive profit for the financial period 2,002
2,981
(32.8)
5,993
5,975
0.3
Net (loss)/profit attributable to: Equity holders of the Company (446) 1,412 (131.6) 1,806 2,461 (26.6) Non-Controlling interest 2,248 1,865 20.5 4,380 3,543 23.6
1,802 3,277 (45.0) 6,186 6,004 3.0
Total comprehensive (loss)/income attributable to: Equity holders of the Company (335) 1,327 (125.2) 1,790 2,071 (13.6) Non-Controlling interest 2,337 1,654 41.3 4,203 3,904 7.7
2,002 2,981 (32.8) 5,993 5,975 0.3
N.m: Not meaningful

3
1(a)(i) Other disclosures to Group Income Statement
2Q2017 2Q2016 1H2017 1H2016 S$’000 S$’000 S$’000 S$’000
Note 1 Other operating income comprised: Foreign exchange gain 150 - 146 85 Gain on acquisition of subsidiaries (negative goodwill) - - 1,224 - Gain on disposal of subsidiary - 167 - 167 Government grant 11 - 21 - Interest income 41 108 138 122 Reversal of provision of warranty 1,067 - 1,067 - Other income - - 145 17 Rental income from external party 45 - 75 -
1,314 275 2,816 391
Note 2 Other operating expenses comprised: Foreign exchange loss - 170 - - Listing and compliance expenses 43 - 78 - Professional fee 57 44 114 146 Legal and professional fee in relation to the RTO 165 - 234 - Auditors’ remuneration 31 14 76 31 Directors’ fee 38 - 66 - Loss on disposal of property, plant and equipment - - 14 - Other expenses 21 62 82 129
355 290 664 306
Note 3 Profit before income tax has been arrived at after charging /
(crediting):
Depreciation of property, plant and equipment 91 99 194 159 Foreign exchange (gain)/loss (net) (150) 170 (146) (85) Loss on disposal of property, plant and equipment - - 14 - Interest expenses 433 369 852 746 Interest income (42) (108) (138) (122) Reversal of write down of inventories - - (78) -

4
1 (b) (i) A statement of financial position (for the issuer and the group), together with a comparative statement as at the end of the immediately preceding financial year
The Group The Company 30/06/2017 31/12/2016 30/06/2017 31/12/2016
S$’000 S$’000 S$’000 S$’000
ASSETS Current assets Cash and bank balances 10,652 6,412 2,670 10,474 Financial assets, at fair value through profit or loss 5 - - - Trade receivables 10,060 5,559 1,971 725 Other receivables and other current assets 12,731 12,137 244 3,537 Inventories 328 - - - Short term-deposits 501 - 501 - Unbilled receivables 15,389 - - - Deferred costs 2,083 2,997 - - Development property 120,561 103,137 - -
172,310 130,242 5,386 14,736
Non-current assets Investment in subsidiaries - - 170,088 - Deferred costs 260 260 - - Property, plant and equipment 295 340 7 3
555 600 170,095 3
Total assets 172,865 130,842 175,481 14,739
LIABILITIES Current liabilities Deferred income - 1,865 - - Trade payables 36,736 20,512 - - Other payables 11,474 14,986 14,778 2,283 Borrowings 9,091 4,152 - - Current tax liabilities 8,586 5,835 - - Advance billings 1,430 - - - Joint Venture 2,513 2,004 - - Associates 765 555 - - Provision for warranty 1,061 - - -
71,656 49,909 14,778 2,283
Non-current liabilities
Loans and borrowings 41,866 35,497 - - Loans from non-controlling interests 13,787 13,227 - - Deferred tax liabilities 1,933 1,807 - -
57,586 50,531 - -
Total liabilities 129,242 100,440 14,778 2,283
NET ASSETS 43,623 30,402 160,703 12,456
EQUITY Capital and reserves attributable to equity holders of the Company
Share capital 25,301 17,738 195,642 48,196 Treasury shares - - (513) (513) Reserves 3,144 1,689 (34,426) (35,227)
28,445 19,427 160,703 12,456
Non-controlling interest 15,178 10,975 - -
Total equity 43,623 30,402 160,703 12,456

5
1(b)(ii) Aggregate amount of group’s borrowings and debt securities.
Amount repayable in one year or less, or on demand
As at 30/06/2017 As at 31/12/2016
Secured Unsecured Secured Unsecured
S$9,091,000 - S$4,152,000 -
Amount repayable after one year
As at 30/06/2017 As at 31/12/2016
Secured Unsecured Secured Unsecured
$41,866,000 $13,787,000 S$35,497,000 S$13,227,000
Details of any collateral
The borrowings are secured as follows:
- fixed deposits and short-term deposits of S$778,000 (31/12/2016:Nil); - legal mortgage on the Group’s development property; - assignment of all rights and benefits to sale, lease and/or insurance proceeds in respect of the Group’s development property;
and - corporate guarantees from a subsidiary and a non-controlling interest.

6
1 (c) A cash flow statement (for the group), together with a comparative statement for the corresponding period of the immediately preceding financial year.
The Group
2Q2017 2Q2016 1H2017 1H2016
S$’000 S$’000 S$’000 S$’000
Cash Flow from Operating Activities
Profit before income tax from continuing operations 6,231 4,638 12,108 8,393 Loss before income tax from discontinued operations (2,982) - (2,982) - Adjustments for: Amortisation of deferred cost 515 419 934 761 Depreciation of property, plant and equipment 91 99 194 159 (Gain)/Loss on disposal of property, plant and Equipment - - 14 - (Gain) on disposals of subsidiaries - (167) - (167) Loss on disposal of the vehicle sub-division 2,777 - 2,777 - Interest expense 433 369 852 746 Interest income (42) (108) (138) (122) Share of losses of equity-accounted investees 290 262 719 666 Gain on acquisition of subsidiaries (negative goodwill) - - (1,224) - Unrealised foreign exchange gain (153) (488) (146) (85)
Operating cash flow before working capital changes 7,160 5,024 13,108 10,351 Movement in working capital Changes in development property (11,317) (6,889) (16,653) (17,613) Changes in inventories and construction contracts (147) - (122) - Changes in deferred costs 499 (68) 915 (110) Changes in deferred income (12,672) (2,175) (17,039) (3,428) Changes in trade, other receivables and other current assets 1,631 (1,284) 4,211 (3,977) Changes in financial assets, at fair value through profit or loss - - - - Changes in trade, other payables and provision for warranty 1,416 5,327 1,893 (3,902)
Cash used in operations (13,430) (65) (13,687) (18,679) Interest received 42 108 138 122 Interest paid (309) (667) (837) (1,217) Income tax paid - 1 - (4)
Net cash used in operating activities (13,697) (623) (14,386) (19,778) Cash Flows from Investing Activities Acquisition of subsidiaries - - (8,474) - Additions to property, plant and equipment (78) (204) (78) (205) Advances to a joint venture and associate (non-trade) - (934) - (934) Disposal of subsidiaries, net of cash - (22) - (22) Proceeds from disposal of vehicle sub-division 350 - 350 - Proceeds from disposal of plant and equipment - - 269 -
Net cash generated from/(used in) investing activities 272 (1,160) (7,933) (1,161) Cash Flows from Financing Activities Loan/Advance from former holding company (non-trade) 180 (2,666) 3,420 1,541 Proceeds from bank borrowings 9,551 6,224 10,893 21,684 Repayment of finance lease liabilities (14) (12) (26) (26) Movement in fixed deposits pledged with banks 3 - 4,309 - Proceeds from conditional placement of shares - - 8,521 -
Net cash generated from financing activities 9,720 3,546 27,117 23,199 Net (decrease)/increase in cash and cash equivalents (3,705) 1,763 4,798 2,260 Effect of currency translation on cash and cash equivalents 32 (52) (5) 30 Cash and cash equivalents at beginning of financial period 12,461 2,605 3,995 2,026
Cash and cash equivalents at end of financial period 8,788 4,316 8,788 4,316
Cash and cash equivalents comprises: Cash and bank balances 10,652 6,741 10,652 6,741 Less: Fixed deposits pledged (277) - (277) - Less: Bank overdraft (1,587) (2,425) (1,587) (2,425)
Cash and cash equivalents 8,788 4,316 8,788 4,316

7
1 (d) (i) A statement (for the issuer and group) showing either (i) all changes in equity or (ii) changes in equity other than those arising from capitalisation issues and distributions to shareholders, together with a comparative statement for the corresponding period of the immediately preceding financial year.
Attributable to equity holders of the Company
Currency Non- Share Accumulated Capital translation controlling Total
capital losses reserves reserve Total interest equity
S$'000 S$'000 S$'000 S$'000 S$'000 S$'000 S$'000
The Group
Balance at 1 January 2017 17,738 (847) 3,029 (493) 19,427 10,975 30,402
Net profit for the financial period - 2,252 - - 2,252 2,132 4,384
Other comprehensive income for the financial period, net of tax:
Currency translation differences arising from consolidation - - - (127) (127) (266) (393)
Total comprehensive income/(loss) for the financial period - 2,252 - (127) 2,125 1,866 3,991
Transaction with owners, recognised directly in equity:
Issue of shares – Placement 8,521 - - - 8,521 - 8,521
Acquisition of subsidiaries arising from reverse acquisition (958) - - (3) (961) (3,412) (4,373)
Total transactions with owners of the Company 7,563 - - (3) 7,560 (3,412) 4,148
Balance at 31 March 2017 25,301 1,405 3,029 (623) 29,112 9,429 38,541
Net (loss)/profit for the financial period - (446) - - (446) 2,248 1,802
Other comprehensive income for the financial period, net of tax:
Currency translation differences arising from consolidation - - - 111 111 89 200
Total comprehensive (loss)/income for the financial period - (446) - 111 (335) 2,337 2,002
Disposal of subsidiaries - (374) - 42 (332) 3,412 3,080
Total transactions with owners of the Company - (374) - 42 (332) 3,412 3,080
Balance at 30 June 2017 25,301 585 3,029 (470) 28,445 15,178 43,623

8
Attributable to equity holders of the Company
Currency Non-
Share Accumulated Capital translation controlling Total
capital losses reserves reserve Total interest Equity
S$'000 S$'000 S$'000 S$'000 S$'000 S$'000 S$'000
Balance at 1 January 2016 16,820 (9,798) 3,029 102 10,153 2,662 12,815
Net profit for the financial period - 1,049 - - 1,049 1,678 2,727
Other comprehensive income for the financial period, net of tax:
Currency translation differences arising from consolidation - - - (305) (305) 572 267
Total comprehensive (loss)/income for the financial period - 1,049 - (305) 744 2,250 2,994
Transaction with owners, recognised directly in equity:
Purchase of treasury shares 918 - - - 918 - 918
Total transaction with owners of the Company 918 - - - 918 - 918
Balance at 31 March 2016 17,738 (8,749) 3,029 (203) 11,815 4,912 16,727
Net loss for the financial period - 1,412 - - 1,412 1,865 3,277
Other comprehensive income for the financial period, net of tax:
Currency translation differences arising from consolidation - - - (85) (85) (211) (296)
Total comprehensive (loss)/income for the financial period - 1,412 - (85) 1,327 1,654 2,981
Transaction with owners, recognised directly in equity:
Purchase of treasury shares - - - 2 2 - 2
Total transaction with owners of the Company - - - 2 2 - 2
Balance at 30 June 2016 17,738 (7,338) 3,029 (286) 13,143 6,566 19,709

9
Share Treasury Accumulated
Share options Other
capital shares losses reserve reserves Total
S$'000 S$'000 S$'000 S$'000 S$'000 S$'000
The Company
Balance at 1 January 2017 48,196 (513) (33,828) 71 (1,470) 12,456
Net loss for the financial period - - (254) - - (254)
Total comprehensive income for the period - - (254) - - (254)
Increase in share capital 142,668 - - - - 142,668
Share issue expenses - - - - (309) (309)
Reversal of employee share options - - 13 (13) - -
Balance at 31 March 2017 190,864 (513) (34,069) 58 (1,779) 154,561
Net profit for the financial period - - 1,364 - - 1,364
Total comprehensive income for the period - - 1,364 - - 1,364
Increase in share capital 4,778 - - - - 4,778
Balance at 30 June 2017 195,642 (513) (32,705) 58 (1,779) 160,703
Balance at 1 January 2016 48,196 (104) (25,417) 194 (1,470) 21,399
Net profit for the financial period - - 53 - - 53
Total comprehensive income for the period - - 53 - - 53
Purchase of treasury shares - (332) - - - (332)
Balance at 31 March 2016 48,196 (436) (25,364) 194 (1,470) 21,120
Net profit for the financial period - - 131 - - 131
Total comprehensive income for the period - - 131 - - 131
Purchase of treasury shares - (34) - - - (34)
Balance at 30 June 2016 48,196 (470) (25,233) 194 (1,470) 21,217
1(d)(ii) Details of any changes in the company's share capital arising from rights issue, bonus issue, share buy-backs, exercise of share options or warrants, conversion of other issues of equity securities, issue of shares for cash or as consideration for acquisition or for any other purpose since the end of the previous period reported on. State the number of shares that may be issued on conversion of all the outstanding convertibles, if any, against the total number of issued shares excluding treasury shares of the issuer, as at the end of the current financial period reported on and as at the end of the corresponding period of the immediately preceding financial year. State also the number of shares held as treasury shares and the number of subsidiary holdings, if any and the percentage of the aggregate number of treasury shares and subsidiary holdings held against the total number of shares outstanding in a class that is listed as at the end of the current financial period reported on and as at the end of the corresponding period of the immediately preceding financial year.
(i) Share capital
30/06/2017 31/03/2017 31/12/2016
Number of ordinary shares
S$’000
Number of ordinary shares
S$’000
Number of ordinary shares
S$’000
Issued and fully paid
ordinary shares
502,336,278
195,642
477,961,278
190,864
15,782,926
48,196

10
(ii) Share capital excluding treasury shares
Number of ordinary shares
S$’000
At 1 January 2017 14,891,126 47,683 Issue of placement shares 11,037,500 8,830 Issue of consideration shares 132,500,000 133,838
At 31 March 2017 158,428,626 190,351 Issue of top-up shares in relation to the RTO 8,125,000 4,778
166,553,626 195,129
Share split on the basis of every 1 share into 3 shares
499,660,878 195,129
As at 30 June 2017 499,660,878 195,129
As at 30 June 2017, the Company held 2,675,400 treasury shares (after the share split on the basis of every 1 share into 3 shares). (30 June 2016: 817,800 treasury shares, before the share split).
(iii) Share options
As at 30 June 2017, the unissued shares of the Company under option are as follows:
Date of grant of options
Exercise price per
share before share split
Exercise price per
share after share split
Balance as at
1/1/2017
Granted/ Forfeited during the
period
Balance before
share split
Balance as at
30/6/2017 after share
split
Balance as at
30/6/2016 Exercise period
4.3.2014 S$1.75 S$0.583 126,400 (24,000) 102,400 307,200
130,400 3.3.15 to 2.3.19
1(d)(iii) To show the total number of issued shares excluding treasury shares as at the end of the current
financial period and as at the end of the immediately preceding year.
Number of shares
30/06/2017 30/06/2016 31/12/2016
Total number of issued shares 502,336,278 15,782,926 15,782,926
Treasury shares 2,675,400 817,800 891,800
Total number of issued shares excluding treasury shares
499,660,878 14,965,126 14,891,126
% of treasury shares over total number of issued shares
0.5% 5.2% 5.7%
1(d)(iv) A statement showing all sales transfers, disposal, cancellation and/or use of treasury shares as at the
end of the current financial period reported on.
The Company held 2,675,400 treasury shares (after share split on the basis of every 1 share into 3) as at 30 June 2017. There were no sales, transfers, cancellation and / or use of treasury shares as at the end of the current financial period reported on.
1(d)(v) A statement showing all sales, transfers, cancellation and/or use of subsidiary holdings as at as at the end of the current financial period reported on.
Not applicable. The Company does not have subsidiary holdings.
2. Whether the figures have been audited, or reviewed and in accordance with which auditing standard or
practice.
The figures have not been audited or reviewed by our auditors.

11
3. Where the figures have been audited or reviewed, the auditors' report (including any qualifications or emphasis of matter).
Not applicable. 4. Whether the same accounting policies and methods of computation as in the issuer's most recently audited
annual financial statements have been applied.
The accounting policies and methods of computation applied by the Group in the financial statements for the current reporting period are consistent with those applied in the Company’s audited financial statements for the financial year ended 31 December 2016 except that the Group has early adopted FRS 115 Revenue from Contracts with Customers.
5. If there are any changes in the accounting policies and methods of computation, including any required by
an accounting standard, what has changed, as well as the reasons for, and the effect of, the change. The early adoption of FRS 115 Revenue from Contracts with Customers for the Non-Property Division after the
Completion did not have a significant impact on the financial performance or position of the Group.
6. Earnings per ordinary share of the group for the current period reported on and the corresponding period of the immediately preceding financial year, after deducting any provision for preference dividends.
Profit/(Loss) per share for the period from continuing operations after deducting any provision for preference dividends (cents)
2Q2017 2Q2016 1H2017 1H2016
(a) Based on weighted average number of ordinary shares in issue
0.52 0.90 1.19 1.61
(b) On a fully diluted basis* 0.52 0.90 1.19 1.61
Profit/(Loss) per share for the period from discontinued operations after deducting any provision for preference dividends (cents)
2Q2017 2Q2016 1H2017 1H2016
(a) Based on weighted average number of ordinary shares in issue
(0.61) - (0.74) -
(b) On a fully diluted basis* (0.61) - (0.74) -
Profit per share for the financial period ended 30 June 2017 from continuing operations was computed based on the net profit attributable to equity holders of the Company for 2Q2017 of S$2,536,000 (2Q2016: S$1,412,000) and the net profit attributable to equity holders of the Company for 1H2017 of S$4,788,000 (1H2016: S$2,461,000) and divided by the weighted average number of shares in issue after share consolidation and excluding treasury shares as shown below. Loss per share for the financial period ended 30 June 2017 from discontinued operations was based on the net loss attributable to equity holders for the Company for 2Q2017 of S$2,982,000 (2Q2016: nil) and the net loss attributable to equity holders of the Company for 1H2017 of S$2,982,000 (1H2016: nil) and divided by the weighted average number of shares in issue after share consolidation and excluding treasury shares as follows:
1H2017 1H2016
Weighted average number of ordinary shares
(a) Based on weighted average number of ordinary shares in issue; and 403,808,159 17,278,627
(b) On fully diluted basis* 403,808,159 17,278,627
*The exercise price of the share options of the Company are above the quoted market price of the Company’s shares for both periods and therefore the options are non-dilutive.
7. Net asset value (for the issuer and group) per ordinary share based on the total number of shares excluding treasury shares of the issuer at the end of the (a) current period reported on and (b) immediately preceding financial year
The Group The Company
30/06/2017 31/12/2016 30/06/2017 31/12/2016
Net asset backing per ordinary share based on existing issued share capital as at the end of the period/year (cents)
5.69 12.38 32.16 83.65

12
8. A review of the performance of the group, to the extent necessary for a reasonable understanding of the group's business. It must include a discussion of the following:- (a) any significant factors that affected the turnover, costs and earnings of the group for the current financial period reported on, including (where applicable) seasonal or cyclical factors; and (b) any material factors that affected the cash flow, working capital, assets or liabilities of the group during the current financial period reported on.
The unaudited financial results of the Group for 2Q2017 and 1H2017 set out in this announcement include both the Non-Property Division and the Property Division upon the Completion, as compared to the unaudited financial results of the Group for 2Q2016 and 1H2016 prior to the RTO which includes only the Property Division.
Statement of Comprehensive Income
The Group’s revenue increased by S$4.0 million or 28.4% from S$14.0 million in 2Q2016 to S$18.0 million in 2Q2017. The Group’s cost of sales correspondingly increased by $2.1 million or 28.2% from S$7.5 million in 2Q2016 to S$9.6 million in 2Q2017.
The increase in revenue and cost of sales is due mainly to contribution of revenue and cost of sales from the Non-Property Division amounting to S$1.2 million and S$1.0 million respectively in 2Q2017 subsequent to the Completion of the RTO. Revenue in 2Q2017 comprised mostly from revenue recognized on the sales of the Property Division’s Puteri Cove Residences & Quayside project in Iskandar, Malaysia.
The Group’s other operating income increased by S$1.0 million from S$0.3 million in 2Q2016 to S$1.3 million in 2Q2017 mainly due to the reversal of provision of warranty of the Non-Property Division.
The Group’s marketing and distribution expenses in 2Q2017 of S$1.4 million was incurred solely by the Property Division subsequent to the Completion of the RTO. The increase in marketing expenses is due to the Group actively engaging in marketing activities such as advertisement and road show exhibition.
The Group’s operating and administrative expenses increased by S$0.2 million to S$1.0 million in 2Q2017 from S$0.8 million in 2Q2016 mainly due to the inclusion of the Non-Property Division’s operating and administrative expenses upon the Completion. The Group’s finance expenses increased by S$0.1 million to S$0.4 million in 2Q2017 from S$0.3 million in 2Q2016 mainly due to the inclusion of the Non-Property Division’s finance costs upon the Completion of the RTO.
There was a share of losses from equity-accounted investee mainly due to recognition of losses in the Group’s investment in Thailand where the revenue from the sales of property is recognised upon delivery of the property after development. The share of losses recognised is the Group’s share of the operating costs charged to profit and loss for the period. The share of losses from equity-accounted investee was contributed mainly by the Property Division.
On 25 May 2017, the Group completed the disposal of its 51% shareholding in Autotrax in line with the Group’s strategy to focus on its core business and divest its vehicle business which had been performing poorly. Autotrax results were previously reported in the Non-Property Division of the Group’s results. Accordingly, following the disposal, the results of Autotrax and its wholly-owned subsidiary, Autovox Korea Co., Ltd., were classified as ‘Discontinued Operations’ in 2Q2017 and 1H2017. The Group recorded a net profit after tax of S$1.8 million in 2Q2017 compared to S$3.3 million in 2Q2016 mainly due to the inclusion of the net loss after tax of the Non-Property Division upon the Completion. Net loss after tax of Non-Property Division is mainly a result of the loss on the disposal of the vehicle sub-division of approximately S$2.8 million arising mainly from the waiver of the receivables and the non-controlling interest of the vehicle sub-division.
Statement of Financial Position
The current assets of the Group increased by S$42.1 million to S$172.3 million as at 30 June 2017 from S$130.2 million as at 31 December 2016. The increase was mainly due to the inclusion of the current assets of the Non-Property Division upon the Completion and increase in current assets of the Property Division of approximately S$30.9 million. The current assets of the Non-Property Division as at 30 June 2017 include: (i) trade and other receivables of $6.3 million, (ii) unbilled revenue of S$0.2 million, (iii) inventories of S$0.3 million and (iv) cash and bank balances of S$5.5 million. Increase in current assets of the Property Division was mainly due to the following: (i) Property Division's deferred income has decreased drastically and resulted in unbilled revenue of S$15.2 million, pending the archiect’s certification of the stage completed for billing to the buyers of Puteri Cove Residences & Quayside Project (ii) increase in development cost incurred during the current period S$35.0 million, which has been decreased by the costs recognised in income statement during the current period amounted to S$17.5 million. This was partially offset by the decrease in current assets of the Property Division of approximately S$19.7 million mainly due to the decrease in cash and bank balances related to higher repayments to main contractor and decrease in development costs capitalized as a result of costs of units sold being recognised in income statement during 1H2017which amounted to S$17.5 million.

13
The non-current liabilities of the Group increased by S$7.1 million to S$57.6 million as at 30 June 2017 from S$50.5 million as at 31 December 2016. The increase was mainly due to Property Division’s further drawn down from bridging loan and Fixed loan and additional unwinding of implicit interest component of loans from non-controlling interests. This has been offset by repayments made during 2Q2017.
The current liabilities of the Group increased by S$21.8 million to S$71.7 million as at 30 June 2017 from S$49.9 million as at 31 December 2016 mainly due to the inclusion of the current liabilities of the Non-Property Division of approximately S$6.7 million upon the Completion and increase of current liabilities of Property Division of S$15.0 million. The increase of current liabilities of Non-Property Division comprised (i) trade and other payables of approximately S$4.2 million, (ii) advanced billings of S$1.4 million and (iii) provision of warranty of S$1.1 million. The increase in current liabilities of Property Division was mainly due to higher progress claims raised by the main contractor as well as additional current tax liabilities during the HY2017.
Cash Flow Statement
The Group’s 1H2017 net cash used in operating activities decreased substantially by S$5.0 million, which arose due to less net cash used in operating activities by the Property Division by approximately S$6.8 million and the inclusion of the net cash used in operating activities of the Non-Property Division amounting to approximately S$1.0 million upon the Completion. The Group’s increase in cash used in investing activities in 1H2017 of S$6.8 million was mainly due to the cash consideration of S$16.0 million paid in relation to the RTO, offset by the cash and cash equivalents acquired through the RTO of S$7.5 million, and the proceeds from disposal of vehicle sub-division of S$0.4 million and the proceeds from disposal of plant and equipment of S$0.3 million. The Group’s increase in cash generated from financing activities for 1H2017 of S$27.1 million was mainly due to (i) the net proceeds from the conditional placement of shares of approximately S$8.5 million, (ii) withdrawal of the fixed deposits of S$4.3 million to pay for the cash consideration upon the Completion and (iii) drawdown of bank loan of S$10.9 million for the payment for the construction of Puteri Cove Residences & Quayside Project in Malaysia and (iv) loan drawdown from former holding company of S$3.4 million. The Group’s cash generated from financing activities in 1H2017 of S$3.9 million is due to the abovementioned reasons, offset by the proceeds from loans from banks of S$21.7 million in 1H2016.
9. Where a forecast, or a prospect statement, has been previously disclosed to shareholders, any variance between it and the actual results.
No forecast or prospect statement has been previously disclosed.
10. A commentary at the date of the announcement of the significant trends and competitive conditions of the
industry in which the group operates and any known factors or events that may affect the group in the next reporting period and the next 12 months.
After the Completion of the RTO, the Group now comprises of the Property Division and the Non-Property Division. Property Division The Property Division will seek to continue to tap on its network of relationships with leading real estate players and investors throughout ASEAN to expand its business. In Iskandar Malaysia, the Group expects demand for new property development projects to trend upwards, due to, amongst others, increased demand for high-quality housing, the construction of the upcoming Kuala Lumpur-Singapore high speed rail and Johor Bahru-Singapore Rapid Transit System. This would be subject to market conditions in the property development industry, as well as the economic performance of Iskandar Malaysia. In Bangkok, Thailand, the Group expects that condominiums near mass rapid transit stations will continue to attract buyers, resulting in higher pre-sale absorption rates in these projects relative to those projects located further from a mass rapid transit station. The expected construction of new mass rapid transit routes could generate significant turnover in the land sales market, leading to higher land prices resulting in increasing condominium prices across the market. Non-Property Division The industry in which the Aluminum Division operates is closely correlated to the overall conditions of the building construction industry. As the building construction industry slows down, the operating environment for the Aluminum Division is expected to remain challenging because of keen competition.

14
On 8 May 2017, the Company entered into a sale and purchase agreement to dispose all of its shareholding in Autotrax International Pte. Ltd.. The disposal was completed on 25 May 2017 and the vehicle sub-division ceased to be a sub-division of the Group. Accordingly, the Non-Property Division of the Group now consists solely of the Aluminum sub-division.
11. Dividend
(a) Current financial period reported on
Any dividend declared for the current financial period reported on? None.
(b) Corresponding period of the immediate preceding year
Any dividend declared for the corresponding period of the immediate preceding financial year? None.
(c) Date payable
Not applicable.
(d) Books closure date
Not applicable. 12. If no dividend has been declared / recommended, a statement to that effect.
Not applicable.
13. If the Group has obtained a general mandate from shareholders for IPTs, the aggregate value of such
transactions as required under Rule 920(1)(a)(ii). If no IPT mandate has been obtained, a statement to that effect.
There was no interested person transaction conducted under the shareholders’ mandate obtained at the annual general meeting of the Company held on 26 April 2016 pursuant to Rule 920 for the financial period ended 30 June 2017.
PART II- ADDITIONAL INFORMATION REQUIRED FOR FULL YEAR ANNOUNCEMENT (This part is not applicable to Q1, Q2, Q3 and Half Year Results)
14 Confirmation pursuant to Rule 720(1) of the Listing Manual
The Company has procured undertakings from all its directors and executive officers under Rule 720(1).
15 Confirmation by the board pursuant to Rule 705(5) of the listing manual
I, Glen Chan, being a director of Pacific Star Development Limited (the “Company”), do hereby confirm on behalf of
the directors of the Company, that, to the best of my knowledge, nothing has come to the attention of the Board of Directors of the Company which may render the unaudited financial results of the Company and of the Group for the second quarter and six months ended 30 June 2017 to be materially false or misleading.

15
On behalf of the Board of Directors of PACIFIC STAR DEVELOPMENT LIMITED
Glen Chan CEO and Managing Director
Singapore, 9 November 2017
This announcement has been prepared by the Company and its contents have been reviewed by the Company’s Sponsor, SAC Capital Private Limited (the “Sponsor”), for compliance with the relevant rules of the Singapore Exchange Securities Trading Limited (the “SGX-ST”).
The Sponsor has not independently verified the contents of this announcement. This announcement has not been examined or approved by the SGX-ST and the SGX-ST assumes no responsibility for the contents of this announcement including the correctness of any of the statements or opinions made or reports contained in this announcement.
The contact person for the Sponsor is Mr. Sebastian Jones, SAC Capital Private Limited at 1 Robinson Road, #21-02 AIA Tower, Singapore 048542. Telephone number: +65 6532 3829.