UN GWG on Big Data – Scanner Data...Task Team on Scanner Data Initial focus on the use of scanner...
24
UN GWG on Big Data – Scanner Data Tanya Flower, Task Team on Scanner Data
Transcript of UN GWG on Big Data – Scanner Data...Task Team on Scanner Data Initial focus on the use of scanner...

UN GWG on Big Data – Scanner Data
Tanya Flower, Task Team on Scanner Data
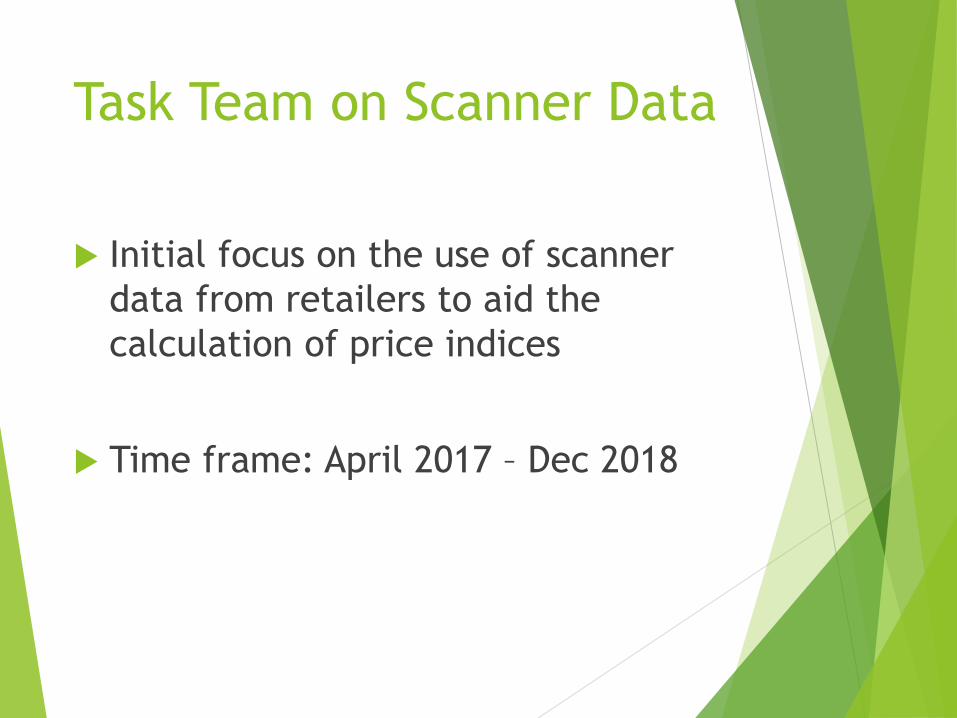
Task Team on Scanner Data
Initial focus on the use of scanner data from retailers to aid the calculation of price indices
Time frame: April 2017 – Dec 2018

Task team members
Nathalie Brault (chair) and Jonathan Wylie (Canada)
Antonio Chessa (Netherlands)
Thomas Hjorth Jacobsen (Denmark)
Michael Holt (Australia)
Tanya Flower (UK)
Donal Lynch, Alan Bentley (New Zealand)
Ken van Loon (Belgium)
Michael Smedes (UN)

Task Team on Scanner Data
Aim: Increase the effective use of scanner data in official statistics…1. ..through lowering the barriers of entry for
countries by providing a library of methods, guidance and training
2. ..via the sharing of experience, practice and learning between countries on the use of scanner data
3. ..and through supporting Public-Private collobaration in the acquisition and use of scanner data

Task Team on Scanner Data
Deliverables:1. Delivery of a tool hosted on the UN Global
Platform for analysis, monitoring and index estimation using historic scanner data from Nielsen
2. Accompanying training and instructional material on the use of the tool
3. Accompanying methodological guidance material summarising and referencing to literature, recommendations and cataloging good practice

Short history of index methods
Base period, e.g. January
Current period, e.g. October
Compare price change of a fixed basket of
goods over time

New data = new methods?
These new data sources allow for different index methods to be used
E.g, there are index methods that allow for new products to enter the market during the year
Scanner data also gives us an opportunity to change the expenditure weights over time

But how do we choose?
Inflation statistics are often one of the most high-profile releases that an NSI produces
Changing the methodology and data source requires a lot of research and analysis before an NSI can decide on a final plan of implementation

Instructional Guide

Case studies
Many NSIs are starting to research the feasibility of using these data in a production environment
The instructional guide is a useful summary of current literature and includes case studies of NSIs who have implemented the data in production

UN Global Platform
The aim of this tool is to allow NSIs access to tested index method code, and to practise using the different methodologies on some training data

Nielsen data
2 data sets for milk and cauliflower
Canada, June 2015 to June 2018 Key variables: unique ID, product
name, salesunits (quantity), salestonnage or saleslitres(quantity), salesCAD (expenditure)
Derive a unit price for each product

Demo of using the UN Global Platform – initial analysis

Nielsen data
Churn (cauliflower) – 40 unique products at the beginning
of the period
46 unique products at the end
35 products remained in the sample over the 3 years
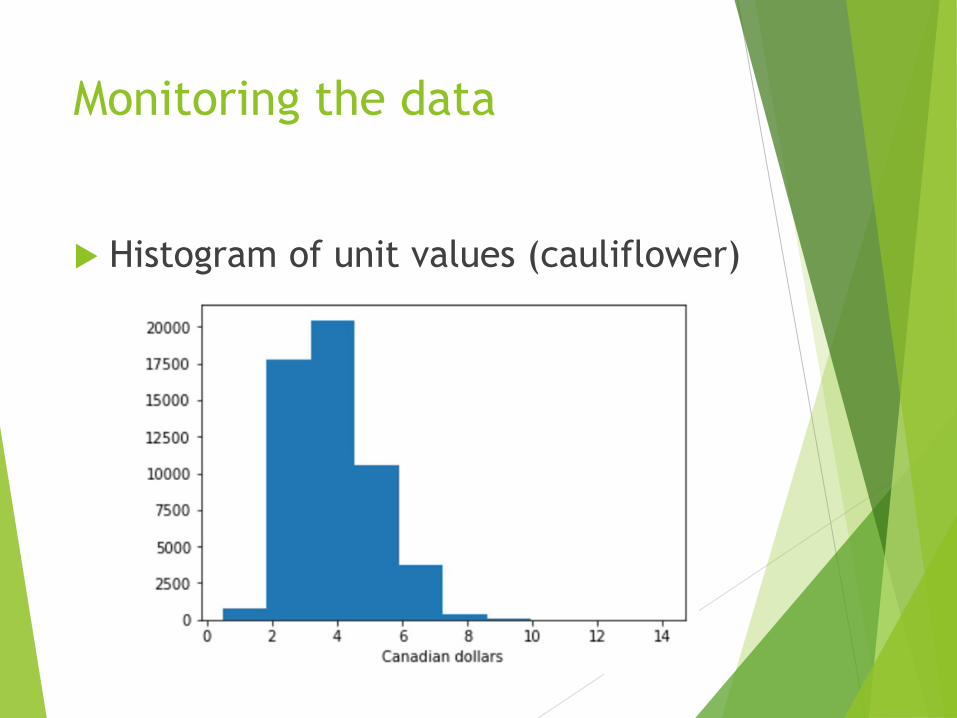
Monitoring the data
Histogram of unit values (cauliflower)

Monitoring the data
Histogram of unit values (milk)
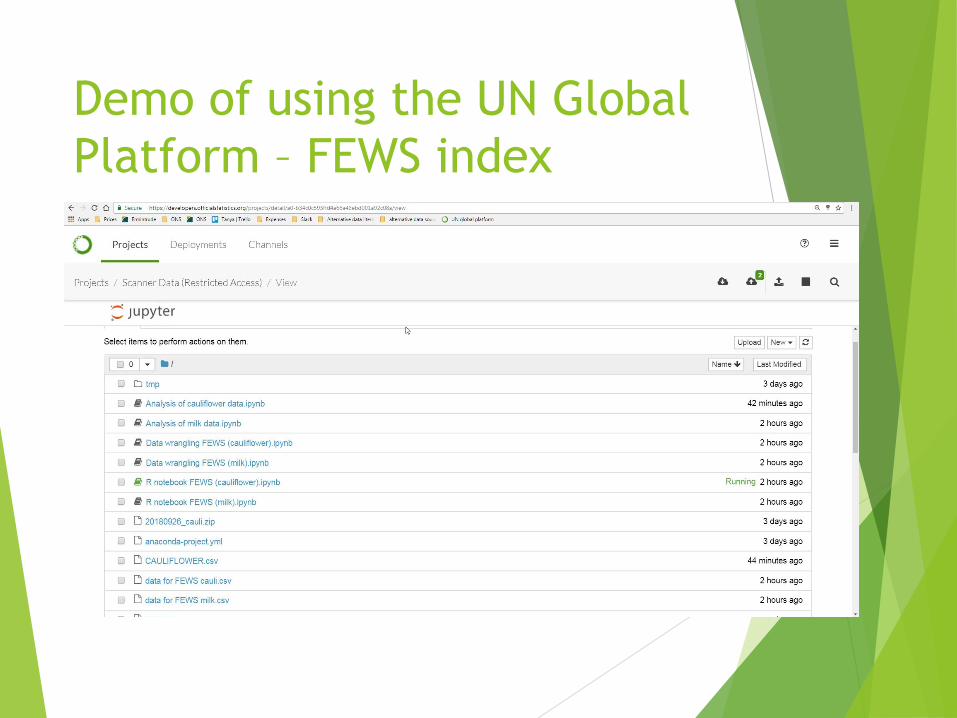
Demo of using the UN Global Platform – FEWS index

Price indices - cauliflower
0
20
40
60
80
100
120
140
Jun-16 Sep-16 Dec-16 Mar-17 Jun-17 Sep-17 Dec-17 Mar-18 Jun-18
Index June 2016 = 100

Price indices - milk
98.2
98.4
98.6
98.8
99.0
99.2
99.4
99.6
99.8
100.0
100.2
Jun-16 Sep-16 Dec-16 Mar-17 Jun-17 Sep-17 Dec-17 Mar-18 Jun-18
Index June 2016 = 100

Price indices - milk
0
20
40
60
80
100
120
140
Jun-16 Sep-16 Dec-16 Mar-17 Jun-17 Sep-17 Dec-17 Mar-18 Jun-18
Index June 2016 = 100

Lessons learnt so far -Platform
Technology platform provides easy to use interface
Availability of a range of trusted index methodology expedites learning
The set-up of the platform requires a learning curve for the task team participants.

Lessons learnt so far –Nielsen
Comprehensive clean data
Value in establishing a partnership to establish best practices
Adding a data dictionary would facilitate data understanding
Run basic data exploration first to provide feedback quickly

Next steps
Finalise Phase 1: Finish draft of the instructional
manual and send for review by Prices experts
Expand test data stored on UNGP
Code up additional index methods to allow for testing

Next steps
Commence Phase 2 – scope still under discussion but likely to include:Using Scanner Data to calculate CPI
expenditure weights
Data cleaning and sorting to provide analysis ready dataset
Capacity Building – providing training material and courses