UN Global E-government Survey 2003 - United Nations
114
UN Global E-government Survey 2003
Transcript of UN Global E-government Survey 2003 - United Nations

�
UN Global E-governmentSurvey 2003
i
Acknowledgements
This Survey was a collaboration between the UN Department of Economic and Social Affairs (UNDESA) and the Civic Resource Group (CRG), private sector consulting firm providing technology solutions in e government. The UNDESA team [Seema Hafeez (author), Neena Koshy and Jerzy Szeremeta] who worked under the guidance of Guido Bertucci, Director of the UNDESA Division for Public Administration and Development Management, developed the underlying conceptual framework of the Survey, devised the survey methodology; and prepared the analysis of the data and its presentation. We would like to thank the Civic Resource Group, Dr. Gregory G. Curtin and Robert B. McConnachie, its two Managing Directors as well as the researchers: Kim J. Andreasson, Veronika Vis-Sommer, Michael Sommer and Christopher J. Walker took on themselves meticulous review of the web sites and development of a database and research web site that were updated and maintained throughout the project. Their contributions provided not only the indispensable data, but also allowed to adjust the surveying methodology and gave richness to the analysis of the results.

Contents
I. The Imperative of E-government . . . . . . . . . . . . . . . . . . . . . . . . . . . . . . . . . . . . . . . . . 4
I.1. The challenge of e-government for development . . . . . . . . . . . . . . . . . . . . . . . . . . . 4I.2. The potential of e-government: a historic opportunity . . . . . . . . . . . . . . . . . . . . . . . 5 I.3. UN efforts towards bridging the digital divide . . . . . . . . . . . . . . . . . . . . . . . . . . . . . . 6
II. Benchmarking E-government . . . . . . . . . . . . . . . . . . . . . . . . . . . . . . . . . . . . . . . . . . . 8
II.1. The UN Global E-government Survey 2003 . . . . . . . . . . . . . . . . . . . . . . . . . . . . . . . 9II.1.1 The conceptual framework, methodology and data measurement . . . . . . . . . . . . . . . 11
A. The state of e-government readiness . . . . . . . . . . . . . . . . . . . . . . . . . . . . . . . 12B. The extent of e-participation . . . . . . . . . . . . . . . . . . . . . . . . . . . . . . . . . . . . 16
III. Research Findings and Analysis . . . . . . . . . . . . . . . . . . . . . . . . . . . . . . . . . . . . . . . . . 18
A. Major findings. . . . . . . . . . . . . . . . . . . . . . . . . . . . . . . . . . . . . . . . . . . . . . . . 18B. Global e-government readiness rankings . . . . . . . . . . . . . . . . . . . . . . . . . . . . 20C. E-government readiness by country . . . . . . . . . . . . . . . . . . . . . . . . . . . . . . . . 23
North America and Europe . . . . . . . . . . . . . . . . . . . . . . . . . . . . . . . . . . . . . . . . . . . . . . 23South and Eastern Asia . . . . . . . . . . . . . . . . . . . . . . . . . . . . . . . . . . . . . . . . . . . . . . . . . 27South-central Asia . . . . . . . . . . . . . . . . . . . . . . . . . . . . . . . . . . . . . . . . . . . . . . . . . . . . . 29Western Asia . . . . . . . . . . . . . . . . . . . . . . . . . . . . . . . . . . . . . . . . . . . . . . . . . . . . . . . . 33Africa . . . . . . . . . . . . . . . . . . . . . . . . . . . . . . . . . . . . . . . . . . . . . . . . . . . . . . . . . . . . . 34South and Central America . . . . . . . . . . . . . . . . . . . . . . . . . . . . . . . . . . . . . . . . . . . . . . 36Caribbean . . . . . . . . . . . . . . . . . . . . . . . . . . . . . . . . . . . . . . . . . . . . . . . . . . . . . . . . . . 37Oceania . . . . . . . . . . . . . . . . . . . . . . . . . . . . . . . . . . . . . . . . . . . . . . . . . . . . . . . . . . . . 37
IV. Web Measure Assessments . . . . . . . . . . . . . . . . . . . . . . . . . . . . . . . . . . . . . . . . . . . . . 38
IV.1 Stages of service delivery analysis . . . . . . . . . . . . . . . . . . . . . . . . . . . . . . . . . . . . . . 40IV.2. Stages of service delivery by country . . . . . . . . . . . . . . . . . . . . . . . . . . . . . . . . . . . 44
V. The Extent of E-participation . . . . . . . . . . . . . . . . . . . . . . . . . . . . . . . . . . . . . . . . . . . . 52
VI. Conclusions . . . . . . . . . . . . . . . . . . . . . . . . . . . . . . . . . . . . . . . . . . . . . . . . . . . . . . . . 58
VII. The Promise of the Future . . . . . . . . . . . . . . . . . . . . . . . . . . . . . . . . . . . . . . . . . . . . . 58
Tables, Part II3.1 Global E-government Readiness Rankings 2003: Top 25 Countries . . . . . . . . . . . . . . . . . . . 203.2. Regional Indices, 2003. . . . . . . . . . . . . . . . . . . . . . . . . . . . . . . . . . . . . . . . . . . . . . . . . . 223.3. E-government Readiness Index, North America . . . . . . . . . . . . . . . . . . . . . . . . . . . . . . . . 233.4. E-government Readiness Index, Europe . . . . . . . . . . . . . . . . . . . . . . . . . . . . . . . . . . . . . 23
1

3.5. Enabling Environment for E-government, Selected European Countries... . . . . . . . . . . . . . . 243.6. E-government Readiness Rankings in South and Eastern Asia . . . . . . . . . . . . . . . . . . . . . . . 273.7 Enabling Environment Indicators in South and Eastern Asia, Selected Countries . . . . . . . . . 283.8 E-government Readiness Rankings in South-central Asia . . . . . . . . . . . . . . . . . . . . . . . . . . 29 3.9 E-government Readiness in Western Asia . . . . . . . . . . . . . . . . . . . . . . . . . . . . . . . . . . . . . 333.10 E-government Readiness Rankings in Africa. . . . . . . . . . . . . . . . . . . . . . . . . . . . . . . . . . . 34 3.11 Telecommunication Measures in Africa, Selected Countries . . . . . . . . . . . . . . . . . . . . . . . . 353.12 E-government Readiness Rankings in South and Central America . . . . . . . . . . . . . . . . . . . . 363.13 E-government Readiness Rankings in the Caribbean . . . . . . . . . . . . . . . . . . . . . . . . . . . . . 373.14 E-government Readiness Rankings in Oceania. . . . . . . . . . . . . . . . . . . . . . . . . . . . . . . . . . 374.1 Web Measure Index 2003, Top 25 Countries . . . . . . . . . . . . . . . . . . . . . . . . . . . . . . . . . 384.2 Telecommunication Indicators in Latin America, Selected Countries. . . . . . . . . . . . . . . . . . 394.3 On-line Profile of UN Member States . . . . . . . . . . . . . . . . . . . . . . . . . . . . . . . . . . . . . . . 414.4 Selected Common Characteristics of Country Websites.. . . . . . . . . . . . . . . . . . . . . . . . . . . 424.5 E-government Stages by Income Classification. . . . . . . . . . . . . . . . . . . . . . . . . . . . . . . . . 434.6 Information and Service Delivery by Stage, Selected Countries. . . . . . . . . . . . . . . . . . . . . . 445.1 E-participation Index 2003, Top 20 Countries. . . . . . . . . . . . . . . . . . . . . . . . . . . . . . . . . . 525.2 E-participation by Functional Classification . . . . . . . . . . . . . . . . . . . . . . . . . . . . . . . . . . . 535.3 E-participation Aspects in National Programmes . . . . . . . . . . . . . . . . . . . . . . . . . . . . . . . . 555.4 E-participation by Income Category . . . . . . . . . . . . . . . . . . . . . . . . . . . . . . . . . . . . . . . . 55
Graphs, Part II3.1 E-government Readiness Rankings 2003, Top 25 Countries . . . . . . . . . . . . . . . . . . . . . . . . 21 3.2 E-government Readiness Index by Region . . . . . . . . . . . . . . . . . . . . . . . . . . . . . . . . . . . . 213.3 Regional Disparities in Telecommunication and Human Capital. . . . . . . . . . . . . . . . . . . . . 223.4 Enabling Environment for E-government, Europe, Selected Countries . . . . . . . . . . . . . . . . . 253.5 A Comparative Picture of Telecommunication Indicators in Eastern Asia,
Selected Countries. . . . . . . . . . . . . . . . . . . . . . . . . . . . . . . . . . . . . . . . . . . . . . . . . . . . . 283.6 Telecommunication and Human Capital Indices for South and Central Asia. . . . . . . . . . . . . 303.7 Enabling Environment, Selected Regions . . . . . . . . . . . . . . . . . . . . . . . . . . . . . . . . . . . . . 303.8 Enabling Environment in Africa, Selected Countries . . . . . . . . . . . . . . . . . . . . . . . . . . . . . 354.1 Telecommunication Indicators in Selected Latin American Countries . . . . . . . . . . . . . . . . . . 394.2 Stages in E-government, Selected Developing Countries . . . . . . . . . . . . . . . . . . . . . . . . . . 414.3 Service Delivery by Stage, Selected Developed Countries. . . . . . . . . . . . . . . . . . . . . . . . . . 454.4 Service Delivery by Stage, Selected Developing Countries . . . . . . . . . . . . . . . . . . . . . . . . . 464.5 Transactional Presence, Top 20 E-government Ready Countries . . . . . . . . . . . . . . . . . . . . . 484.6 Networked Presence, Top 20 E-government Ready Countries. . . . . . . . . . . . . . . . . . . . . . . 495.1 E-participation Index, Top 22 Countries . . . . . . . . . . . . . . . . . . . . . . . . . . . . . . . . . . . . . . 54
2
�

�
Boxes, Part II1.1 E-health for all: UN supports the developing world. . . . . . . . . . . . . . . . . . . . . . . . . . . . . . 72.1 E-government nomenclature . . . . . . . . . . . . . . . . . . . . . . . . . . . . . . . . . . . . . . . . . . . . . 102.2 E-participation framework . . . . . . . . . . . . . . . . . . . . . . . . . . . . . . . . . . . . . . . . . . . . . . . 163.1 G2C e-partnerships: inventive indigenous E-government
in Sri Lanka. . . . . . . . . . . . . . . . . . . . . . . . . . . . . . . . . . . . . . . . . . . . . . . . . . . . . . . . . 313.2 Innovative community-owned rural internet kiosks in Gyandoot, India . . . . . . . . . . . . . . . . 324.1 U.K. interactive health website . . . . . . . . . . . . . . . . . . . . . . . . . . . . . . . . . . . . . . . . . . . . 474.2 Australian interactive job listing . . . . . . . . . . . . . . . . . . . . . . . . . . . . . . . . . . . . . . . . . . . 474.3 Cambodia: It is all about the focus. . . . . . . . . . . . . . . . . . . . . . . . . . . . . . . . . . . . . . . . . . 494.4 Armenia’s on-line forum promotes democratic participation . . . . . . . . . . . . . . . . . . . . . . . 504.5 Mongolia: listening to citizens . . . . . . . . . . . . . . . . . . . . . . . . . . . . . . . . . . . . . . . . . . . . 504.6 Open Sweden . . . . . . . . . . . . . . . . . . . . . . . . . . . . . . . . . . . . . . . . . . . . . . . . . . . . . . . 515.1 The U.K. and the U.S.: two approaches to e-participation . . . . . . . . . . . . . . . . . . . . . . . . . 56
Annex I: Data Tables . . . . . . . . . . . . . . . . . . . . . . . . . . . . . . . . . . . . . . 60
1. E-government Readiness Index 2003 . . . . . . . . . . . . . . . . . . . . . . . . . . . . . . . . 612. Components of E-government Readiness Index . . . . . . . . . . . . . . . . . . . . . . . . 64 3. Web Measure Index . . . . . . . . . . . . . . . . . . . . . . . . . . . . . . . . . . . . . . . . . . . . 704. Telecommunication Indicators 2003 - I . . . . . . . . . . . . . . . . . . . . . . . . . . . . . . . 735. Telecommunication Indicators 2003 - II . . . . . . . . . . . . . . . . . . . . . . . . . . . . . . 796. Telecommunication Indicators 2003 - III . . . . . . . . . . . . . . . . . . . . . . . . . . . . . 857. Technology Infrastructure Index 2003 . . . . . . . . . . . . . . . . . . . . . . . . . . . . . . 918. Human Capital Index . . . . . . . . . . . . . . . . . . . . . . . . . . . . . . . . . . . . . . . . . . 979. E-participation Index 2003 . . . . . . . . . . . . . . . . . . . . . . . . . . . . . . . . . . . . . . .100
Annex II: Technical Notes . . . . . . . . . . . . . . . . . . . . . . . . . . . . . . . 106
3

I. The Imperative of E-Government
Governments are increasingly becoming aware of the importance of employing e-gov-ernment to improve the delivery of public services to the people. This recognition hascome about as a result of two recent interrelated phenomena. First, the rapid pace ofglobalization has interwoven the intra-country trade, investment and finance opportuni-ties of the world into transnational networks, with countries seeking new ways to pro-vide more competitive products and services. Second, recent advances in Informationand Communication Technology (ICT) have presented new approaches for the integra-tion of these networks and the improvement of the efficiency of businesses and servicesworldwide. Led by the private sector, innovative applications have highlighted the poten-tial of using ICT to reduce costs and improve the productivity and efficiency of transac-tions. In the process, the revolution in information technology has made unprecedentedamounts of information available around the globe, leading to an expanded global mar-ketplace for goods, services and ideas.
Governments the world over are recognizing the power of global communicationtools, such as the Internet, in revolutionizing markets, providing access to learning andknowledge infrastructure, and forming cross-boundary virtual communities for collectiveaction. At the same time, people are learning of the immense opportunities presented byvirtual global networks for reforming political, economic and social power structures.
Many countries are adapting their public sector systems in accordance with the chang-ing environment. Information Technology (IT) applications, especially innovative e-gov-ernment programmes are increasingly becoming the cornerstone of government opera-tions. However, some countries are finding it difficult to divert scarce resources towardsICT applications. It is this disparity between opportunity and feasibility that could lead toa deepening of the “digital divide”.
Whereas the technological revolution has created new opportunities to tackle socio-economic development, it has also generated a new challenge for many countries wheretechnological capability and human resources are not sufficiently developed. The statesare also faced with the complex challenges posed by the proliferation of transnationalglobal e-networks, which impinge on what was traditionally government domain.
I.1 The challenge of e-government for development
The potential of e-government as a development tool hinges upon three pre-requisites- a minimum threshold level of technological infrastructure, human capital and e-con-nectivity - for all. E-government readiness strategies and programmes will be able to beeffective and “include all” people only if, at the very minimum, all have functional liter-acy and education, which includes knowledge of computer and Internet use; all are con-nected to a computer; and all have access to the Internet. The primary challenge of e-government for development therefore, is how to accomplish this.
Effective e-government strategies and programmes require revisiting the traditionalsystems of transactions among government, business and society. In many instances,training for the new modes of business is necessary. All this needs to be backed up byreform of the legislative and regulatory framework, to complement efforts at digitizinggovernment for interaction with business and the public, and to make these interactionsaccessible, secure and private.
Furthermore, considerable financial resources are required to establish, expand andconstantly update e-networks. Effective integration of e-service delivery into develop-ment strategies requires programming and planning; research and development; and cre-ating monitoring and feedback systems, all of which require outlays of governmentexpenditure.
4
�

�
Funds for such purposes are not available in many parts of the world, where alreadyscarce resources are devoted to more traditional models of economic, human and tech-nological development. Around 24 per cent of the world’s people live below the pover-ty line on $1.08/day1; around 20 per cent do not have access to safe water and sanita-tion12; and 57 out of 191 member states of the UN have populations where one in fivecan neither read nor write.13
Furthermore, roughly half of the world’s population of six billion has never made atelephone call14 while, in 2003, only 9.5 per cent of the population had on-line access.15
In evaluating the extent of regional disparities, the UN Secretary-General’s Report onthe Commission On Science And Technology states that “...in absolute terms, the gapbetween the leaders (primarily OECD countries) and laggards (primarily African andsome CIS countries) is growing. Within the OECD countries that are leading in connec-tivity, there appears to be convergence. Analysis of relative measures such as the popu-lation-weighted Gini coefficient for inequality reveals high initial levels of inequality -approximately twice the average country level of income inequality. More mature tech-nologies (e.g. telephone lines) are more evenly distributed, compared to more recenttechnologies (e.g. Internet hosts).... In general, African and South Asian countries arefalling behind, Latin American and transition economies are keeping up, while OECDcountries and South Eastern Asian “Tigers” are getting ahead...6 In the initial stage of theevolution of e-government there is a fear of the widening of the digital divide within andamong countries.
E-government is transforming the ways in which the government, business and thepublic at large interact with one another. If unchecked, the impact of the digital dividein today’s globalized world is likely to greatly exacerbate the economic divide, the socialdivide and the democratic divide among peoples of the world.7 The cost of inaction faroutweighs the benefit of adopting a global and holistic approach to sustainable devel-opment that takes full account of the potential of e-government.
Governments worldwide are aware of both the challenges and the potential of e-gov-ernment. They are also becoming aware that the rapidly developing knowledge societies- even though they constitute a small proportion of today’s population - have the poten-tial to generate a greater demand for increased participation and empowerment by peo-ple, worldwide. With increasing business and people e-networks, the cost of inactioncould lead to a shift of power structures outside the traditional parameters of the state.
I.2 The potential of e-government: a historic opportunity
Despite challenges, the potential for e-government in the service of people is vast. Asthe UN Secretary-General has stated, “...information technologies can give developingcountries the chance to leapfrog some of the long and painful stages of development thatother countries had to go through....”8 It is this potential, which the future promises, thatenergizes planners to bring the use of e-government into national development strate-gies.
Realizing this potential, quite a few countries have initiated innovative e-governmentprogrammes for providing socio-economic services to all. To wit, the Government ofSweden has established a one-stop shop for all Swedish higher education opportunities,as well as information about careers and postgraduate studies. A meta-data applicationensures that the search engine can find up-to-date information on every single course.9
An U.K. government endeavour has made it possible for teachers to access all curriculaon line.10 All that is needed is access to a computer with Internet and the willingness tolearn. Similarly, in Australia teachers can upgrade skills/information at an on-line web-site provided for this purpose.11 From April 2003, the U.K. government is providing up-to-date, cross-referenced health and social care information through the Internet to all in
5

the country. With simple on-line access both patients and doctors can access referenceinformation on a variety of diseases, conditions and treatments.12 Several countries areengaged in providing on-line databases for employment. Sweden has an on-line jobvacancies portal comprising six labour market databases that are steadily growing inscope and use.13
Some developing countries, too, have initiated highly innovative e-government pro-grammes that are also cost effective and vastly enhance the delivery of social services.
In India, the “Gyandoot” project is recognized as an example of how innovative e-gov-ernment programmes can support public services in far-flung areas, even with minimumfinancial investment. It was launched in 2000 to establish community-owned, technolog-ically innovative and sustainable information kiosks in a poverty-stricken, tribal domi-nated rural area of Madhya Pradesh. Along with the installation of a low cost ruralIntranet covering 20 villages, information kiosks were established in these villages. Theseinformation kiosks have dial-up connectivity through local exchanges on optical fibre orUHF links. The server hub is a Remote Access Server housed in the computer room inthe District Panchayat. Today it offers many services, saving the farmers - many of whomcannot even read or write - time, money and effort in their daily transactions.
Making a serious commitment to e-government in 2000, the Government of Colombiamandated all federal government agencies to develop a portal that would make publicinformation more readily available to the public, and thereby make government moreaccountable.14 Development of an integrated e-government facility is supported by anInternet legal framework, investment plans and strong relationships with the private sec-tor in ICT-related projects. By May 2001, 94 per cent (190 out of 203) of all Colombiangovernment agencies had a presence on the Web.15 All government regulations since1900 are available on line. In addition, businesses (and the public at large) can accessgovernment procurement information on line. The Colombia integrated services websiteis an example of a one-stop national portal with links to every government agency web-site and easy access to government-related information.16
I.3 UN efforts towards bridging the digital divide
For its part, the UN system is providing assistance to enable member states to avail them-selves of the opportunity to “leap frog” in their development cycle. The UN ICT TaskForce, established in 2001, is “... helping to formulate strategies for the development ofinformation and communication technologies and putting those technologies at the serv-ice of development and, on the basis of consultations with all stakeholders and MemberStates, forging a strategic partnership between the United Nations system, private indus-try and financing trusts and foundations, donors, programme countries and other rele-vant stakeholders in accordance with relevant United Nations resolutions.” 17
With the help of UNESCO, the Government of Sri Lanka has launched a truly inven-tive rural-based e-government programme that encapsulates the potential of e-govern-ment according to the vision laid out by the UN. The Kothmale Community RadioInternet Project is one of the most innovative e-government pilot projects. It uses a com-munity radio programme as an interface between the community and the Internetthrough a pioneering “Radio-browse” model, thereby introducing indirect mass access tocyberspace through a daily one-hour interactive radio programme.18 Supported byresource personnel, the broadcasters browse the Internet on-air together with their lis-teners and discuss and contextualize information in the local language. Thus, the radioprogramme raises awareness about the Internet in a participatory manner.
The World Health Organization has established a Health InterNetwork that createswebsites for hospitals, clinics and public health facilities in the developing world, to bringhigh-quality information within reach and to facilitate communication in the public health
6
�

�
community. (See Box I.1.) It aims to improve public health by facilitating the flow ofhealth information and ensuring equitable access to health information, using theInternet.
Box 1.1
E-health for all: UN supports the developing world
In September 2000 the Secretary-General of the United Nations launched a public-private initiative to bridge the digital divide in health. Spearheaded by the WorldHealth Organization (WHO), the Health InterNetwork brings together internationalagencies, the private sector, foundations, non-governmental organizations andcountry partners under the principle of ensuring equitable access to health infor-mation.
As a key component of the project, the Health InterNetwork portal provides avast library of the latest and best information on public health. The portal will alsomake available information technology health applications such as geographicalinformation systems and epidemiological tools, plus courses and training offeredthrough distance learning.
Connectivity: for information and communicationThe Health InterNetwork seeks to establish or upgrade thousands of Internet-con-nected sites in public and not-for-profit institutions in developing countries. Guidedby a technology advisory group, foundations, development agencies, non-govern-mental organizations and corporate and local private sector partners are involvedin specifying, providing and supporting hardware, software and Internet connec-tivity to pilot sites. Source: http://www.healthinternetwork.org/src/millenium.php
As the website for the UN/WHO Health InterNetwork states, “...The HealthInterNetwork was created with one single purpose: to bridge the digital divide in health.Towards that end, health information - relevant, timely and appropriate - must becomeunrestricted and affordable worldwide, so that all communities can benefit from thisglobal public good....”19
Such programmes can greatly benefit social service infrastructure deficit countries byjumping the timeline of traditional, long gestation programmes in education, health orsocial service delivery, especially in far-flung areas where lack of human and physicalinfrastructure has traditionally been expensive, difficult to monitor, and therefore oftenneglected. Those seeking more education, skills or health information need only accessan on-line computer, perhaps a shared community one, to improve skills and knowledgeor seek initial guidance on an emergency medical problem. With instantaneous trans-mission of two-way information, social service practitioners and beneficiaries can gainaccess to state-of-the-art solutions to their problems; have their concerns transmitted tothe relevant policy makers; and participate in home-grown solutions in a much reducedtime frame and at their convenience. Job seekers in far-flung areas need not be limitedto the local markets in their search for employment. They can have the world at theirfingertips.
With government providing the initial lead in the developing countries, such endeav-ours could also mushroom into citizen-to-citizen provision of services. People could haveaccess to information about charitable organizations, social work, NGOs and other phil-anthropic ventures providing guidance, solutions and financial assistance. The coming
7

together of the global community will further opportunities for knowledge and people’sempowerment.
I.3.1 The UN vision of development for all
In September 2000, the 189 member states of the United Nations General Assembly adopt-ed the Millennium Declaration, which set out a vision for the future based on principlesof “... a more peaceful, prosperous and just world....” It confirmed the commitment of themember states “...to making the right to development a reality for everyone and to free-ing the entire human race from want....”20 By setting specific, monitorable targets for,among other things, poverty reduction, education, health and environment, the memberstates “...agreed that peace, prosperity and justice constitute a social context that is bestsuited for achieving human development, a context in which globalization can benefitall....”21 One commitment they made was to “ensure that the benefits of new technologies,especially information and communication technologies, are available to all.”22
The challenge of development today requires revisiting political, economic and socialstructures. Innovative approaches are needed, to government and governance; businessand consumers; and culture and society. For states, this requires developing the effectiveuse of e-government programmes for governance. As a reseracher points out, “the newmodel (of governance) brings information systems (IS) to the heart of reform....” 23
Though still in its infancy, e-government - if applied correctly - holds the promise ofdelivering in instances where many other innovative approaches could not in the past.
The promise of e-government is that it offers an historic opportunity to makethe impossible possible for developing countries.
However, it should be noted that e-government is not a universal panacea. It is onlya tool, albeit a powerful one. The ultimate goal remains development with the opportu-nity for people’s empowerment.
And it is this opportunity for the “inclusion of all” that is the vision of the United Nations.
II. Benchmarking E-government
The conceptual framework adopted by this Survey is the vision of human developmentprovided by the UN Millennium Declaration. As such, first of all, e-government in thisSurvey is considered to be the means to an end, the end being development for all. It isconsidered to be a tool at the disposal of the government, which, if applied effectively,can contribute substantially to promoting human development. It supports, but does notsupplant, the development efforts of member states.
Second, the Survey and its results must be placed in the context of the overall patternand level of development of the country concerned. It is vital that the assessment of web-sites done by the Survey does not provide a distorted picture of the progress made - andchallenges faced - by the countries. At the same time, it is equally important to highlightthe promise of e-government. Therefore, main measurements in this Survey are based one-government readiness, which duly takes into account not only countries’ specific e-gov-ernment initiatives, as evidenced by web presence, but also their infrastructure andhuman resource endowments.
Third, this is an issues-based Survey. Its focus is on the question, “Is e-government,as a tool, contributing to the socio-economic uplift of the people?” In attempting toanswer this question, the Survey conceptualizes models and quantitatively assesses thestrengths and weaknesses in e-government initiatives of countries worldwide.
Fourth, in keeping with the UN Millennium Declaration, the focus of the Survey is onprovision of socio-economic services to the population through the use of e-governmentas a programmatic tool, as well as on participation.
8
�

�
Finally, the Survey assesses e-government readiness worldwide, taking the view thatthe ultimate objective remains the “inclusion of all” in development.
This Survey contributes to the development efforts of countries by providing abenchmark to gauge the comparative state of e-government readiness and e-par-ticipation for development in a rapidly globalizing world
It should be noted that the Survey does not imply that “higher” rankings are neces-sarily a “better” outcome or even a desirable one. Each country has to decide upon itslevel and extent of e-government initiatives in keeping with its indigenous developmentframework. At any given point in time, e-government readiness and e-participation rank-ings are mere snapshots of the state of a country’s e-government programme.
Studying various aspects of ICT-related readiness of countries around the world is cur-rently a growth industry. E-government and/or e-government readiness surveys range ingeographical coverage from those that focus on a handful of developed countries tothose covering most countries of the world. A few assess customer services throughproducts and services offered on several websites in a country, sometimes complement-ed by the results of interviews with government officials. Others focus on more sophis-ticated issues of privacy and electronic voting. A few delve into assessing governmentprovision of state and local level services. The majority, however, focus on the bur-geoning on-line business services, mostly in the industrialized countries. Almost all allowa qualitative assessment in their numerical scores.
Furthermore, almost all previous surveys have only provided an assessment of thewebsites. E-government and e-government readiness are, among other factors, a func-tion of not only a country’s state of readiness, but also its technological and telecom-munication infrastructure and the level of its human resource development. E-govern-ment initiatives, however, sophisticated as they might be, are unlikely to contribute sig-nificantly to development if they reach only the privileged few.
This Survey contributes to the development efforts of the member states by providinga benchmark against which to gauge their comparative state of e-government readinessand e-participation within an overall framework.
II.1 The UN Global E-government Survey 2003
The UN Global E-government Survey 2003 expands and builds upon the UN Report“Bench-Marking E-government: A Global Perspective” published in 2002. Using a modelfor the measurement of digitized services, the Survey assesses the 191 member states ofthe UN according to a composite index of e-government readiness based on websiteassessment, telecommunication infrastructure and human resource endowment.
As before, it assumes that a “government” encompasses the executive, legislative andjudiciary organs of the State, while “consumer/citizen” includes any member of the pub-lic at large (individuals as well as organizations). It assumes that e-government compris-es electronic interactions of three types: government-to government (G2G); government-to-business (G2B) and its reverse; and government-to-consumer/citizen (G2C) and itsreverse.
9

Box. 2.1
E-government nomenclature
Government-to-Government (G2G) involves sharing data and conducting electron-ic exchanges between governmental actors. This involves both intra- and inter-agency exchanges at the national level, as well as exchanges among the national,provincial and local levels.
Government-to-Business (G2B) involves business-specific transactions (e.g. pay-ments with regard to sale and purchase of goods and services) as well as provi-sion on line of business-focussed services.
Government-to-Consumer/Citizen (G2C) involves initiatives designed to facilitatepeople’s interaction with government as consumers of public services and as citi-zens. This includes interactions related to the delivery of public services as well asto participation in the consultation and decision-making process.
Based on this perspective, the Survey adopts a people-centric approach to e-govern-ment. It limits itself to exploring government-to-consumer/citizen (G2C) and con-sumer/citizen-to-government (C2G) relationships. Although the Survey does not assessG2G services, in the comparative measurement of G2C and C2G relationships is animplicit assessment of G2G, since improvements in G2C and C2G are closely linked toG2G improvements.
The two-way information flows between the government and the consumer/citizenare presented below graphically in the Model of E-government adopted by the Survey.
10
�
The Model of E-government
Departmentof
Labour
Departmentof
Social Welfare
Departmentof
Finance
State Government
CentralGovernment
Local Government
Departmentof
Health
Public
Departmentof
Education
Private Sector
Integratede-Networks
CivilSociety

�
The objectives of the Survey are to:
1. Present a snapshot of the state of comparative e-government readiness of thecountries of the world;
2. Provide an appraisal of the use of e-government as a tool in the delivery of serv-ices to the public in its capacity as consumer of such services;
3. Provide a comparative assessment of the willingness and ability of governmentsto involve the public in e-participation; and
4. Provide a benchmarking tool for monitoring the progress of countries as theymove towards higher levels of digital public service delivery in the future.
Drawing on broader, more expanded research, the Survey focuses on the issue of howwilling and ready governments around the world are to employ the vast opportunitiesoffered by e-government to improve access to - and the quality of - basic social servic-es to the people. While not detracting from the importance of other forms of assessmentof IT applications, this Survey confines itself to an assessment of the e-facilities on line.
This Survey presents a snapshot of the state of comparative e-government readinessof the countries of the world;
This Survey provides an appraisal of the use of e-government as a tool in the deliv-ery of services to the consumer;
This Survey provides a comparative assessment of the willingness and ability of gov-ernments to involve the public in e-participation;
This Survey provides a benchmarking tool for monitoring the progress of countriesas they move towards higher levels of digital public service delivery in the future.
II.1.1 The conceptual framework, methodology anddata measurement
The UN Global E-government Survey 2003 presents a comparative ranking of the coun-tries of the world according to two primary indicators:
1. The state of e-government readiness; and 2. The extent of e-participation
The concept of e-government in this Survey espouses two aspects:
� The generic capacity or aptitude of the public sector to use ICT for encapsulatingin public services and deploying to the public, high quality information (explicitknowledge)24 and effective communication tools that support human development.The Survey names this the e-government readiness; and,
� The willingness, on the part of the government, to use ICT to provide high qualityinformation (explicit knowledge) and effective communication tools for the specif-ic purpose of empowering people for able participation in consultations and deci-sion-making, both in their capacity as consumers of public services and as citizens.The Survey names this as e-participation.
11

It should be noted that while the E-government Readiness Index assesses the quanti-ty of information and services provided, e-participation assesses the same from a quali-tative perspective, with a special focus on consultation and decision making.
A. The state of e-government readiness
E-government Readiness Index 2003
The E-Government Readiness Index is a composite index comprising the Web MeasureIndex, the Telecommunication Infrastructure Index and the Human Capital Index.
i. Web Measure Index
The Web Measure Index is a quantitative index, which has been revised and enhancedfrom last year’s version to measure the generic aptitude of governments to employ e-gov-ernment as a tool to inform, interact, transact and network.
It is based upon a theoretical Web Presence Measurement Model, which is a quan-titative five-stage model, ascending in nature, and building upon the previous level ofsophistication of a government’s on-line presence. For the governments that have estab-lished an on-line presence, the model defines stages of e-government readiness accord-ing to a scale of progressively sophisticated services. As countries progress in both cov-erage and sophistication of their state-provided e-service and e-product availability theyare ranked higher in the Model according to a numerical classification corresponding tofive stages. (See chart.) The five stages, given in the schema below, are theoreticallyascending in the level of maturity or sophistication of e-government presence on-line.They are: Emerging Presence, Enhanced Presence, Interactive Presence, TransactionalPresence and Networked Presence.
12
�

�13
Web Presence Measurement Model
Countries are scored on the basis of whether they provide specific products and serv-ices. The model, by design, does not attempt to measure the quality of those products orservices provided by the government, thus setting it apart from other models/surveys thatcombine access to, and delivery of, services/products, as well as quality measurements,all in one indicator. As such, the Survey eliminates any discretionary rating, which how-ever perfect, introduces a value judgment based on the researcher’s perspective. Thepurely quantitative nature of the Web Measure Index assures minimizing the bias inher-ent in combining qualitative assessments with quantitative measures.
Stage I: Emerging Presence
Stage I: Emerging Presence
Web presence through an official website, a national portal
or an official home page; links to government ministries,
regional/local government, non-executive branch of the
government; information is limited, basic and static.
Stage II: Enhanced Presence
Stage II: Enhanced Presence
On line services are enhanced to include databases and
sources of current and archived information, such as
policies, laws and regulation, reports, newsletters and
downloadable databases. The user can search for a docu-
ment and there is a help feature and a site map provided
Stage III: Interactive Presence
Stage III: Interactive Presence
Government’s provision of on-line services enters the
interactive mode; facilities for on-line downloading;
security link; electronic signature facility; audio and video
capability for relevant public information. The govern-
ment officials can be contacted via e-mail, fax, telephone
and post. The site is updated with greater regularity.
Stage IV: Transactional Presence
Stage IV: Transactional Presence
Users are able to conduct on-line transactions, such
as paying fines for motor vehicle violations, taxes
and fees for postal services through their credit,
bank or debit card. There are some facilities for
on-line bidding for public contracts via secure links.
Stage V: Networked Presence
Stage V: Networked Presence
A G2C framework based on an integrated network of pub-
lic agencies for the provision of information, knowledge
and services. The emphasis is on feedback to the govern-
ment. A web comment form is provided. A calendar of
upcoming government events exists with a government
invitation to participate. Government solicits feedback
through on-line polling mechanism; discussion forums;
and on-line consultation facilities.

Emerging Presence. This is the first stage of e-government readiness, representinginformation that is limited and basic. A government web presence is established throughan official website, a national portal or an official home page. Some archived informationsuch as the head of state’s message or a document such as the constitution may be avail-able on line. Links to ministries/departments of education, health, social welfare, labourand finance may exist, as well as links to regional/local government and branches otherthan the executive one of the federal government. But most information remains static.
Enhanced Presence. Though offering some enhanced capabilities, e-governmentefforts are still limited to providing one-way information to the public. At this stage, thegovernment provides sources of current and archived information, such as policies,budgets, laws and regulations, reports, newsletters and downloadable databases. Theuser can search for a document and a help feature and site map are provided. On thepublic participation side, a greater menu of relevant government documents may beavailable such as strategies and policy briefs on specific issues. Though more sophisti-cated, the interaction is still primarily unidirectional, i.e. from G2C.
Interactive Presence. This is the third, and relatively more sophisticated, stage in theschema, where e-government readiness for provision of on-line public services enters theinteractive mode with services to enhance convenience of the users. These may includedownloadable forms for tax payment, applications for license renewal etc. that need to beprinted but may be mailed back to an agency - a task that traditionally could only be car-ried out by making a trip to the agency concerned. Audio and video capability is provid-ed for relevant public information. The government officials can be contacted via e-mail,fax, telephone and post. The site is updated with greater regularity to keep the informa-tion current and up to date. The government at this stage has not employed e-governmentto fully inculcate citizen participation, though some form of input from the public is admit-ted through provision of e-mail and other contact information to answer simple questions.
Transactional Presence. This, the fourth stage in the evolution of e-government ini-tiatives, allows users to complete entire tasks electronically at any time. Backed by sim-ple user-friendly instructions, these obviate the necessity for the physical presence of theusers or utilization of other than electronic means for paying taxes or applying for IDcards, birth certificates/passports, license renewals and other similar C2G interactions byallowing him/her to submit these on line 24 hours a day, seven days a week. The usersare able to pay for relevant public services or expenses (e.g. fines for motor vehicle vio-lations, taxes, fees for postal services) through their credit, bank or debit cards. E-pro-curement facilities are available with providers of goods and services able to bid on linefor public contacts via secure links.
Networked Presence. This is the highest mode of e-government initiatives in theschema characterized by an integration of G2G, G2B (and its reverse) and G2C (and itsreverse) interactions. The government is willing and able to involve the society in a two-way dialogue. Through employing the use of web comment forms, and innovative on-line consultation mechanisms, the government actively solicits the views of people act-ing in their capacities as consumers of public services and as citizens. Implicit in thisstage of the model is the integration of consultation and collective decision making.
The 2003 Web Measure Index builds upon the previous year’s assessment in severalways.
First, the coverage has been expanded to include all UN member states. A total of 191countries were assessed.
Second, the Web Measure assessments are purely quantitative in nature. They are basedon a questionnaire that required the researchers to assign a binary value to the indicatorbased on the presence/absence of specific electronic facilities/services available.
14
�

�
Third, since the use of integrated portals or websites is gaining in importance in thee-government strategies of states worldwide, the primary site was the National Portal orthe official homepage of the government. Since many governments do not have one-stopportals, additional government sites were assessed.
Fourth, to ensure consistency across countries, the same number of functionallysame/similar sites were assessed in each country. Since the numerical index is depend-ent upon the sites chosen, which may differ in sophistication within a country, the Surveylimited itself to a pre-chosen set of five government ministries or departments. Thisremoved the arbitrariness of choosing which site to assess from among the multiple gov-ernment sites available.
Finally, these additional five sites were chosen to reflect the people-centred approachof the Survey. Since the Survey’s primary objective is to measure e-government effec-tiveness in the delivery of basic economic and social services, the additional sectoral siteschosen for assessment were the Ministries/Departments of Health, Education, SocialWelfare, Labour and Finance. These were representative of what services the publicrequires most from the government. To accurately differentiate the level of sophisticationof each functional site, each ministerial site was assessed using the same set of questions.The research team assessed the websites on the quantity and the maturity (or level ofsophistication) of services dispensed electronically.
In all, 288 services and facilities for 191 countries were assessed across the abovementioned sectors. While acknowledging that many governments dispense economicand social services via state/local websites, the Survey confined itself in 2003 to centralgovernment website assessments only, to provide a consistent platform for comparativeanalysis across the countries studied. Not surprisingly, a wide difference emerged amongcountries in the level of economic and social services offered on the government web-sites. Countries with decentralized structures of national and provincial government andgovernance in the dispensation of public services, such as education and health, had lit-tle or nothing on line on the central government’s ministerial/departmental site. In suchinstances, numerical scores were adjusted accordingly so as not to penalize them.
A caveat is in order about the web measurement in the Survey. The assessment of on-line services was carried out during April-May 2003. The sites were carefully checked andrevisited several times. However it should be kept in mind that websites worldwide arerapidly being updated with the addition of new features. Therefore some of the websitesassessed in the Survey may have been augmented during the period that elapsedbetween the time when the research was undertaken and the official launch date of theSurvey in November 2003. This, however, does not detract from the comprehensivenessof the Survey and is unlikely to impact on the comparative e-government readiness rank-ing of countries presented here.
ii. Telecommunications Infrastructure Index
The Telecommunication Infrastructure Index 2003 builds upon and expands the 2002Infrastructure Index. It is a composite, weighted average index of six primary indices,based on basic infrastructural indicators that define a country’s ICT infrastructure capac-ity. These are: PCs/1,000 persons; Internet users/1,000 persons; Telephone Lines/1,000persons; On-line population/1,000 persons; Mobile phones/1,000 persons; and TVs/1,000persons. Data for the UN member states was taken primarily from the UN InternationalTelecommunication Union (ITU) and the UN Statistics Division and supplemented by theWorld Bank. The data across countries was standardized by constructing six separateindices for the indicators. (See Technical Notes in Annex II for details on the construc-tion of the indices.)
15

iii. Human Capital Index
The data for the Human Capital Index 2003 relies on the United Nations DevelopmentProgramme (UNDP) “education index”. This is a composite of the adult literacy rate andthe combined primary, secondary and tertiary gross enrolment ratio, with two thirds ofthe weight given to adult literacy and one third to the gross enrolment ratio. (SeeTechnical Notes for details.)
B. The extent of e-participation
i. The E-participation conceptual framework
Included in the vision of the UN General Assembly Millennium Declaration is the reaf-firmation by the member states that they “...resolve to work collectively for more inclu-sive political processes, allowing genuine participation by all citizens in all (our) coun-tries... and the right of the public to have access to information....”25
Within this framework, e-participation is defined here to be a “participatory, inclusive,deliberative process of decision-making.” This can be achieved via:
a) Using ICT to increase the supply of information useful in the process of con-sultation and for decision making;
b) Using ICT to enhance consultation; andc) Using ICT to support decision making by facilitating people’s participation
within the framework of G2C and C2G interactions.
In devising the conceptual framework for e-participation, the Survey does not makeany value judgement on democracy in its traditional nuanced meaning. The conceptemployed here holds a deliberative thought process to be superior, irrespective of anydifferences in political, economic, social and cultural regimes across countries.
Box.2.2
E-participation framework
E-information: The government websites offer information on policies and programmes, budgets,laws and regulations, and other briefs of key public interest. Tools for dissemina-tion of information exist for timely access and use of public information, includingweb forums, e-mail lists, newsgroups and chat rooms. E-consultation: The government website explains e-consultation mechanisms and tools. It offers achoice of public policy topics on line for discussion with real time and archivedaccess to audios and videos of public meetings. The government encourages citi-zens to participate in discussions.E-decision making: The government indicates that it will take citizen input into account in decisionmaking and provides actual feedback on the outcome of specific issues.
Whereas e-participation endeavours around the world are not limited to state spon-sored e-groups but encompass a plethora of interactions that involve citizens, NGOs andbusiness organizations, this Survey limits itself to exploring only government willingnessto promote such groups through the use of the ICT. As such, it confines itself to citizen-
16
�
�
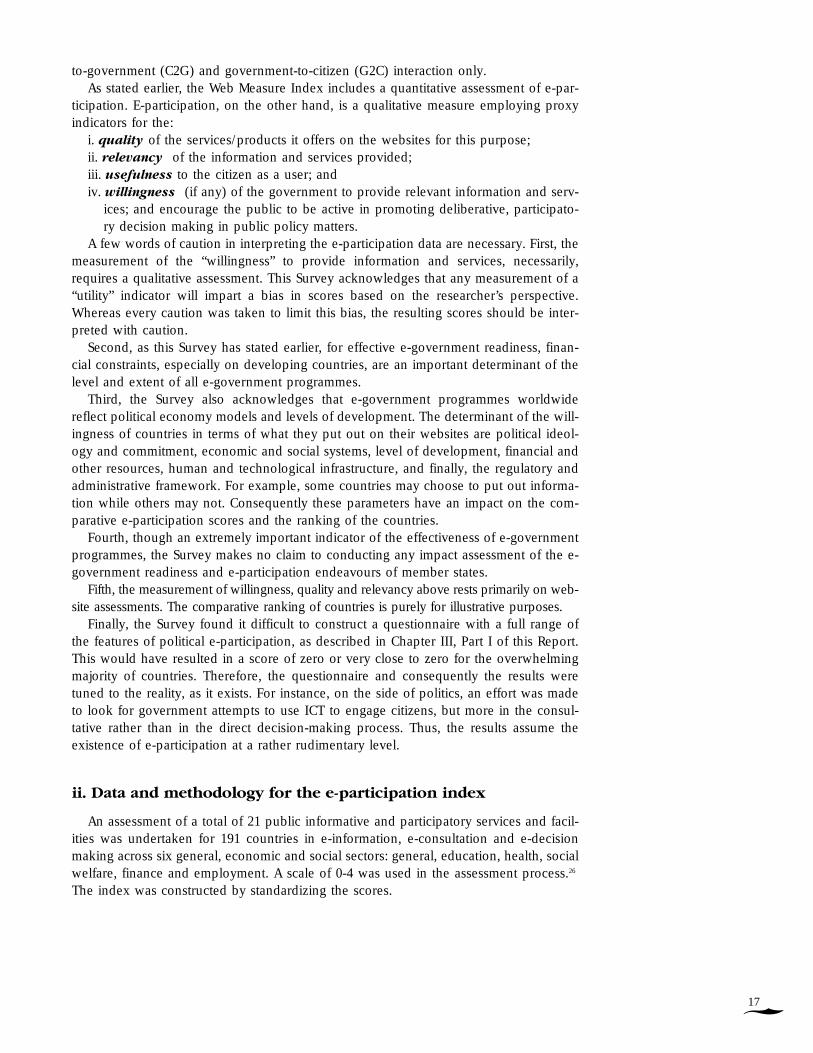
to-government (C2G) and government-to-citizen (G2C) interaction only. As stated earlier, the Web Measure Index includes a quantitative assessment of e-par-
ticipation. E-participation, on the other hand, is a qualitative measure employing proxyindicators for the:
i. quality of the services/products it offers on the websites for this purpose;ii. relevancy of the information and services provided;iii. usefulness to the citizen as a user; and iv. willingness (if any) of the government to provide relevant information and serv-
ices; and encourage the public to be active in promoting deliberative, participato-ry decision making in public policy matters.
A few words of caution in interpreting the e-participation data are necessary. First, themeasurement of the “willingness” to provide information and services, necessarily,requires a qualitative assessment. This Survey acknowledges that any measurement of a“utility” indicator will impart a bias in scores based on the researcher’s perspective.Whereas every caution was taken to limit this bias, the resulting scores should be inter-preted with caution.
Second, as this Survey has stated earlier, for effective e-government readiness, finan-cial constraints, especially on developing countries, are an important determinant of thelevel and extent of all e-government programmes.
Third, the Survey also acknowledges that e-government programmes worldwidereflect political economy models and levels of development. The determinant of the will-ingness of countries in terms of what they put out on their websites are political ideol-ogy and commitment, economic and social systems, level of development, financial andother resources, human and technological infrastructure, and finally, the regulatory andadministrative framework. For example, some countries may choose to put out informa-tion while others may not. Consequently these parameters have an impact on the com-parative e-participation scores and the ranking of the countries.
Fourth, though an extremely important indicator of the effectiveness of e-governmentprogrammes, the Survey makes no claim to conducting any impact assessment of the e-government readiness and e-participation endeavours of member states.
Fifth, the measurement of willingness, quality and relevancy above rests primarily on web-site assessments. The comparative ranking of countries is purely for illustrative purposes.
Finally, the Survey found it difficult to construct a questionnaire with a full range ofthe features of political e-participation, as described in Chapter III, Part I of this Report.This would have resulted in a score of zero or very close to zero for the overwhelmingmajority of countries. Therefore, the questionnaire and consequently the results weretuned to the reality, as it exists. For instance, on the side of politics, an effort was madeto look for government attempts to use ICT to engage citizens, but more in the consul-tative rather than in the direct decision-making process. Thus, the results assume theexistence of e-participation at a rather rudimentary level.
ii. Data and methodology for the e-participation index
An assessment of a total of 21 public informative and participatory services and facil-ities was undertaken for 191 countries in e-information, e-consultation and e-decisionmaking across six general, economic and social sectors: general, education, health, socialwelfare, finance and employment. A scale of 0-4 was used in the assessment process.26
The index was constructed by standardizing the scores.
17

III. Research Findings and Analysis
A. Major findings
Global e-government expansion and design
1. Governments have made rapid progress worldwide in embracing ICT technologies fore-government in the past year. In 2001, the UN E-government Survey listed 143 mem-ber states as using the Internet in some capacity; by 2003, 91 per cent or 173 out of191 member states had a website presence. Eighteen countries were not on line. 27
2. English appears to have become the language for e-government presence on line. One hundred and twenty-five out of 173 countries provide websites in the English languagein addition to their native language. Eighty-eight per cent of the countries surveyedhave websites with information in one or more of the six UN languages, i.e. English,French, Spanish, Arabic, Chinese and Russian.
3. About 88 per cent of South and Central American and Caribbean countries providewebsites in either Spanish, English or both. In Africa, 81 per cent of countries providewebsite information in either English or French, while in Western Asia the majority ofstate websites are in Arabic.
4. There is no one model of e-government development. At present e-government web-sites are mushrooming around the globe in a haphazard manner. State and sectoralwebsites reflect wide variations among - and between - countries in the provision ofon-line information and basic public services.
5. There appears to be a gradual, but steady, trend toward national portal/gateway sites,specialty portals and one-stop service sites. However the ability of the various gov-ernments to develop and present them in an integrated, unified fashion is uneven.
6. There is a strong correlation between the existence of a formal e-government poli-cy/statement and/or e-government portal and the overall quality and ranking of anation’s sites on the various web measure indices. More and more countries areemploying a one-stop-shop portal for integrated delivery of information and services.Twenty-four of the top 25 countries and 39 of the top 50 countries have either or both,a clear e-government policy/statement and a specific e-government portal.
7. There are no evolutionary development stages in e-government. Countries can - anddo - jump from the stage of emerging or enhanced presence with limited informationto the transactional stage or networked stage in a short time.
E-government readiness rankings
8. This Survey confirms that North America (0.867) and Europe (0.558) lead amongthe world regions. 28
9. In the rest of the world, South and Central America (0.442) have the highest aggre-gate state of e-government readiness followed by South and Eastern Asia (0.437),Western Asia (0.410), the Caribbean (0.401), Oceania (0.351), South-central Asia(0.292) and finally, Africa (0.241).
18
�

�
10. The U.S. (0.927) is the world leader followed by Sweden (0.840), Australia(0.831), Denmark (0.820), the U.K. (0.814), Canada (0.806) and Norway (0.778).
11. Among the developing countries Singapore (0.746) leads, followed by the Republicof Korea (0.744), Estonia (0.697) and Chile (0.671).
12. The world average e-government readiness is 0.402.
E-participation and the promise of “inclusion of all”
13. The research affirms that the state of e-government readiness in a country is a func-tion of the combined levels of its economic and technological development and human resource development.
14. There is no standard formula for effective e-government. The determinants of differ-ences in e-government services range from political and economic models toinequities in financial, human and technical capital.
15. Since the websites are inter alia a reflection of the country’s willingness to shareinformation and knowledge with the people, in several instances, political ideologiesappear to determine what is to be public knowledge.
16. Despite popular belief, only a handful of countries worldwide are utilizing close tothe full potential of e-government.
17. Many developed countries are not fully utilizing the possibility of “including all”.Many industrialized nations are not as advanced as popularly perceived in providingpeople-centred transactional and networked services.
18. There is a real possibility of the digital divide widening between e-haves and e-have-nots in the developed and in the developing world. Inequities inside and among countries in telecommunication and human capital development pose serious con-straints on the use of e-government for knowledge creation and the empowermentof people.
19. At present, ICT-facilitated information and services reach only the privileged few inthe developing countries.
20. Most developing countries are at the initial three stages of e-government develop- ment with little or no transactional or networked services.
21. Despite difficulties, some developing countries have taken a great leap forward. Theirexamples provide model illustrations of the promise of e-government.
22. A few low-income developing countries lead the way in adopting indigenous approaches to use of an e-government on-line presence to provide information andservices to populations in far-flung areas - populations that are neither literate norconnected to a computer.
23. Finally, everything that the Survey has revealed confirms that the imperative for effec-tive e-government remains a multi-pronged approach to its development, based on
19

ICT and human and telecommunications infrastructure development. If effectively uti-lized, e-government can push the frontiers of development around the globe.
B. Global e-government readiness rankings
Table 3.1 and Graph 3.1 present the global e-government readiness rankings for the top25 countries among the UN member states. Most of the high-income developedeconomies rank the highest and considerably higher than the global average of 0.402.Though the industrialized countries make up the majority, a few middle-income devel-oping countries are in the group, indicating a fast “catch up”.
The United States is the current global leader with the highest index of 0.927, fol-lowed by Sweden (0.84), Australia (0.831), Denmark (0.820), the United Kingdom
(0.814) and Canada (0.806). Among the developing countries,Singapore (0.746), the Republic of Korea (0.744), Estonia (0.697) andChile (0.671) are among the top 25 e-government ready countries. With aglobal average of 0.402, these top 25 countries are far ahead of the rest ofthe world with rankings that range 60 to 200 per cent higher than the glob-al average. Region wise, 16 out of 25 countries belong to Europe, two toNorth America, three to South and Eastern Asia, two to Oceania and oneeach to Western Asia and South and Central America. No country fromSouth-central Asia or Africa made it into the list of the top 25 e-governmentready countries.
20
�
Table 3.1
Global E-governmentReadiness Rankings 2003:
Top 25 Countries
Country E-government Readiness Index
1. United States 0.927
2. Sweden 0.840
3. Australia 0.831
4. Denmark 0.820
5. United Kingdom 0.814
6. Canada 0.806
7. Norway 0.778
8. Switzerland 0.764
9. Germany 0.762
10. Finland 0.761
11. Netherlands 0.746
12. Singapore 0.746
13. Republic of Korea 0.737
14. New Zealand 0.718
15. Iceland 0.702
16. Estonia 0.697
17. Ireland 0.697
18. Japan 0.693
19. France 0.690
20. Italy 0.685
21. Austria 0.676
22. Chile 0.671
23. Belgium 0.670
24. Israel 0.663
25. Luxembourg 0.656

�
Graph 3.2 above presents thee-government readiness of thevarious regions of the world. Ascan be seen, North America and
Europe lead, followed by South and Central America, South and Eastern Asia; WesternAsia, the Caribbean and Oceania. South-central Asia and Africa have the lowest averagee-government readiness. The results reflect the picture of the top 25 countries.Underpinning this aggregate snapshot in time is the level of economic, social and polit-ical development of these countries.
Low e-government readiness in South-central Asia and Africa is a reflection of the low-est telecommunication index across the board; a relatively low human capital index; andthe second lowest web measure index among all regions of the world.
The regional averages in the table do not only point out the low levels of infrastruc-ture and human capital resources in several regions of the world; they also highlight thefact that the indicators for North America and Europe for these are around 5-10 timeshigher in the case of the human resource base and around 4-20 times higher in the caseof infrastructure development. For example, if the U.S. is taken as the comparator, eventhough 40 per cent29 of its population is still not on line, the telecommunication readi-ness of Africa and South-central Asia is 1/20th that of the U.S. South-central Asia, whichhas about one third of the world population, has about 20 per cent of the average human
21
N A
mer
ica
Euro
pe
Sou
th a
nd
Cen
tral
Am
eric
aSo
uth
an
d
East
ern
Asi
aW
este
rn A
sia
Cari
bb
ean
Oce
ania
Sou
th-c
entr
al
Asi
a
Afr
ica
0.867
0.558
0.442 0.437 0.410 0.4010.351
0.2920.246
Graph 3.2.
E-government ReadinessIndex by region
0.92
0.84
0.83
0.82
0.81
0.80
0.77
0.76
0.76
0.76
0.74
0.74
0.74
0.71
0.70
0.69
0.69
0.69
0.69
0.68
0.67
0.67
0.67
0.66
0.65Luxembourg
Israel
Belgium
Chile
Austria
Italy
France
Japan
Estonia
Ireland
Iceland
New Zealand
Republic of Korea
Netherlands
Singapore
Finland
Germany
Switzerland
Norway
Canada
United Kingdom
Denmark
Australia
Sweden
United States
Graph 3.1.
E-government Readiness Rankings2003,
top 25 countries

22
�
capital capacity of the U.S. These disparities are presented in a tabular and graphic formbelow.
i In regional presentations, the Report will follow "Composition of macro geographical (continental) regions,geographical sub-regions, and selected economic and other groupings" of the UNDESA Statistics Division(http://unstats.un.org/unsd/methods/m49/,49regin.htm)
Afr
ica
Sou
th a
nd
Cen
tral
Am
eric
a
Sou
th a
nd
East
ern
Asi
a
Wes
tern
Asi
a
Cari
bb
ean
Oce
ania
Euro
pe
Sou
th-c
entr
al
Asi
a
N. A
mer
ica
0.13
7
0.35
50.
197
0.19
50.
035
0.26
8
0.24
10.
204
0.74
8
0.19
2
0.37
9
0.41
8
0.88
2
0.21
7
0.16
8
0.12
3
0.82
3
0.42
2
0.78
3
0.73
8.0
.98
0.13
80.
697
0.84
5
0.7
5
0.03
60.
521
Web measure
Telecom Index
Human Cap Index
Table 3.2
Regional Indices, 2003i
Web Telecommunication Human E-GovernmentMeasure Index Index Cap. Readiness Index
North America 0.882 0.738 0.980 0.867
Europe 0.418 0.422 0.783 0.558
South and Central America 0.379 0.123 0.823 0.442
South and Eastern Asia 0.355 0.197 0.750 0.437
Western Asia 0.241 0.204 0.748 0.410
Caribbean 0.192 0.168 0.845 0.401
Oceania 0.217 0.138 0.697 0.351
South-central Asia 0.195 0.035 0.268 0.292
Africa 0.137 0.036 0.521 0.246
Graph 3.3.
Regional disparities in telecommunication and human capital

�
C. E-government readiness by country
North America and Europe
Tables 3.3 and 3.4 present the country indices. Among the world regions, Europe is onlysecond to North America and has emerged as an innovator in e-government initiativesand programmes. Of the total 42 countries grouped under Europe, around 75 per centhad e-government readiness indices above the global mean.
Among others, the U.S. (0.927), Sweden(0.84), Denmark (0.82), the U.K. (0.814) andCanada (0.806) have a long history of e-govern-ment initiatives. The US has been a leader in digi-tal services the longest. Between 1993 and 2001 theU.S. government launched over 1,300 independentinitiatives, which were eventually synthesized intoa national e-government strategy.30
The success of the global leaders is due to sev-eral factors. E-government programmes in leadingregions have sought to increase efficient servicedelivery to the public as well as to include greaterparticipation in public policy on line. This enablingenvironment is well able to sustain expansion ofsophisticated e-government programmes in thefuture.
Successful e-government programmes alsoreflect a country’s willingness to share informationand knowledge with its people. The long history ofpolitical development, democracy and the inde-pendence of the private sector and various organi-zations in these countries dictates that governmentsbe open and participatory to “include all”.
However, despite the success stories, there arewide variations in the state of e-government readi-ness. In general, countries such as Switzerland(0.764), Germany (0.762), Netherlands (0.746),and Austria (0.676) are more e-government readythen those in Eastern and Southern Europe.Whereas Poland (0.576) and Bulgaria (0.548) areleaders in Eastern Europe they remain considerably
23
Table 3.4
E-government Readiness Index, Europe
Country E-government Readiness Index
Sweden 0.840
Denmark 0.820
United Kingdom 0.814
Norway 0.778
Switzerland 0.764
Germany 0.762
Finland 0.761
Netherlands 0.746
Iceland 0.702
Estonia 0.697
Ireland 0.697
France 0.690
Italy 0.685
Austria 0.676
Belgium 0.670
Luxembourg 0.656
Portugal 0.646
Malta 0.636
Slovenia 0.631
Spain 0.602
Poland 0.576
Lithuania 0.557
Bulgaria 0.548
Czech Republic 0.542
Greece 0.540
Croatia 0.531
Slovakia 0.528
Hungary 0.516
Latvia 0.506
Romania 0.483
Ukraine 0.462
Russian Federation 0.443
Belarus 0.397Serbia andMontenegro 0.371Republic of Moldova 0.363
0.362
Albania 0.311Bosnia and Herzegovina 0.309
San Marino 0.280
Monaco 0.189
Liechtenstein 0.178
Andorra 0.174
Average 0.558
Table 3.3
E-government Readiness Index, North America
Web Telecommunication Human E-Gov.Measure Index Index Cap. Readiness Index
Canada 0.764 0.675 0.980 0.806
United States 1.000 0.801 0.980 0.927
Average 0.882 0.738 0.980 0.867
The former YugoslavRepublic of Macedonia
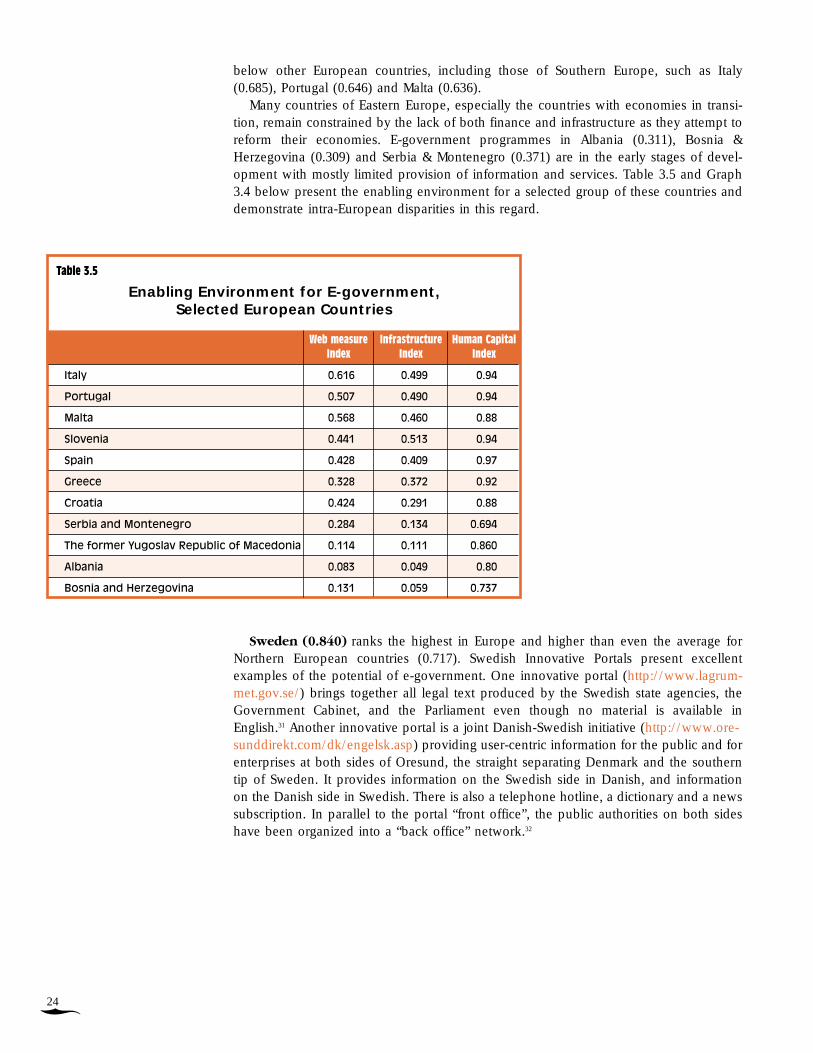
below other European countries, including those of Southern Europe, such as Italy(0.685), Portugal (0.646) and Malta (0.636).
Many countries of Eastern Europe, especially the countries with economies in transi-tion, remain constrained by the lack of both finance and infrastructure as they attempt toreform their economies. E-government programmes in Albania (0.311), Bosnia &Herzegovina (0.309) and Serbia & Montenegro (0.371) are in the early stages of devel-opment with mostly limited provision of information and services. Table 3.5 and Graph3.4 below present the enabling environment for a selected group of these countries anddemonstrate intra-European disparities in this regard.
Sweden (0.840) ranks the highest in Europe and higher than even the average forNorthern European countries (0.717). Swedish Innovative Portals present excellent examples of the potential of e-government. One innovative portal (http://www.lagrum-met.gov.se/) brings together all legal text produced by the Swedish state agencies, theGovernment Cabinet, and the Parliament even though no material is available inEnglish.31 Another innovative portal is a joint Danish-Swedish initiative (http://www.ore-sunddirekt.com/dk/engelsk.asp) providing user-centric information for the public and forenterprises at both sides of Oresund, the straight separating Denmark and the southerntip of Sweden. It provides information on the Swedish side in Danish, and informationon the Danish side in Swedish. There is also a telephone hotline, a dictionary and a newssubscription. In parallel to the portal “front office”, the public authorities on both sideshave been organized into a “back office” network.32
24
�
Web measure Infrastructure Human CapitalIndex Index Index
Italy 0.616 0.499 0.94
Portugal 0.507 0.490 0.94
Malta 0.568 0.460 0.88
Slovenia 0.441 0.513 0.94
Spain 0.428 0.409 0.97
Greece 0.328 0.372 0.92
Croatia 0.424 0.291 0.88
Serbia and Montenegro 0.284 0.134 0.694
The former Yugoslav Republic of Macedonia 0.114 0.111 0.860
Albania 0.083 0.049 0.80
Bosnia and Herzegovina 0.131 0.059 0.737
Table 3.5
Enabling Environment for E-government, Selected European Countries

�
The United Kingdom (0.814) is decidedly among the innovative leaders in the pro-vision of one-stop e-government initiatives. Most notable are its consultation features,found in the top-level “Citizen Space” section of the national site. An index of ongoingconsultations, direct access to consultation documents, and directly related policy dis-cussion forums make this citizen participation section a model to emulate. This is onlythe beginning of a gigantic wealth of resources that offer everything from a one-stop-shop for goods and services, including e-procurement, http://wwww.ogc.gov.uk.Further, the “Your Life” and “Do it Online” sections provide the user with quick accessto anything one could need in a people-centric, easy-to-use manner.
Though not a focus in this Survey, website assessments revealed that innovative e-government programmes in developed countries followed e-initiatives in their privatesectors, where the search for cost effectiveness had led the way to achieving greater effi-ciency and service provision. The governments followed in an attempt to reform the waythe state interacts with society. Moreover, as this Survey states earlier, financial means arean important determinant of successful e-government initiatives. Most developed coun-tries have had the necessary financial means to invest in developing and expanding e-government service delivery.
A major contributing factor in successful e-government programmes in most of theNorth American and European countries is a comprehensive, well-thought-out e-strate-gy. In an attempt towards improving cost effectiveness and efficiency, global leadershave been quick to seek the regulatory and administrative reform necessary for the inte-gration of e-networking into G2G and G2C interactions. Over time this has evolved intoa focus on employing a one-stop-shop portal for the integrated delivery of informationand services for convenience, effectiveness and empowerment.
25
Graph 3.4.
Enabling Environment for E-government, Europe, Selected Countries
Bel
aru
s
Rep
ub
lic o
f
Mo
ldo
va
Bu
lgar
ia
Hu
ng
ary
Po
lan
d
Slo
vaki
a
Ukr
ain
e
Ro
man
ia
Czec
h
Rep
ub
lic
Ru
ssia
n
Fed
erat
ion
0.12
20.
147
0.92
0.9
0.53
70.
207
0.89
0.34
90.
386
0.93
0.31
2
0.54
1
0.41
9
0.22
30.
185
0.29
40.
38
0.34
9
0.14
9 0.11
6
0.07
0.30
7
0.94
0.9
0.88 0.
92
0.91
0.92
0.24
8
0.12
Web measure index
Infrastructure index
Human Cap Index

FirstGov, (http://www.firstgov.org) the United States national government portal, hasbeen recently redesigned, with new information and features added on what seems adaily basis. It links all departments and agencies. Previous criticisms of the U.S. site aslacking in citizen participation have been quelled with the launch of the new “regula-tions.gov” portal for commenting on federal regulations. The site now channels users intoprimary sections for Citizens, Businesses and Non-profits, Federal Employees, andGovernment to Government. The comprehensive U.S. FirstGov network, containingsome 180 million pages, is so detailed it even provides seniors with their own portal,“seniors.gov”, as well as one-stops for employment, government benefits and eventeacher recruitment. FirstGov is also pioneering what is likely to become an e-govern-ment trend, “government without borders”, i.e. all-of-government access to national,state, regional and local government information and services through a single gateway.For example, the Citizens Homepage link to “Renew Your Driver’s License”, a state func-tion in the U.S., nevertheless guides the user directly to the correct state agency.
The Canadian national portal (http://www.canada.gc.ca) is clear evidence thatnations, governments, and even communities can and must work to find the look, feeland approach to e-government that will work best for their specific situation - no onesize fits all. (See also the “In their own words” section of Chapter II, Part I.) Recentlyredesigned, based on extensive user input, the site is now streamlined and simplified inboth its graphic design and navigation. It revolves around three basic information gate-ways: Canadians, Non-Canadians and Canadian Business. Notable among its many fea-tures is the new “Consulting Canadian” feature, which provides citizens with the oppor-tunity to comment on proposed federal regulations. This was initiated during the Surveyperiod as a pilot project, inviting user testing and comments, and then formally launchedas an integral part of the site. By registering, one can customize not only news releasesbut also the home page itself. Added to this are a host of other on-line information serv-ices and seamless connections to other websites in both of Canada’s national languages,French and English.
The most notable feature of the government of Norway’s websites is an integratedgovernment services portal (http://www.norge.no), a two-year collaborative project cur-rently testing the viability of a central all-of-government site (with integrated national,regional and local government information). Though the site offers an e-dialogue servicewhere one can chat live with a representative, and useful links to a range of national,regional and local information and services, the connections between the national siteand the services site are weak.
Finland (http://www.valtioneuvosto.fi/vn/liston/base.lsp?k=sv) scores fifth among thecountries of the northern European region. In addition to a special focus on news andbasic information, the Finnish e-government site provides a host of services offered online - everything from web forums to on-line forms.
The Ireland e-government initiative provides an example of the political commitmentand the quality of on-line programmes. Easy-to-find and easy-to-use information andtools are the hallmarks of the Irish sites. Several useful one-stops are available, such asthe e-government site, (http://www.reach.ie); “Oasis”, the On-line Access to Services,Information and Support; and BASIS (Business Access to Services Information andSupport). Some of the more innovative ventures include a comprehensive and feature-rich e-Tenders one-stop, and a wireless access (WAP) site.
Political leadership and commitment are important factors in employing e-governmentas a tool for development. Estonia’s (http://www.riik.ee/et/) national site and system ofportals and one-stops, including an e-government portal and a citizen participation site,illustrate the potential of strategic e-government planning. There is a strong emphasis ini-tially on providing all the basic information and features for the people, and on laying
26
�

�
the foundation for building more sophisticated services and transactions. The challengefor Estonia is to further improve digital services by expanding its on-line transactions. InEstonia, plans to make all forms and applications submittable on line have been held upwhile the government works out security, electronic signature and other necessary legaland technical requirements.
South and Eastern Asia
As the table below shows, clearly Singapore (0.746), the Republic of Korea (0.744)and Japan (0.693) are the regional leaders, and at about the same level as manyEuropean countries in their state of e-government readiness.
Many governments have begun to employ innovative e-strategies along the lines ofthose in the developed countries to provide information and services tothe public. E-government programmes in both Singapore and theRepublic of Korea provide a lot of information and services. TheSingapore (http://www.gov.sg/) national government site is one of thebest-organized sites in existence, providing an effective starting point forthe user to find just about anything related to the government. There iseverything from an on-line Government Mall to an on-line donationsportal. Most notable on the homepage, however, is the E-Citizen portalwhere government services are literally “A Click Away.” The heavyemphasis on services is complemented by quality news and information,often provided by a top-rated commercial provider.
Though still a way off from an integrated portal, the Republic of Koreanational gateway site is a new and evolving e-government site. Thoughthere are numerous links and various services, only a few can be initiatedon line at present. The Republic of Korea’s sites provide a fairly compre-hensive range of information, from subway information and financialreports to real-time news and on-line language courses in Korean. Thegateway portal also includes an open bulletin board system for generalfeedback and commentary, a basic but effective approach to disseminatinginformation. The country takes a two-way approach to implementation: thegovernment information portal on one hand and the government serviceportal (www.korea.go.kr, open.korea.go.kr, minwon.korea.go.kr) on theother. The former is focused mainly on providing government informationand the latter on providing government services, i.e. on-line transactionsbetween the government and the public, including businesses. In thefuture, the two government portals - the information portal and the serv-ice portal - will be linked together and integrated into a single governmentportal. The integration and linkages among the various sites, informationand services are still being worked out.
27
Table 3.6
E-government ReadinessRankings in South and
Eastern AsiaE-government
Readiness Index
Singapore 0.746
Republic of Korea 0.744
Japan 0.693
Philippines 0.574
Malaysia 0.524
Brunei Darussalam 0.459
Thailand 0.446
Indonesia 0.422
China 0.416
Viet Nam 0.357
Mongolia 0.343
Myanmar 0.280
Cambodia 0.264
Lao People’s Democratic Republic 0.192
Timor-Leste 0.087
Average 0.437

A graphic representation of the on-line population andavailability of PCs/persons in selected South and EasternAsian countries is presented in Table 3.7. As can be seen,deficient infrastructure is a very serious constraint on thepotential of e-government programmes to reach all.Whereas Japan (0.626) and the Republic of Korea(0.675) have a high level of telecommunication infrastruc-ture, the Philippines (0.064), Indonesia (0.045),Cambodia (0.004) and Myanmar (0.003) are only at afraction of their level.
Despite limitations, some countries have taken the leapin initiating innovative e-government programmes. Onesuch example is Cambodia (http://www.cambodia.gov.kh),where the government’s resource focus appears to be onengaging citizen input. Focusing on providing opportuni-ties for citizens to interact with the government, theCambodian national site includes a small survey section, anopen topic discussion forum titled “Opinions”, and aninteractive question and answer section. Although notmeeting the threshold for a formal on-line consultation sys-tem, including policy documents and decision guidance,
the on-line participation features at the Cambodian site represent a big step in that direc-tion, especially for a deve-loping country.
Despite the fact that at present, the reach of e-initiatives is limited to a small propor-tion of the population, the Philippines government has initiated efforts to improve theefficiency of government services to the public. The Transparent Accountable Gover-nance (TAG) (http://www.tag.org.ph) project in an attempt to summarize how, why and
28
�
Table 3.7
Enabling Environment Indicators in South and Eastern Asia,
Selected Countries
Web Telecom Human Capmeasure Index Index
Brunei Darussalam 0.266 0.250 0.86
Cambodia 0.127 0.004 0.66
China 0.332 0.116 0.8
Indonesia 0.432 0.045 0.79
Japan 0.524 0.626 0.93
Malaysia 0.480 0.292 0.8
Mongolia 0.140 0.040 0.85
Myanmar 0.087 0.003 0.75
Philippines 0.747 0.064 0.91
Republic of Korea 0.607 0.675 0.95
Thailand 0.380 0.117 0.84
Sin
gap
ore
Mya
nm
ar
Rep
. of
Ko
rea
Ind
on
esia
Chin
a
US
Cam
bo
dia
Jap
an
Lao
s
PCs/1000
Online pop/1000
508.
3
493
555.
8
464
625
597.
5
382.
5
372
11 19.3
19
35.8
1.1
0.2
1.5
3.3
1.7
0.8
Graph 3.5.
A comparative picture of telecommunication indicators in East Asia, selected countries

�
to what degree corruption exists in Philippine society. The approach relies on publicopinion survey research, investigative reports, case studies and discussions to engage thepublic in a discussion on corruption. TAG takes a pro-active role in encouraging publicdebate on the issue of corruption and ways to counter it. The TAG website also presentsthe initiatives of both government and the private-sector in addressing corruption.33 Theresearch findings illustrate that, despite financial and other limitations, the political willto empower citizens is an important contributor towards an effort at e-government forall.
South-central Asia
The countries in South-central Asia score low in their state of e-government readiness.Maldives (0.410), which scores the highest in human capital, is also the regional leader,though its e-government readiness index is about at the level of the global mean.Kazakhstan (0.387) and Sri Lanka (0.385) follow but their e-government readinessremains much below the world average.
Despite much progress in ICT, the lack of infrastructure and education has limited theenabling environment in India and the reach of e-government to include all. The sameis the case in Pakistan. More than in other parts of the world, telecommunication infra-structure is severely lacking in South Asia. Irregular or non-existent electricity suppliesare a common feature and a major barrier to the use of ICTs, especially outside the majortowns. Major power outages are experienced, especially in the rural areas in India andPakistan. Computers and cell phones remain luxury items, not available to all. The costof telephones and the Internet are high relative to the per capita GDP of many of theSouth Asian countries.
Additionally, the relatively lower level of human development impedes access to all.With 20 per cent of the global population living in the Indian sub-continent alone, thepotential of e-government to development could be enormous, not only for the region
but for the world as a whole. However, theserious limitations on literacy and educationconfine the benefit of e-government to thevery few. Graphs 3.6 and 3.7 illustrate the defi-ciencies in infrastructure and human resourceswithin the countries of South-central Asia andin comparison with other regions of the world.
29
Table 3.8
E-government Readiness Rankings in South-central Asia
E-governmentReadiness Index
Maldives 0.410
Kazakhstan 0.387
Sri Lanka 0.385
India 0.373
Turkmenistan 0.335
Iran (Islamic Republic of) 0.330
Kyrgyzstan 0.327
Nepal 0.268
Pakistan 0.247
Bangladesh 0.165
Bhutan 0.157
Afghanistan 0.118
Average 0.292

Furthermore, the low level of purchasing power of the vast majority of the popula-tions, the lack of development of an adequate regulatory framework and an inadequateintegration of operations among various government agencies and departments imposesa serious constraint on e- government reach and expansion.
Notwithstanding, some Asian developing countries are reaching out to their popula-tions through highly innovative e-government initiatives in a remarkable effort to “includeall”.
30
�
Pak
ista
n
Sri L
anka
Turk
men
ista
n
Afg
anis
tan
Kaz
akh
stan
Ban
gla
des
h
Ind
ia
Iran
Nep
al
Kyr
gyz
stan
Bh
uta
n
Mal
div
es
Telecom Index
Human Cap Index
0.26
8
0.00
0.4
0.00
0.42
0.57
0.75
0.91
0.87
0.9
0.48
0.42
0.84
0.92
0.02 0.03
0.09
0.06
0.04 0.
07
0.01 0.03 0.04
0.04
Graph 3.6
Telecommunication and human capital indices for South and Central Asia
0.13
7
0.35
5
0.19
5
0.24
1
0.03
6
0.19
7
0.03
5
0.20
4
0.41
0
0.74
8
0.29
2
0.26
8
0.52
1
0.75
0
0.24
6
0.43
7
Web measure
Telecom Index
Human Cap Index
E Readiness Index
Africa South and Eastern Asia
South-central Asia Western Asia
Graph 3.7
Enabling environment, selected region

�
Box 3.1
G2C e-partnerships: inventive indigenous e-government in Sri Lanka
Though e-government programmes have the potential to offer a new set of toolsfor rural development, it requires special efforts to create appropriate access mod-els for those who can neither afford Internet access nor have the language capac-ity to understand the content. The Kothmale Community Radio Internet project isan access model that reduces these barriers and empowers marginalized commu-nities in rural areas.
The Kothmale Community Radio Internet Project, implemented by UNESCO, wasthe first pilot experiment in Sri Lanka to develop a suitable access model to addressmost of the concerns above. The Kothmale project uses community radio as aninterface between the community and the Internet through a pioneering “Radio-browse” model, thereby introducing indirect mass access to cyberspace through adaily one-hour interactive radio programme. The model is based on the followinginterdependent components:
Facilities such as computers, dedicated Internet connectivity and trained volunteers,who are available at the radio station to help community members surf the Internet.
The community radio station, which broadcasts a daily “Radio Browsing theInternet” programme. The broadcasters, supported by resource personnel, browsethe Internet on-air together with their listeners, and discuss and contextualize infor-mation in the local language. Thus, the radio programme raises awareness aboutthe Internet in a participatory manner. The listeners request the broadcasters to surfthe Web on their behalf and the programme transmits information in response totheir requests. This information is explained and contextualized with the help ofstudio guests. For example, a local doctor may explain data on a health website.
The radio station also develops its own information database from requestsreceived from listeners. In addition, the station provides skills training to help com-munity members develop their own websites and encourages them to producecontent for the Internet. Nearly 20 individual websites were prepared by commu-nity members and hosted on the station’s server. The radio station, with its server,provides Internet access at two nearby public libraries. The access points turn thecommunity radio station into a local Internet service provider.
Source: The World Bank. E-Government: Sri Lanka case study.http://www1.worldbank.org/publicsector/egov/srilanka.htm
In some developing countries e-government initiatives are model illustrations of thepromise of e-government. Countries such as Sri Lanka and India lead the way in adopt-ing indigenous approaches to providing information and services to populations in far-flung areas - populations that are neither literate nor connected to a computer.
31

Box 3.2
Innovative community-owned rural Internet kiosksin Gyandoot, India
Characteristics of the area: Dhar district in central India; population 1.7 million, 60per cent below the poverty line.
Objective: to establish community-owned, technologically innovative and sustain-able information kiosks in a poverty-stricken, tribal dominated rural area of MadhyaPradesh.
Issues: During the design phase of the project, meetings were held with villagers togather their input. Among the concerns highlighted by villagers was the absence ofinformation about the prevailing agricultural produce auction centre rates, as aresult of which farmers were unable to get the best prices for their agricultural pro-duce. Copies of land records also were difficult to obtain. A villager had to go outin search of the patwari (village functionary who maintains all land records), whooften was difficult to get hold of as his duties include extensive travel. To file com-plaints or submit applications, people had to go to district headquarters (whichcould be 100 miles away), resulting in a loss of wages/earnings.
The Project: The Gyandoot project was launched on 1 January 2000 with the instal-lation of a low cost rural Intranet covering 20 village information kiosks in fiveBlocks of the district. The entire network of 31 kiosks covers 311 Panchayats (vil-lage committees), over 600 villages and a population of around half a million (near-ly 50 per cent of the entire district).
Kiosks have been established in the village Panchayat buildings. Information kioskshave dial-up connectivity through local exchanges on optical fibre or UHF links.The server hub is a Remote Access Server housed in the computer room in theDistrict Panchayat.
User fees are charged at the kiosks for the services provided. Local rural youth actas entrepreneurs, running these information kiosks along commercial lines. A localperson with 10 years of schooling (matriculate) can be selected as an operator.He/she needs only maintenance, limited typing (software is menu driven) andnumeric data entry skills.
The following services are now offered at the kiosks:
Agricultural Produce Auction Centres Rates: Prevailing rates of prominent crops at thelocal and other recognized auction centres around the country are available on-line.
Copies of Land Records: Documents relating to land records including khasra(record of rights) are provided on the spot; approximately two million farmersrequire these extracts at every cropping season to obtain loans from banks for pur-chasing seeds and fertilizers.
On-line Registration of Applications: Villagers had to make several visits to the localrevenue court to file applications for obtaining income/caste/domicile certificates.
32
�

�
Now, they may send the application from a kiosk and within 10 days, notificationabout the readiness of the certificate is sent via e-mail to the relevant kiosk. Onlyone trip is needed - to collect the certificate.
On-line Public Grievance Redress: A complaint can be filed and a reply receivedwithin seven days, including for drinking water, quality of seed/fertilizer, scholar-ship sanction/disbursement, employee establishment matters, functioning ofschools or village committees etc.
Village auction site: This facility makes auction facilities available to farmers and vil-lagers for land, agricultural machinery, equipment and other durable commodities.
Other services offered at the kiosks include on-line matrimonial advertisements,information regarding government programmes, a forum that enables school chil-dren to ask questions (“Ask an Expert”), e-mail (free for information on child labour,child marriage, illegal possession of land belonging to Scheduled Tribes etc.) Somekiosks also have added photocopy machines, STD PCO, and horoscope services. InJanuary 2000, the first month of operation, the kiosk network was accessed 1,200times for a variety of services. That number reached nearly 9,000 in July. During thefirst 11 months, the 31 Gyandoot kiosks were used nearly 55,000 times.
Source: The World Bank. http://www1.worldbank.org/publicsector/egov/gyan-dootcs.htm
Western Asia
A supportive enabling environment isreflected in the highest e-government readi-ness index of Israel (0.663) in Western Asia.However, Arab and non-Arab countries inthe region follow, having e-governmentreadiness indices above the global mean of0.402. The United Arab Emirates (UAE)(0.535), Bahrain (0.510), Turkey (0.506),Cyprus (0.474), Jordan (0.429), Lebanon(0.424) and Qatar (0.411) have put tremen-dous effort into developing their e-govern-ment programmes in recent years.Supported by financial investment andefforts at regulatory and administrativereforms, these countries are at a higher stateof e-government readiness than many in theAfrica or South-central Asia regions. On theother hand, Syria (0.264) and Yemen (0.188)currently indicate a deficient level of e-gov-ernment readiness, a large part of which isdue to their lower level of human/capitaland technology infrastructure.
Table 3.9 presents the e-government rea-diness of the countries of Western Asia.
33
Table 3.9
E-government Readiness in Western Asia
E-governmentReadiness Index
Israel 0.663
United Arab Emirates 0.535
Bahrain 0.510
Turkey 0.506
Cyprus 0.474
Jordan 0.429
Lebanon 0.424
Qatar 0.411
Armenia 0.377
Kuwait 0.370
Azerbaijan 0.364
Oman 0.355
Georgia 0.351
Saudi Arabia 0.338
Syrian Arab Republic 0.264
Yemen 0.188
Average 0.410

The Israeli e-government initiative provides all the basic government information andservices combined with links, for example, to e-Tender and e-Payment one-stop-shopportals.
The Government of Saudi Arabia has digitized its ministries and is planning to pro-vide information and services to the public over the next five years.
The Government of Jordan is in the process of planning for a full-scale electronicgovernment over the next five years.34
On-line banking has already taken off in a few countries like Lebanon and the UAE.In 2001, the Government of the UAE, which leads the e-government effort among the
Arab States, launched the e-Dirham system and site. It became the first in the Arab Worldto focus on providing e-services through an excellent integrated e-payment system set-ting a new standard in the realm of on-line transactions. The orientation of the UAE siteleans toward commerce and business, but the e-Dirham programme is broadly availableto the public, and as it develops, promises to encompass a wider range of people-cen-tred services and transactions in health, education and other areas.
Even though low on the e-government readi-ness ranking in this Survey, Oman provides animpressive amount of useful information, servic-es and links on its official e-government site. Itfeatures virtually everything from exchange rates,bus times, links to important sites, live TV, week-ly news releases, even prayer times - and this isjust on the front page. Two features are especial-ly notable, albeit for different reasons. First, thereis a link to an excellent e-tender site,http://www.tenderboard.gov.om. Second, thehome site guest book provides interesting read-ing and, as opposed to most other such guestbooks, states that someone will actually respondto comments made - one message at a time.
Africa
With an average index of 0.246, Africa’s state ofe-government readiness is around half that of theworld average. The disparities between Africaand the rest of the world are much wider intelecommunication infrastructure than in themore traditional measures of development:
34
�
Table 3.10
E-government Readiness Rankings in Africa
E-government Readiness Index
South Africa 0.515
Mauritius 0.471
Seychelles 0.420
Algeria 0.370
Botswana 0.347
Lesotho 0.346
Namibia 0.340
Tunisia 0.329
Cape Verde 0.322
Zimbabwe 0.304
Kenya 0.299
Uganda 0.296
Swaziland 0.295
Gabon 0.283
Zambia 0.276
Sao Tome and Principe 0.272
Cameroon 0.270
Morocco 0.265
Congo 0.265
United Republic of Tanzania 0.253
Rwanda 0.244
Ghana 0.241
Egypt 0.238
Benin 0.235
Malawi 0.233
Togo 0.231
Madagascar 0.229
Nigeria 0.225
Sudan 0.206
Senegal 0.201
Angola 0.192
Burundi 0.181
Djibouti 0.179
Comoros 0.176
Mozambique 0.173
Gambia 0.172
Mauritania 0.161
Mali 0.140
Burkina Faso 0.135
Guinea 0.132
Ethiopia 0.128
Sierra Leone 0.126
Niger 0.060
Somalia 0.049
Average 0.246

�
Table 3.11 and Graph 3.8 pres-ent the telecommunication indica-tors in selected African countries.Though the use of the Internet hasspread in the last few years, ingeneral the lack of telecommuni-cation infrastructure in Africa is aserious constraint to the rapidadoption of e-government for all.Most of the existing telecom infra-structure does not reach the bulkof the population - 50 per cent ofthe available lines are concentrat-ed in the capital cities, where onlyabout 10 per cent of the popula-tion lives. In over 15 countries inAfrica, including Côte d’Ivoire,Ghana and Uganda, over 70 percent of the lines are still located inthe largest cities.35
35
South Africa 7.26 68.20 107.7 7.03 265.8 127
Mauritius 10.83 148.7 270.3 0.13 289.1 268
Seychelles a) b) 14.65 109.8 261.1 11.24 538.7 214
Zimbabwe 5.16 42.97 24.7 0.88 30.3 30
Gabon a) 1.19 19.24 29.5 1.24 204.5 326
Cameroon a) 0.39 2.91 6.6 0.28 35.7 34
Ghana a) 0.33 1.93 11.6 0.2 9.3 118
Burkina Faso a) 0.15 1.62 4.9 0.2 6.4 12
Uganda 0.29 2.51 2.2 0.24 15.9 27
Sudan 0.92 2.58 20.6 0.15 5.9 273
Malawi 0.13 2.58 7.0 0.33 8.2 3.0
Table 3.11
Telecommunication Measures in Africa, Selected Countries
Note: a) data is for 2000; b) data is for 2001.
Country PCs / Internet Telephone Online Mobile TV sets /Per Users / lines population subs / 1000
100 pers 1000 pers 1000 pers % 1000 pers pers
PCs / Per 100 pers
Internet Users / 1000 pers
Telephone lines per 1000 pers
Online pop %
Telephone lines per 1000 pers
TV sets / 1000 pers
7.368.2
107.77.0
265.81.27
10.8148. 7
270.30.13
289.1268
14.7109.9
261.111.2
538.72145.16
42.924.7
0.930.330
0.42.9
0.335.734
0.2
0.92.6
20.60.155.9
273
0.12.67
0.38.2
3
1.64.9
0.26.412
6.6
South Africa
Mauritius
Seychelles
Zimbabwe
Cameroon
Burkina Faso
Sudan
Malawi
Graph 3.8
Enabling environment in Africa, selected countries
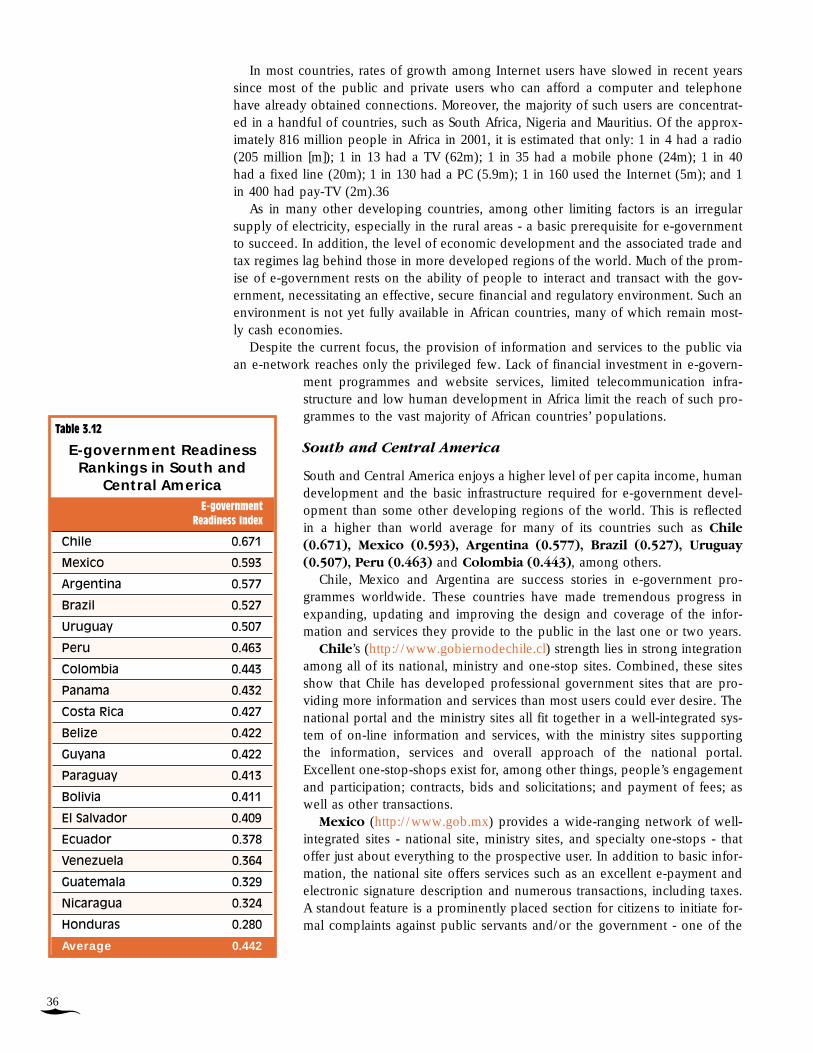
In most countries, rates of growth among Internet users have slowed in recent yearssince most of the public and private users who can afford a computer and telephonehave already obtained connections. Moreover, the majority of such users are concentrat-ed in a handful of countries, such as South Africa, Nigeria and Mauritius. Of the approx-imately 816 million people in Africa in 2001, it is estimated that only: 1 in 4 had a radio(205 million [m]); 1 in 13 had a TV (62m); 1 in 35 had a mobile phone (24m); 1 in 40had a fixed line (20m); 1 in 130 had a PC (5.9m); 1 in 160 used the Internet (5m); and 1in 400 had pay-TV (2m).36
As in many other developing countries, among other limiting factors is an irregularsupply of electricity, especially in the rural areas - a basic prerequisite for e-governmentto succeed. In addition, the level of economic development and the associated trade andtax regimes lag behind those in more developed regions of the world. Much of the prom-ise of e-government rests on the ability of people to interact and transact with the gov-ernment, necessitating an effective, secure financial and regulatory environment. Such anenvironment is not yet fully available in African countries, many of which remain most-ly cash economies.
Despite the current focus, the provision of information and services to the public viaan e-network reaches only the privileged few. Lack of financial investment in e-govern-
ment programmes and website services, limited telecommunication infra-structure and low human development in Africa limit the reach of such pro-grammes to the vast majority of African countries’ populations.
South and Central America
South and Central America enjoys a higher level of per capita income, humandevelopment and the basic infrastructure required for e-government devel-opment than some other developing regions of the world. This is reflectedin a higher than world average for many of its countries such as Chile(0.671), Mexico (0.593), Argentina (0.577), Brazil (0.527), Uruguay(0.507), Peru (0.463) and Colombia (0.443), among others.
Chile, Mexico and Argentina are success stories in e-government pro-grammes worldwide. These countries have made tremendous progress inexpanding, updating and improving the design and coverage of the infor-mation and services they provide to the public in the last one or two years.
Chile’s (http://www.gobiernodechile.cl) strength lies in strong integrationamong all of its national, ministry and one-stop sites. Combined, these sitesshow that Chile has developed professional government sites that are pro-viding more information and services than most users could ever desire. Thenational portal and the ministry sites all fit together in a well-integrated sys-tem of on-line information and services, with the ministry sites supportingthe information, services and overall approach of the national portal.Excellent one-stop-shops exist for, among other things, people’s engagementand participation; contracts, bids and solicitations; and payment of fees; aswell as other transactions.
Mexico (http://www.gob.mx) provides a wide-ranging network of well-integrated sites - national site, ministry sites, and specialty one-stops - thatoffer just about everything to the prospective user. In addition to basic infor-mation, the national site offers services such as an excellent e-payment andelectronic signature description and numerous transactions, including taxes.A standout feature is a prominently placed section for citizens to initiate for-mal complaints against public servants and/or the government - one of the
36
�
Table 3.12
E-government ReadinessRankings in South and
Central AmericaE-government
Readiness Index
Chile 0.671
Mexico 0.593
Argentina 0.577
Brazil 0.527
Uruguay 0.507
Peru 0.463
Colombia 0.443
Panama 0.432
Costa Rica 0.427
Belize 0.422
Guyana 0.422
Paraguay 0.413
Bolivia 0.411
El Salvador 0.409
Ecuador 0.378
Venezuela 0.364
Guatemala 0.329
Nicaragua 0.324
Honduras 0.280
Average 0.442

�
best examples of how e-government can facilitate transparency and accountability ingovernment.
Argentina has made substantial progress in its e-government initiatives in the lastyear. Behind its high ranking in the Survey is the provision of information and serviceson all of its public service ministry sites. For example, the education ministry,http//www.educ.ar, proved to be especially noteworthy. Not only does it provide plen-ty of informational resources, but it also engages the public directly through on-lineforms, chat rooms and discussion.
Other South and Central American countries are also making great strides in promot-ing E-government usage. However, at present Ecuador (0.378), Venezuela (0.364),Guatemala (0.329), Nicaragua (0.324) and Honduras (0.280) will need to take somemore time and effort to develop their e-government potentials fully.
Caribbean
Clearly Saint Lucia (0.438) with its endow-ments is the leader in the Caribbean, fol-lowed by Dominican Republic (0.438)and Jamaica (0.432). Seven Caribbeancountries have a higher than world average.Four countries though, have a lower thanworld mean: Cuba, Antigua and Barbuda,Grenada and St. Vincent and theGrenadines.
Oceania
Australia is the regional leader among thegroup comprising Oceania. Australia(0.831) and New Zealand (0.178) have e-government readiness rankings that aretwice the world average and are among theglobal leaders in e-government.
37
Table 3.13
E-government Readiness Rankings
in the CaribbeanE-government
Readiness Index
Saint Lucia 0.438
Dominican Republic 0.438
Jamaica 0.432
Bahamas 0.429
Trinidad and Tobago 0.427
Saint Kitts and Nevis 0.426
Barbados 0.413
Cuba 0.372
Antigua and Barbuda 0.364
Grenada 0.348Saint Vincent and the Grenadines 0.326
Average 0.401
Table 3.14
E-government Readiness Rankings
in OceaniaE-government
Readiness Rankings
Australia 0.831
New Zealand 0.718
Micronesia (Federated States of) 0.526
Fiji 0.425
Tonga 0.391
Samoa 0.299
Nauru 0.293
Solomon Islands 0.284
Papua New Guinea 0.250
Vanuatu 0.142
Marshall Islands 0.038
Palau 0.009
Average 0.351

Australia http://www.fed.gov.au, http://jobsearch.gov.au has an extensive andextremely user-friendly federal portal that uses the tab menu system to provide its userswith quick access to a wealth of information. The site provides personalization featuressuch as keyword press release subscriptions and access to the comprehensiveCommonwealth Government On-Line Directory. Australia is also home to perhaps theworld’s greatest job database, which is updated every 20 minutes. And the site featuresa 60-second web comment form on how to improve it.
In conclusion, there is no one model of e-government development. At present e-gov-ernment websites are mushrooming around the globe in a haphazard manner. State andsectoral websites reflect wide variations among - and between - countries in the provi-sion of on-line information and basic public services. The state of e-government and e-
government readiness in a country is a function of the combined level ofeconomic, technological development and human resource development.The determinants of differences in e-government services range from politi-cal and economic models to inequities in terms of financial, human and tech-nical capital.
In the developing world, there is a real possibility of the digital dividewidening between e-haves and e-have-nots. Inequities between, and among,nations in telecommunication and human capital development pose seriousconstraints on the use of e-government for knowledge and the empower-ment of people. At present, information and services to the public via an e-network reach only the privileged few in the developing countries.
Despite difficulties, some developing countries have taken a great leapforward. These examples provide model illustrations of the promise of e-gov-ernment. The imperative for effective e-government as a tool for develop-ment remains a multi-pronged approach to e-government based on ICT andhuman and telecommunications infrastructure development. If effectively uti-lized, e-government can push the frontiers of development around the globe.
IV. Web Measure Assessments
Several countries worldwide have made tremendous progress in adopting e-government to provide information, knowledge and services to the publicthrough their official government websites, as reflected in the e-governmentreadiness rankings presented above. However, it should always be kept inmind that the E-government Readiness Index is a composite of the WebMeasure Index, the Telecommunication Index and the Human Capital Index.With limited human and technological infrastructure support, many countriesthat have recently invested in e- government have tended to lose out in theset of world comparative rankings.
To highlight innovative efforts by these countries in e-government devel-opment, Table 4.1 provides the top 25 countries when ranked by the WebMeasure Index alone, with the U.S. as the comparator.
As can be seen from the table, the rankings are considerably changed. Forexample, Chile, which was 22 in the overall E-government Readiness Indexjumps to position two when ranked by the Web Measure Index. Similarly,Mexico, which was 30 in the E-government Readiness Index surpasses 26other countries and jumps to number four in the Web Measure Index.
The web measure rankings points to the interesting fact that in the lastcouple of years, Chile, Mexico, Australia, the Philippines, Singapore, Estonia,
38
�
Table 4.1
Web Measure Index 2003,Top 25 Countries
Web measureIndex
1 United States 1.000
2 Chile 0.838
3 Australia 0.812
4 Mexico 0.808
5 United Kingdom 0.777
6 Canada 0.764
7 Philippines 0.747
8 Singapore 0.703
9 Denmark 0.694
10 Sweden 0.683
11 Germany 0.683
12 Switzerland 0.668
13 Estonia 0.642
14 Israel 0.633
15 Argentina 0.624
16 Italy 0.616
17 Ireland 0.616
18 Republic of Korea 0.607
19 Finland 0.603
20 Norway 0.581
21 Brazil 0.576
22 France 0.570
23 Malta 0.568
24 Turkey 0.555
25 New Zealand 0.552
Average 0.351

�
Argentina, Brazil, Republic of Korea, Malta and Turkey have made much faster and moreeffective progress in their e-government programmes than some of the developed coun-tries. The information and services provided by them are as, or more, sophisticated andmature.
In several instances, some of these countries scored higher on interactive, transac-tional or networked stages. For example, Chile outranks all but the U.S. in providingnetworked services to the public. On their Ministry of Education sites, Chile and thePhilippines outscore the U.S. in providing networked services to the public. ThePhilippines and Mexico score higher than all countries except the U.S. and the U.K. inproviding two-way transactions to the public. Estonia equals Canada in interactive serv-ices while the Philippines scores higher on interactive services than Germany, Denmark,Sweden and the U.K. on its social welfare and labour sites.
Even though several developing countries have made vast progress towards e-gov-ernment, the state of e-government readiness rests on the level of the telecommunica-tion infrastructure and human capital in a country. Consequently, notwithstanding thecommendable strides in develop-ing e-government networks inChile, Mexico and Argentina, e-government services do notreach the majority of the popula-tion in these countries. Table 4.2and Graph 4.1 give the telecom-munication indicators for thesecountries. As can be seen,despite a very high HumanCapital Index, e-connectivity inthese countries ranges from 3.3per cent in Mexico to 20 per centin Chile.
39
PC Internet Tel On-line Mobile TVs Educuse lines population subscribers Index
Argentina 82 112.022 218.8 10.3 177.6 293 0.92
Chile 119.3 201.415 230.4 20.0 428.3 242 0.9
Mexico 68.7 45.774 146.7 3.3 254.5 283 0.84
Brazil 74.8 82.241 223.2 6.8 200.6 343 0.83
Table 4.2
Telecommunication Indicators in Latin America, Selected Countries
Data for PCs, Internet usage, telephone lines and mobile subscribers is for 2002; on-line population data is for 2001, and for TVs, for 2000. On-line population data is the percentage of the population; all other data is per 1000 persons.
PC Internet use
Telephonelines
Online population
Mobile subscribers
TVs Educ Index
Argentina
Chile
Mexico
Brazil
82
112.
0
82.3
218.
8
103.
8
68.4
177.
6
293
343
200.
6223.
2
119.
3
201.
445
.8
230.
4
200.
2
254.
5
242
283
0.92
0.92
0.92
0.92
0.84
0.84
428.
3
33.8
146.
7
68.7
74.8
Graph 4.1
Telecommunication indicators in selected South Central American countries

There is a strong correlation between the existence of a formal e-government poli-cy/statement and/or e-government portal and the overall quality and ranking of a nation’ssites on the various web measure indices. Twenty-four of the top 25 countries and 39 ofthe top 50 countries have either or both a clear e-government policy/statement and a spe-cific e-government portal.
There appears to be a gradual, but steady trend toward national portal/gateway sites,specialty portals, and one-stop service sites. However the ability of the various govern-ments to develop and present them in an integrated, unified fashion is uneven. TheSurvey found numerous specialty sites and one-stops that were either not well integrat-ed into a main government site or not linked at all.
IV.1 Stages of service delivery analysis
One positive finding in this year’s UN Global E-government Survey is that the vast major-ity of countries have developed some level of on-line presence. Eighteen UN memberstates do not have an on-line presence.
No on-line presence
Central African Republic, Chad, Côte d’Ivoire, Democratic People’s Republic ofKorea, Democratic Republic of the Congo, Dominica, Equatorial Guinea, Eritrea,Guinea-Bissau, Haiti, Iraq, Kiribati, Liberia, Libyan Arab Jamahiriya, Suriname,Tajikistan, Tuvalu and Uzbekistan. 37
For the 173 countries with a web presence, the Survey finds that there are no evolu-tionary development stages in e-government. Whereas the majority of countries could beconsidered well within stage II (enhanced presence) the stages of e-government were notadditive beyond a certain threshold. Whereas countries at the initial stages of an emerg-ing presence or enhanced presence could be said to be at stage I or II, they could - anddo - quickly proceed to a level where they incorporate features of stage IV (transaction-al presence) or even stage V (networked presence).
Stages of service delivery
Stage I: Emerging Presence Stage II: Enhanced Presence Stage III: Interactive Presence Stage IV: Transactional Presence Stage V: Networked Presence
A somewhat surprising finding of this Survey is that, contrary to popular belief, notmany countries are at present utilizing the full potential of e-government to provide infor-mation and services to the people.
40
�

�
The overall profile of UN member states indicates thatwhereas 173 countries had a web presence only 45, or a quar-ter of them, maintained an integrated single entry portal, onlyone third provided on-line public services, and not even 20 percent provided on-line transactions.
Moreover, only a quarter of the countries on line clearlyprovide an e-government policy/statement or separate e-gov-ernment portal at their sites explaining how and why newtechnology is being used for government purposes.Developing and providing a clear, forward looking e-govern-ment strategy will be a key element in successfully expandingon-line government services and providing information to peo-ple.
Most of the top 50 countries ranked by the Web Measure Index provide an e-govern-ment policy/statement or an e-government portal; so, too, do a few lower ranking coun-tries, evidencing their commitment to e-government. Ghana, (http://www.ghana.gov.gh/index.php, http://www.ghana.gov.gh/governing/egovernance/index.php) for exam-ple, exemplifies how a developing country can provide its people with a clear, easilyaccessible and well-explained “E-governance” section on its national site. The sectionbegins with the important words, “In line with government’s efforts to facilitate the freeflow of information and transparency in governance...” and explains the substance andgoals of the Ghana Dot Gov project. Basically, the e-government programme willenhance the national site to create a single point of access portal “to deliver online serv-ices to the people.”38
41
Table 4.3
On-line Profile of UN Member States
UN member states 191
With a government website presence 173
With a single entry portal 45
With public service provision 63
With on-line transactions provision 33
United Arab Emirates
China
Maldives
Kazakhstan
Mongolia
Armenia
Cambodia
75
39
50
22
12
10075
508888
100
13
8
7
5
17
16
16
6
14
25
17
7
31
27
9
47
32
0
000
00
0
Emerging presence
Enhanced presence
Interactive presence
Transactional presence
Networked presence
Graph 4.2
Stages in e government,selected developing countries

In the last couple of years most countries have added substantial information to theirgovernment websites. As the Survey found, currently a high 90 per cent of the countrieshave now started to provide texts of laws and policy or other documents for the infor-mation of the people. Of the total, 79 per cent provided databases of documents or sta-tistics on the public sector. On the other hand, the number of countries providing sub-stantive service information is far less, dropping considerably to only 63 out of 173 or alittle more than one third of the total number of countries on line.
There is a correlation among countries’ incomecategories and the sophistication of governmentwebsites. As income per capita decreases, so doesthe maturity and sophistication of the servicesoffered on the web.
The high-income countries, with GrossNational Income (GNI) per capita of more thanUS$ 9,206, provide 88 per cent of the informationand services in stage I (emerging presence) and61 per cent of those in stage II (enhanced pres-ence). Though most in this group are at stage IIIand beyond, they collectively provide an averageof approximately one half of the interactive serv-ices needed by the public and a meagre 18 percent of the potential networked services.
There is wide dispersion among countries inother income categories too in their provision ofinformation and services. Whereas the upper andlower middle-income countries score relatively
well in the first three stages, like the high-income countries, their average scores dropconsiderably when it comes to the transactional services they offer. Upper and lowermiddle- income countries offer only about four per cent and one per cent of the trans-actional services, respectively. (See table 4.5).
42
�
Table 4.4
Selected Common Characteristicsof Country Websites
No of Percent ofcountries countries
One-stop-shops/ 45 26”single-windows”Sources of archived information 155 90(laws, policy documents, etc.)Databases (e.g., web access 137 79to/downloadable statistics)Public services 63 36(true services and/or substantive service information)

�
The low-income countries are primarily in the first three stages, though some havemade an effort to provide some form of participatory service to the public, which isreflected in their aggregate percentage utilization of three per cent in stage V (networkedpresence). On average, the low-income countries score almost nothing on utilization ofthe full potential of transactional services.
The stages are not strictly additive because countries do not follow a linear path to amodel of e- government. More-over, they make a conscious choice to put out some andnot other information. They prioritize in providing some services and not others. Theyalso appear to choose not to provide some information and services on their nationalportal, but elsewhere instead. As expected, the determinants are the “willingness” of thecountry; its political ideology and commitment; economic and social systems; level ofdevelopment; financial and other resources; human and technological infrastructure; andfinally, the regulatory and administrative framework.
An interesting example was found in The former Yugoslav Republic of Macedonia.The national home page for Macedonia, http://www.gov.mk, did not open up on numer-ous attempts during the survey period, resulting in a low overall score for the country.However, the Macedonian Ministry of Finance http://www.finance.gov.mk on an indi-vidual basis rivalled many of its counterparts in the top 25. It offers good design and awealth of information and services, and could easily serve as a model for others to fol-low. The site includes almost everything one has come to expect from a good nationalgovernment site: a poll, audio-visual streaming, forms, current information and even adiscussion forum. There is also an attempt to put tenders on line. However at this pointthey are just there for informational purposes; one still has to bid in the old-fashionedway since there is no e-procurement capability - at least not yet. Considering how far theMacedonian Ministry of Finance has come, however, that might only be a question oftime. In the meantime, construction and operation of the site serves as a model practicefor other ministries within Macedonia, and certainly for other developing countries look-ing to emulate successful e-government implementation.
43
Table 4.5
E-government Stages by Income Classification
Average country Points I II III. IV. V. Total
High Income (n = 38) 7.0 52.8 39.1 4.5 7.8 111.1
Upper Middle Income (n = 35) 5.1 32.1 27.6 1.5 44. 71.2
Lower Middle Income (n = 52) 4.9 24.5 20.4 0.4 2.6 52.7
Low Income (n = 66) 3.7 10.7 10.0 0.1 1.5 26.0
Max Points 8.0 87.0 84.0 41.0 43.0 263.0
Average Points 4.9 26.7 21.8 1.3 3.6 58.5
Note: Income group: economies are divided according to 2001 GNI per capita, calculated using the World Bank Atlas method. The groups are: low income, $745 or less;lower middle income, $746 - $2,975; upper middle income, $2,976 - $9,205; and highincome, $9,206 or more. Income group categorization from The World Bank. See http://www.worldbank.org/data/countryclass/countryclass.html

IV.2 Stages of servicesdelivery by country
Table 4.6 presents a stages ofdelivery analysis for selectedcountries.
44
�
Table 4.6.
Information and Service Delivery by Stage, Selected Countries: Percentage of Category Utilization
Country I II III. IV. V. Total 1-VTop 15 countries by egovernment readiness rankings
United States 100 99 100 46 74 87
Sweden 100 89 64 20 23 60
Australia 100 92 82 32 37 71
Denmark 100 80 73 17 30 60
United Kingdom 100 93 71 39 30 68
Canada 100 87 75 32 35 67
Norway 100 80 48 17 19 51
Switzerland 88 83 65 15 30 58
Germany 100 84 63 17 37 60
Finland 100 61 71 15 26 52
Netherlands 100 78 40 0 33 47
Singapore 100 90 57 29 35 61
Republic of Korea 100 87 51 12 16 53
New Zealand 88 67 59 12 16 48
Iceland 75 43 38 0 5 29
Other selected countries
Chile 100 89 81 32 60 73
Mexico 100 90 83 34 35 70
Philippines 100 80 73 37 40 65
Estonia 100 78 75 2 16 56
Malta 88 75 51 22 14 49
Poland 88 64 55 0 35 47
South Africa 100 70 57 0 16 47
Netherlands 100 78 40 0 33 47
Bulgaria 100 70 52 0 23 47
Japan 100 83 38 0 19 46
India 100 63 64 2 5 45
Malaysia 88 52 48 27 16 42
Mauritius 88 54 55 0 5 39
Spain 100 71 33 0 0 37
Croatia 100 48 50 0 12 37
United Arab Emirates 75 39 50 22 12 37
China 100 47 32 0 0 29
Maldives 75 31 27 0 9 23
Kazakhstan 50 25 17 0 7 16
Mongolia 88 16 6 0 14 12
Armenia 88 5 17 0 16 12
Cambodia 100 13 8 0 7 11

�
Most countries score high on stages I to III,implying their e-government programmes haveadvanced from providing basic information tosubstantial relevant information in an interactivemode. Among the developed countries, the U.S.provides 100 per cent of the interactive serviceslisted in this Survey. Interestingly, Sweden,which ranked No.2 on the E-GovernmentReadiness Index, presented in an earlier section,provides only about 64 per cent of the interactiveservices, lagging behind Australia (82 per cent),Denmark (73 per cent), Canada (75 per cent),and both the U.K. and Finland at 71 per cent.
The “weakest link” for the majority of the top20 countries was in Stage IV (transactional pres-ence). This included the ability to make pay-ments on line for various services; the numberof different types of transactions that wereaccessible from the national site; whether or notany transactions/on-line payments could bemade from ministry/department sites; and theexistence of e-procurement systems/sites/sec-tions at the national site. Graphs 4.3 and 4.5present these differences graphically for select-ed developed and developing countries.
Among the 20 top rated countries, scores on the Transactional Presence measure ap-peared to be the weakest. Out of a possible score of 41 for the national site and the five mi-nistry sites, the average score for the top 20 was only 9.5. Even among the highest scoringcountries, not one received even half the available points: the U.S. scored 19, the U.K., 16,the Philippines, 15, Mexico, 14, and Chile, Australia and Canada each scored 13.
45
United States Chile Australia Mexico United Kingdom
Emerging presence Transactional presence
Networked presenceEnhanced presence
Interactive presence
100
89
81 82 83
71
92 90
93
99
74
60
37
35
30
100
46
100
100
100
100
32 32
34
39
per cent of utilization
Graph 4.3
Service delivery by stage,selected developed countries

The provision of interactive services on line (Stage III) varies by category as well. Mostcountries have begun with services requiring a standardized response, such as being ableto download tax forms, apply for a driver’s license or passport etc. The priority of othersis to make available health and education information and services to all. The U.K. isamong the top five in provision of on-line interactive services. Moreover, the U.K. hasmade commendable progress in developing and expanding social services and relatedbenefits made available to the public through e-government. The U.K. government isworking toward an interactive health website that will provide up-to-date, cross-refer-enced patient health and medical information by integrating systems within health andsocial care. The initiative is focused on ensuring that sources of medical knowledge areavailable to local clinics for decision making in support of local knowledge networks andproviders. (See Box 4.1.)
46
�
Emerging presence Transactional presence
Networked presenceEnhanced presence
Interactive presence
100
100
100
1006364
4.65100
100
5248
26.816.28
88
100
88
75
10055
36
25.584.9
6839
6.980
6436
20.930
885455
4.650
6354
2.416.28
78
6639
14.611.63
330
27.91
2.4
8338
18.61
7448
18.61
7052
0
0
0
23.26
Indonesia
Slovenia
Dominican Republic
Mauritius
Austria
Malaysia
Belgium
Portugal
India
Japan
Lithuania
Bulgaria
Graph 4.4
Service delivery by stage,selected developing countries

�
Box 4.1
U.K. interactive health website
During 2003 the U.K. government started to support the delivery of high qualityinformation to patients, health professionals and the public through the NationalKnowledge Service for Health & Social Care (NKS) initiative, which will provide up-to-date, cross-referenced information by fully integrating the development ofknowledge systems within health and social care. The National Knowledge Serviceis a partnership of organizations that provide knowledge in the health and socialcare sectors. The objectives of the NKS include: assuring the quality of patient infor-mation on a variety of diseases, conditions and treatments; greater access to infor-mation for everyone involved in the healthcare process; and wider access to infor-mation through a range of NHS public access technologies (the Internet, digital tel-evision, and call centres). The UK interactive health site can be found at http://www.nhsdirect.nhs.uk/disclaimer.asp
The knowledge gathered has been organized not only to be easily accessible tothose searching for answers, but also for incorporation into the electronic patientrecord, to prompt and remind the decision maker, and to be available through avariety of dissemination channels, such as e-mail, in urgent cases.
The cornerstones of the National Knowledge Service are: the infrastructure that willsupport the delivery of knowledge to all users within the health and social carecommunity through the Internet; digital television; call centres; and libraries. Thiscommunity includes clinicians and other professionals, researchers, academics andstudents, patients and the general public.Source: http://www.nks.nhs.uk/
An innovative and useful interactive feature is provided by Australia as part of its e-government initiative. (See Box 4.2.)
Box 4.2
Australian interactive job listing
Though it is fairly common for a country to provide some sort of job listing system,the level of sophistication and interactivity obviously differs from site to site andsome sites are better than others. However, Australia arguably has the best of themall. Not only is the information and structure excellent, but it is also a very currentsite. In fact, if one is in a hurry to find a job, Australia might be the best place tobe because new jobs are added every 20 minutes. The Australian site (http://job-search.gov.au) offers anything and everything a job seeker requires. It includescareer advice, wage information, labour-related documents, quizzes and the mostadvanced employment search system around. In fact, the search-engine is extreme-ly powerful with all sorts of advanced search techniques. The most impressive thingis the range of jobs available. With more than 30,000 jobs to search from one canfind employment in every sector, from information technology to government.
47

However, even many developed countries are not fully utilizing the potential of usinge-government for transactional services. For example, the U.S., which is the global leader,currently utilizes about 46 per cent of the possible transactional services on line. Sweden,which is second in the overall global e- readiness ranking, and Norway, which ranks sev-enth, are low on the transactional side, utilizing only about 20 per cent and 17 per cent,respectively, of the potential as surveyed here. The same is the case with Germany (17per cent), Finland (15 per cent) Republic of Korea (12 per cent) and New Zealand (12per cent). Netherlands, Japan, Poland and many other countries offer no transactionalservices.
This weakness in the transactional presence is somewhatsurprising, especially for the larger, more industrialized coun-tries in the top 20. However, the transactional presenceappeared to be the weakest section overall for just about everycountry.
One of the primary focuses of successful e-government ini-tiatives should be the country’s willingness to share informationand knowledge with the public. The Survey tries to capture thischaracteristic in stage V (networked presence). It acknowledgesthat in several instances political ideologies may determinewhat is to be public knowledge. At the same time, one wouldexpect most democracies with developed economies and par-ticipatory forms of development to score high on the interactive(stage IV) and networked (stage V) indices.
E-networking, however, remains patchy and uneven indeveloped countries with its full potential under utilized. Indeveloping countries it is low or non-existent. Whereas the U.S.is far ahead of all countries in providing a networked and inte-grated G2C service system it still can manage only about 75 percent of the possible networked services as measured by thisSurvey. Chile (60 per cent) and the Philippines (40 per cent)score the next highest and higher than all other developedcountries. As in the case of stage III (interactive services),Australia (37 per cent); Germany (37 per cent); Canada (35 percent); Singapore (35 per cent); and Mexico (35 per cent) follow.Again, Sweden (23 per cent) scores lower on stage V (net-worked presence) than all of the above.
48
�
United States
Country scores
Chile
Australia
Mexico
United Kingdom
Canada
Philippines
Singapore
Denmark
Germany
Sweden
Switzerland
Estonia
Israel
Argentina
Ireland
Italy
Republic of Korea
Finland
Norway
1. 19
13
13
14
16
13
15
12
7
7
8
6
1
8
12
8
5
6
7
0
2.
3.
4.
5.
6.
7.
8.
9.
10.
11.
12.
13.
14.
15.
16.
17.
18.
19.
20.
Graph 4.5
Transactional Presence,Top 20 E-government Ready Countries
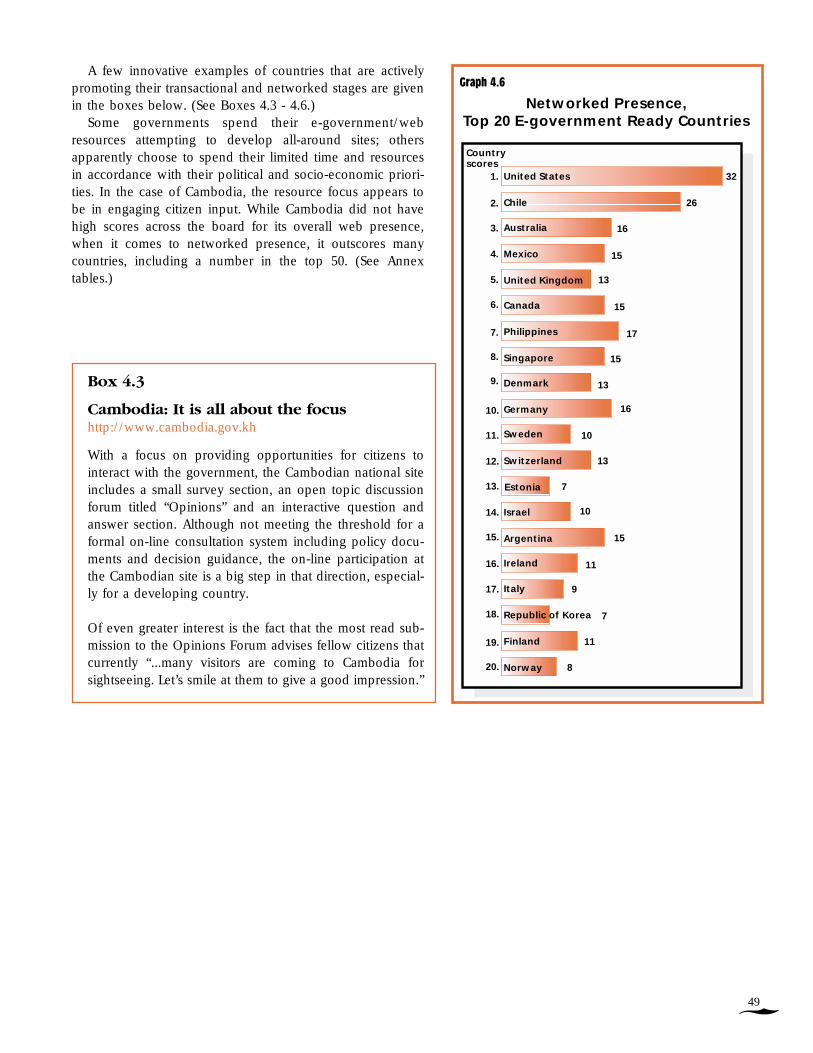
�
A few innovative examples of countries that are activelypromoting their transactional and networked stages are givenin the boxes below. (See Boxes 4.3 - 4.6.)
Some governments spend their e-government/webresources attempting to develop all-around sites; othersapparently choose to spend their limited time and resourcesin accordance with their political and socio-economic priori-ties. In the case of Cambodia, the resource focus appears tobe in engaging citizen input. While Cambodia did not havehigh scores across the board for its overall web presence,when it comes to networked presence, it outscores manycountries, including a number in the top 50. (See Annextables.)
Box 4.3
Cambodia: It is all about the focushttp://www.cambodia.gov.kh
With a focus on providing opportunities for citizens tointeract with the government, the Cambodian national siteincludes a small survey section, an open topic discussionforum titled “Opinions” and an interactive question andanswer section. Although not meeting the threshold for aformal on-line consultation system including policy docu-ments and decision guidance, the on-line participation atthe Cambodian site is a big step in that direction, especial-ly for a developing country.
Of even greater interest is the fact that the most read sub-mission to the Opinions Forum advises fellow citizens thatcurrently “...many visitors are coming to Cambodia forsightseeing. Let’s smile at them to give a good impression.”
49
United States
Country scores
Chile
Australia
Mexico
United Kingdom
Canada
Philippines
Singapore
Denmark
Germany
Sweden
Switzerland
Estonia
Israel
Argentina
Ireland
Italy
Republic of Korea
Finland
Norway
1. 32
26
16
15
13
15
15
16
17
13
10
13
7
10
11
9
7
11
8
15
2.
3.
4.
5.
6.
7.
8.
9.
10.
11.
12.
13.
14.
15.
16.
17.
18.
19.
20.
Graph 4.6
Networked Presence,Top 20 E-government Ready Countries
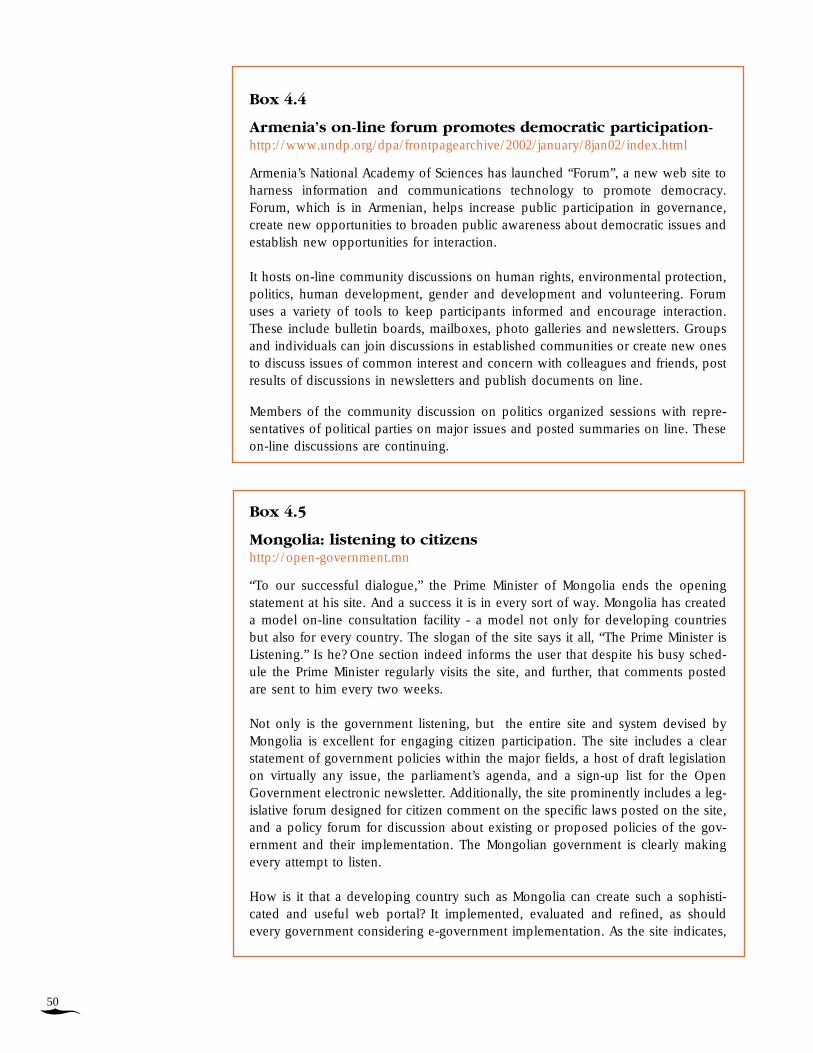
Box 4.4
Armenia’s on-line forum promotes democratic participation-http://www.undp.org/dpa/frontpagearchive/2002/january/8jan02/index.html
Armenia’s National Academy of Sciences has launched “Forum”, a new web site toharness information and communications technology to promote democracy.Forum, which is in Armenian, helps increase public participation in governance,create new opportunities to broaden public awareness about democratic issues andestablish new opportunities for interaction.
It hosts on-line community discussions on human rights, environmental protection,politics, human development, gender and development and volunteering. Forumuses a variety of tools to keep participants informed and encourage interaction.These include bulletin boards, mailboxes, photo galleries and newsletters. Groupsand individuals can join discussions in established communities or create new onesto discuss issues of common interest and concern with colleagues and friends, postresults of discussions in newsletters and publish documents on line.
Members of the community discussion on politics organized sessions with repre-sentatives of political parties on major issues and posted summaries on line. Theseon-line discussions are continuing.
Box 4.5
Mongolia: listening to citizens http://open-government.mn
“To our successful dialogue,” the Prime Minister of Mongolia ends the openingstatement at his site. And a success it is in every sort of way. Mongolia has createda model on-line consultation facility - a model not only for developing countriesbut also for every country. The slogan of the site says it all, “The Prime Minister isListening.” Is he? One section indeed informs the user that despite his busy sched-ule the Prime Minister regularly visits the site, and further, that comments postedare sent to him every two weeks.
Not only is the government listening, but the entire site and system devised byMongolia is excellent for engaging citizen participation. The site includes a clearstatement of government policies within the major fields, a host of draft legislationon virtually any issue, the parliament’s agenda, and a sign-up list for the OpenGovernment electronic newsletter. Additionally, the site prominently includes a leg-islative forum designed for citizen comment on the specific laws posted on the site,and a policy forum for discussion about existing or proposed policies of the gov-ernment and their implementation. The Mongolian government is clearly makingevery attempt to listen.
How is it that a developing country such as Mongolia can create such a sophisti-cated and useful web portal? It implemented, evaluated and refined, as shouldevery government considering e-government implementation. As the site indicates,
50
�

�
the government initially launched the site in response to a demand from investorsand businesses for input on new legislation. The government states that it learnedfrom this initial project and, seeing its broader potential, recently re-launched thesite as a full government portal aimed at servicing the general citizenry in additionto the business sector. The site is proof positive that you don’t have to be big, orrich, or a fully industrialized country to effectively implement e-government for thebenefit of citizens.
Box 4.6
Open Swedenhttp://www.oppnasverige.nu/html/www.oppnasverige.gov.se/page1/42.html
The Swedish government’s initiative, “Open Sweden”, is part of the government’sprogramme “A Government in the Service of Democracy”, which is intended tohelp ensure that the basic principles of democracy, the rule of law and efficiencyare clearly in force in the national government, and among the 150 Swedish pub-lic administrative bodies. The Open Sweden initiative is intended to provideincreased access to public information to people by increasing openness within thepublic sector; cultivate public knowledge and awareness; and encourage involve-ment and debate. The programme is targeted towards civil servants throughoutthe entire public sector. Open Sweden is a joint effort involving representativesfrom the national, county council and municipal levels.
Several reasons may account for countries’ lack of the full utilization of stage IV andstage V.
First, for many countries, completing transactions on line with e-payments requiressubstantial policy, legal and regulatory changes to allow for electronic payments by cred-it card, debit card or some other e-payment system. These systems are in the process ofbeing revised in some countries but lag behind in others.
Second, effectively implementing e-transactions often requires substantial changes ingovernment business processes. Some governments are simply not ready to make thesechanges, or are still in the process of assessing what business process changes may needto be made in order to optimize on-line transactional and payment systems.
Third, e-transactions/e-payments require a high degree of security. They also gener-ally require fairly sophisticated levels of technology that for many countries may be cost-ly and difficult to implement and operate.
Fourth, as countries continue to develop their e-government offerings, some may bemaking choices based on policy priorities. Transactions and e-payments for the publicmay not be at the top of a given country’s list of priorities.
Fifth, depending on how services are delivered within a given country, implementa-tion for on-line transactions/payments may be initially focused at the local level ratherthan at the national level.
Finally, in some cases the national sites may simply be doing an ineffective job of pre-senting, promoting, and integrating on-line transactions/e-payment programmes thatactually exist at the national level.
51

In conclusion, E-government programmes are still at early stages. They are evolvingand maturing and their vast potentials still remained untapped. Successful programmesrequire, among others factors, political willingness, financial investment and a change inthe administrative and regulatory framework in the country to support the enabling envi-ronment for e-government. For the developing countries, financial investment in e-gov-ernment could well mean diverting funds from other priority areas. On the other hand,a handful of developing countries, constrained as they are, are leading the way in theinnovative provision of services. As the analysis shows, several developing countries areat advanced stages of provision of networked services, surpassing most of the globalleaders in the sophistication of their state-sponsored digitised services to include all.
V. The Extent of E-participation
Qualitative analysis by definition is subjective. In the absence of impact assessment analy-sis, which is not the focus of this year’s Survey, qualitative assessment is a useful tool inassessing the quality and relevancy of information and services provided through e-gov-ernment initiatives.
Whereas the Survey, in its Web Measure Index, measures the gener-ic on-line availability of information and services, the e-participationscoring assesses “how relevant and useful these features were; and howwell were they deployed by the government.”
As stated in Chapter II, the E-participation Index assesses the quali-ty, relevance, usefulness and willingness of government websites forproviding on-line information and participatory tools and services topeople. The qualitative assessment is helpful in illustrating differencesin on-line strategies and approaches, illuminating nuances in seeming-ly objective or quantitative results, and providing details on the degreeto which government services and information are provided on line.This includes access to current and archived government documentsand databases, web-forums and formal on-line consultation systems,information/guidance on e-participation and a range of other features.
Table 5.1 and Graph 5.1 (below) present the E-participation Indexfor the top 20 countries. The U.K. leads with the U.S. following closebehind. It is notable that the U.K. supersedes the U.S. when ranked bye-participation, indicating a higher quality and relevancy of its informa-tion and services on the state-sponsored website.
More interestingly, Chile comes in third, Estonia, fourth, and thePhilippines in sixth position. The rankings reflect the web measureindices, which ranked Chile, the Philippines and Estonia higher thanmany developed countries. However Mexico, which ranked fourth inthe quantitative web measure assessment, slid down to the ninth posi-tion because of qualitative differences. (Gains/losses in the cases ofChile, the Philippines and Estonia are -1, +1 and +9, respectively.)Changes in rankings of the industrialized countries are equally note-worthy: United States (-1); Australia (-5); United Kingdom (+4); Canada(+3); Denmark (-6); Sweden (0); Germany (0); Switzerland (-2); Italy(+3); Ireland (+7); Finland (+3) and Norway (0). (See Annex I for allcountries.)
However, the most revealing is the pace of decrease in the relativecountry index. The index drops from 100 per cent to 50 per cent of itsvalue over the span of 15 top countries, and it drops to 25 per cent ofits value some further 20 countries down the ranking table. This means
52
�
Table 5.1
E-participation Index 2003, Top 20 Countries
Country E-participation Index
1 United Kingdom 1.000
2 United States 0.966
3 (tie) Canada 0.828
3 (tie) Chile 0.828
4 Estonia 0.759
5 New Zealand 0.690
6 Philippines 0.672
7 (tie) France 0.638
7 (tie) Netherlands 0.638
8 Australia 0.621
9 Mexico 0.603
10 (tie) Argentina 0.586
10 (tie) Ireland 0.586
10 (tie) Sweden 0.586
11 Germany 0.534
12 Republic of Korea 0.483
13 (tie) Italy 0.466
13 (tie) Singapore 0.466
14 (tie) Switzerland 0.466
15 Denmark 0.448
Note: Finland and Portugal also haveindices of 0.448.

�
that roughly 75 per cent of the countries in the world demonstrate willingness to use ICTfor e-participation at the level that is a quarter, or less, that of the United Kingdom, thelead country in this ranking.
The E-participation Index is segmented into three functional classifications: e-infor-mation, e- consultation, and e-decision making. These three are the qualitative equiva-lent of the quantitative web measure survey. Table 5.2 presents the average score of thetop 20 countries.
Table 5.2 E-participation by Functional Classification
The table indicates that with the U.K. as the comparator, on an aggregate level, thetop 20 countries are utilizing about 62 per cent of the potential in terms of relevancy andusefulness of their government websites for providing information, and a much lower 41per cent in terms of consultation with users.
As analysed in previous chapters, the countries are not doing a particularly good jobof involving the public in participatory and deliberative thought processes that wouldfeed into the government’s decision making. The top 20 countries, on average, are cur-rently providing on-line opportunities for citizen participation that are seriously lackingin relevancy and usefulness, and are at only about a third of the potential of what theycould offer.
53
Average score 12.45 16.55 8.3 37.3
Max score 20 40 24 84
Per cent of utilization
62.3 41.4 34.6 44.4
Table 5.2
E-participation by Functional Classification
Top 20 countries e-information e-consultation e-decision making total

As analysed earlier in other sections of this Survey, people-centred services, whichallow for participatory deliberative input into decision making and/or empower the citi-zen on knowledge about basic services are few and far between, even among the devel-oped countries.
54
�
United Kingdom
United States
Chile
Canada
Estonia
New Zealand
Philippines
Netherlands
France
Australia
Mexico
Sweden
Ireland
Argentina
Germany
Republic of Korea
Italy
Singapore
Switzerland
Denmark
Finland
Portugal
1
0.69
0.67
0.64
0.64
0.62
0.60
0.59
0.59
0.59
0.54
0.48
0.47
0.47
0.47
0.45
0.45
0.45
0.97
0.83
0.83
0.76
Graph 5.1
E-Participation Index,Top 22 Countries

�
Table 5.3 analyses the pres-ence of some specific on-linecharacteristics common to e-gov-ernment programmes. It indicatesthat whereas more than half of all173 countries made a web com-ment form available (a relativelyeasy and popular tool in use),only a quarter were solicitingviews through an on-line poll orallowing people to have the free-dom of an open-ended discus-sion forum.
Contrary to the current popu-lar perception, a very small pro-portion of countries (14 per cent)offered on-line consultation facil-ities and an even smaller (9 percent) allowed any user feedbackto the government on officialpolicies and activities put out onthe government websites.
There appears to be a gap between rhetoric and reality, especially in the area ofengaging the citizen in public decision making. Only 13 out of 173 countries, or eightper cent of the total, had a clear policy statement on their website encouraging peopleto participate in this process.
Participatory initiatives also appear to have a correlation with income per capita.Collectively, among the high-income countries (with GNI more than $9,206) only 66 percent were providing above average qualitative and useful services for e-participation.The upper middle-income group is doing a worse job with 57 per cent having their e-deliberative participatory services below average quality. As the analysis in the previoussections has indicated, lower and low-income countries provide very few citizen-centricparticipatory services. The relevancy and usefulness of their efforts was low as well, with88 per cent of the countries providing below average quality deliberative and participa-tory information and services to the people.
Notwithstanding, some coun-tries still are doing a better jobthan others are. The box belowgives one successful approachfor each of two countries thatare global leaders in e-govern-ment and e-participation.Box 5.1
55
Table 5.3
E-participation Aspects in National Programmes
No. of Percent countries of countries
Is there a web comment form? 99 57
Is a response timeframe indicated for submitted forms/e-mails? 12 7
Is there a calendar/directory of upcoming government events? 96 55
Is there an on-line poll/survey? 43 25
Is there a formal on-line consultation facility? 24 14
Is there an open-ended discussion forum? 45 26
Does the on-line consultation allow feedback on policies and activities? 15 9
Is there a direct/clear statement or policy encouraging citizen participation? 13 8
Table 5.4
E-participation by Income Category
Income Class Above Below By Income By IncomeMean Mean Class Class
High Income (n = 38) 25 13 66% 34%
Upper Middle Income (n = 35) 15 20 43% 57%
Lower Middle Income (n = 52) 12 40 23% 77%
Low Income (n = 66) 8 58 12% 88%
Total Countries 60 131 31% 69%
No. of No. of Above BelowCountries Countries Mean Mean
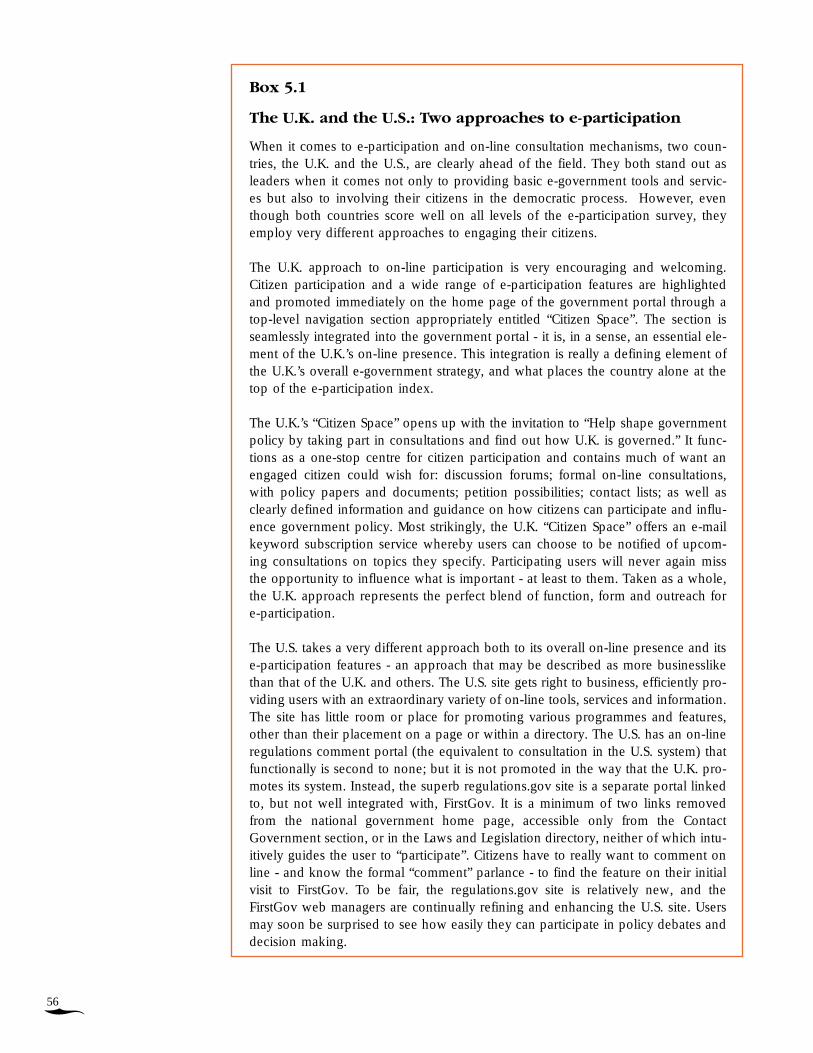
Box 5.1
The U.K. and the U.S.: Two approaches to e-participation
When it comes to e-participation and on-line consultation mechanisms, two coun-tries, the U.K. and the U.S., are clearly ahead of the field. They both stand out asleaders when it comes not only to providing basic e-government tools and servic-es but also to involving their citizens in the democratic process. However, eventhough both countries score well on all levels of the e-participation survey, theyemploy very different approaches to engaging their citizens.
The U.K. approach to on-line participation is very encouraging and welcoming.Citizen participation and a wide range of e-participation features are highlightedand promoted immediately on the home page of the government portal through atop-level navigation section appropriately entitled “Citizen Space”. The section isseamlessly integrated into the government portal - it is, in a sense, an essential ele-ment of the U.K.’s on-line presence. This integration is really a defining element ofthe U.K.’s overall e-government strategy, and what places the country alone at thetop of the e-participation index.
The U.K.’s “Citizen Space” opens up with the invitation to “Help shape governmentpolicy by taking part in consultations and find out how U.K. is governed.” It func-tions as a one-stop centre for citizen participation and contains much of want anengaged citizen could wish for: discussion forums; formal on-line consultations,with policy papers and documents; petition possibilities; contact lists; as well asclearly defined information and guidance on how citizens can participate and influ-ence government policy. Most strikingly, the U.K. “Citizen Space” offers an e-mailkeyword subscription service whereby users can choose to be notified of upcom-ing consultations on topics they specify. Participating users will never again missthe opportunity to influence what is important - at least to them. Taken as a whole,the U.K. approach represents the perfect blend of function, form and outreach fore-participation.
The U.S. takes a very different approach both to its overall on-line presence and itse-participation features - an approach that may be described as more businesslikethan that of the U.K. and others. The U.S. site gets right to business, efficiently pro-viding users with an extraordinary variety of on-line tools, services and information.The site has little room or place for promoting various programmes and features,other than their placement on a page or within a directory. The U.S. has an on-lineregulations comment portal (the equivalent to consultation in the U.S. system) thatfunctionally is second to none; but it is not promoted in the way that the U.K. pro-motes its system. Instead, the superb regulations.gov site is a separate portal linkedto, but not well integrated with, FirstGov. It is a minimum of two links removedfrom the national government home page, accessible only from the ContactGovernment section, or in the Laws and Legislation directory, neither of which intu-itively guides the user to “participate”. Citizens have to really want to comment online - and know the formal “comment” parlance - to find the feature on their initialvisit to FirstGov. To be fair, the regulations.gov site is relatively new, and theFirstGov web managers are continually refining and enhancing the U.S. site. Usersmay soon be surprised to see how easily they can participate in policy debates anddecision making.
56
�

�
Comparing the two, therefore, one can note a clear difference in philosophy.Without expressing any preference for one approach over the other, it is interest-ing to note that the U.K. spends much effort on engaging the citizen while the U.S.,which overall probably provides more services per se, takes a more relaxed, lais-sez faire approach. Even with the difference in approach, however, both govern-ments are clearly leading the way when it comes to e-participation.
57

VI. Conclusions
The data and analysis in this Survey affirm that e-government development is a functionof the combined level of economic, technological and human resource development.Important factors in successful e-government initiatives range from political and eco-nomic models to inequities of financial, human and technical capital. Since the websitesreflect countries’ willingness to share information and knowledge with the people, in sev-eral instances, political ideologies appear to determine what is to be public knowledge.
There is no one model for e-government development. At present, e-government web-sites are mushrooming around the globe in a haphazard manner. State and sectoral web-sites reflect wide variations among countries in the provision of on-line information andbasic public services.
Few countries worldwide are utilizing the full potential of e-government as a tool.Citizen participation also remains patchy and uneven in all countries, with its full poten-tial under utilized.
Despite the current focus on e-government, information and services tend to reachonly the privileged few, outside of a handful of industrialized countries.
The primary factor impeding the reach of e-government to “include all” is the lack ofinfrastructure and human capital in the developing countries. This Survey concludes thatthe possibility of the digital divide widening between the e-haves and the e-have-nots isvery real.
Since there is no standard formula for effective e-government, each country needs todevise its own e-government strategy and programme, based on its political, economicand social priorities and its financial, human and technological endowments. The imper-ative for effective e-government remains a multi-pronged approach based on ICT as wellas human and telecommunications infrastructure development. If effectively utilized, e-government can push the frontiers of development around the globe.
VII. The Promise of the Future
The United Nations looks upon the opportunity presented by the potential of e-govern-ment for socio-economic development as an historic opportunity. Proper use of infor-mation technology offers an immense potential to bridge inter- and intra-state socio-eco-nomic disparities, reduce poverty and further the goals of development worldwide.
The Digital Task Force (DOT) created by the G8 Heads of State at their Kyushu-Okinawa Summit in July 2000 “...concluded that, when wisely applied, ICT offers enor-mous opportunities to narrow social and economic inequalities and support sustainablelocal wealth creation, and thus help to achieve the broader development goals that theinternational community has set.”39
E-government is about opportunity. Opportunity for the public sector to reform toachieve greater efficiency and efficacy. Opportunity to reduce costs and increase servic-es to the society. Opportunity to include all in public service delivery. And opportunityto empower the citizens for participatory democracy.
But the greatest promise of e-government is the historic opportunity for the develop-ing countries to “leap frog” the traditionally longer development stages and catch up inproviding a higher standard of living for their populations.
The UN Survey finds that there is an urgent need to divert intellectual and financialcapital to improving the e-infrastructure and human capital base in the developing coun-tries and recommends that this be done.
It also recommends that immediate steps be taken in global government, private sec-tor and civil society partnerships to provide the resources needed to reduce the global
58
�

�
disparities in e-infrastructure so that national e-government initiatives can support anenvironment which is conducive to fulfilling the promise of “including all” in develop-ment.
The UN Survey urges the member states to undertake this “world-making” effort.
59

�
ANNEX I:
Data Tables

61
�
1 United States of America 0.927
2 Sweden 0.840
3 Australia 0.831
4 Denmark 0.820
5 United Kingdom 0.814
6 Canada 0.806
7 Norway 0.778
8 Switzerland 0.764
9 Germany 0.762
10 Finland 0.761
11 Netherlands 0.746
12 Singapore 0.746
13 Republic of Korea 0.744
14 New Zealand 0.718
15 Iceland 0.702
16 Estonia 0.697
17 Ireland 0.697
18 Japan 0.693
19 France 0.690
20 Italy 0.685
21 Austria 0.676
22 Chile 0.671
23 Belgium 0.670
24 Israel 0.663
25 Luxembourg 0.656
26 Portugal 0.646
27 Malta 0.636
28 Slovenia 0.631
29 Spain 0.602
30 Mexico 0.593
31 Argentina 0.577
32 Poland 0.576
33 Philippines 0.574
34 Lithuania 0.557
35 Bulgaria 0.548
36 Czech Republic 0.542
37 Greece 0.540
38 United Arab Emirates 0.535
39 Croatia 0.531
40 Slovakia 0.528
41 Brazil 0.527
42 Micronesia (Federated States of) 0.526
43 Malaysia 0.524
44 Hungary 0.516
45 South Africa 0.515
46 Bahrain 0.510
47 Uruguay 0.507
48 Latvia 0.506
49 Turkey 0.506
50 Romania 0.483
51 Cyprus 0.474
52 Mauritius 0.471
53 Peru 0.463
54 Ukraine 0.462
55 Brunei Darussalam 0.459
56 Thailand 0.446
57 Colombia 0.443
58 Russian Federation 0.443
59 Saint Lucia 0.438
60 Dominican Republic 0.438
61 Jamaica 0.432
62 Panama 0.432
63 Jordan 0.429
64 Bahamas 0.429
65 Trinidad and Tobago 0.427
66 Costa Rica 0.427
67 Saint Kitts and Nevis 0.426
68 Fiji 0.425
69 Lebanon 0.424
70 Indonesia 0.422
71 Belize 0.422
72 Guyana 0.422
73 Seychelles 0.420
74 China 0.416
Table 1
E-government Readiness Index 2003

�62
75 Paraguay 0.413
76 Barbados 0.413
77 Qatar 0.411
78 Bolivia 0.411
79 Maldives 0.410
80 El Salvador 0.409
81 Belarus 0.397
82 Tonga 0.391
83 Kazakhstan 0.387
84 Sri Lanka 0.385
85 Ecuador 0.378
86 Armenia 0.377
87 India 0.373
88 Cuba 0.372
89 Serbia and Montenegro 0.371
90 Kuwait 0.370
91 Algeria 0.370
92 Antigua and Barbuda 0.364
93 Venezuela 0.364
94 Azerbaijan 0.364
95 Republic of Moldova 0.363
96 The former Yugoslav
Republic of Macedonia 0.362
97 Viet Nam 0.357
98 Oman 0.355
99 Georgia 0.351
100 Grenada 0.348
101 Botswana 0.347
102 Lesotho 0.346
103 Mongolia 0.343
104 Namibia 0.340
105 Saudi Arabia 0.338
106 Turkmenistan 0.335
107 Iran (Islamic Republic of) 0.330
108 Tunisia 0.329
109 Guatemala 0.329
110 Kyrgyzstan 0.327
111 Saint Vincent and the Grenadines 0.326
112 Nicaragua 0.324
113 Cape Verde 0.322
114 Albania 0.311
115 Bosnia and Herzegovina 0.309
116 Zimbabwe 0.304
117 Samoa 0.299
118 Kenya 0.299
119 Uganda 0.296
120 Swaziland 0.295
121 Nauru 0.293
122 Solomon Islands 0.284
123 Gabon 0.283
124 Honduras 0.280
125 San Marino 0.280
126 Myanmar 0.280
127 Zambia 0.276
128 Sao Tome and Principe 0.272
129 Cameroon 0.270
130 Nepal 0.268
131 Morocco 0.265
132 Congo 0.265
133 Syrian Arab Republic 0.264
134 Cambodia 0.264
135 United Republic of Tanzania 0.253
136 Papua New Guinea 0.250
137 Pakistan 0.247
138 Rwanda 0.244
139 Ghana 0.241
140 Egypt 0.238
141 Benin 0.235
142 Malawi 0.233
143 Togo 0.231
144 Madagascar 0.229
145 Nigeria 0.225
146 Sudan 0.206
147 Senegal 0.201
148 Angola 0.192
149 Lao People’s Democratic Republic 0.192
150 Monaco 0.189
151 Yemen 0.188
152 Burundi 0.181
153 Djibouti 0.179
154 Liechtenstein 0.178
155 Comoros 0.176

63
�
156 Andorra 0.174
157 Mozambique 0.173
158 Gambia 0.172
159 Bangladesh 0.165
160 Mauritania 0.161
161 Bhutan 0.157
162 Vanuatu 0.142
163 Mali 0.140
164 Burkina Faso 0.135
165 Guinea 0.132
166 Ethiopia 0.128
167 Sierra Leone 0.126
168 Afghanistan 0.118
169 Timor-Leste 0.087
170 Niger 0.060
171 Somalia 0.049
172 Marshall Islands 0.038
173 Palau 0.009

�64
Table 2
Components of E-government Readiness Index
Web Measure Telecom Index Human Cap Index
Column 1 2 3
Weight 1/3 1/3 1/3
1 United States of America 1.000 0.801 0.98
2 Chile 0.838 0.275 0.90
3 Australia 0.812 0.691 0.99
4 Mexico 0.808 0.132 0.84
5 United Kingdom 0.777 0.675 0.99
6 Canada 0.764 0.675 0.98
7 Philippines 0.747 0.064 0.91
8 Singapore 0.703 0.666 0.87
9 Denmark 0.694 0.787 0.98
10 Sweden 0.683 0.846 0.99
11 Germany 0.683 0.632 0.97
12 Switzerland 0.668 0.682 0.94
13 Estonia 0.642 0.498 0.95
14 Israel 0.633 0.447 0.91
15 Argentina 0.624 0.187 0.92
16 Italy 0.616 0.499 0.94
17 Ireland 0.616 0.514 0.96
18 Republic of Korea 0.607 0.675 0.95
19 Finland 0.603 0.691 0.99
20 Norway 0.581 0.774 0.98
21 Brazil 0.576 0.174 0.83
22 France 0.570 0.529 0.97
23 Malta 0.568 0.460 0.88
24 Turkey 0.555 0.192 0.77
25 New Zealand 0.552 0.613 0.99
26 Poland 0.541 0.248 0.94
27 South Africa 0.539 0.126 0.88
28 Netherlands 0.539 0.710 0.99
29 Bulgaria 0.537 0.207 0.90
30 Lithuania 0.524 0.218 0.93
31 Japan 0.524 0.626 0.93
32 India 0.522 0.027 0.57
33 Portugal 0.507 0.490 0.94
34 Belgium 0.507 0.514 0.99

65
�
35 Malaysia 0.480 0.292 0.80
36 Austria 0.476 0.591 0.96
37 Mauritius 0.448 0.196 0.77
38 Dominican Republic 0.445 0.067 0.80
39 Slovenia 0.441 0.513 0.94
40 Indonesia 0.432 0.045 0.79
41 Spain 0.428 0.409 0.97
42 Croatia 0.424 0.291 0.88
43 United Arab Emirates 0.419 0.444 0.74
44 Romania 0.419 0.149 0.88
45 Jordan 0.419 0.089 0.78
46 Peru 0.408 0.111 0.87
47 Luxembourg 0.408 0.660 0.90
48 El Salvador 0.406 0.082 0.74
49 Algeria 0.384 0.036 0.69
50 Thailand 0.380 0.117 0.84
51 Slovakia 0.380 0.294 0.91
52 Jamaica 0.380 0.127 0.79
53 Bolivia 0.378 0.055 0.80
54 Colombia 0.362 0.118 0.85
55 Uruguay 0.358 0.244 0.92
56 Ukraine 0.349 0.116 0.92
57 Czech Republic 0.349 0.386 0.89
58 Panama 0.341 0.095 0.86
59 Paraguay 0.336 0.074 0.83
60 Iceland 0.336 0.809 0.96
61 China 0.332 0.116 0.80
62 Bahrain 0.332 0.347 0.85
63 Greece 0.328 0.372 0.92
64 Guatemala 0.323 0.044 0.62
65 Nepal 0.319 0.006 0.48
66 Hungary 0.312 0.307 0.93
67 Saint Lucia 0.308 0.176 0.83
68 Fiji 0.301 0.074 0.90
69 Pakistan 0.297 0.026 0.42
70 Benin 0.293 0.012 0.40
71 Nicaragua 0.288 0.033 0.65
Web Measure Telecom Index Human Cap Index
Column 1 2 3
Weight 1/3 1/3 1/3

�66
72 Serbia and Montenegro 0.284 0.134 0.694
73 Uganda 0.279 0.007 0.60
74 Sri Lanka 0.279 0.036 0.84
75 Lesotho 0.269 0.011 0.76
76 Latvia 0.266 0.321 0.93
77 Guyana 0.266 0.119 0.88
78 Brunei Darussalam 0.266 0.250 0.86
79 Timor-Leste 0.262 0.000 0.000
80 Oman 0.262 0.132 0.67
81 Maldives 0.262 0.069 0.90
82 Lebanon 0.253 0.188 0.83
83 Belize 0.253 0.153 0.86
84 Trinidad and Tobago 0.236 0.206 0.84
85 Morocco 0.236 0.061 0.50
86 Russian Federation 0.223 0.185 0.92
87 Costa Rica 0.223 0.198 0.86
88 Botswana 0.223 0.067 0.75
89 Liechtenstein 0.214 0.319 0
90 Bahamas 0.214 0.193 0.88
91 Andorra 0.214 0.309 0.000
92 Angola 0.210 0.007 0.36
93 Senegal 0.205 0.027 0.37
94 Tonga 0.201 0.051 0.920
95 San Marino 0.201 0.640 0.000
96 Seychelles 0.188 0.241 0.83
97 Kazakhstan 0.188 0.062 0.91
98 Viet Nam 0.183 0.048 0.84
99 Saudi Arabia 0.183 0.119 0.71
100 Tunisia 0.179 0.089 0.72
101 Ecuador 0.175 0.089 0.87
102 Papua New Guinea 0.170 0.031 0.55
103 Burkina Faso 0.170 0.005 0.23
104 Cuba 0.166 0.051 0.90
105 Kenya 0.157 0.021 0.72
106 Burundi 0.157 0.005 0.38
107 Namibia 0.153 0.056 0.81
108 Solomon Islands 0.148 0.022 0.68
Web Measure Telecom Index Human Cap Index
Column 1 2 3
Weight 1/3 1/3 1/3

67
�
109 Rwanda 0.148 0.003 0.58
110 Iran (Islamic Republic of) 0.148 0.090 0.75
111 Cameroon 0.148 0.012 0.65
112 Venezuela 0.144 0.117 0.83
113 Mozambique 0.144 0.004 0.37
114 Kuwait 0.144 0.226 0.74
115 United Republic of Tanzania 0.140 0.009 0.61
116 Saint Kitts and Nevis 0.140 0.248 0.89
117 Mongolia 0.140 0.040 0.85
118 Armenia 0.140 0.070 0.92
119 Qatar 0.135 0.308 0.79
120 Cape Verde 0.131 0.086 0.75
121 Bosnia and Herzegovina 0.131 0.059 0.737
122 Azerbaijan 0.131 0.080 0.88
123 Zambia 0.127 0.023 0.68
124 Monaco 0.127 0.440 0.000
125 Cambodia 0.127 0.004 0.66
126 Belarus 0.122 0.147 0.92
127 Barbados 0.122 0.206 0.91
128 Micronesia (Federated States of) 0.118 0.040 1.422
129 The former Yugoslav
Republic of Macedonia 0.114 0.111 0.860
130 Samoa 0.114 0.034 0.75
131 Cyprus 0.114 0.429 0.88
132 Gambia 0.105 0.021 0.39
133 Honduras 0.100 0.041 0.70
134 Madagascar 0.092 0.007 0.59
135 Bangladesh 0.092 0.004 0.40
136 Myanmar 0.087 0.003 0.75
137 Nigeria 0.083 0.013 0.58
138 Ghana 0.083 0.019 0.62
139 Albania 0.083 0.049 0.80
140 Afghanistan 0.083 0.002 0.268
141 Swaziland 0.079 0.037 0.77
142 Sudan 0.079 0.040 0.50
143 Marshall Islands 0.074 0.040 0.000
144 Kyrgyzstan 0.074 0.037 0.87
Web Measure Telecom Index Human Cap Index
Column 1 2 3
Weight 1/3 1/3 1/3

�68
Web Measure Telecom Index Human Cap Index
Column 1 2 3
Weight 1/3 1/3 1/3
145 Togo 0.070 0.034 0.59
146 Republic of Moldova 0.070 0.120 0.900
147 Zimbabwe 0.061 0.042 0.81
148 Mauritania 0.057 0.027 0.40
149 Vanuatu 0.052 0.023 0.35
150 Saint Vincent and the Grenadines 0.052 0.136 0.79
151 Somalia 0.048 0.002 0.096
152 Lao People’s Democratic Republic 0.048 0.007 0.52
153 Georgia 0.048 0.115 0.89
154 Yemen 0.044 0.039 0.48
155 Turkmenistan 0.044 0.042 0.92
156 Syrian Arab Republic 0.044 0.038 0.71
157 Sierra Leone 0.044 0.005 0.33
158 Mali 0.044 0.005 0.37
159 Malawi 0.044 0.005 0.65
160 Antigua and Barbuda 0.039 0.244 0.81
161 Nauru 0.035 0.035 0.810
162 Egypt 0.035 0.060 0.62
163 Congo 0.035 0.011 0.75
164 Bhutan 0.035 0.015 0.42
165 Ethiopia 0.031 0.003 0.35
166 Comoros 0.031 0.007 0.49
167 Palau 0.026 0.000 0.000
168 Guinea 0.017 0.009 0.37
169 Djibouti 0.017 0.019 0.50
170 Sao Tome and Principe 0.013 0.054 0.75
171 Niger 0.013 0.005 0.16
172 Gabon 0.013 0.077 0.76
173 Grenada 0.004 0.190 0.85
• COUNTRIES WITH NO WEB PRESENCE
174 Central African Republic 0.000 0.002 0.39
175 Chad 0.000 0.002 0.39
176 Côte d’Ivoire 0.000 0.021 0.44
177 D.P.R. Korea 0.000 0.011 0.000
178 Democratic Republic of the Congo 0.000 0.001 0.51
179 Dominica 0.000 0.190 0.86

69
�
180 Equatorial Guinea 0.000 0.013 0.77
181 Eritrea 0.000 0.007 0.46
182 Guinea-Bissau 0.000 0.004 0.38
183 Haiti 0.000 0.012 0.50
184 Iraq 0.000 0.016 0.930
185 Kiribati 0.000 0.026 0.000
186 Liberia 0.000 0.003 0.000
187 Libyan Arab Jamahiriya 0.000 0.043 0.84
188 Suriname 0.000 0.118 0.90
189 Tajikistan 0.000 0.046 0.88
190 Tuvalu 0.000 0.015 1.030
191 Uzbekistan 0.000 0.053 0.91
Web Measure Telecom Index Human Cap Index
Column 1 2 3
Weight 1/3 1/3 1/3

�70
Alphabetical
1 Afghanistan 0.083
2 Albania 0.083
3 Algeria 0.384
4 Andorra 0.214
5 Angola 0.210
6 Antigua and Barbuda 0.039
7 Argentina 0.624
8 Armenia 0.140
9 Australia 0.812
10 Austria 0.476
11 Azerbaijan 0.131
12 Bahamas 0.214
13 Bahrain 0.332
14 Bangladesh 0.092
15 Barbados 0.122
16 Belarus 0.122
17 Belgium 0.507
18 Belize 0.253
19 Benin 0.293
20 Bhutan 0.035
21 Bolivia 0.378
22 Bosnia and Herzegovina 0.131
23 Botswana 0.223
24 Brazil 0.576
25 Brunei Darussalam 0.266
26 Bulgaria 0.537
27 Burkina Faso 0.170
28 Burundi 0.157
29 Cambodia 0.127
30 Cameroon 0.148
31 Canada 0.764
32 Cape Verde 0.131
33 Central African Republic 0.000
34 Chad 0.000
35 Chile 0.838
36 China 0.332
37 Colombia 0.362
38 Comoros 0.031
39 Congo 0.035
40 Costa Rica 0.223
41 Côte d’Ivoire 0.000
42 Croatia 0.424
43 Cuba 0.166
44 Cyprus 0.114
45 Czech Republic 0.349
46 D.P.R. Korea 0.000
47 D.R. Congo 0.000
48 Denmark 0.694
49 Djibouti 0.017
50 Dominica 0.000
51 Dominican Republic 0.445
52 Ecuador 0.175
53 Egypt 0.035
54 El Salvador 0.406
55 Equatorial Guinea 0.000
56 Eritrea 0.000
57 Estonia 0.642
58 Ethiopia 0.031
59 Fiji 0.301
60 Finland 0.603
61 France 0.570
62 Gabon 0.013
63 Gambia 0.105
64 Georgia 0.048
65 Germany 0.683
66 Ghana 0.083
67 Greece 0.328
68 Grenada 0.004
69 Guatemala 0.323
70 Guinea 0.017
71 Guinea-Bissau 0.000
72 Guyana 0.266
73 Haiti 0.000
74 Honduras 0.100
75 Hungary 0.312
Table 3
Web Measure Index

71
�
76 Iceland 0.336
77 India 0.522
78 Indonesia 0.432
79 Iran (Islamic Republic of) 0.148
80 Iraq 0.000
81 Ireland 0.616
82 Israel 0.633
83 Italy 0.616
84 Jamaica 0.380
85 Japan 0.524
86 Jordan 0.419
87 Kazakhstan 0.188
88 Kenya 0.157
89 Kiribati 0.000
90 Kuwait 0.144
91 Kyrgyzstan 0.074
92 Lao People’s Democratic Republic 0.048
93 Latvia 0.266
94 Lebanon 0.253
95 Lesotho 0.269
96 Liberia 0.000
97 Libyan Arab Jamahiriya 0.000
98 Liechtenstein 0.214
99 Lithuania 0.524
100 Luxembourg 0.408
101 Madagascar 0.092
102 Malawi 0.044
103 Malaysia 0.480
104 Maldives 0.262
105 Mali 0.044
106 Malta 0.568
107 Marshall Islands 0.074
108 Mauritania 0.057
109 Mauritius 0.448
110 Mexico 0.808
111 Micronesia (Federated States of) 0.118
112 Monaco 0.127
113 Mongolia 0.140
114 Morocco 0.236
115 Mozambique 0.144
116 Myanmar 0.087
117 Namibia 0.153
118 Nauru 0.035
119 Nepal 0.319
120 Netherlands 0.539
121 New Zealand 0.552
122 Nicaragua 0.288
123 Niger 0.013
124 Nigeria 0.083
125 Norway 0.581
126 Oman 0.262
127 Pakistan 0.297
128 Palau 0.026
129 Panama 0.341
130 Papua New Guinea 0.170
131 Paraguay 0.336
132 Peru 0.408
133 Philippines 0.747
134 Poland 0.541
135 Portugal 0.507
136 Qatar 0.135
137 Republic of Korea 0.607
138 Republic of Moldova 0.070
139 Romania 0.419
140 Russian Federation 0.223
141 Rwanda 0.148
142 Saint Kitts and Nevis 0.140
143 Saint Lucia 0.308
144 Saint Vincent and the Grenadines 0.052
145 Samoa 0.114
146 San Marino 0.201
147 Sao Tome and Principe 0.013
148 Saudi Arabia 0.183
149 Senegal 0.205
150 Serbia and Montenegro 0.284
151 Seychelles 0.188
152 Sierra Leone 0.044
153 Singapore 0.703
154 Slovakia 0.380
155 Slovenia 0.441
156 Solomon Islands 0.148
157 Somalia 0.048

�72
158 South Africa 0.539
159 Spain 0.428
160 Sri Lanka 0.279
161 Sudan 0.079
162 Suriname 0.000
163 Swaziland 0.079
164 Sweden 0.683
165 Switzerland 0.668
166 Syrian Arab Republic 0.044
167 Tajikistan 0.000
168 Thailand 0.380
169 The former Yugoslav
Republic of Macedonia 0.114
170 Timor-Leste 0.262
171 Togo 0.070
172 Tonga 0.201
173 Trinidad and Tobago 0.236
174 Tunisia 0.179
175 Turkey 0.555
176 Turkmenistan 0.044
177 Tuvalu 0.000
178 Uganda 0.279
179 Ukraine 0.349
180 United Arab Emirates 0.419
181 United Kingdom 0.777
182 United Republic of Tanzania 0.140
183 United States of America 1.000
184 Uruguay 0.358
185 Uzbekistan 0.000
186 Vanuatu 0.052
187 Venezuela 0.144
188 Viet Nam 0.183
189 Yemen 0.044
190 Zambia 0.127
191 Zimbabwe 0.061

73
�
1 Afghanistan 0 0 0.000 0.000
2 Albania 8 0.011 2.519 0.004
3 Algeria a) 7.1 0.009 15.978 0.026
4 Andorra a) b) 0 0.000 89.744 0.148
5 Angola b) 2 0.003 2.942 0.005
6 Antigua & Barbuda a) b) 0 0.000 90.409 0.149
7 Argentina 82 0.108 112.022 0.184
8 Armenia a) 9.2 0.012 18.412 0.030
9 Australia 515.8 0.679 427.203 0.703
10 Austria a) 335.4 0.441 409.364 0.674
11 Azerbaijan 0 0.000 36.823 0.061
12 Bahamas b) 0 0.000 67.974 0.112
13 Bahrain 160.4 0.211 247.466 0.407
14 Bangladesh 3.4 0.004 1.532 0.003
15 Barbados a) b) 93.2 0.123 55.908 0.092
16 Belarus 0 0.000 81.584 0.134
17 Belgium 241.6 0.318 328.629 0.541
18 Belize b) 138.3 0.182 86.957 0.143
19 Benin a) 1.7 0.002 3.878 0.006
20 Bhutan b) 14.5 0.019 14.475 0.024
21 Bolivia 22.8 0.030 21.754 0.036
22 Bosnia & Herzogovina 0 0.000 24.390 0.040
23 Botswana a) 38.7 0.051 29.747 0.049
24 Brazil 74.8 0.098 82.241 0.135
25 Brunei Darussalam a) b) 73.1 0.096 102.339 0.168
26 Bulgaria 34.6 0.046 74.627 0.123
27 Burkina Faso a) 1.5 0.002 1.628 0.003
28 Burundi a) 0 0.000 0.875 0.001
29 Cambodia a) 1.5 0.002 2.176 0.004
30 Cameroon a) 3.9 0.005 2.919 0.005
31 Canada 487 0.641 483.861 0.796
32 Cape Verde 79.7 0.105 36.446 0.060
33 Central African Rep. a) 1.9 0.003 0.793 0.001
34 Chad 1.6 0.002 0.522 0.001
35 Chile 119.3 0.157 201.415 0.331
Table 4
Telecommunication indicators 2003 — I
Country PCs PC Internet Internet
per 1000 pers Index per 1000 pers Index
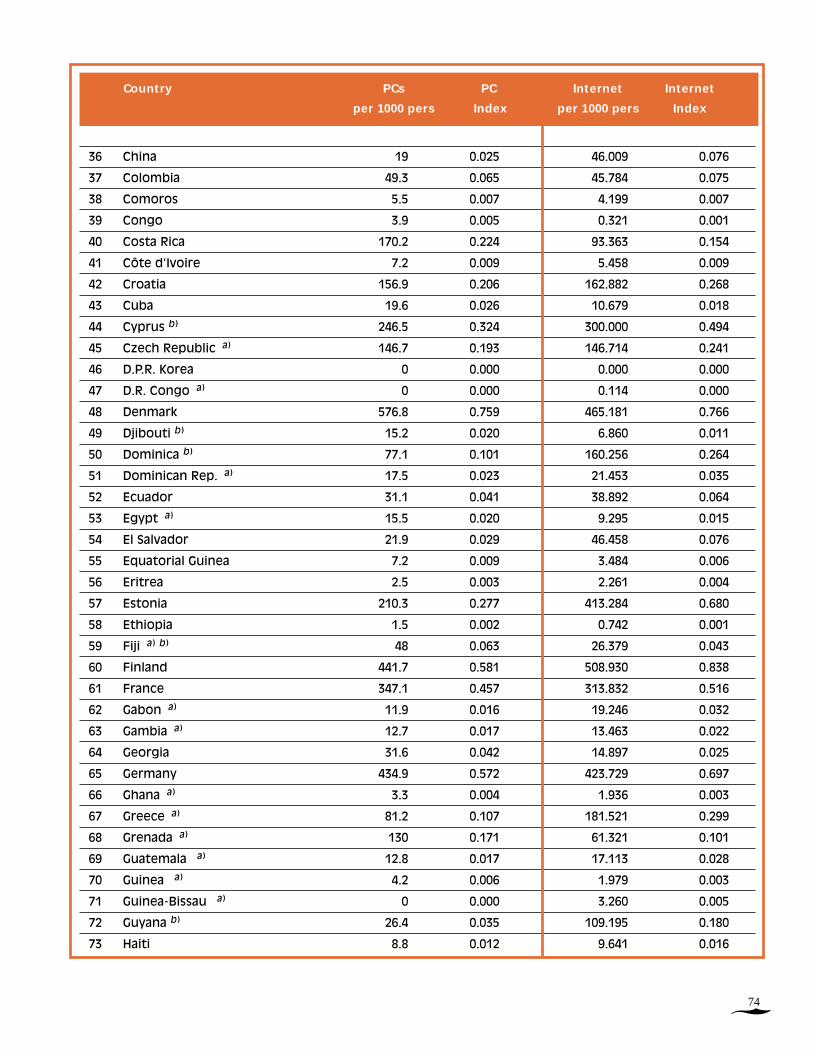
�74
36 China 19 0.025 46.009 0.076
37 Colombia 49.3 0.065 45.784 0.075
38 Comoros 5.5 0.007 4.199 0.007
39 Congo 3.9 0.005 0.321 0.001
40 Costa Rica 170.2 0.224 93.363 0.154
41 Côte d’Ivoire 7.2 0.009 5.458 0.009
42 Croatia 156.9 0.206 162.882 0.268
43 Cuba 19.6 0.026 10.679 0.018
44 Cyprus b) 246.5 0.324 300.000 0.494
45 Czech Republic a) 146.7 0.193 146.714 0.241
46 D.P.R. Korea 0 0.000 0.000 0.000
47 D.R. Congo a) 0 0.000 0.114 0.000
48 Denmark 576.8 0.759 465.181 0.766
49 Djibouti b) 15.2 0.020 6.860 0.011
50 Dominica b) 77.1 0.101 160.256 0.264
51 Dominican Rep. a) 17.5 0.023 21.453 0.035
52 Ecuador 31.1 0.041 38.892 0.064
53 Egypt a) 15.5 0.020 9.295 0.015
54 El Salvador 21.9 0.029 46.458 0.076
55 Equatorial Guinea 7.2 0.009 3.484 0.006
56 Eritrea 2.5 0.003 2.261 0.004
57 Estonia 210.3 0.277 413.284 0.680
58 Ethiopia 1.5 0.002 0.742 0.001
59 Fiji a) b) 48 0.063 26.379 0.043
60 Finland 441.7 0.581 508.930 0.838
61 France 347.1 0.457 313.832 0.516
62 Gabon a) 11.9 0.016 19.246 0.032
63 Gambia a) 12.7 0.017 13.463 0.022
64 Georgia 31.6 0.042 14.897 0.025
65 Germany 434.9 0.572 423.729 0.697
66 Ghana a) 3.3 0.004 1.936 0.003
67 Greece a) 81.2 0.107 181.521 0.299
68 Grenada a) 130 0.171 61.321 0.101
69 Guatemala a) 12.8 0.017 17.113 0.028
70 Guinea a) 4.2 0.006 1.979 0.003
71 Guinea-Bissau a) 0 0.000 3.260 0.005
72 Guyana b) 26.4 0.035 109.195 0.180
73 Haiti 8.8 0.012 9.641 0.016
Country PCs PC Internet Internet
per 1000 pers Index per 1000 pers Index

75
�
74 Honduras 12.2 0.016 29.797 0.049
75 Hungary 108.4 0.143 157.604 0.259
76 Iceland a) b) 451.4 0.594 607.639 1.000
77 India 5.8 0.008 15.914 0.026
78 Indonesia 11 0.014 19.123 0.031
79 Iran (I.R.) 69.7 0.092 15.557 0.026
80 Iraq 0 0.000 0.000 0.000
81 Ireland a) 390.7 0.514 270.923 0.446
82 Israel 245.9 0.324 301.405 0.496
83 Italy 194.8 0.256 301.077 0.495
84 Jamaica a) 50 0.066 38.471 0.063
85 Japan a) 382.5 0.503 449.262 0.739
86 Jordan 32.8 0.043 45.156 0.074
87 Kazakhstan a) 0 0.000 9.320 0.015
88 Kenya 5.6 0.007 15.978 0.026
89 Kiribati a) b) 10.5 0.014 23.224 0.038
90 Kuwait a) 119.6 0.157 87.913 0.145
91 Kyrgyzstan 12.7 0.017 29.833 0.049
92 Lao P.D.R. 3.3 0.004 2.711 0.004
93 Latvia 171.7 0.226 133.104 0.219
94 Lebanon 80.5 0.106 117.130 0.193
95 Lesotho 0 0.000 2.315 0.004
96 Liberia 0 0.000 0.000 0.000
97 Libya a) 3.5 0.005 3.584 0.006
98 Liechtenstein 0 0.000 585.000 0.963
99 Lithuania 70.6 0.093 67.916 0.112
100 Luxembourg a) b) 517.3 0.681 367.483 0.605
101 Madagascar a) 2.6 0.003 2.259 0.004
102 Malawi 1.3 0.002 2.587 0.004
103 Malaysia a) 126.1 0.166 273.109 0.449
104 Maldives b) 35.8 0.047 53.763 0.088
105 Mali a) 1.3 0.002 2.885 0.005
106 Malta b) 229.6 0.302 252.551 0.416
107 Marshall Islands a) 53 0.070 16.488 0.027
108 Mauritania 10.3 0.014 3.728 0.006
109 Mauritius 108.3 0.143 148.700 0.245
110 Mexico 68.7 0.090 45.774 0.075
111 Micronesia a) b) 0 0.000 42.997 0.071
Country PCs PC Internet Internet
per 1000 pers Index per 1000 pers Index

�76
112 Monaco b) 0 0.000 466.000 0.767
113 Mongolia a) 14.6 0.019 16.660 0.027
114 Morocco 13.7 0.018 16.867 0.028
115 Mozambique a) 4 0.005 1.699 0.003
116 Myanmar a) 1.1 0.001 0.207 0.000
117 Namibia a) 54.7 0.072 24.633 0.041
118 Nauru 0 0.000 0.000 0.000
119 Nepal 3.5 0.005 2.639 0.004
120 Netherlands a) 428.4 0.564 530.411 0.873
121 New Zealand 392.6 0.517 484.375 0.797
122 Nicaragua 27.9 0.037 16.760 0.028
123 Niger a) 0.5 0.001 1.069 0.002
124 Nigeria 6.8 0.009 1.666 0.003
125 Norway 508 0.668 504.829 0.831
126 Oman a) 32.4 0.043 45.749 0.075
127 Pakistan 4.1 0.005 3.449 0.006
128 Palau 0 0.000 0.000 0.000
129 Panama a) 37.9 0.050 41.394 0.068
130 Papua New Guinea 56.7 0.075 9.444 0.016
131 Paraguay 14.2 0.019 17.295 0.028
132 Peru a) 47.9 0.063 76.649 0.126
133 Philippines 21.7 0.029 25.569 0.042
134 Poland a) 85.4 0.112 98.372 0.162
135 Portugal 117.4 0.154 355.462 0.585
136 Qatar b) 180.3 0.237 82.787 0.136
137 Republic of Korea 555.8 0.731 551.891 0.908
138 Republic of Moldovia 16 0.021 140.000 0.230
139 Romania a) 35.7 0.047 80.609 0.133
140 Russia 88.7 0.117 40.932 0.067
141 Rwanda a) c ) 0 0.000 2.516 0.004
142 St. Kitts and Nevis b) 191.5 0.252 106.383 0.175
143 St. Lucia b) 146 0.192 82.000 0.135
144 St. Vincent & the Grenadines a) b) 113 0.149 47.826 0.079
145 Samoa b) 6.2 0.008 22.222 0.037
146 San Marino b) 760 1.000 531.000 0.874
147 S. Tomé & Principe a) b) 0 0.000 60.000 0.099
148 Saudi Arabia a) 62.7 0.083 69.384 0.114
149 Senegal 20.4 0.027 10.712 0.018
Country PCs PC Internet Internet
per 1000 pers Index per 1000 pers Index
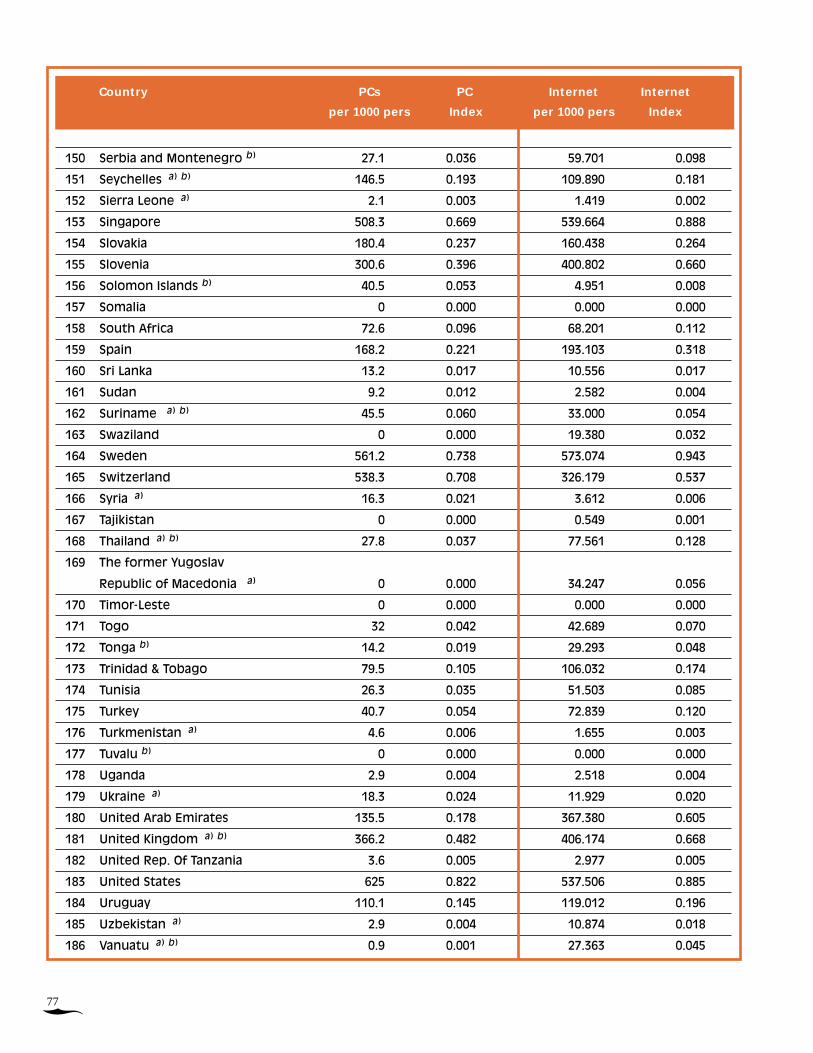
77
�
150 Serbia and Montenegro b) 27.1 0.036 59.701 0.098
151 Seychelles a) b) 146.5 0.193 109.890 0.181
152 Sierra Leone a) 2.1 0.003 1.419 0.002
153 Singapore 508.3 0.669 539.664 0.888
154 Slovakia 180.4 0.237 160.438 0.264
155 Slovenia 300.6 0.396 400.802 0.660
156 Solomon Islands b) 40.5 0.053 4.951 0.008
157 Somalia 0 0.000 0.000 0.000
158 South Africa 72.6 0.096 68.201 0.112
159 Spain 168.2 0.221 193.103 0.318
160 Sri Lanka 13.2 0.017 10.556 0.017
161 Sudan 9.2 0.012 2.582 0.004
162 Suriname a) b) 45.5 0.060 33.000 0.054
163 Swaziland 0 0.000 19.380 0.032
164 Sweden 561.2 0.738 573.074 0.943
165 Switzerland 538.3 0.708 326.179 0.537
166 Syria a) 16.3 0.021 3.612 0.006
167 Tajikistan 0 0.000 0.549 0.001
168 Thailand a) b) 27.8 0.037 77.561 0.128
169 The former Yugoslav
Republic of Macedonia a) 0 0.000 34.247 0.056
170 Timor-Leste 0 0.000 0.000 0.000
171 Togo 32 0.042 42.689 0.070
172 Tonga b) 14.2 0.019 29.293 0.048
173 Trinidad & Tobago 79.5 0.105 106.032 0.174
174 Tunisia 26.3 0.035 51.503 0.085
175 Turkey 40.7 0.054 72.839 0.120
176 Turkmenistan a) 4.6 0.006 1.655 0.003
177 Tuvalu b) 0 0.000 0.000 0.000
178 Uganda 2.9 0.004 2.518 0.004
179 Ukraine a) 18.3 0.024 11.929 0.020
180 United Arab Emirates 135.5 0.178 367.380 0.605
181 United Kingdom a) b) 366.2 0.482 406.174 0.668
182 United Rep. Of Tanzania 3.6 0.005 2.977 0.005
183 United States 625 0.822 537.506 0.885
184 Uruguay 110.1 0.145 119.012 0.196
185 Uzbekistan a) 2.9 0.004 10.874 0.018
186 Vanuatu a) b) 0.9 0.001 27.363 0.045
Country PCs PC Internet Internet
per 1000 pers Index per 1000 pers Index
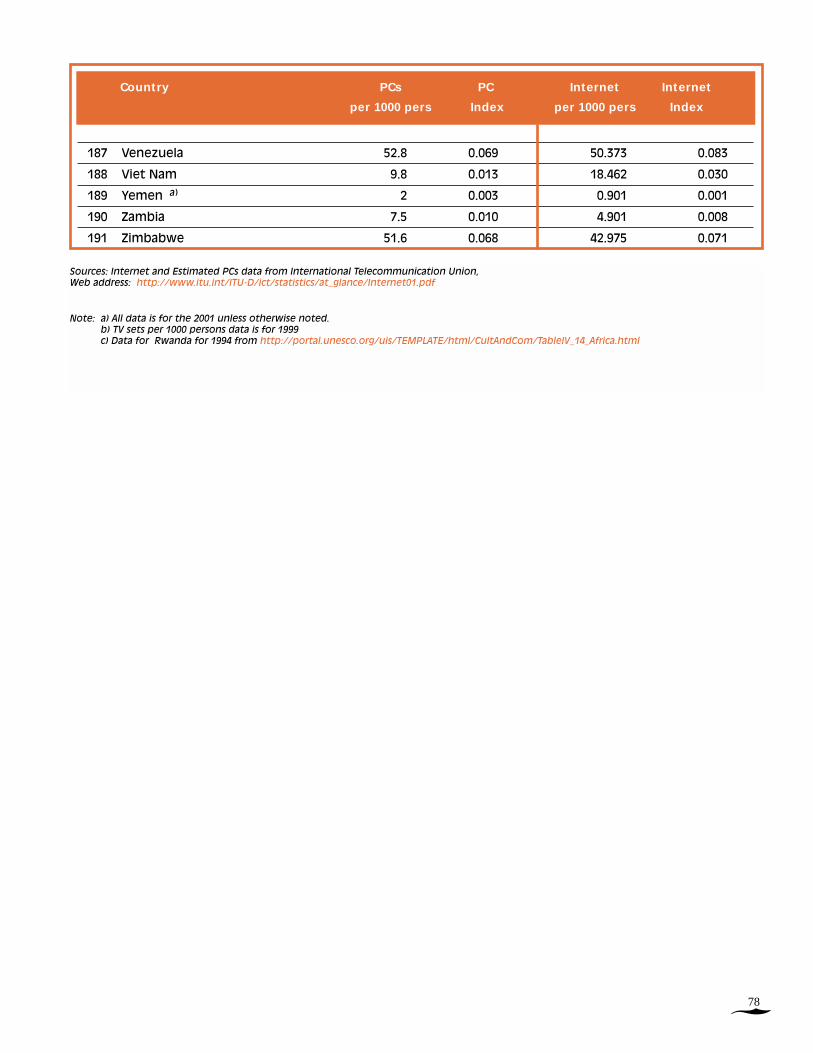
�78
187 Venezuela 52.8 0.069 50.373 0.083
188 Viet Nam 9.8 0.013 18.462 0.030
189 Yemen a) 2 0.003 0.901 0.001
190 Zambia 7.5 0.010 4.901 0.008
191 Zimbabwe 51.6 0.068 42.975 0.071
Country PCs PC Internet Internet
per 1000 pers Index per 1000 pers Index
Sources: Internet and Estimated PCs data from International Telecommunication Union, Web address: http://www.itu.int/ITU-D/ict/statistics/at_glance/Internet01.pdf
Note: a) All data is for the 2001 unless otherwise noted.b) TV sets per 1000 persons data is for 1999c) Data for Rwanda for 1994 from http://portal.unesco.org/uis/TEMPLATE/html/CultAndCom/TableIV_14_Africa.html

79
�
1 Afghanistan 0 0.000 0 0.000
2 Albania 3.4 0.005 54.6 0.059
3 Algeria a) 5.7 0.008 61 0.066
4 Andorra a) b) 362.6 0.519 438.3 0.476
5 Angola b) 5.7 0.008 6.1 0.007
6 Antigua & Barbuda a) b) 75.2 0.108 481.3 0.523
7 Argentina 103.8 0.148 218.8 0.238
8 Armenia a) 9 0.013 139.8 0.152
9 Australia 524.9 0.751 538.6 0.585
10 Austria a) 434.5 0.622 468.1 0.508
11 Azerbaijan 3.2 0.005 121.4 0.132
12 Bahamas b) 56.2 0.080 405.6 0.440
13 Bahrain 213.6 0.306 263.1 0.286
14 Bangladesh 1.1 0.002 5.1 0.006
15 Barbados a) b) 21.9 0.031 480.6 0.522
16 Belarus 40.8 0.058 299.4 0.325
17 Belgium 331.4 0.474 496.1 0.539
18 Belize b) 68.4 0.098 125.1 0.136
19 Benin a) 3.7 0.005 9.2 0.010
20 Bhutan b) 0.2 0.000 28.4 0.031
21 Bolivia 9.8 0.014 67.6 0.073
22 Bosnia & Herzogovina 11.4 0.016 119.6 0.130
23 Botswana a) 7.6 0.011 84.8 0.092
24 Brazil 68.4 0.098 223.2 0.242
25 Brunei Darussalam a) b) 99.7 0.143 258.6 0.281
26 Bulgaria 75.9 0.109 374.6 0.407
27 Burkina Faso a) 2 0.003 4.9 0.005
28 Burundi a) 0.9 0.001 2.9 0.003
29 Cambodia a) 0.8 0.001 2.5 0.003
30 Cameroon a) 2.8 0.004 6.6 0.007
31 Canada 457.1 0.654 635.5 0.690
32 Cape Verde 29.4 0.042 159.9 0.174
33 Central African Rep. a) 0.5 0.001 2.4 0.003
34 Chad 0.4 0.001 1.4 0.002
35 Chile 200.2 0.286 230.4 0.250
Table 5
Telecommunication indicators 2003 — II
Country Persons on line Tel lines per
Alphabetically per 1000 pers Index 1000 persons Index

�80
36 China 35.8 0.051 166.9 0.181
37 Colombia 28.1 0.040 179.4 0.195
38 Comoros 4.1 0.006 13.5 0.015
39 Congo 0.1 0.000 6.7 0.007
40 Costa Rica 100.1 0.143 250.5 0.272
41 Côte d’Ivoire 1.3 0.002 20.4 0.022
42 Croatia 110.7 0.158 387.9 0.421
43 Cuba 10.7 0.015 51.1 0.055
44 Cyprus b) 195.5 0.280 610.6 0.663
45 Czech Republic a) 262.1 0.375 377.6 0.410
46 D.P.R. Korea 0 0.000 21 0.023
47 D.R. Congo a) 0 0.000 0.4 0.000
48 Denmark 547.4 0.783 695.8 0.755
49 Djibouti b) 7 0.010 15.4 0.017
50 Dominica b) 28 0.040 325.8 0.354
51 Dominican Rep. a) 21.3 0.030 110.2 0.120
52 Ecuador 24.4 0.035 110.2 0.120
53 Egypt a) 8.5 0.012 103.6 0.112
54 El Salvador 6.5 0.009 103.4 0.112
55 Equatorial Guinea 2.2 0.003 18 0.020
56 Eritrea 2.2 0.003 9 0.010
57 Estonia 347 0.496 350.6 0.381
58 Ethiopia 0.2 0.000 5.5 0.006
59 Fiji a) b) 17.5 0.025 112.3 0.122
60 Finland 439.3 0.628 547.3 0.594
61 France 262.8 0.376 568.9 0.618
62 Gabon a) 12.4 0.018 29.5 0.032
63 Gambia a) 12.4 0.018 26.2 0.028
64 Georgia 32.3 0.046 131.4 0.143
65 Germany 344.9 0.493 650.4 0.706
66 Ghana a) 2 0.003 11.6 0.013
67 Greece a) 131.5 0.188 529.2 0.575
68 Grenada b) 58.3 0.083 316.5 0.344
69 Guatemala a) 15 0.021 64.7 0.070
70 Guinea a) 1.9 0.003 3.4 0.004
71 Guinea-Bissau a) 3 0.004 9.8 0.011
72 Guyana b) 136.1 0.195 91.5 0.099
73 Haiti 4.2 0.006 15.7 0.017
Country Persons on line Tel lines per
Alphabetically per 1000 pers Index 1000 persons Index

81
�
74 Honduras 6.4 0.009 48 0.052
75 Hungary 118.7 0.170 361.2 0.392
76 Iceland a) b) 698 0.999 663.9 0.721
77 India 6.7 0.010 39.8 0.043
78 Indonesia 19.3 0.028 36 0.039
79 Iran (I.R.) 6.3 0.009 199.5 0.217
80 Iraq 0 0.000 29 0.031
81 Ireland a) 337.2 0.482 484.5 0.526
82 Israel 171.2 0.245 467.2 0.507
83 Italy 333.7 0.477 486.2 0.528
84 Jamaica a) 37.3 0.053 204.7 0.222
85 Japan a) 372 0.532 585.8 0.636
86 Jordan 39.9 0.057 127.6 0.139
87 Kazakhstan a) 6 0.009 120.5 0.131
88 Kenya 16.1 0.023 10.3 0.011
89 Kiribati a) b) 10.9 0.016 42.1 0.046
90 Kuwait a) 94.7 0.135 207.7 0.226
91 Kyrgyzstan 2.1 0.003 77.5 0.084
92 Lao P.D.R. 1.7 0.002 11.2 0.012
93 Latvia 130.8 0.187 301.1 0.327
94 Lebanon 83.8 0.120 198.8 0.216
95 Lesotho 2.3 0.003 15.7 0.017
96 Liberia 0 0.000 2 0.002
97 Libya a) 2.4 0.003 109.3 0.119
98 Liechtenstein 0 0.000 583 0.633
99 Lithuania 82.3 0.118 270.5 0.294
100 Luxembourg a) b) 228.6 0.327 779.9 0.847
101 Madagascar a) 2.1 0.003 3.8 0.004
102 Malawi 3.3 0.005 7 0.008
103 Malaysia a) 251.5 0.360 197.9 0.215
104 Maldives b) 0.6 0.001 102.7 0.112
105 Mali a) 2.6 0.004 4.8 0.005
106 Malta b) 249.1 0.356 523.4 0.568
107 Marshall Islands a) 12.2 0.017 76.7 0.083
108 Mauritania 2.5 0.004 11.9 0.013
109 Mauritius 1.3 0.002 270.3 0.293
110 Mexico 33.8 0.048 146.7 0.159
111 Micronesia a) b) 15 0.021 86.7 0.094
Country Persons on line Tel lines per
Alphabetically per 1000 pers Index 1000 persons Index

�82
112 Monaco b) 0 0.000 921 1.000
113 Mongolia a) 14.8 0.021 51.8 0.056
114 Morocco 12.8 0.018 38 0.041
115 Mozambique a) 0.8 0.001 5.1 0.006
116 Myanmar a) 0.2 0.000 6.1 0.007
117 Namibia a) 24.7 0.035 64.3 0.070
118 Nauru 0 0.000 160 0.174
119 Nepal 2.3 0.003 14.1 0.015
120 Netherlands a) 542.5 0.776 621.1 0.674
121 New Zealand 460.6 0.659 448.1 0.487
122 Nicaragua 4.2 0.006 32 0.035
123 Niger a) 1.1 0.002 1.9 0.002
124 Nigeria 0.8 0.001 5.8 0.006
125 Norway 544 0.778 729.8 0.792
126 Oman a) 44.2 0.063 89.7 0.097
127 Pakistan 8.5 0.012 24.8 0.027
128 Palau 0 0.000 0 0.000
129 Panama a) 16 0.023 129.9 0.141
130 Papua New Guinea 27.4 0.039 11.7 0.013
131 Paraguay 3.6 0.005 47.3 0.051
132 Peru a) 107.3 0.154 77.5 0.084
133 Philippines 24.6 0.035 41.7 0.045
134 Poland a) 165.7 0.237 295.1 0.320
135 Portugal 343.7 0.492 419 0.455
136 Qatar b) 97.5 0.139 289.4 0.314
137 Republic of Korea 464 0.664 488.6 0.531
138 Republic of Moldovia 3.4 0.005 146 0.159
139 Romania a) 44.8 0.064 183.8 0.200
140 Russia 124.2 0.178 242.2 0.263
141 Rwanda a) c ) 2.7 0.004 2.7 0.003
142 St. Kitts and Nevis b) 51.5 0.074 500 0.543
143 St. Lucia b) 0 0.000 317 0.344
144 St. Vincent & the Grenadines a) b) 30.3 0.043 226.8 0.246
145 Samoa b) 16.8 0.024 57 0.062
146 San Marino b) 0 0.000 763 0.828
147 S. Tomé & Principe a) b) 0 0.000 36.3 0.039
148 Saudi Arabia a) 25 0.036 144.8 0.157
149 Senegal 9.4 0.013 22.9 0.025
Country Persons on line Tel lines per
Alphabetically per 1000 pers Index 1000 persons Index

83
�
150 Serbia and Montenegro b) 0 0.000 232.6 0.253
151 Seychelles a) b) 112.4 0.161 261.1 0.283
152 Sierra Leone a) 3.8 0.005 4.6 0.005
153 Singapore 493 0.705 463.6 0.503
154 Slovakia 129.4 0.185 260.8 0.283
155 Slovenia 311.3 0.445 406.5 0.441
156 Solomon Islands b) 17 0.024 14.9 0.016
157 Somalia 0 0.000 3 0.003
158 South Africa 70.3 0.101 107.7 0.117
159 Spain 184.3 0.264 459.8 0.499
160 Sri Lanka 6.3 0.009 46.6 0.051
161 Sudan 1.5 0.002 20.6 0.022
162 Suriname a) b) 33.2 0.047 175.8 0.191
163 Swaziland 12.5 0.018 34 0.037
164 Sweden 699 1.000 720.2 0.782
165 Switzerland 468.2 0.670 732.7 0.796
166 Syria a) 3.5 0.005 103 0.112
167 Tajikistan 0.3 0.000 36.5 0.040
168 Thailand a) b) 19.6 0.028 98.7 0.107
169 The former Yugoslav
Republic of Macedonia a) 0 0.000 263.5 0.286
170 Timor-Leste 0 0.000 0 0.000
171 Togo 9.5 0.014 10.9 0.012
172 Tonga b) 9.8 0.014 113.1 0.123
173 Trinidad & Tobago 103.1 0.147 249.8 0.271
174 Tunisia 40.8 0.058 122.3 0.133
175 Turkey 37.1 0.053 281.2 0.305
176 Turkmenistan a) 0.4 0.001 80.2 0.087
177 Tuvalu b) 0 0.000 65 0.071
178 Uganda 2.4 0.003 2.2 0.002
179 Ukraine a) 15.4 0.022 212.1 0.230
180 United Arab Emirates 367.9 0.526 341.8 0.371
181 United Kingdom a) b) 553.2 0.791 587.4 0.638
182 United Rep. Of Tanzania 8.1 0.012 4.4 0.005
183 United States 597.5 0.855 658.9 0.715
184 Uruguay 136.1 0.195 279.6 0.304
185 Uzbekistan a) 5.9 0.008 66.6 0.072
186 Vanuatu a) b) 15.8 0.023 33.6 0.036
Country Persons on line Tel lines per
Alphabetically per 1000 pers Index 1000 persons Index

�84
187 Venezuela 53.5 0.077 112.3 0.122
188 Viet Nam 4.9 0.007 68.5 0.074
189 Yemen a) 0.9 0.001 22.4 0.024
190 Zambia 2.5 0.004 8.3 0.009
191 Zimbabwe 8.8 0.013 24.7 0.027
Country Persons o nline Tel lines per
Alphabetically per 1000 pers Index 1000 persons Index
Sources: Percentage of Pop. On line Web address: http://www.nua.com/surveys/how_many_online/africa.html
Telephone data from International Telecommunication Union, Web address: http://www.itu.int/ITU-D/ict/statistics/at_glance/main01.pdf
Note: a) All data is for the 2001 unless otherwise noted.
Note: b) TV sets per 1000 persons data is for 1999
c) Data for Rwanda for 1994 fromhttp://portal.unesco.org/uis/TEMPLATE/html/CultAndCom/TableIV_14_Africa.html
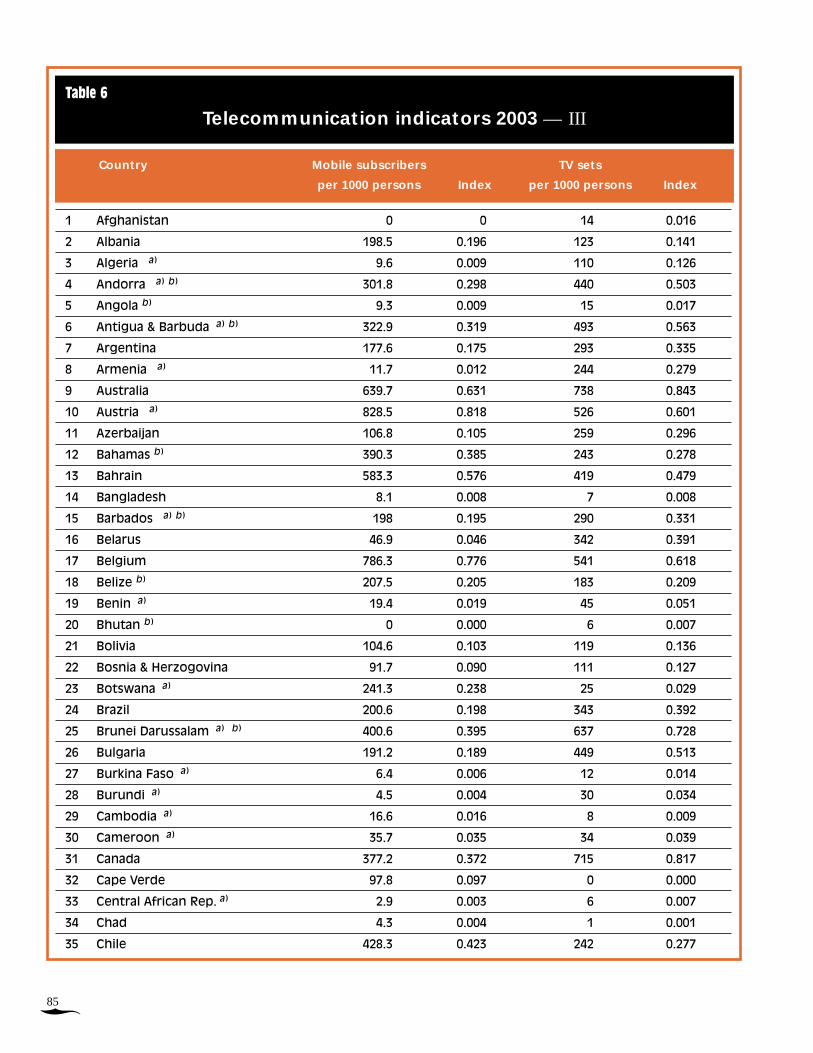
85
�
1 Afghanistan 0 0 14 0.016
2 Albania 198.5 0.196 123 0.141
3 Algeria a) 9.6 0.009 110 0.126
4 Andorra a) b) 301.8 0.298 440 0.503
5 Angola b) 9.3 0.009 15 0.017
6 Antigua & Barbuda a) b) 322.9 0.319 493 0.563
7 Argentina 177.6 0.175 293 0.335
8 Armenia a) 11.7 0.012 244 0.279
9 Australia 639.7 0.631 738 0.843
10 Austria a) 828.5 0.818 526 0.601
11 Azerbaijan 106.8 0.105 259 0.296
12 Bahamas b) 390.3 0.385 243 0.278
13 Bahrain 583.3 0.576 419 0.479
14 Bangladesh 8.1 0.008 7 0.008
15 Barbados a) b) 198 0.195 290 0.331
16 Belarus 46.9 0.046 342 0.391
17 Belgium 786.3 0.776 541 0.618
18 Belize b) 207.5 0.205 183 0.209
19 Benin a) 19.4 0.019 45 0.051
20 Bhutan b) 0 0.000 6 0.007
21 Bolivia 104.6 0.103 119 0.136
22 Bosnia & Herzogovina 91.7 0.090 111 0.127
23 Botswana a) 241.3 0.238 25 0.029
24 Brazil 200.6 0.198 343 0.392
25 Brunei Darussalam a) b) 400.6 0.395 637 0.728
26 Bulgaria 191.2 0.189 449 0.513
27 Burkina Faso a) 6.4 0.006 12 0.014
28 Burundi a) 4.5 0.004 30 0.034
29 Cambodia a) 16.6 0.016 8 0.009
30 Cameroon a) 35.7 0.035 34 0.039
31 Canada 377.2 0.372 715 0.817
32 Cape Verde 97.8 0.097 0 0.000
33 Central African Rep. a) 2.9 0.003 6 0.007
34 Chad 4.3 0.004 1 0.001
35 Chile 428.3 0.423 242 0.277
Table 6
Telecommunication indicators 2003 — III
Country Mobile subscribers TV sets
per 1000 persons Index per 1000 persons Index

�86
36 China 160.9 0.159 293 0.335
37 Colombia 106.2 0.105 282 0.322
38 Comoros 0 0.000 0 0.000
39 Congo 67.4 0.067 13 0.015
40 Costa Rica 127.5 0.126 231 0.264
41 Côte d’Ivoire 62.3 0.061 60 0.069
42 Croatia 470.3 0.464 293 0.335
43 Cuba* 0.8 0.001 250 0.286
44 Cyprus b) 597 0.589 154 0.176
45 Czech Republic a) 848.8 0.838 508 0.581
46 D.P.R. Korea 0 0.000 54 0.062
47 D.R. Congo a) 2.9 0.003 2 0.002
48 Denmark 833.3 0.822 807 0.922
49 Djibouti b) 22.9 0.023 48 0.055
50 Dominica b) 119.9 0.118 232 0.265
51 Dominican Rep. a) 146.5 0.145 97 0.111
52 Ecuador 120.6 0.119 218 0.249
53 Egypt a) 67.2 0.066 189 0.216
54 El Salvador 137.6 0.136 201 0.230
55 Equatorial Guinea 55.3 0.055 0 0.000
56 Eritrea 0 0.000 26 0.030
57 Estonia 650.2 0.642 591 0.675
58 Ethiopia 0.7 0.001 6 0.007
59 Fiji a) b) 107.8 0.106 110 0.126
60 Finland 845 0.834 692 0.791
61 France 647 0.638 628 0.718
62 Gabon a) 204.5 0.202 326 0.373
63 Gambia a) 41.2 0.041 3 0.003
64 Georgia 102.1 0.101 474 0.542
65 Germany 716.7 0.707 586 0.670
66 Ghana a) 9.3 0.009 118 0.135
67 Greece a) 838.6 0.828 488 0.558
68 Grenada b) 71.3 0.070 376 0.430
69 Guatemala a) 97 0.096 61 0.070
70 Guinea a) 7.3 0.007 44 0.050
71 Guinea-Bissau a) 0 0.000 0 0.000
72 Guyana b) 99.3 0.098 70 0.080
73 Haiti 16.9 0.017 5 0.006
Country Mobile subscribers TV sets
per 1000 persons Index per 1000 persons Index
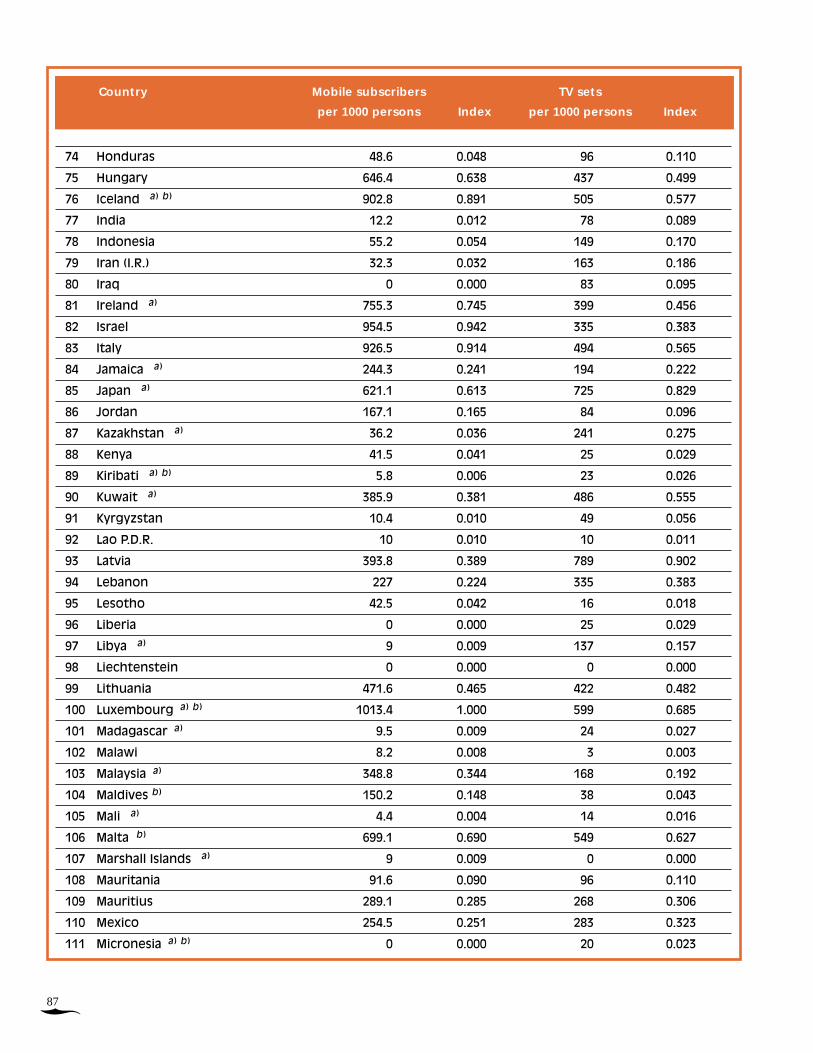
87
�
74 Honduras 48.6 0.048 96 0.110
75 Hungary 646.4 0.638 437 0.499
76 Iceland a) b) 902.8 0.891 505 0.577
77 India 12.2 0.012 78 0.089
78 Indonesia 55.2 0.054 149 0.170
79 Iran (I.R.) 32.3 0.032 163 0.186
80 Iraq 0 0.000 83 0.095
81 Ireland a) 755.3 0.745 399 0.456
82 Israel 954.5 0.942 335 0.383
83 Italy 926.5 0.914 494 0.565
84 Jamaica a) 244.3 0.241 194 0.222
85 Japan a) 621.1 0.613 725 0.829
86 Jordan 167.1 0.165 84 0.096
87 Kazakhstan a) 36.2 0.036 241 0.275
88 Kenya 41.5 0.041 25 0.029
89 Kiribati a) b) 5.8 0.006 23 0.026
90 Kuwait a) 385.9 0.381 486 0.555
91 Kyrgyzstan 10.4 0.010 49 0.056
92 Lao P.D.R. 10 0.010 10 0.011
93 Latvia 393.8 0.389 789 0.902
94 Lebanon 227 0.224 335 0.383
95 Lesotho 42.5 0.042 16 0.018
96 Liberia 0 0.000 25 0.029
97 Libya a) 9 0.009 137 0.157
98 Liechtenstein 0 0.000 0 0.000
99 Lithuania 471.6 0.465 422 0.482
100 Luxembourg a) b) 1013.4 1.000 599 0.685
101 Madagascar a) 9.5 0.009 24 0.027
102 Malawi 8.2 0.008 3 0.003
103 Malaysia a) 348.8 0.344 168 0.192
104 Maldives b) 150.2 0.148 38 0.043
105 Mali a) 4.4 0.004 14 0.016
106 Malta b) 699.1 0.690 549 0.627
107 Marshall Islands a) 9 0.009 0 0.000
108 Mauritania 91.6 0.090 96 0.110
109 Mauritius 289.1 0.285 268 0.306
110 Mexico 254.5 0.251 283 0.323
111 Micronesia a) b) 0 0.000 20 0.023
Country Mobile subscribers TV sets
per 1000 persons Index per 1000 persons Index
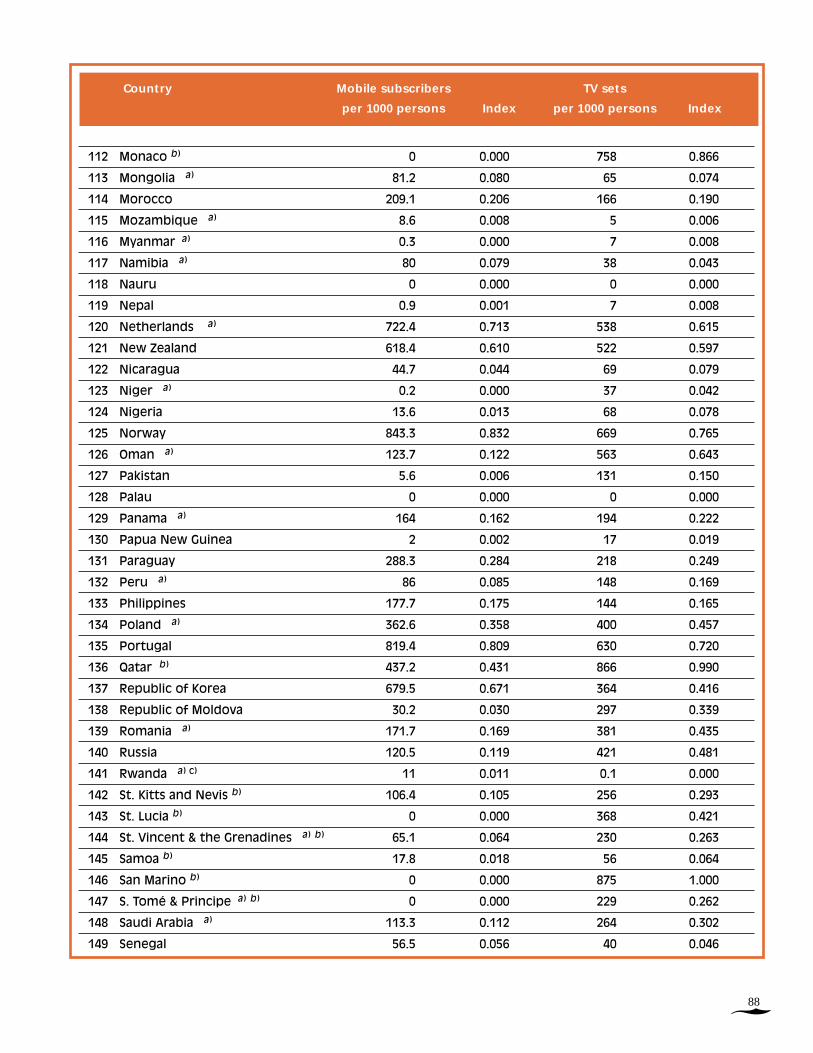
�88
112 Monaco b) 0 0.000 758 0.866
113 Mongolia a) 81.2 0.080 65 0.074
114 Morocco 209.1 0.206 166 0.190
115 Mozambique a) 8.6 0.008 5 0.006
116 Myanmar a) 0.3 0.000 7 0.008
117 Namibia a) 80 0.079 38 0.043
118 Nauru 0 0.000 0 0.000
119 Nepal 0.9 0.001 7 0.008
120 Netherlands a) 722.4 0.713 538 0.615
121 New Zealand 618.4 0.610 522 0.597
122 Nicaragua 44.7 0.044 69 0.079
123 Niger a) 0.2 0.000 37 0.042
124 Nigeria 13.6 0.013 68 0.078
125 Norway 843.3 0.832 669 0.765
126 Oman a) 123.7 0.122 563 0.643
127 Pakistan 5.6 0.006 131 0.150
128 Palau 0 0.000 0 0.000
129 Panama a) 164 0.162 194 0.222
130 Papua New Guinea 2 0.002 17 0.019
131 Paraguay 288.3 0.284 218 0.249
132 Peru a) 86 0.085 148 0.169
133 Philippines 177.7 0.175 144 0.165
134 Poland a) 362.6 0.358 400 0.457
135 Portugal 819.4 0.809 630 0.720
136 Qatar b) 437.2 0.431 866 0.990
137 Republic of Korea 679.5 0.671 364 0.416
138 Republic of Moldova 30.2 0.030 297 0.339
139 Romania a) 171.7 0.169 381 0.435
140 Russia 120.5 0.119 421 0.481
141 Rwanda a) c) 11 0.011 0.1 0.000
142 St. Kitts and Nevis b) 106.4 0.105 256 0.293
143 St. Lucia b) 0 0.000 368 0.421
144 St. Vincent & the Grenadines a) b) 65.1 0.064 230 0.263
145 Samoa b) 17.8 0.018 56 0.064
146 San Marino b) 0 0.000 875 1.000
147 S. Tomé & Principe a) b) 0 0.000 229 0.262
148 Saudi Arabia a) 113.3 0.112 264 0.302
149 Senegal 56.5 0.056 40 0.046
Country Mobile subscribers TV sets
per 1000 persons Index per 1000 persons Index

89
�
150 Serbia and Montenegro b) 256.6 0.253 277 0.317
151 Seychelles a) b) 538.7 0.532 214 0.245
152 Sierra Leone a) 5.5 0.005 13 0.015
153 Singapore 791.4 0.781 304 0.347
154 Slovakia 543.6 0.536 407 0.465
155 Slovenia 835.2 0.824 368 0.421
156 Solomon Islands b) 2.2 0.002 16 0.018
157 Somalia 0 0.000 14 0.016
158 South Africa 265.8 0.262 127 0.145
159 Spain 822.8 0.812 591 0.675
160 Sri Lanka 49.2 0.049 111 0.127
161 Sudan 5.9 0.006 273 0.312
162 Suriname a) b) 197.7 0.195 241 0.275
163 Swaziland 61 0.060 119 0.136
164 Sweden 885 0.873 574 0.656
165 Switzerland 787.5 0.777 548 0.626
166 Syria a) 12 0.012 67 0.077
167 Tajikistan 2.1 0.002 326 0.373
168 Thailand a) b) 260.4 0.257 274 0.313
169 The former Yugoslav
Republic of Macedonia a) 109.2 0.108 282 0.322
170 Timor-Leste 0 0.000 0 0.000
171 Togo 25.8 0.025 32 0.037
172 Tonga b) 33.9 0.033 61 0.070
173 Trinidad & Tobago 278.1 0.274 340 0.389
174 Tunisia 40.1 0.040 198 0.226
175 Turkey 347.5 0.343 449 0.513
176 Turkmenistan a) 1.7 0.002 196 0.224
177 Tuvalu b) 0 0.000 9 0.010
178 Uganda 15.9 0.016 27 0.031
179 Ukraine a) 44.2 0.044 456 0.521
180 United Arab Emirates 758.8 0.749 292 0.334
181 United Kingdom a) b) 844.9 0.834 661 0.755
182 United Rep. Of Tanzania 12.7 0.013 20 0.023
183 United States 488.1 0.482 854 0.976
184 Uruguay 154.7 0.153 530 0.606
185 Uzbekistan a) 7.4 0.007 276 0.315
186 Vanuatu a) b) 1.7 0.002 12 0.014
Country Mobile subscribers TV sets
per 1000 persons Index per 1000 persons Index

�90
187 Venezuela 255.5 0.252 185 0.211
188 Viet Nam 23.4 0.023 185 0.211
189 Yemen a) 8.1 0.008 283 0.323
190 Zambia 13 0.013 134 0.153
191 Zimbabwe 30.3 0.030 30 0.034
Country Mobile subscribers TV sets
per 1000 persons Index per 1000 persons Index
Sources: Telephone data from International Telecommunication Union, Web address: http://www.itu.int/ITU-D/ict/statistics/at_glance/main01.pdf
Mobile phones data from International Telecommunication Union, Web address: http://www.itu.int/ITU-D/ict/statistics/at_glance/cellular01.pdf
Note: a) All data is for the 2001 unless otherwise noted.
b) TV sets per 1000 persons data is for 1999
c) Data for Rwanda for 1994 fromhttp://portal.unesco.org/uis/TEMPLATE/html/CultAndCom/TableIV_14_Africa.html

91
�
1 Afghanistan 0.002 1 Sweden 0.846
2 Albania 0.049 2 Iceland a) b) 0.809
3 Algeria a) 0.036 3 United States 0.801
4 Andorra a) b) 0.309 4 Denmark 0.787
5 Angola b) 0.007 5 Norway 0.774
6 Antigua & Barbuda a) b) 0.244 6 Netherlands a) 0.710
7 Argentina 0.187 7 Australia 0.691
8 Armenia a) 0.070 8 Finland 0.691
9 Australia 0.691 9 Switzerland 0.682
10 Austria a) 0.591 10 Republic of Korea 0.675
11 Azerbaijan 0.080 11 Canada 0.675
12 Bahamas b) 0.193 12 United Kingdom a) b) 0.675
13 Bahrain 0.347 13 Singapore 0.666
14 Bangladesh 0.004 14 Luxembourg a) b) 0.660
15 Barbados a) b) 0.206 15 San Marino b) 0.640
16 Belarus 0.147 16 Germany 0.632
17 Belgium 0.514 17 Japan a) 0.626
18 Belize b) 0.153 18 New Zealand 0.613
19 Benin a) 0.012 19 Austria a) 0.591
20 Bhutan b) 0.015 20 France 0.529
21 Bolivia 0.055 21 Ireland a) 0.514
22 Bosnia & Herzogovina 0.059 22 Belgium 0.514
23 Botswana a) 0.067 23 Slovenia 0.513
24 Brazil 0.174 24 Italy 0.499
25 Brunei Darussalam a) b) 0.250 25 Estonia 0.498
26 Bulgaria 0.207 26 Portugal 0.490
27 Burkina Faso a) 0.005 27 Malta b) 0.460
28 Burundi a) 0.005 28 Israel 0.447
29 Cambodia a) 0.004 29 United Arab Emirates 0.444
30 Cameroon a) 0.012 30 Monaco b) 0.440
31 Canada 0.675 31 Cyprus b) 0.429
32 Cape Verde 0.086 32 Spain 0.409
33 Central African Rep. a) 0.002 33 Czech Republic a) 0.386
34 Chad 0.002 34 Greece a) 0.372
Table 7
Technology Infrastructure Index 2003
Alphabetical order Sorted in descending order
Country Technological Infrastructure Country Technological Infrastructure
Index 2003 Index 2003

�92
Alphabetical order Sorted in descending order
Country Technological Infrastructure Country Technological Infrastructure
Index 2003 Index 2003
35 Chile 0.275 35 Bahrain 0.347
36 China 0.116 36 Latvia 0.321
37 Colombia 0.118 37 Liechtenstein 0.319
38 Comoros 0.007 38 Andorra a) b) 0.309
39 Congo 0.011 39 Qatar b) 0.308
40 Costa Rica 0.198 40 Hungary 0.307
41 Côte d’Ivoire 0.021 41 Slovakia 0.294
42 Croatia 0.291 42 Malaysia a) 0.292
43 Cuba 0.051 43 Croatia 0.291
44 Cyprus b) 0.429 44 Chile 0.275
45 Czech Republic a) 0.386 45 Brunei Darussalam a) b) 0.250
46 D.P.R. Korea 0.011 46 St. Kitts and Nevis b) 0.248
47 D.R. Congo a) 0.001 47 Poland a) 0.248
48 Denmark 0.787 48 Antigua & Barbuda a) b) 0.244
49 Djibouti b) 0.019 49 Uruguay 0.244
50 Dominica b) 0.190 50 Seychelles a) b) 0.241
51 Dominican Rep. a) 0.067 51 Kuwait a) 0.226
52 Ecuador 0.089 52 Lithuania 0.218
53 Egypt a) 0.060 53 Bulgaria 0.207
54 El Salvador 0.082 54 Barbados a) b) 0.206
55 Equatorial Guinea 0.013 55 Trinidad & Tobago 0.206
56 Eritrea 0.007 56 Costa Rica 0.198
57 Estonia 0.498 57 Mauritius 0.196
58 Ethiopia 0.003 58 Bahamas b) 0.193
59 Fiji a) b) 0.074 59 Turkey 0.192
60 Finland 0.691 60 Dominica b) 0.190
61 France 0.529 61 Grenada b) 0.190
62 Gabon a) 0.077 62 Lebanon 0.188
63 Gambia a) 0.021 63 Argentina 0.187
64 Georgia 0.115 64 Russia 0.185
65 Germany 0.632 65 St. Lucia b) 0.176
66 Ghana a) 0.019 66 Brazil 0.174
67 Greece a) 0.372 67 Belize b) 0.153
68 Grenada b) 0.190 68 Romania a) 0.149
69 Guatemala a) 0.044 69 Belarus 0.147
70 Guinea a) 0.009 70 St. Vincent & the Grenadines a) b) 0.136
71 Guinea-Bissau a) 0.004 71 Serbia and Montenegro b) 0.134

93
�
72 Guyana b) 0.119 72 Oman a) 0.132
73 Haiti 0.012 73 Mexico 0.132
74 Honduras 0.041 74 Jamaica a) 0.127
75 Hungary 0.307 75 South Africa 0.126
76 Iceland a) b) 0.809 76 Republic of Moldovia 0.120
77 India 0.027 77 Guyana b) 0.119
78 Indonesia 0.045 78 Saudi Arabia a) 0.119
79 Iran (I.R.) 0.090 79 Colombia 0.118
80 Iraq 0.016 80 Suriname a) b) 0.118
81 Ireland a) 0.514 81 Thailand a) b) 0.117
82 Israel 0.447 82 Venezuela 0.117
83 Italy 0.499 83 China 0.116
84 Jamaica a) 0.127 84 Ukraine a) 0.116
85 Japan a) 0.626 85 Georgia 0.115
86 Jordan 0.089 86 The former Yugoslav
Republic of Macedonia a) 0.111
87 Kazakhstan a) 0.062 87 Peru 0.111
88 Kenya 0.021 88 Panama a) 0.095
89 Kiribati a) b) 0.026 89 Iran (I.R.) 0.090
90 Kuwait a) 0.226 90 Ecuador 0.089
91 Kyrgyzstan 0.037 91 Jordan 0.089
92 Lao P.D.R. 0.007 92 Tunisia 0.089
93 Latvia 0.321 93 Cape Verde 0.086
94 Lebanon 0.188 94 El Salvador 0.082
95 Lesotho 0.011 95 Azerbaijan 0.080
96 Liberia 0.003 96 Gabon a) 0.077
97 Libya a) 0.043 97 Paraguay 0.074
98 Liechtenstein 0.319 98 Fiji a) b) 0.074
99 Lithuania 0.218 99 Armenia a) 0.070
100 Luxembourg a) b) 0.660 100 Maldives b) 0.069
101 Madagascar a) 0.007 101 Dominican Rep. a) 0.067
102 Malawi 0.005 102 Botswana a) 0.067
103 Malaysia a) 0.292 103 Philippines 0.064
104 Maldives b) 0.069 104 Kazakhstan a) 0.062
105 Mali a) 0.005 105 Morocco 0.061
106 Malta b) 0.460 106 Egypt a) 0.060
107 Marshall Islands a) 0.040 107 Bosnia & Herzogovina 0.059
Alphabetical order Sorted in descending order
Country Technological Infrastructure Country Technological Infrastructure
Index 2003 Index 2003

�94
Alphabetical order Sorted in descending order
Country Technological Infrastructure Country Technological Infrastructure
Index 2003 Index 2003
108 Mauritania 0.027 108 Namibia a) 0.056
109 Mauritius 0.196 109 Bolivia 0.055
110 Mexico 0.132 110 S. Tomé & Principe a) b) 0.054
111 Micronesia a) b) 0.040 111 Uzbekistan a) 0.053
112 Monaco b) 0.440 112 Cuba 0.051
113 Mongolia a) 0.040 113 Tonga b) 0.051
114 Morocco 0.061 114 Albania 0.049
115 Mozambique a) 0.004 115 Viet Nam 0.048
116 Myanmar a) 0.003 116 Tajikistan 0.046
117 Namibia a) 0.056 117 Indonesia 0.045
118 Nauru 0.035 118 Guatemala a) 0.044
119 Nepal 0.006 119 Libya a) 0.043
120 Netherlands a) 0.710 120 Zimbabwe 0.042
121 New Zealand 0.613 121 Turkmenistan a) 0.042
122 Nicaragua 0.033 122 Honduras 0.041
123 Niger a) 0.005 123 Marshall Islands a) 0.040
124 Nigeria 0.013 124 Mongolia a) 0.040
125 Norway 0.774 125 Sudan 0.040
126 Oman a) 0.132 126 Micronesia a) b) 0.040
127 Pakistan 0.026 127 Yemen a) 0.039
128 Palau 0.000 128 Syria a) 0.038
129 Panama a) 0.095 129 Kyrgyzstan 0.037
130 Papua New Guinea 0.031 130 Swaziland 0.037
131 Paraguay 0.074 131 Sri Lanka 0.036
132 Peru 0.111 132 Algeria a) 0.036
133 Philippines 0.064 133 Nauru 0.035
134 Poland a) 0.248 134 Samoa b) 0.034
135 Portugal 0.490 135 Togo 0.034
136 Qatar b) 0.308 136 Nicaragua 0.033
137 Republic of Korea 0.675 137 Papua New Guinea 0.031
138 Republic of Moldovia 0.120 138 India 0.027
139 Romania a) 0.149 139 Mauritania 0.027
140 Russia 0.185 140 Senegal 0.027
141 Rwanda a) c) 0.003 141 Kiribati a) b) 0.026
142 St. Kitts and Nevis b) 0.248 142 Pakistan 0.026
143 St. Lucia b) 0.176 143 Zambia 0.023
144 St. Vincent & the Grenadines a) b) 0.136 144 Vanuatu a) b) 0.023
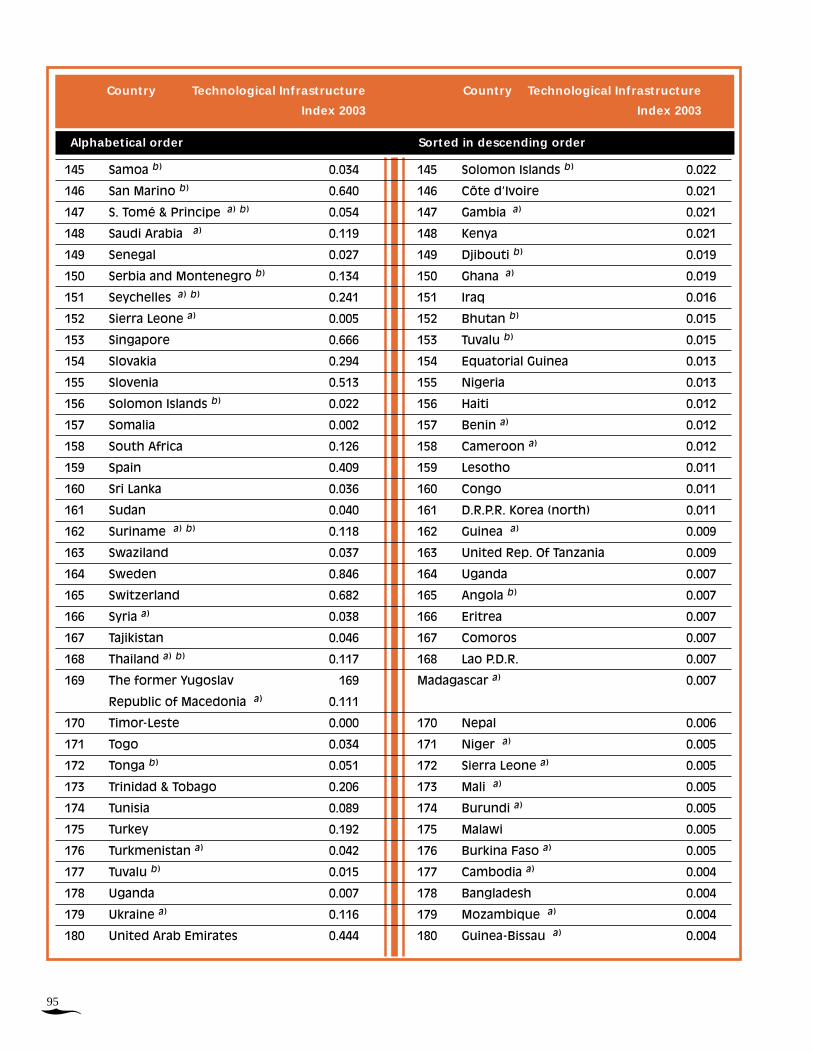
95
�
Alphabetical order Sorted in descending order
Country Technological Infrastructure Country Technological Infrastructure
Index 2003 Index 2003
145 Samoa b) 0.034 145 Solomon Islands b) 0.022
146 San Marino b) 0.640 146 Côte d’Ivoire 0.021
147 S. Tomé & Principe a) b) 0.054 147 Gambia a) 0.021
148 Saudi Arabia a) 0.119 148 Kenya 0.021
149 Senegal 0.027 149 Djibouti b) 0.019
150 Serbia and Montenegro b) 0.134 150 Ghana a) 0.019
151 Seychelles a) b) 0.241 151 Iraq 0.016
152 Sierra Leone a) 0.005 152 Bhutan b) 0.015
153 Singapore 0.666 153 Tuvalu b) 0.015
154 Slovakia 0.294 154 Equatorial Guinea 0.013
155 Slovenia 0.513 155 Nigeria 0.013
156 Solomon Islands b) 0.022 156 Haiti 0.012
157 Somalia 0.002 157 Benin a) 0.012
158 South Africa 0.126 158 Cameroon a) 0.012
159 Spain 0.409 159 Lesotho 0.011
160 Sri Lanka 0.036 160 Congo 0.011
161 Sudan 0.040 161 D.R.P.R. Korea (north) 0.011
162 Suriname a) b) 0.118 162 Guinea a) 0.009
163 Swaziland 0.037 163 United Rep. Of Tanzania 0.009
164 Sweden 0.846 164 Uganda 0.007
165 Switzerland 0.682 165 Angola b) 0.007
166 Syria a) 0.038 166 Eritrea 0.007
167 Tajikistan 0.046 167 Comoros 0.007
168 Thailand a) b) 0.117 168 Lao P.D.R. 0.007
169 The former Yugoslav 169 Madagascar a) 0.007
Republic of Macedonia a) 0.111
170 Timor-Leste 0.000 170 Nepal 0.006
171 Togo 0.034 171 Niger a) 0.005
172 Tonga b) 0.051 172 Sierra Leone a) 0.005
173 Trinidad & Tobago 0.206 173 Mali a) 0.005
174 Tunisia 0.089 174 Burundi a) 0.005
175 Turkey 0.192 175 Malawi 0.005
176 Turkmenistan a) 0.042 176 Burkina Faso a) 0.005
177 Tuvalu b) 0.015 177 Cambodia a) 0.004
178 Uganda 0.007 178 Bangladesh 0.004
179 Ukraine a) 0.116 179 Mozambique a) 0.004
180 United Arab Emirates 0.444 180 Guinea-Bissau a) 0.004

�96
181 United Kingdom a) b) 0.675 181 Liberia 0.003
182 United Rep. Of Tanzania* 0.009 182 Rwanda a) c) 0.003
183 United States 0.801 183 Ethiopia 0.003
184 Uruguay 0.244 184 Myanmar a) 0.003
185 Uzbekistan a) 0.053 185 Central African Rep.a) 0.002
186 Vanuatu a) b) 0.023 186 Somalia 0.002
187 Venezuela 0.117 187 Afghanistan 0.002
188 Viet Nam 0.048 188 Chad 0.002
189 Yemen a) 0.039 189 D.R. Congo a) 0.001
190 Zambia 0.023 190 Timor-Leste 0.000
191 Zimbabwe 0.042 191 Palau 0.000
Alphabetical order Sorted in descending order
Country Technological Infrastructure Country Technological Infrastructure
Index 2003 Index 2003
Sources: Percentage of Pop. On line Web address: http://www.nua.com/surveys/how_many_online/africa.html
Telephone data from International Telecommunication Union, Web address: http://www.itu.int/ITU-D/ict/statistics/at_glance/main01.pdf
Mobile phones data from International Telecommunication Union, Web address: http://www.itu.int/ITU-D/ict/statistics/at_glance/cellular01.pdf
Internet and Estimated PCs data from International Telecommunication Union, Web address: http://www.itu.int/ITU-D/ict/statistics/at_glance/Internet01.pdf
TV sets/1000 persons from World Bank World Development Report 2002; except those marked b) for which data is for 1999 from UN Statistics Division http://unstats.un.org/unsd/cdb/cdb_simple_data_extract.asp
Note: a) All data is for the 2001 unless otherwise noted.
b) TV sets per 1000 persons data is for 1999
c) Data for Rwanda for 1994 from http://portal.unesco.org/uis/TEMPLATE/html/CultAndCom/TableIV_14_Africa.html

97
�
1 Afghanistan a) 0.268
Albania 0.80
2 Algeria 0.69
1 Andorra 0.000
3 Angola 0.36
2 Antigua and Barbuda 0.81
4 Argentina 0.92
3 Armenia 0.92
5 Australia 0.99
4 Austria 0.96
6 Azerbaijan 0.88
5 Bahamas 0.88
7 Bahrain 0.85
6 Bangladesh 0.40
8 Barbados 0.91
7 Belarus 0.92
9 Belgium 0.99
8 Belize 0.86
10 Benin 0.40
9 Bhutan 0.42
11 Bolivia 0.80
10 Bosnia & Herzogovina 0.737
12 Botswana 0.75
11 Brazil 0.83
13 Brunei Darussalam 0.86
12 Bulgaria 0.90
14 Burkina Faso 0.23
13 Burundi 0.38
15 Cambodia 0.66
14 Cameroon 0.65
16 Canada 0.98
15 Cape Verde 0.75
17 Central African Republic 0.39
16 Chad 0.39
18 Chile 0.90
17 China 0.80
19 Colombia 0.85
18 Comoros 0.49
20 Congo 0.75
19 Costa Rica 0.86
21 Côte d’Ivoire 0.44
20 Croatia 0.88
22 Cuba 0.90
21 Cyprus 0.88
23 Czech Republic 0.89
22 D.P.R. Korea 0.000
24 Congo, Dem. Rep. of the 0.51
23 Denmark 0.98
25 Djibouti 0.50
24 Dominica 0.86
26 Dominican Republic 0.80
25 Ecuador 0.87
27 Egypt 0.62
26 El Salvador 0.74
28 Equatorial Guinea 0.77
27 Eritrea 0.46
29 Estonia 0.95
28 Ethiopia 0.35
30 Fiji 0.90
29 Finland 0.99
31 France 0.97
30 Gabon 0.76
32 Gambia 0.39
31 Georgia 0.89
33 Germany 0.97
32 Ghana 0.62
34 Greece 0.92
33 Grenada 0.85
35 Guatemala 0.62
34 Guinea 0.37
36 Guinea-Bissau 0.38
35 Guyana 0.88
Table 8
Human Capital Index
Human Cap Index Human Cap Index

�98
37 Haiti 0.50
36 Honduras 0.70
38 Hungary 0.93
37 Iceland 0.96
39 India 0.57
38 Indonesia 0.79
40 Iran, Islamic Rep. of 0.75
39 Iraq 0.930
41 Ireland 0.96
40 Israel 0.91
42 Italy 0.94
41 Jamaica 0.79
43 Japan 0.93
42 Jordan 0.78
44 Kazakhstan 0.91
43 Kenya 0.72
45 Kiribati 0.000
44 Kuwait 0.74
46 Kyrgyzstan 0.87
45 Lao People’s Dem. Rep. 0.52
47 Latvia 0.93
46 Lebanon 0.83
48 Lesotho 0.76
47 Liberia 0.000
49 Libya 0.84
48 Liechtenstein 0
50 Lithuania 0.93
49 Luxembourg 0.90
51 Madagascar 0.59
50 Malawi 0.65
52 Malaysia 0.80
51 Maldives 0.90
53 Mali 0.37
52 Malta 0.88
54 Marshall Islands 0.000
53 Mauritania 0.40
55 Mauritius 0.77
54 Mexico 0.84
56 Micronesia 1.422
55 Monaco 0.000
57 Mongolia 0.85
56 Morocco 0.50
58 Mozambique 0.37
57 Myanmar 0.75
59 Namibia 0.81
58 Nauru a) 0.810
60 Nepal 0.48
59 Netherlands 0.99
61 New Zealand 0.99
60 Nicaragua 0.65
62 Niger 0.16
61 Nigeria 0.58
63 Norway 0.98
62 Oman 0.67
64 Pakistan 0.42
63 Palau 0.000
65 Panama 0.86
64 Papua New Guinea 0.55
66 Paraguay 0.83
65 Peru 0.87
67 Philippines 0.91
66 Poland 0.94
68 Portugal 0.94
67 Qatar 0.79
69 Republic of Korea 0.95
68 Republic of Moldova a) 0.900
70 Romania 0.88
69 Russia 0.92
71 Rwanda 0.58
70 Saint Kitts and Nevis 0.89
72 Saint Lucia 0.83
71 Saint Vincent and the Grenadines 0.79
73 Samoa 0.75
72 San Marino 0.000
74 Sao Tome and Principe 0.75
73 Saudi Arabia 0.71
75 Senegal 0.37
74 Serbia & Montenegro a) 0.694
Human Cap Index Human Cap Index

99
�
76 Seychelles 0.83
75 Sierra Leone 0.33
77 Singapore 0.87
76 Slovakia 0.91
78 Slovenia 0.94
77 Solomon Islands 0.68
79 Somalia a) 0.096
78 South Africa 0.88
80 Spain 0.97
79 Sri Lanka 0.84
81 Sudan 0.50
80 Suriname 0.90
82 Swaziland 0.77
81 Sweden 0.99
83 Switzerland 0.94
82 Syria 0.71
84 Tajikistan 0.88
83 Thailand 0.84
85 The former Yugoslav
Republic of Macedonia a) 0.860
84 Timor-Leste 0.000
86 Togo 0.59
85 Tonga a) 0.920
87 Trinidad and Tobago 0.84
86 Tunisia 0.72
88 Turkey 0.77
87 Turkmenistan 0.92
89 Tuvalu a) 1.030
88 Uganda 0.60
90 Ukraine 0.92
89 United Arab Emirates 0.74
91 United Kingdom 0.99
90 United Rep. Of Tanzania 0.61
92 United States 0.98
91 Uruguay 0.92
93 Uzbekistan 0.91
92 Vanuatu 0.35
94 Venezuela 0.83
93 Viet Nam 0.84
95 Yemen 0.48
94 Zambia 0.68
96 Zimbabwe 0.81
Human Cap Index Human Cap Index
Source: UNDP HDR 2002. http://hdr.undp.org/reports/global/2002/en/indicator/excel/hdr_2002_table_1.xls
Note: a) Data are from national sources.

�100
1 1 United Kingdom 17 26 15 58 1.000
2 2 United States 16 25 15 56 0.966
3 3 Canada 12 26 10 48 0.828
4 3 Chile 14 21 13 48 0.828
5 4 Estonia 13 19 12 44 0.759
6 5 New Zealand 14 17 9 40 0.690
7 6 Philippines 13 19 7 39 0.672
8 7 France 13 19 5 37 0.638
9 7 Netherlands 13 20 4 37 0.638
10 8 Australia 13 16 7 36 0.621
11 9 Mexico 10 17 8 35 0.603
12 10 Argentina 10 15 9 34 0.586
13 10 Ireland 14 13 7 34 0.586
14 10 Sweden 13 15 6 34 0.586
15 11 Germany 13 13 5 31 0.534
16 12 Republic of Korea 10 13 5 28 0.483
17 13 Italy 10 10 7 27 0.466
18 13 Singapore 11 10 6 27 0.466
19 13 Switzerland 11 7 9 27 0.466
20 14 Denmark 9 10 7 26 0.448
21 14 Finland 9 9 8 26 0.448
22 14 Portugal 11 12 3 26 0.448
23 15 Japan 10 10 5 25 0.431
24 16 Bolivia 7 12 4 23 0.397
25 16 Dominican Republic 7 13 3 23 0.397
26 16 Israel 8 8 7 23 0.397
27 16 Poland 9 11 3 23 0.397
28 16 Ukraine 9 9 5 23 0.397
29 16 Brazil 11 9 2 22 0.379
30 15 Mongolia 7 10 5 22 0.379
31 17 Panama 8 8 5 21 0.362
32 18 Malta 11 5 4 20 0.345
Table 9
E-Participation Index 2003
E-Participation E-Participation
e e e decision
information consultation making Index
I. II. III. Total Pts.
Rank Country

101
�
33 18 Norway 8 6 6 20 0.345
34 19 El Salvador 6 9 4 19 0.328
35 20 Nicaragua 6 7 5 18 0.310
36 20 Slovenia 8 6 4 18 0.310
37 21 Belgium 6 6 5 17 0.293
38 21 Hungary 5 8 4 17 0.293
39 21 Luxembourg 7 8 2 17 0.293
40 21 Sri Lanka 5 9 3 17 0.293
41 22 India 6 4 5 15 0.259
42 22 Indonesia 6 7 2 15 0.259
43 22 Oman 3 6 6 15 0.259
44 22 South Africa 5 6 4 15 0.259
45 23 Croatia 4 9 1 14 0.241
46 23 Czech Republic 4 7 3 14 0.241
47 24 Paraguay 8 3 2 13 0.224
48 25 Nigeria 4 6 2 12 0.207
49 25 Trinidad and Tobago 5 4 3 12 0.207
50 25 Turkey 4 4 4 12 0.207
51 26 Madagascar 6 4 1 11 0.190
52 26 The former Yugoslav
Republic of Macedonia 2 6 3 11 0.190
53 27 Jordan 5 3 2 10 0.172
54 27 Slovakia 6 2 2 10 0.172
55 27 United Arab Emirates 5 3 2 10 0.172
56 28 Colombia 8 0 1 9 0.155
57 28 Jamaica 5 1 3 9 0.155
58 28 Pakistan 3 2 4 9 0.155
59 28 Spain 6 1 2 9 0.155
60 28 Venezuela 4 4 1 9 0.155
61 29 Austria 5 1 2 8 0.138
62 29 Bulgaria 5 2 1 8 0.138
63 29 Cambodia 3 4 1 8 0.138
64 29 Morocco 6 1 1 8 0.138
65 29 Nepal 3 2 3 8 0.138
66 29 Peru 6 0 2 8 0.138
E-Participation E-Participation
e e e decision
information consultation making Index
I. II. III. Total Pts.
Rank Country

�102
67 30 Malaysia 6 0 1 7 0.121
68 30 Sudan 2 5 0 7 0.121
69 31 Kazakhstan 1 4 1 6 0.103
70 31 Lithuania 3 1 2 6 0.103
71 31 Thailand 3 1 2 6 0.103
72 32 Comoros 2 3 0 5 0.086
73 32 Costa Rica 4 0 1 5 0.086
74 32 Greece 2 2 1 5 0.086
75 32 Guatemala 4 0 1 5 0.086
76 32 Iceland 4 0 1 5 0.086
77 32 Latvia 3 0 2 5 0.086
78 32 Lebanon 2 1 2 5 0.086
79 32 Mauritius 5 0 0 5 0.086
80 32 Mozambique 3 1 1 5 0.086
81 32 Saint Lucia 4 0 1 5 0.086
82 32 Senegal 3 2 0 5 0.086
83 32 Timor-Leste 4 0 1 5 0.086
84 33 Angola 3 0 1 4 0.069
85 33 Cape Verde 3 0 1 4 0.069
86 33 China 3 0 1 4 0.069
87 33 Ecuador 3 0 1 4 0.069
88 33 Liechtenstein 1 1 2 4 0.069
89 33 Seychelles 3 0 1 4 0.069
90 33 Uruguay 3 0 1 4 0.069
91 34 Algeria 3 0 0 3 0.052
92 34 Armenia 1 2 0 3 0.052
93 34 Bahamas 3 0 0 3 0.052
94 34 Bahrain 2 0 1 3 0.052
95 34 Cameroon 1 1 1 3 0.052
96 34 Cuba 2 0 1 3 0.052
97 34 Fiji 2 0 1 3 0.052
98 34 Guyana 2 0 1 3 0.052
99 34 Romania 1 1 1 3 0.052
100 34 Russian Federation 3 0 0 3 0.052
101 34 Zimbabwe 1 1 1 3 0.052
E-Participation E-Participation
e e e decision
information consultation making Index
I. II. III. Total Pts.
Rank Country

103
�
102 35 Afghanistan 2 0 0 2 0.034
103 35 Andorra 1 0 1 2 0.034
104 35 Barbados 2 0 0 2 0.034
105 35 Belarus 2 0 0 2 0.034
106 35 Benin 2 0 0 2 0.034
107 35 Bosnia and Herzegovina 1 0 1 2 0.034
108 35 Ethiopia 2 0 0 2 0.034
109 35 Ghana 2 0 0 2 0.034
110 35 Honduras 1 0 1 2 0.034
111 35 Iran (Islamic Republic of) 2 0 0 2 0.034
112 35 Kyrgyzstan 1 1 0 2 0.034
113 35 Lesotho 2 0 0 2 0.034
114 35 Maldives 2 0 0 2 0.034
115 35 Mauritania 1 0 1 2 0.034
116 35 Republic of Moldova 1 0 1 2 0.034
117 35 Saint Kitts and Nevis 1 0 1 2 0.034
118 35 Saudi Arabia 2 0 0 2 0.034
119 35 Serbia and Montenegro 2 0 0 2 0.034
120 35 Uganda 1 1 0 2 0.034
121 35 Vanuatu 2 0 0 2 0.034
122 35 Yemen 1 0 1 2 0.034
123 36 Albania 1 0 0 1 0.017
124 36 Azerbaijan 1 0 0 1 0.017
125 36 Bangladesh 1 0 0 1 0.017
126 36 Belize 1 0 0 1 0.017
127 36 Bhutan 1 0 0 1 0.017
128 36 Botswana 1 0 0 1 0.017
129 36 Brunei Darussalam 1 0 0 1 0.017
130 36 Cyprus 1 0 0 1 0.017
131 36 Egypt 1 0 0 1 0.017
132 36 Gambia 1 0 0 1 0.017
133 36 Georgia 1 0 0 1 0.017
134 36 Kuwait 1 0 0 1 0.017
135 36 Malawi 1 0 0 1 0.017
136 36 Mali 1 0 0 1 0.017
E-Participation E-Participation
e e e decision
information consultation making Index
I. II. III. Total Pts.
Rank Country

�104
137 36 Marshall Islands 1 0 0 1 0.017
138 36 Micronesia
(Federated States of) 1 0 0 1 0.017
139 36 Monaco 1 0 0 1 0.017
140 36 Namibia 1 0 0 1 0.017
141 36 Nauru 1 0 0 1 0.017
142 36 Rwanda 1 0 0 1 0.017
143 36 Samoa 1 0 0 1 0.017
144 36 San Marino 1 0 0 1 0.017
145 36 Togo 1 0 0 1 0.017
146 36 Tunisia 1 0 0 1 0.017
147 36 Turkmenistan 1 0 0 1 0.017
148 36 United Republic of Tanzania 1 0 0 1 0.017
149 36 Viet Nam 1 0 0 1 0.017
150 36 Zambia 0 0 1 1 0.017
151 37 Antigua and Barbuda 0 0 0 0 0.000
152 37 Burkina Faso 0 0 0 0 0.000
153 37 Burundi 0 0 0 0 0.000
154 37 Central African Republic 0 0 0 0 0.000
155 37 Chad 0 0 0 0 0.000
156 37 Congo 0 0 0 0 0.000
157 37 Côte d’Ivoire 0 0 0 0 0.000
158 37 Democratic People’s
Republic of Korea 0 0 0 0 0.000
159 37 Democratic Republic
of the Congo 0 0 0 0 0.000
160 37 Djibouti 0 0 0 0 0.000
161 37 Dominica 0 0 0 0 0.000
162 37 Equatorial Guinea 0 0 0 0 0.000
163 37 Eritrea 0 0 0 0 0.000
164 37 Gabon 0 0 0 0 0.000
165 37 Grenada 0 0 0 0 0.000
166 37 Guinea 0 0 0 0 0.000
167 37 Guinea-Bissau 0 0 0 0 0.000
168 37 Haiti 0 0 0 0 0.000
E-Participation E-Participation
e e e decision
information consultation making Index
I. II. III. Total Pts.
Rank Country

105
�
169 37 Iraq 0 0 0 0 0.000
170 37 Kenya 0 0 0 0 0.000
171 37 Kiribati 0 0 0 0 0.000
172 37 Lao People’s
Democratic Republic 0 0 0 0 0.000
173 37 Liberia 0 0 0 0 0.000
174 37 Libyan Arab Jamahiriya 0 0 0 0 0.000
175 37 Myanmar 0 0 0 0 0.000
176 37 Niger 0 0 0 0 0.000
177 37 Palau 0 0 0 0 0.000
178 37 Papua New Guinea 0 0 0 0 0.000
179 37 Qatar 0 0 0 0 0.000
180 37 Saint Vincent and
the Grenadines 0 0 0 0 0.000
181 37 Sao Tome and Principe 0 0 0 0 0.000
182 37 Sierra Leone 0 0 0 0 0.000
183 37 Solomon Islands 0 0 0 0 0.000
184 37 Somalia 0 0 0 0 0.000
185 37 Suriname 0 0 0 0 0.000
186 37 Swaziland 0 0 0 0 0.000
187 37 Syrian Arab Republic 0 0 0 0 0.000
188 37 Tajikistan 0 0 0 0 0.000
189 37 Tonga 0 0 0 0 0.000
190 37 Tuvalu 0 0 0 0 0.000
191 37 Uzbekistan 0 0 0 0 0.000
E-Participation E-Participation
e e e decision
information consultation making Index
I. II. III. Total Pts.
Rank Country

�106
ANNEX II:
Technical Notes
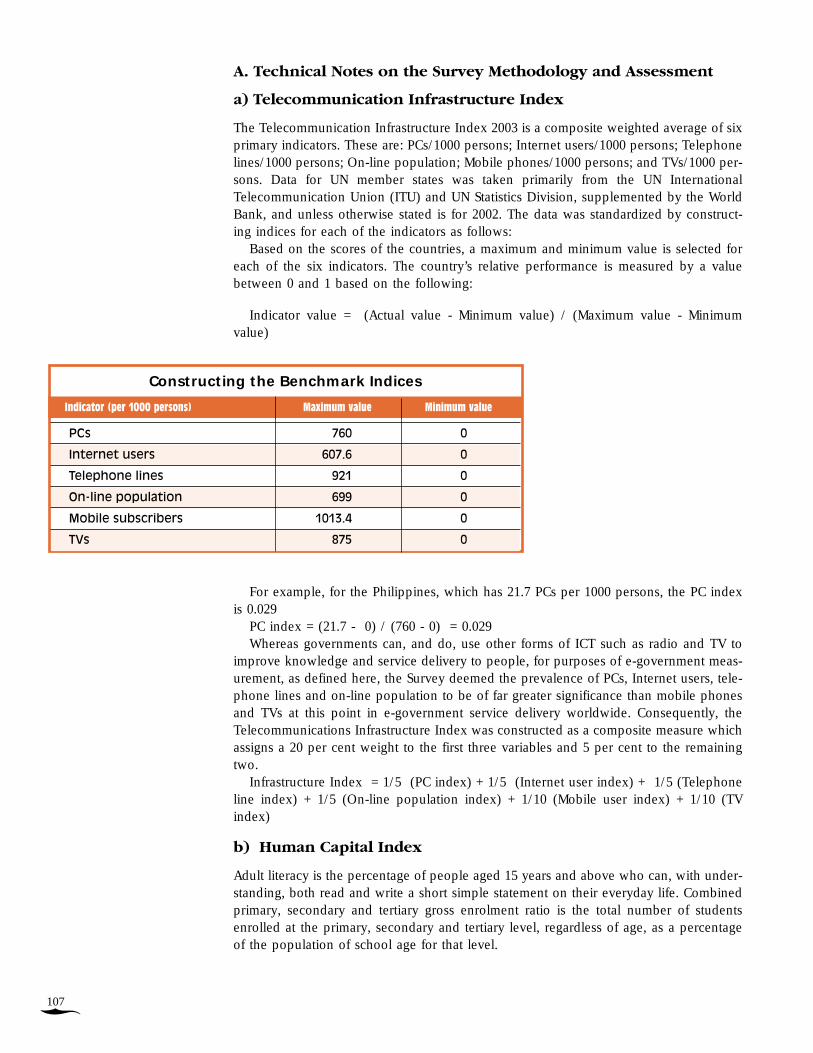
A. Technical Notes on the Survey Methodology and Assessment
a) Telecommunication Infrastructure Index
The Telecommunication Infrastructure Index 2003 is a composite weighted average of sixprimary indicators. These are: PCs/1000 persons; Internet users/1000 persons; Telephonelines/1000 persons; On-line population; Mobile phones/1000 persons; and TVs/1000 per-sons. Data for UN member states was taken primarily from the UN InternationalTelecommunication Union (ITU) and UN Statistics Division, supplemented by the WorldBank, and unless otherwise stated is for 2002. The data was standardized by construct-ing indices for each of the indicators as follows:
Based on the scores of the countries, a maximum and minimum value is selected foreach of the six indicators. The country’s relative performance is measured by a valuebetween 0 and 1 based on the following:
Indicator value = (Actual value - Minimum value) / (Maximum value - Minimumvalue)
For example, for the Philippines, which has 21.7 PCs per 1000 persons, the PC indexis 0.029
PC index = (21.7 - 0) / (760 - 0) = 0.029Whereas governments can, and do, use other forms of ICT such as radio and TV to
improve knowledge and service delivery to people, for purposes of e-government meas-urement, as defined here, the Survey deemed the prevalence of PCs, Internet users, tele-phone lines and on-line population to be of far greater significance than mobile phonesand TVs at this point in e-government service delivery worldwide. Consequently, theTelecommunications Infrastructure Index was constructed as a composite measure whichassigns a 20 per cent weight to the first three variables and 5 per cent to the remainingtwo.
Infrastructure Index = 1/5 (PC index) + 1/5 (Internet user index) + 1/5 (Telephoneline index) + 1/5 (On-line population index) + 1/10 (Mobile user index) + 1/10 (TVindex)
b) Human Capital Index
Adult literacy is the percentage of people aged 15 years and above who can, with under-standing, both read and write a short simple statement on their everyday life. Combinedprimary, secondary and tertiary gross enrolment ratio is the total number of studentsenrolled at the primary, secondary and tertiary level, regardless of age, as a percentageof the population of school age for that level.
107
�
PCs 760 0
Internet users 607.6 0
Telephone lines 921 0
On-line population 699 0
Mobile subscribers 1013.4 0
TVs 875 0
Constructing the Benchmark Indices
Indicator (per 1000 persons) Maximum value Minimum value

�
For country X, with an adult literacy rate of 96.3 per cent and a combined gross enrol-ment ratio of 81.2 per cent in 2002, the education index would be: Adult literacy index= 0.963; Gross enrolment index =0.812; Education index = 2/3 (Adult literacy index) +1/3 (Gross enrolment index) = 2/3 (0.963) + 1/3 (0.812) = 0.913
B. A Note on Web Measure Survey Methodology
One of the most basic decisions for the researchers when undertaking this survey waswhat site to review as the national government site for each of the countries. One wouldthink that regardless of where a nation is in its e-government development, a prioritywould be to provide users a clear indication as to which of the potentially many gov-ernment sites available was the “official” national government site - in a sense, the start-ing point for national users. Not only is this easy to do - a simple, clear statement at thechosen website is sufficient to start - but also an important step toward providing gov-ernment information and services to people in a usable and easy-to-find manner. Inmany instances, however, this basic piece of information was missing and decidingwhich site was the official national site, or even if there were an official national site,was more problematic than expected. Further, attempting to use any of the availablecommercial or university government website resources proved to be not only frustrat-ing but also highly unreliable. None of those checked were up-to-date, none providedany validation information, and in many instances, URLs provided for government siteswere actually for commercial sites or other non-governmental sites.
Thus, the researchers first looked for a clearly identified official national governmentsite, much as members of the public would do in their initial forays onto the Web forgovernment information. The criteria included the following:
1. Is there a distinct national government site or portal? A growing number ofcountries have developed true national sites and/or portals that are clearly identi-fied as the official national government site. For users, this makes it extremely easyto find and decide where they should start.
2. Is there a Presidential or Prime Minister’s site (whichever office heads the gov-ernment of the country in question) that CLEARLY states that it is the national gov-ernment site? A number of countries have integrated their government informationand services into the Presidential/Prime Minister’s site and clearly indicated that itis the national government site. For example, the Ecuadoran national site,http://www.presidencia.gov.ec/, is the Presidential site but the homepage link andtitle banner used throughout the site clearly state “Gobierno Nacional de laRepublic del Ecuador,” the National Government of the Republic of Ecuador.
3. Is there a site operated by another agency, ministry or other government bodythat is clearly identified as the national government site? The United Arab Emirates,for example, operates its National Gateway Site out of its Ministry of Finance andIndustry. The site is clearly labelled the national government gateway, it is linkedfrom other ministry sites as the national government gateway, and even the URL -http://www.uae.gov.ae - suggests a national government site.
4. If none of the above, is there a viable Presidential or Prime Minister’s site, evenif it is not clearly identified as the national government site (and as long as it is notsimply a press or publicity site)? In other words, does it include information aboutthe national government and its services even if there is no clear statement or indi-cation that it is indeed the official national government site?
108

If no site could be found that clearly met any of the above criteria, then the countryreceived no points for the Emerging Presence section of the survey. However, theresearchers then attempted to identify an alternate site to score for the remainder of thesurvey. In attempting to identify an appropriate alternative site, researchers:
1. Reviewed a Presidential or Prime Minister’s site that had not reached the thresh-old for a true national government site.
2. Looked for a national assembly, parliament or other national legislative body,especially if it included national government services and information.
3. Looked for another official government site, such as a Ministry of Informationsite.
4. Looked for another government sponsored site at the national level, such as aTourism Board or Embassy site, but only if it was verified to be promoting thenational government and was providing some sort of national or contact informa-tion.
Most countries have engaged in the procedure of actually noting on their national sitethat it is their “Official” Government site, or Gateway to Government, or other suchstatement. A good example of creating and identifying a single government access pointis the U.S. http://FirstGov.gov site, which clearly indicates that it is the “U.S. government’sofficial web portal.” This kind of clear presence is not limited to large, industrializednations; the Madagascar national site includes on virtually every page, a statement inFrench and English welcoming the user to “...the Official Website of the MalagasyGovernment,” and the introduction on the homepage from the Prime Minister begins,“Welcome to the Website of the Government of the Republic of Madagascar.”(http://www.madagascar.gov.mg/)
These types of clear indications on national sites made the choice relatively easy forresearchers. However, a number of countries have not yet clearly consolidated their gov-ernment entry point into a single service that can be clearly distinguished. One such caseis Norway, which has two “national” sites. The first is Odin, http://odin.dep.no, whichclaims to be the official “gateway to information,” while the second site,http://www.norge.no, establishes itself as “a single gateway to the public sector.” In thiscase, the latter site represents a two-year collaborative project among national, regionaland local governments and organizations, and so the former site was reviewed to betterinsure consistency.
In general, in the case of two “competing” sites, one could be distinguished as “moreofficial” than the other after close examination based on who in government providedthe services listed, what the site was used for, the continuity of the site and how it guid-ed its user. For example, Sweden’s http://www.sweden.se says it is “the official gatewayto Sweden” but it is hardly targeted toward the national user; it is aimed more at exter-nal visitors. Thus, the http://www.regeringen.se/ site (http://www.sweden.gov.se inEnglish) which simply and clearly says “The Swedish Government” was considered theprime national site.
Generally, the researchers were able to identify a reliable national government site.When they could not, the country received no points for Section I - Emerging Presence.For countries without a clear national site, researchers attempted to identify some site thatcould be legitimately scored for other national government information. Purely privatesites were not included. In the final result, the few tourism or other sites that were scored
109
�

�
were deemed to provide some sort of national government information, as per theresearchers’ criteria.
C. E-Participation Index: A Note on Methodology
Qualitative analysis by definition is subjective. In the absence of impact assessmentanalysis, which requires both time and effort, a qualitative assessment can be a usefultool in assessing the “quality” of information and services provided through an e-gov-ernment initiative. It is useful in illustrating differences in on-line strategies andapproaches, illuminating nuances in seemingly objective or quantitative results, and pro-viding detail on the degree to which government services and information are providedon line. For these reasons, and ultimately to build a foundation for analysing in detailhow governments interact with the people and encourage their input on line, we haveincluded an “E-participation” Index to complement the quantitative data collected andanalysed.
The E-participation Index is segmented into three sections: E-information, E-consulta-tion, and E-decision making. These three are the qualitative equivalent of the quantita-tive web measure survey. Having identified through the quantitative review specific toolsand information, such as explicit information/guidance on e-participation; access to andarchives for government documents and databases; web-forums and formal on-line con-sultation systems; and a range of other features, E-participation scoring assesses “howrelevant and useful these features were; and how well were they deployed by the gov-ernment.”
The variations among countries were enormous. Providing such an index to comple-ment the raw data, therefore, is an important and valuable means of evaluating both theefforts of governments and the actual quality of the information and services provided.
Focusing primarily on the national site while also considering the ministry sites, theoriginal reviewers - who often had spent many hours reviewing a country’s collectivesites - completed the E-participation section of the survey for each country they reviewed(with the help of native language speakers). The reviewers were then asked to go backand refine their scoring of the E-participation section after they had completed all of theirsites. The e-participation scores were then normalized. Sites were compared to other,similar sites, and various sensitivity indexes were created from the quantitative data tohelp identify clear over- or under-scoring. Finally, “clusters” of sites that received thesame or very close scores were reviewed and compared to each other so that any vari-ations and/or similarities in scoring could be reasonably explained.
What emerged from this careful process serves as an indicator - admittedly an initialindicator, but a good one nevertheless - not only of what a country provides in terms ofe-government, but how well it promotes e-government services, and the overall qualityof e-government services and information provided.
110

Notes 1 Chen, Shaohua and Ravallion, Martin, “How Did the World’s Poor Fare in the 1990s?”, The WorldBank. http://www.worldbank.org/research/povmonitor/pdfs/how%20did%20the%20world’s%20poor-est%20fare%20in%20the%2090s.pdf2 UN Millennium Development Indicators. 3 Illiteracy rates data from UNESCO. EFA Global Monitoring Report 2002. pages 208-212.4 “Bridging the Digital Divide through Digital Governance”, Keynote Speech of Yoshio Utsumi,Secretary-General, International Telecommunication Union, to the Third Global Forum: FosteringDemocracy & Development through E-government readiness, Naples, 2001.http://www.itu.int/osg/sg/speeches/2001/09naples.html5 NUA Internet statistics. http://www.nua.ie/surveys/how_many_online/index.html6 Synthesis Report on the CSTD Panels on Technology Development and Capacity-Building in a DigitalSociety. Report of the Secretary-General. E/CN.16/2003/2. 27 February 2003. 7 “Bridging the Digital Divide through Digital Governance”, Keynote Speech of Yoshio Utsumi,Secretary-General, International Telecommunication Union, to the Third Global Forum: FosteringDemocracy & Development through E-government readiness, Naples, 2001.http://www.itu.int/osg/sg/speeches/2001/09naples.html8 “Kofi Annan’s IT challenge to Silicon Valley”, Kofi Annan, 5 November, 2002, 4:00 AM PT.http://news.com.com/2010-1069-964507.html?tag=lh9 http://www.studera.nu/english/index.shtml10 See www.teachnet.gov.uk11 See www.curriculum.edu.au12 See http://www.nks.nhs.uk/13 http://platsbanken.ams.se/
111
�

�
14 The World Bank, “E-government Readiness: Colombia Case Studies”, Colombia Government Portal.http://www1.worldbank.org/publicsector/egov/colombiaportal_cs.htm15 Ibid.16 Ibid.17 http://www.unicttaskforce.org/about/principal.asp18 The World Bank, “E-government Readiness: Sri Lanka Case Study” http://www1.worldbank.org/publicsector/egov/srilanka.htm19 http://www.healthinternetwork.org/src/millenium.php20 United Nations Millennium Declaration, September 2000 http://www.un.org/millennium/declaration/ares552e.htm. See Para III.11.21 Jerzy Szeremeta, “Benchmarking E-government Readiness: A Global Perspective”, Keynote addressto the International Congress on Government Online 2002, Canada, UN DPADM, Mimeo22 United Nations Millennium Declaration, September 2000, http://www.un.org/millennium/declara-tion/ares552e.htm23 Heeks, Richard, “Understanding E-Governance for Development” E-Government Working PaperSeries No. 11. 2001. http://www.man.ac.uk/idpm/idpm_dp.htm#ig24 For a more detailed discussion of information (explicit knowledge) and knowledge (tacit knowledge)see Chapter II of Part I of the Report. 25 See also Introduction.26 Zero=never; 1 = sometimes; 2 = frequently; 3 = mostly; and 4 = always27 Iraq is included in the 18 countries; it had an on-line presence that was discontinued after early April,2003 when the Survey assessment was undertaken.28 Regional groupings are taken from the UN Statistical Division classification. Seehttp://unstats.un.org/unsd/methods/m49/m49regin.htm 29 Nua Internet. http://www.nua.ie/surveys/how_many_online/index.html30 “Benchmarking E-government: A Global Perspective”, United Nations and ASPA, 2002, p. 35.31 “Sweden Official Policy On Citizen-Centric E Series” http://governments-online.org/projects/portals/files/Sweden.rtf.
32 Ibid.33 “Digital Governance, Building and Sustaining Democratic and Accountable Governance Structures”using ICT, http://www.cddc.vt.edu/digitalgov/gov-cases.html34 “E-Government: Considerations For Arab States”, UNDP, April 2001, pp. 8 -1135 Source: The African Internet - A Status Report, July 2002. http://www3.sn.apc.org/africa/afstat.htm36 Source: The African Internet - A Status Report. July 2002 http://www3.sn.apc.org/africa/afstat.htm37 Iraq had an on-line presence before April 2003. However its website was not on-line during the peri-od of web measurement for this Survey, from April to May 2003.38 See http://www.ghana.gov.gh/governing/egovernance/index.php39 “Digital Opportunities for All: Meeting the Challenge. Report of the Digital Opportunity Task Force(DOT Force) including a proposal for a Genoa Plan of Action”, 11 May 2001. Foreword. P 3.
112