UML Use Case Diagrams
26
UML Use Case Diagrams: Tips and FAQ Contents: What is a UML Use Case Diagram (UCD), and when should I use it? How do you know who the actors are in a UCD? How do you know what to put in the "System" box? The actors in my diagram have interactions. How do I represent them? I am trying to represent a sequence of actions that the system performs. How do I do it? How is a UML Use Case Diagram different from a traditional flow chart? When do I use the uses arrow? When do I use the extends arrow? What is the difference between uses and extends ? The scenario I want to describe branches into several possible outcomes, or has some error conditions. How can I represent that with Use Case Diagrams? What is a UML Use Case Diagram (UCD), and when should I use it? UML Use Case Diagrams can be used to describe the functionality of a system in a horizontal way. That is, rather than merely representing the details of individual features of your system, UCDs can be used to show all of its available functionality. It is important to note, though, that UCDs are fundamentally different from sequence diagrams or flow charts because they do not make any attempt to represent the order or number of times that the systems actions and sub-actions should be executed. There are a number of graphical examples in this FAQ; you might want to look over them to familiarize yourself with the look of them. UCDs have only 4 major elements: The actors that the system you
-
Upload
suchitra-gudi -
Category
Documents
-
view
117 -
download
4
Transcript of UML Use Case Diagrams

UML Use Case Diagrams: Tips and FAQ
Contents:
What is a UML Use Case Diagram (UCD), and when should I use it? How do you know who the actors are in a UCD? How do you know what to put in the "System" box? The actors in my diagram have interactions. How do I represent them? I am trying to represent a sequence of actions that the system performs. How do I do it? How is a UML Use Case Diagram different from a traditional flow chart? When do I use the uses arrow? When do I use the extends arrow? What is the difference between uses and extends ? The scenario I want to describe branches into several possible outcomes, or has some error conditions. How can I represent that with Use Case Diagrams?
What is a UML Use Case Diagram (UCD), and when should I use it?
UML Use Case Diagrams can be used to describe the functionality of a system in a horizontal way. That is, rather than merely representing the details of individual features of your system, UCDs can be used to show all of its available functionality. It is important to note, though, that UCDs are fundamentally different from sequence diagrams or flow charts because they do not make any attempt to represent the order or number of times that the systems actions and sub-actions should be executed. There are a number of graphical examples in this FAQ; you might want to look over them to familiarize yourself with the look of them.
UCDs have only 4 major elements: The actors that the system you are describing interacts with, the system itself, the use cases, or services, that the system knows how to perform, and the lines that represent relationships between these elements.
You should use UCDs to represent the functionality of your system from a top-down perspective (that is, at a glance the system's functionality is obvious, but all descriptions are at a very high level. Further detail can later be added to the diagram to elucidate interesting points in the system's behavior.) Example: A UCD is well suited to the task of describing all of the things that can be done with a database system, by all of the people who might use it (administrators, developers, data entry personnel.)
You should NOT use UCDs to represent exception behavior (when errors happen) or to try to illustrate the sequence of steps that must be performed in order to complete a task. Use Sequence diagrams to show these design features.Example: A UCD would be poorly suited to describing the TCP/IP network protocol, because there are many exception cases, branching behaviors, and conditional functionality (what

happens when a packet is lost or late, what about when the connection dies?)
Back to top
How do you know who the actors are in a UCD?
When working from an Action/Response table, itentifying the actors is easy: entities whose behavior appears in the "Actor's Actions" column are the actors, and entities whose behavior appears in the "System's Response" column are components in the system.
If you are working from an informal narrative, a sequence diagram, or a scenario description, the actors are typically those entities whose behavior cannot control or change (i.e., agents that are not part of the system that you are building or describing.) The most obvious candidates for actors are the humans in the system; except in rare cases when the system you are describing is actually a human process (such as a specific method of dealing with customers that employees should follow) the humans that you must interact with will all be actors. If your system interacts with other systems (databases, servers maintained by other people, legacy systems) you will be best to treat these as actors, also, since it is not their behavior that you are interested in describing. Example: When adding a new database system to manage a company's finances, your system will probably have to interface with their existing inventory management software. Since you didn't write this software, don't intend to replace it, and only use the services that it provides, it makes sense for that system to be an actor.
Back to top
How do you know what to put in the "System" box?
The system box only appears on the top-level diagram (remember that a typical UML Use Case description will be composed of many diagrams and sub-diagrams), and should contain use case ovals, one for each top-level service that your system provides to its actors. Any kind of internal behavior that your system may have that is only used by other parts of the system should not appear in the system box. One useful way to think of these top-level services is as follows: if a use case represents a top-level service, then it should make sense for the actors who interact with it to request only that service of your system in a single session (in whatever sense a "session" is intelligible in your system.)
Example: In the diagram below we would like to represent the use cases for a camera. Suppose we choose "Open Shutter", "Flash", and "Close Shutter" as the top-level use cases. Certainly these are all behaviors that a camera has, but no photographer would ever pick up their camera, open the shutter, and then put it down, satisfied with their photographic session for the day. The crucial thing to realize is that these behaviors are not done in isolation, but are rather a part of a more high-level use case, "Take Picture". (Note that it does make sense for a photographer to "Take Picture" just once during a session with their camera.)

Back to top
The actors in my diagram have interactions. How do I represent them?
If there are interactions between the actors in your system, you cannot represent those interactions on the same diagram as your system. What you can do instead is draw a separate UCD, treating one of the actors itself as a system, and your original system (along with the other actors) as actors on this new diagram.
Example: Suppose you wanted to diagram the interactions between a user, a web browser, and the server it contacts. Since you can only have one system on the diagram, you must choose one of the obvious "systems", such as the server. You might then be tempted to draw interaction lines between the actors, but this is a problem because it isn't clear what the interaction means, so it isn't helpful to show it here. A more useful solution would be to draw two diagrams, showing all

of the interactions, as below.
Back to top
I am trying to represent a sequence of actions that the system performs. How do I do it?

Using a UML Use Case Diagram, you can't. UCDs are meant to be a top-down, horizontal description of functionality, not a blow-by-blow desrciption of behavior. For the most part, it isn't a good idea to try to represent sequences of actions with Use Case diagrams. You should use a Sequence Diagram or a traditional flow chart instead. (It is possible to represent simple branching conditions with a UCD, as described below, but you should use this technique sparingly because it can render a diagram unreadable.)
Back to top
How is a UML Use Case Diagram different from a traditional flow chart?
As mentioned above, UCDs represent functionality in a top-down way, whereas flow charts represent behavior in a linear, time-based way. Also, the way you develop them is all-together different.
Example: (This text refers to the diagrams below.) When constructing a UCD, the initial step is to identify all of the top-level behavior. Once you have done this (not a very tricky process) you have already described, at least in a high-level way, all of the things your system knows how to do. You can then continue to add detail by decomposing your use cases into more use cases which are used by the top-level use cases. At every stage of development, though, your UCD is a complete description of the system's functionalty: it may lack detail, but it will not lack feature set elements. And if functionality or behavior is added or deleted over the life of your project, the scope of the change you need to make is proportional to both the scope of the change in the system itself, and the maturity of your model. This is useful because it means that when your model is very young (only high-level diagrams drawn) making sweeping changes to the system does not involve throwing very much work away. A flow chart, however, does not correctly describe the system until you have finished drawing it, and even then small changes in the system will result in significant reworking of your flow charts. In general, UCDs support the process of analysis and design much better than flow charts.


Back to top
When do I use the uses arrow?
The uses arrow (or uses edge as it would be called in traditional graph thoery) is drawn from a use case X to another use case Y to indicate that the process of doing X always involves doing Y at least once (although it may involve doing it many times, "at least once" is the only relationship guaranteed by this symbol.) This symbol can be referred to as an aggregation operator, because it indicates that a given use case is an aggregate (made up of parts) whose components are the use cases that it uses. If a certain use case uses several others, that means that all of the component use cases must be completed in the process of completing the aggregate use case, although there is no specification in UCDs of the order in which these are completed. A brief, mnemonic way to think about the uses arrow is that it it can be read X uses Y means that "X has a Y" as part of it's behavior.
Example: Suppose you wanted to add detail to the diagram shown below, representing an airline reservation system. First, you would create a separate diagram for the top-level services, and

then you would add new use cases that make up the top-level ones. There is a uses edge from "Check in Passenger" to "Weigh Luggage" and from "Check in Passenger" to "Assign Seat"; this indicates that in order to Check in a Passenger, Luggage must be Weighed and a Seat must be Assigned. Similarly, the diagram indicates that in order to add a reservation to the system, the available space must be checked and the passenger's information must be recorded. You could imagine breaking these use cases down further to show more detail.

Back to top
When do I use the extends arrow?
The extends arrow (or extends edge) is drawn from a use case X to a use case Y to indicate that the process X is a special case behavior of the same type as the more general process Y. You would use this in situations where your system has a number of use cases (processes) that all have some subtasks in common, but each one has something different about it that makes it impossible for you to just lump them all together into the same use case.
Example: Suppose you wanted to add detail to the diagram shown below, representing an airline reservation system. Specifically, what you would like to show is that not all of the seats aboard the airplane are exactly alike (some window and some aisle seats), and sometimes passengers will express a preference for one of these types of seats but not the other. But of course, they cannot just be given their preference right away, because the seat they want might not be available. Therefore, the process of assigning a window seat involves checking for the availability of window seats, whereas the process of assigning an aisle seat involves checking for the availability of aisle seats. But even though these processes are different, they are quite similar in a number of other ways, so it doesn't make sense to ignore their similarities. Fortunately, UML lets us have both: we write that assigning these two types of seats are different processes, but they are similar in that both processes extend a common, more general process (assigning seats.)

Back to top
What is the difference between uses and extends?
Probably the best way to think about these diagram elements is as follows:
- "X uses Y" indicates that the task "X" has a subtask "Y"; that is, in the process of completing task "X", task "Y" will be completed at least once.
- "X extends Y" indecates that "X" is a task fo the same type as "Y", but "X" is a special, more specific case of doing "Y". That is, doing X is a lot like doing Y, but X has a few extra processes to it that go above and beyond the things that must be done in order to complete Y.

Example:indicates that inorder to successfully "Check-in", you must "Weigh luggage" and "Assign a seat", some number of times, in some order. The key, though, is that all UCs used by a use case MUST BE DONE before that use case be considered to be complete. Once you realize that there are several types of seat assignment, you might be tempted to draw a diagram using the uses edge like the one below, but this doesn't make sense: This diagram says that in order to assign a seat you must assign both a window seat AND an aisle seat to the passenger. Never fear, however; this situation is correctly handled by the extends relationship. Using the extends relationship (as shown in the following diagram), we can express that there are two ways to assign a seat: assigning a window seat and assigning an aisle seat, but only one need be completed in the process of assigning the passenger a seat.
Back to top
The scenario I want to describe branches into several possible outcomes, or has some error conditions. How can I represent that with Use Case Diagrams?
Representing failure and branching conditions is often best done with a Sequence Diagram or flow chart, but there are some grey-area cases when it isn't clear whether or not a Use Case Diagram is appropriate. A rule of thumb: if in representing the branching actions in the Use Case Diagram you must add significantly more use case ovals, and the resulting diagram is muddy or confusing, consider using a different diagramming style.

With that said, it is possible to represent simple branching behavior with UCDs, although I would like to again stress that UCDs ARE NOT FLOW CHARTS. This is done by realizing that if the use case, or process that you are trying to represent can have two significantly different outcomes (success and failure, for example), then that means that you really have two different use cases: one in which the process succeeds, and one in which the process fails. Of course, these two use cases are related in that they are both extensions of the original use case, so you would draw the original use case with the two branches extending from it. I consider this almost an abuse of the meaning of the extends edge, because it really isn't being used here to represent a taxonomy of use cases (which is its purpose) but is instead taking advantage of the specific abstract definition of the relation to hack flow-chart-like behavior out of the UCD style. Again, USE THIS TECHNIQUE SPARINGLY; IT CAN QUICKLY MAKE A DIAGRAM UNREADABLE.
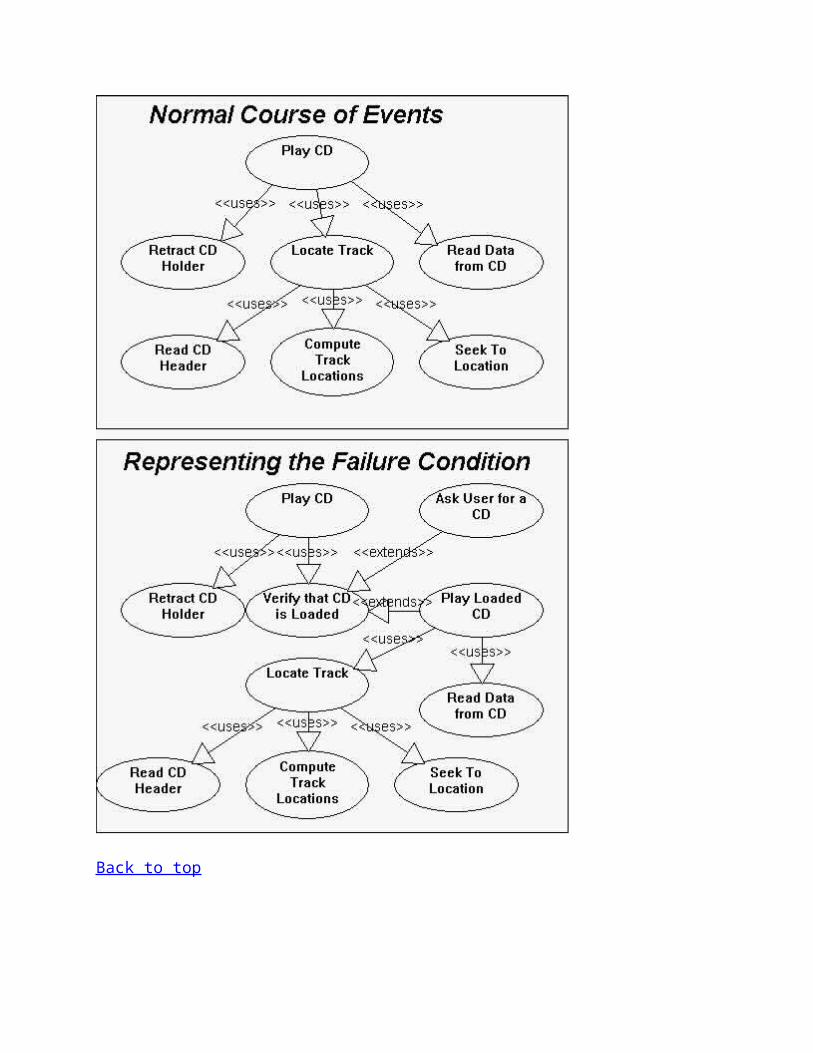
Example: Suppose that we want to represent the use cases of a normal CD player. When all goes well, the CD player retracts the tray upon which the CD sits, reads it, and starts playing. (The use case for this behavior is represented below. The top-level diagram has been omitted for brevety.) Unfortunately, some users will command the system to play a CD even when there is no CD in the tray. We therefore have a failure condition, under which the system must do something other than play the CD (namely, prompt the user for a CD.) To represent this, we modify the normal diagram with some extra use cases, in which the presence of the CD is verified. The behavior of playing the CD extends the behavior of verifying that the CD is present in that it is the special case of verifying the CD's presence in which the CD is present. The other special case of verifying the CD's presence is that this is done and the CD is not present, so the user is prompted for a CD. I will say one last time that this use of extension is a bit of a reach, but it is an elegant way to express multiple behaviors of a single use case when the number of such behaviors is small.

Back to top

There are three classifications of UML diagrams:
Behavior diagrams. A type of diagram that depicts behavioral features of a system or business process. This includes activity, state machine, and use case diagrams as well as the four interaction diagrams.
Interaction diagrams. A subset of behavior diagrams which emphasize object interactions. This includes communication, interaction overview, sequence, and timing diagrams.
Structure diagrams. A type of diagram that depicts the elements of a specification that are irrespective of time. This includes class, composite structure, component, deployment, object, and package diagrams.
Table 1 summarizes the thirteen, up from nine in UML 1.x, diagram types of UML 2.x. In the diagram column the links will take you to description pages for the artifact. The learning priority column indicates how important it is for a business application developer to learn the artifact (IMHO).
Table 1. The diagrams of UML 2.
Diagram Description Learning Priority
Activity Diagram Depicts high-level business processes, including data flow, or to model the logic of complex logic within a system. See UML Activity diagram guidelines.
High
Class Diagram Shows a collection of static model elements such as classes and types, their contents, and their relationships. See UML Class diagram guidelines.
High
Communication Diagram
Shows instances of classes, their interrelationships, and the message flow between them. Communication diagrams typically focus on the structural organization of objects that send and receive messages. Formerly called a Collaboration Diagram. See UML Collaboration diagram guidelines.
Low
Component Diagram
Depicts the components that compose an application, system, or enterprise. The components, their interrelationships, interactions, and their public interfaces are depicted. See UML Component diagram guidelines.
Medium
Composite Structure Diagram
Depicts the internal structure of a classifier (such as a class, component, or use case), including the interaction points of the classifier to other parts of the system.
Low
Deployment Diagram
Shows the execution architecture of systems. This includes nodes, either hardware or software execution environments, as well as the middleware connecting them. See UML Deployment diagram guidelines.
Medium
Interaction Overview Diagram
A variant of an activity diagram which overviews the control flow within a system or business process. Each node/activity within the diagram can represent another interaction diagram.
Low
Object Diagram Depicts objects and their relationships at a point in time, typically a special case of either a class diagram or a communication diagram.
Low

Package Diagram Shows how model elements are organized into packages as well as the dependencies between packages. See Package diagram guidelines.
Low
Sequence Diagram Models the sequential logic, in effect the time ordering of messages between classifiers. See UML Sequence diagram guidelines.
High
State Machine Diagram
Describes the states an object or interaction may be in, as well as the transitions between states. Formerly referred to as a state diagram, state chart diagram, or a state-transition diagram. See UML State chart diagram guidelines.
Medium
Timing Diagram Depicts the change in state or condition of a classifier instance or role over time. Typically used to show the change in state of an object over time in response to external events.
Low
Use Case Diagram Shows use cases, actors, and their interrelationships. See UML Use case diagram guidelines.
Medium
Source
This material has been excerpted from The Object Primer 3rd Edition: Agile Modeling Driven Development with UML 2.
Recommended Resources
Be Realistic About the UML
There are three classifications of UML diagrams:
Behavior diagrams. A type of diagram that depicts behavioral features of a system or business process. This includes activity, state machine, and use case diagrams as well as the four interaction diagrams.
Interaction diagrams. A subset of behavior diagrams which emphasize object interactions. This includes communication, interaction overview, sequence, and timing diagrams.
Structure diagrams. A type of diagram that depicts the elements of a specification that are irrespective of time. This includes class, composite structure, component, deployment, object, and package diagrams.
Table 1 summarizes the thirteen, up from nine in UML 1.x, diagram types of UML 2.x. In the diagram column the links will take you to description pages for the artifact. The learning priority column indicates how important it is for a business application developer to learn the artifact (IMHO).
Table 1. The diagrams of UML 2.

Diagram Description Learning Priority
Activity Diagram Depicts high-level business processes, including data flow, or to model the logic of complex logic within a system. See UML Activity diagram guidelines.
High
Class Diagram Shows a collection of static model elements such as classes and types, their contents, and their relationships. See UML Class diagram guidelines.
High
Communication Diagram
Shows instances of classes, their interrelationships, and the message flow between them. Communication diagrams typically focus on the structural organization of objects that send and receive messages. Formerly called a Collaboration Diagram. See UML Collaboration diagram guidelines.
Low
Component Diagram
Depicts the components that compose an application, system, or enterprise. The components, their interrelationships, interactions, and their public interfaces are depicted. See UML Component diagram guidelines.
Medium
Composite Structure Diagram
Depicts the internal structure of a classifier (such as a class, component, or use case), including the interaction points of the classifier to other parts of the system.
Low
Deployment Diagram
Shows the execution architecture of systems. This includes nodes, either hardware or software execution environments, as well as the middleware connecting them. See UML Deployment diagram guidelines.
Medium
Interaction Overview Diagram
A variant of an activity diagram which overviews the control flow within a system or business process. Each node/activity within the diagram can represent another interaction diagram.
Low
Object Diagram Depicts objects and their relationships at a point in time, typically a special case of either a class diagram or a communication diagram.
Low
Package Diagram Shows how model elements are organized into packages as well as the dependencies between packages. See Package diagram guidelines.
Low
Sequence Diagram Models the sequential logic, in effect the time ordering of messages between classifiers. See UML Sequence diagram guidelines.
High
State Machine Diagram
Describes the states an object or interaction may be in, as well as the transitions between states. Formerly referred to as a state diagram, state chart diagram, or a state-transition diagram. See UML State chart diagram guidelines.
Medium
Timing Diagram Depicts the change in state or condition of a classifier instance or role over time. Typically used to show the change in state of an object over time in response to external events.
Low
Use Case Diagram Shows use cases, actors, and their interrelationships. See UML Use case diagram guidelines.
Medium
Source
This material has been excerpted from The Object Primer 3rd Edition: Agile Modeling Driven Development with UML 2.
Recommended Resources
Be Realistic About the UML
There are three classifications of UML diagrams:
Behavior diagrams. A type of diagram that depicts behavioral features of a system or business process. This includes activity, state machine, and use case diagrams as well as the four interaction diagrams.
Interaction diagrams. A subset of behavior diagrams which emphasize object interactions. This includes communication, interaction overview, sequence, and timing diagrams.
Structure diagrams. A type of diagram that depicts the elements of a specification that are irrespective of time. This includes class, composite structure, component, deployment, object, and package diagrams.
Table 1 summarizes the thirteen, up from nine in UML 1.x, diagram types of UML 2.x. In the diagram column the links will take you to description pages for the artifact. The learning priority column indicates how important it is for a business application developer to learn the artifact (IMHO).
Table 1. The diagrams of UML 2.
Diagram Description Learning Priority
Activity Diagram Depicts high-level business processes, including data flow, or to model the logic of complex logic within a system. See UML Activity diagram guidelines.
High
Class Diagram Shows a collection of static model elements such as classes and types, their contents, and their relationships. See UML Class diagram guidelines.
High
Communication Diagram
Shows instances of classes, their interrelationships, and the message flow between them. Communication diagrams typically focus on the structural organization of objects that send and receive messages. Formerly called a Collaboration Diagram. See UML Collaboration diagram guidelines.
Low
Component Depicts the components that compose an application, system, or enterprise. Medium

Diagram The components, their interrelationships, interactions, and their public interfaces are depicted. See UML Component diagram guidelines.
Composite Structure Diagram
Depicts the internal structure of a classifier (such as a class, component, or use case), including the interaction points of the classifier to other parts of the system.
Low
Deployment Diagram
Shows the execution architecture of systems. This includes nodes, either hardware or software execution environments, as well as the middleware connecting them. See UML Deployment diagram guidelines.
Medium
Interaction Overview Diagram
A variant of an activity diagram which overviews the control flow within a system or business process. Each node/activity within the diagram can represent another interaction diagram.
Low
Object Diagram Depicts objects and their relationships at a point in time, typically a special case of either a class diagram or a communication diagram.
Low
Package Diagram Shows how model elements are organized into packages as well as the dependencies between packages. See Package diagram guidelines.
Low
Sequence Diagram Models the sequential logic, in effect the time ordering of messages between classifiers. See UML Sequence diagram guidelines.
High
State Machine Diagram
Describes the states an object or interaction may be in, as well as the transitions between states. Formerly referred to as a state diagram, state chart diagram, or a state-transition diagram. See UML State chart diagram guidelines.
Medium
Timing Diagram Depicts the change in state or condition of a classifier instance or role over time. Typically used to show the change in state of an object over time in response to external events.
Low
Use Case Diagram Shows use cases, actors, and their interrelationships. See UML Use case diagram guidelines.
Medium
Source
This material has been excerpted from The Object Primer 3rd Edition: Agile Modeling Driven Development with UML 2.
Recommended Resources
Be Realistic About the UML

Maintained by Rus Heywood