UMI - University of Victoria
246
INFORMATION TO USERS This manuscript has been reproduced from the microfilm master. UMI films the text directly from the original or copy submitted. Thus, some thesis and dissertation copies are in typewriter face, while others may be from any type of computer printer. The quality of this reproduction is dependent upon the quality of the copy submitted. Broken or indistinct print, colored or poor quality illustrations and photographs, print bleedthrough, substandard margins, and improper alignment can adversely affect reproduction. In the unlikely event that the author did not send UMI a complete manuscript and there are missing pages, these will be noted. Also, if unauthorized copyright material had to be removed, a note will indicate the deletion. Oversize materials (e.g., maps, drawings, charts) are reproduced by sectioning the original, beginning at the upper left-hand comer and continuing from left to right in equal sections with small overlaps. Each original is also photographed in one exposure and is included in reduced form at the back of the book. Photographs included in the original manuscript have been reproduced xerographically in this copy. Higher quality 6” x 9” black and white photographic prints are available for any photographs or illustrations appearing in this copy for an additional charge. Contact UMI directly to order. UMI Bell & Howell Information and Learning 300 North Zeeb Road, Ann Arbor, Ml 48106-1346 USA 800-521-0600
Transcript of UMI - University of Victoria

INFORMATION TO USERS
This manuscript has been reproduced from the microfilm master. UMI films the text directly from the original or copy submitted. Thus, some thesis and dissertation copies are in typewriter face, while others may be from any type of computer printer.
The quality of this reproduction is dependent upon the quality of the copy
submitted. Broken or indistinct print, colored or poor quality illustrations and photographs, print bleedthrough, substandard margins, and improper alignment can adversely affect reproduction.
In the unlikely event that the author did not send UMI a complete manuscript and there are missing pages, these will be noted. Also, if unauthorized copyright material had to be removed, a note will indicate the deletion.
Oversize materials (e.g., maps, drawings, charts) are reproduced by sectioning the original, beginning at the upper left-hand comer and continuing from left to right in equal sections with small overlaps. Each original is also photographed in one exposure and is included in reduced form at the back of the book.
Photographs included in the original manuscript have been reproduced xerographically in this copy. Higher quality 6” x 9” black and white photographic prints are available for any photographs or illustrations appearing in this copy for an additional charge. Contact UMI directly to order.
UMIBell & Howell Information and Learning
300 North Zeeb Road, Ann Arbor, Ml 48106-1346 USA800-521-0600


DYNAMICS OF A VERTICALLY TETHERED MARINE PLATFORM
by
Frederick Ralph Driscoll B.Eng., University of Victoria, 1994
A Dissertation Submitted in Partial Fulfilment o f the Requirements for the Degree of
DOCTOR OF PHILOSOPHY
In Interdisciplinary Studies (Department o f Mechanical Engineering and School of Earth and Ocean Science)
We accept this dissertation as conforming to the required standard
c, "Supervisor (School o f Earth and Ocean Sciences)
Dr. M. Nahon, Supervisor (Department of Mechanical Engineering)
ali. Departmental Member (Department of Mechanical Engineering)
Dr. J^^C oU ins, Outside M ^ b e r (Department of Electrical Engineering)
Dr. D. R. Yoerger, Exteriim Examiner (Department of Applied Ocean Physics and Engineering, Woods Hgle Oceanographic Institution)
© Frederick R. Driscoll, 1999 University of Victoria
All rights reserved. This dissertation may not be reproduced in whole or in part, by photocopying or other means, without the permission of the author.
u
Abstract
Rapid and high resolution motion and tension measurements were made o f a typical
vertically tethered system, a caged deep-sea ROV, while it operated at sea. The system is
essentially one-dimensional because only the vertical motions of the underwater platform
and the ship were coherent, while horizontal motions o f the platform were weak and
incoherent with any component of motion o f the ship. The natural frequency of the
system is found to be within the frequency band o f ship motion for most o f its operating
range and the platform response is weakly non-linear. This results in a vertical
acceleration o f the platform that is up to 2.2 times larger than that of the ship.
Large vertical excursions o f the ship produce momentary slack in the tether near the
platform. At the instant prior to re-tensioning, the tether and platform are moving apart
and upon re-tensioning, the inertia of the platform imparts a large strain — a snap load
— in the tether. The resulting strain wave propagates to the surface with the characteristic
speed (3870 ms'^) o f tensile waves in the tether. An extremely repeatable pattern of
echoes is detectable at each end.
Two models, a continuous (closed form) non-dimensional frequency domain model and a
discrete finite-element time domain model are developed to represent vertically tethered
systems subject to surface excitation. Both models accurately predicts the measured
response, with slightly better accuracy in the discrete version. The continuous model
shows that the response is governed by only two non-dimensional parameters. The
continuous model is invalid for slack tether and inherently unable to predict snap loads.
By slightly increasing the ship motion, the discrete model accurately reproduces the
Ill
observed snap loads and their characteristics. Discrepancies between the predicted and
measured response of the platform bring into question the concepts of a constant drag
coefficient and a constant added mass for oscillatory flow around the platform. By adding
a simple wake model to account for flow history, the error in the calculated platform
motion and tension in the tether were reduced by almost a factor of 2.
Passive ship-mounted and cage-mounted heave compensation systems were
investigated with a view to reducing the cage motion and tension in the tether. Both
systems were found to be effective and for reasonable parameters, they can reduce the
motion o f the cage and the tension in the tether by a factor of 2. Addition of either
compensation system reduced the natural frequency of the system and extended the
operating sea state of a cage ROV system. However, the characteristics of the
compensation systems must be carefully chosen or the operational problems will be
exacerbated. In particular, the natural frequency of higher modes may enter the wave
band for deeper operating depths. During extreme sea states, the cage compensated
system eliminated all snap loads.
Dr. R.^G/^tedk, ^ p e rv iso r (School of Earth and Ocean Sciences)
Dr. .M. Nahon, Supervisor (Department of Mechanical Engineering)
i. Departmental Member (Department o f Mechanical Engineering)
Dr. J.^p^oU ins, Outside M ember (Department of Electrical Engineering)
Dr. D /R . Yoerger, E;deTOal Examiner (Department of Applied Ocean Physics and Engineering, Woods Hole Oceanographic Institution)
IV
Table of Contents
Abstract ii
Table of Contents iv
List of Figures viii
List of Tables vi
Nomeclature xvi
Acknowledgements xx
1 Introduction and Motivation 1
1.1 Vertically Tethered Marine Systems................................................................... 1
1.2 Previous Work in Tethered Underwater Systems............................................... 4
1.3 Contributions of this Dissertation......................................................................... 7
1.4 Dissertation Organisation....................................................................................... 10
2 Motion Observations 12
2.1 Data Acquisition and Processing ......................................................................... 15
2.2 Wave-Frequency Motion Observations............................................................... 17
2.3 Snap L oads.............................................................................................................. 19
2.4 D iscussion............................................................................................................... 20
3 Continuous Model 22
3.1 Analytical Model .................................................................................................... 22
3.2 Predictions and Discussion ................................................................................... 25
4 Finite-EIement Lumped-Mass Model 29
4.1 Model Development .............................................................................................. 29
4.2 Model Predictions and R esults.............................................................................. 31

V
4.3 Discussion.................................................................................................................. 34
5 Ship and Cage-M ounted Passive Heave Com pensation 35
5.1 Heave Compensator Design and Numerical Implantation................................. 35
5.2 Results......................................................................................................................... 37
5.3 Discussion................................................................................................................... 39
6 Conclusions and Future W ork 41
6.1 Suggestions for Future W o rk .................................................................................. 44
References 47
A ppendix 52
A The Motion of a Deep-Sea Remotely Operated Vehicle System.
Part 1 : Motion Observations 52
B The Motion of a Deep-Sea Remotely Operated Vehicle System.
Part 2: Analytical Model 110
C Development and Validation of a Lumped—Mass Dynamics
Model of a Deep>-Sea ROV System 148
D A Comparison Between Ship—Mounted and Cage—Mounted
Passive Heave Compensation Systems 184
E Discretization of the Tether Equation 221

VI
List of Tables
4.1 Values of the model coefficients estimated using motion and tension
measurements o f the ROPOS ROV system................................................................... 32
Appendix A
1 Description o f the instrumentation used to measure the motion of the ship and
cage and the tension in the umbilical tether................................................................... 89
2 Overview o f the data.......................................................................................................... 90
3 List of the depth and duration of the motion records for stationary operation,
excluding records for operation at the terminal depth.................................................. 91
4 Summary o f the motions for a 5 000 s record of the system operating near
1730 m................................................................................................................................. 92
5 Summary o f the large motions recorded during 8 snap loads...................................... 93
6 Coherency and relative coherent variance between ship-cage variable pairs 94
Appendix B
1 The calculated and measured natural frequency ( ) and its second ( ) and
third ( / j ' ) harmonics for several depths.........................................................................
2 Percent changes in the predicted natural frequency and its second and third
harmonic for ± 25% variations in the non-dimensional parameters ^ and ^ .......... 138

vu
Appendix C
1 Values of the model coefficients estimated using motion and tension
measurements o f the ROPOS ROV system.................................................................... 177

V Ill
List of Figures
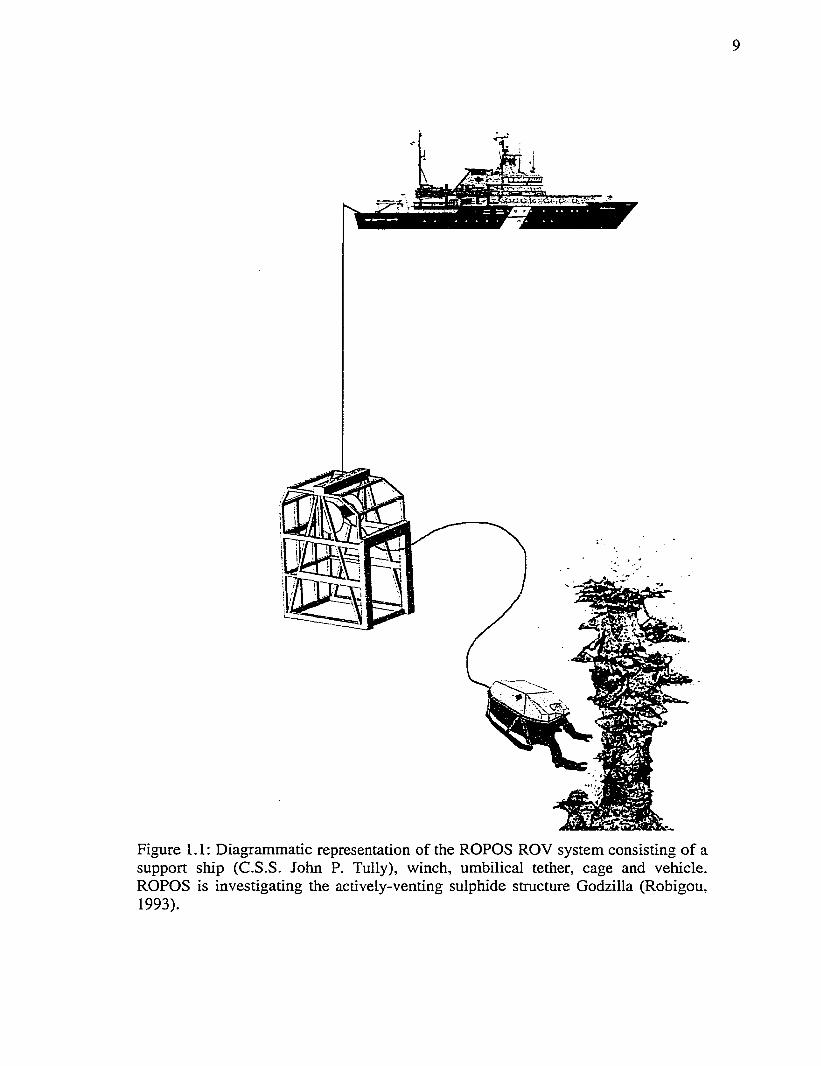
1.1 Diagrammatic representation of the ROPOS ROV system consisting of a
support ship (C.S.S. John P. Tally), winch, umbilical tether, cage and vehicle.
ROPOS is investigating the actively-venting sulphide structure Godzilla................ 9
2.1 Forward and deck views of the C.S.S. John P. Tally. The ROV, cage and A—
frame are shown in the deck view................................................................................... 13
2.2 ROPOS in the cage during a launch from the R/V So/mg........................................... 14
2.3 The ROPOS remotely operated vehicle.......................................................................... 14
2.4 A cross-section of the tether used in the ROPOS ROV system................................ 15
2.5 Body-fixed and inertial (earth-fixed) reference fram es.............................................. 16
Appendix A
1 Diagrammatic representation of a typical deep sea ROV system consisting of a
support ship, winch, umbilical tether, cage and vehicle.............................................. 95
2 Conceptual diagram of the Ocean Data Acquisition System used to measure the
motions of a deep sea ROV system. The arrows represent the flow of
instructions to, and data from, the instruments. Each white block represents a
group of components performing a specific task (measuring, processing,
transmission etc.)................................................................................................................ 96
3 Flow chart of the processing of the tri-axial accelerometer signals. The signals
are first transformed from the instrumentation body-fixed frame to the inertial

IX
frame using an Euler angle transformation. The Euler angles are solved
iteratively. The gravitational “contamination” of the acceleration signals is
removed and the resulting signals are integrated to yield velocity and position 97
4 Spectra of the inertial acceleration records of the ship (a) and cage (b) at a depth
of 1 730 m. The wave-band (horizontal bar in (a)) contains 95% of the variance
of vertical ship acceleration. The arrows are the spectral gap (a), the 3" and 5'*’
harmonic of the peak cage motion (b) and the natural frequency ( / j ) (b)............... 98
5 Vertical acceleration (a), velocity (b), and position(c) o f the ship and cage at
1 730 m. The motion records at the two locations are very similar and the cage
motions are larger and lag those o f the ship. To make viewing of the figure more
intuitive, the y-axes have been flipped.......................................................................... 99
6 Transfer function estimate (a) and phase (b—left axis) between ship and cage
motions estimated from the acceleration records at 1 730 m. In (b), the thin line
is a 5^"'-order polynomial fit to the frequency, using phase as the independent
variable. The thick line is the time-lag (right axis) between the ship and cage
acceleration...........................................................................................................................100
7 Same as Figure 6, but for 975 m depth ............................................................................ 101
8 Records of tension, vertical acceleration , vertical position Z and pitch 6 ,
during a typical snap load. The snap load is identified by the large spikes (jerks)
in the acceleration of the cage and rapid changes in the tension. Thin and thick
lines are measurements at the ship and cage, respectively..........................................
9 Acceleration records of 8 snap loads overlaid, using the first jerk for alignment.
X
The second and later jerks are remarkably well aligned and spaced by 0.9 s 103
10 Jerk at the cage (a) and time derivative of the tension (b) records for 8 snap
loads overlaid, using the first je rk for alignment........................................................... 104
11 Ensemble average of the 8 jerk records (thin line, left axis) and the 8 tension
derivative records overlaid (thick line, right axis). The peaks of these records are
spaced at 0.445 s.................................................................................................................105
12 The magnitude (a) and phase (b) of the transfer function estimated between the
vertical ship and cage motions during the 8 snap loads................................................ 106
13 High-frequency acceleration (a) and position (b) of the cage during a snap load.
The motion records were high—pass filtered at 0.8 Hz to remove the low -
frequency content. The motion is much larger than for typical operation and
occurs predominately at 1.17 Hz (the 2"* harmonic of the natural frequency) 107
14 X (a) and Y (b) and Z (c) positions of the ship and cage for typical operating
conditions at I 730 m. The thin (thick) Line is the motions of the ship (cage) 108
15 Matrix of coherencies between all combinations of linear and angular
acceleration records of the ship and cage, within the wave-band. The largest
coherency is between the vertical accelerations of the ship and cage, A | — ....... ^09
XI
Appendix B
1 Coherency, F ' , between the vertical acceleration records of the ship and cage
for several depths as a function o f frequency (non-dimensionalized by depth and
the speed of tensile waves in the tether).......................................................................... 139
2 The magnitude (a) and phase (b) o f the transfer function between ship and cage
motions estimated from the data (stars) and calculated by our model (thin solid
lines) for operation at 1 730 m. The time-lag between the ship and cage
acceleration (right axis) estimated from the data (thick dots) and calculated by
our model (thick solid line) are also shown in (b)..........................................................140
3 Same as Figure 2, but for 975 m depth..............................................................................141
4 The magnitude of the transfer function between ship motion and tension in
tether (at the ship) estimated from the data (stars) and calculated by our model
(solid line) for operation at 1 730 m................................................................................. 142
5 Same as Figure 4, but for 975 m depth............................................................................. 143
6 Amplitude and frequency of ship motion at which the tether will go slack. The
tether is taut (slack) in the region to the left (right) of the solid lines. The shaded
square contains 99% of the measured amplitude, Y, in the wave-band....................144
7 Sensitivities of the magnitude (a) and phase (b) of the transfer function between
ship and cage motion to changes in the non-dimensional variable ^ for
operating depths of 975 (upper and right axes) and 1 730 m (lower and left
axes)....................................................................................................................................... ‘ 3
XII
8 Sensitivities o f the magnitude (a) and phase (b) of the transfer function between
ship and cage motion to changes in the non-dimensional variable Ç for
operating depths o f 975 (upper and right axes) and 1 730 m (lower and left
axes)......................................................................................................................................
9 Sensitivities of the magnitude o f the transfer function between ship motion and
tension in the tether (at the ship) to changes in the non-dimensional variable
^ (a) and Ç (b) for operating depths of 975 (upper and right axes) and I 730 m
(lower and left axes)...........................................................................................................
Appendix C
1 Diagrammatic representation of the ROPOS ROV system consisting of a
support ship (C.S.S. John P. Tully), winch, umbilical tether, cage and vehicle.
ROPOS is investigating the actively-venting sulphide structure Godzilla............... 178
2 Short time series of calculated (thick line) and measured (thin line) cage motion
and tension in the tether for the system at 1 730 m. The ship motion (dotted line)
is included for comparison................................................................................................. 179
3 Spectra of actual (thin solid line) and model calculated (dotted line - without
wake, thick solid line — with wake) vertical acceleration records of the cage at a
depth of 1 730 m. The arrows are the 3rd and 5th harmonic of the peak cage
motion and the natural frequency......................................................................................180
4 Magnitude (a) and phase (b) of the actual (stars) and calculated (dotted line —
without wake, solid line — with wake) transfer function estimate between the

X Ill
ship and cage motion at a depth of 1 730 m................................................................... 181
5 Sensitivities of the magnitude (a) and the phase (b) o f the transfer function
between ship and cage motion to changes in M^c (thin solid line), (dashed
line), and EA (thick solid line) for operating depth of 1 730. The dotted line is
the difference between the actual and simulated TFE..................................................
6 Measured (thin line) and calculated (thick line) records of the tension in the
tether at the A—ftame (a) and acceleration of the cage (b) during a snap load 183
Appendix D
1 Diagrammatic representation of a cage mounted heave compensation system at
full extension, half extension and full retraction........................................................... 209
2 The spring force versus compensator displacement for the cage-mounted
pneumatic passive compensator for k = 0.2 (think line) and k = 0.4 (thin line).. .210
3 The measured (solid Une) and model calculated (dashed line) position of the
cage (a) and tension in tether at the ship (b). To make viewing more intuitive,
the y-axis of (a) has been flipped....................................................................................211
4 Diagrammatic representation of the finite-element lumped-mass model. The
compensators (when included) are represented by the elements enclosed by the
dashed lines......................................................................................................................... 212
5 Short time series of the cage (a) and tension in tether at the ship (b) for the
uncompensated system, for the system with ship-mounted compensation and for
XIV
the system with cage-mounted compensation............................................................... 213
6 The rms reduction ratio for the position of the cage (a) and the tension in the
tether at the ship (b) are plotted for ship-mounted (dashed lines) and cage-
mounted (solid lines) compensation systems................................................................. 214
7 Spectra (a) and variance preserving spectra (b) of the acceleration of the cage at
a depth of 8 200 ft (2 500 m). Values for the uncompensated system (solid line),
the cage-mounted (dashed line) and ship-mounted (dotted line) compensated
systems = 16.4 ft (5 m) are overlaid for comparison............................................. 215
8 The magnitude (a) and phase (b) of the transfer function between ship and cage
motion estimated from the position records for operation a t 8 200 ft (2 500 m).
Estimates for the uncompensated system (solid line) and for the cage (dashed
line) and ship (dotted line) compensated system with A^ = 16.4 ft (5 m) and are
overlaid for comparison.................................................................................................... 216
9 The minimum (a), maximum (b) and total travel (c) o f the cage-mounted
(dashed line) and ship-mounted (dotted line) compensation systems....................... 217
10 The tension in the tether at the ship (a) and the acceleration of the cage (b) for
the uncompensated system (solid line), cage compensated system (dashed line)
and ship compensated system (dotted line)for = 14.4 ft (4.4 m)...................218
11 The tension in the tether at the ship (a) and the acceleration of the cage (b) for
the uncompensated system (solid line), cage compensated system (dashed line)
and ship compensated system (dotted line)for = 21.7 ft (6.6 m)...................219
XV
12 Time derivative of the acceleration of the cage (jerk) for the uncompensated
system (solid line), cage compensated system (dashed line) and the ship
compensated system (dotted line) for = 21.7 ft (6.6 m)..........................................220
XVI
Nomeclature
I = ]jC Y z Y inertial reference frame with co-ordinates defined in Figure 2.5
ÿC _ j’ c yC cage-fixed reference frame with co-ordinates defined in
Figure 2.5
^ 5 —j'^i yS Ship-fixed reference frame with co-ordinates defined in
Figure 2.5
Lfg rotation matrix used to transform vectors to the inertial frame
Tg transformation matrix from angular rates to Euler rates
translational acceleration vector, including gravitational
acceleration, in the inertial frame
translational acceleration vector, including gravitational
acceleration, in a body frame
translational acceleration vector in the inertial frame
translational acceleration vector in body frame
angular acceleration vector in inertial frame
angular acceleration vector in body frame
Euler angles
position vector from the cage centre of gravity to the sensor
mounting point
position vector from the point of minimal vertical acceleration
of the ship to the instrumentation mounting point on the A -
frame
S' = [O 0 gravitational acceleration
C^x or Cy auto-specturm of some signal X
CxY cross-spectrum of signals X and Y
transfer function between signals X and Y
a ' = [a; < <ra = [a . .v
« y
a = [ a _. ^ y
£0 = [c U ^ £Uy
P =[<t> e y r f
MPr r r ‘
j ^ C R -M P—
-M P n C R
x v u
coherency of signals X and Y
a standard deviation of signal X
A cross-sectional area of tether
cross-sectional area of cage
Ap area of piston
a vertical acceleration (discrete model)
p. boundary condition for the continuity of strain for element i
Cp non-dimensional cage quadratic drag coefficient
Cpp non-dimensional tangential drag coefficient of tether
Cpj linear damping coefficient o f compensator
drag coefficient of cage
linearised drag coefficient of cage
c speed of sound (tensile waves) through the tether
D diameter of the tether
Ag static equilibrium position of compensator
Ay total compensator travel
S compensator displacement
f t h time-dependent coefficient of the trial solution for
element i
E equivalent Young’s modulus
£ local strain in the tether
F hydrodynamic force on tether
f i f th natural frequency (continuous model)
f i hydrodynamic, gravitational, and buoyancy force on element i
(discrete model)
/„ c compensator force
xvm
(p. y j ’th shape function of element i
y phase between the vertical motion o f the ship and age
j imaginary unit
k fractional tension range of compensator
L unsti etched length of tether
/; unstretched length of tether element i
M mass of the cage (continuous model)
M^a mass of the cage (discrete model)
Mggy mass of the ROV (discrete model)
m mass per unit length of the tether
N number of elements in discrete model
n ratio of specific heats of compensator gas
P pressure of gas in pneumatic compensator,
pressure of gas in pneumatic compensator at equilibrium
Pc density of the tether,
density of sea water
R reduction ratio
5^ significant A-frame displacement
s vertical unstretched co-ordinate of the tether
T tension in the tether
T ' = sum of the non-dimensional static and dynamic tension
Tension in tether at the compensator
t time
T time lag between the vertical motion of the ship and cage
U ' = v' + w' sum of non-dimenstional static and dynamic displacement
((j ) standard deviation of cage velocityV f / nnx
XIX
u local displacement of the tether (continuous model)
I f velocity o f the tether (discrete model)
II cumulative elastic displacement o f tether
U. approximate elastic displacement of element i
V volume of gas in pneumatic spring
accumulator volume
W weight minus buoyancy of tether per unit length
W(-(; weight minus buoyancy of cage
weight supported by compensator
Q c filter cu t-off frequency
(Û angular frequency
(ÛI V th natural frequency
Y amplitude o f ship displacement
critical amplitude of ship displacement at which the tether goes
slack
^ ratio of drag force on cage to elastic force in the tether
Ç ratio of cage to tether mass
Z position o f top of the tether
z vertical location of a point in the tether
derivative o f () with respect to X
^ time derivative
y ’> upper node (discrete model)
y-' lower node (discrete model)
cage
ship

XX
Acknowledgements
Thank you, Lisa, for your patience, understanding and love. I appreciate your
understanding when I had to stay late at the University or when I locked myself in the
back room to complete this work. Your love kept me smiling and sane during the last
stages when I felt I was making no progress.
Thank you, Meyer and Rolf for being outstanding supervisors. Your different
perspectives have balanced my research so that I addressed problems from both
engineering and physics standpoints. Rolf, thanks for the hunting trips where we solved
differential equations and fishing trips where we examined the basic physical
oceanography of the Strait of Juan de Fuca. Meyer, thank you for pushing me through
and keeping me focused.
Thank you, Jim McFarlane and the staff of International Submarine Engineering (ISE)
for your continual support and assistance in this project. Jim, you are very inspiring and I
consider you one of my mentors.
Thank you, John Garrett, Kim Juniper, Steve Scott, Keith Shepherd, Bob Holland,
Captain Anderson and crew of the CSS John P. Tully for graciously providing access to
the ROPOS ROV system and berthing during the experiment.
I am also very grateful for the financial support provided by the Science Council of
British Columbia (SCBC), ISE and the Natural Science and Engineering Research
Council (NSERC). The project would not have possible without your contributions, thank
you.

Chapter 1
Introduction and Motivation
1.1 Vertically Tethered Marine Systems
The ocean is a hostile environment that is inaccessible to humans without support
equipment. Initial access to the deep ocean was facilitated by diving bells which limited
the occupants to locahsed observations. As technology advanced, more effective means
of working at large depths emerged, including: autonomous underwater vehicles,
submersibles, and tethered platforms. All these systems are complementary and provide
humans with the ability to explore and work in the world’s oceans.
Vertically tethered systems are an important subclass o f tethered vehicles that
provide safe and effective access to the ocean. Vertically tethered systems manifest
themselves in many forms which range from small hydrophones and
conductivity/temperature/depth instrumentation (CTDs), which can be lowered from
small research vessels and helicopters, to large piston coring tools and Remotely
Operated Vehicles (ROVs), which require large support vessels. These systems have
many applications, including scientific exploration of deep ocean phenomena; assembly,
inspection and repair of undersea structures; and dangerous military operations. All
vertically tethered systems consist o f an underwater platform that is connected to the
support vessel by a flexible tether. In most tethers, layers of steel armour house an inner
core of electrical and optical conductors that are used to power and communicate with the
supported undersea platform.
The virtue of tethered systems is their ability to perform dangerous tasks in the
hostile deep-sea environment while their human operators remain safely onboard the
support vessel. In addition to safety issues, tethered systems have many advantages over
other manned systems and divers. In particular, tethered systems can stay at the
underwater work site indefinitely because their power is supplied by the support vessel,
and the crew can be rotated without recovering the system. W hile the tether provides
many advantages, it is also the greatest disadvantage because it couples the ship motion
to the undersea unit. As a result, operation in rough seas may result in slack tether and
large ‘snap’ loads — a large strain wave that is induced in the slack tether when it is
rapidly re-tensioned — which can cause structural damage to the tether (umbilical cable)
and its internal electrical and optical conductors. The resulting degradation reduces the
life of the cable and endangers the recovery of the underwater platform. With damaged
conductors, communication and power to the underwater system is cut off and the system
becomes inoperable. Additionally, snap loads can jerk the undersea platform and damage
its instrumentation and other delicate parts. Large vertical displacements of the platform
can also occur when operating in rough seas which may degrade the quality of
measurements and make landing on the ocean floor difficult. In the case of an ROV
system, the vehicle is loosely attached to a large cage at the end of the tether. The ROV
remains vertically stationary in the water while the cage oscillates rapidly and this makes
docking difficult, if not impossible.
Examples of the problematic dynamic characteristics o f vertically tethered
systems are common. For example, during a two week expedition in rough weather, the
ROPOS (Remotely Operated Platform for Oceanographic Science) ROV (an International
Submarine Engineering Hysub 5000, ISE 1998) only logged five hours o f operation; its
main umbilical tether had to be re-terminated because the optical conductors were broken
by many snap loads; and the tether connecting the cage and ROV was sheared during a
docking attempt due to the large vertical motion of the cage. This damage was costly but
the down time resulting from the limited operating window is much more expensive. In
this case, the five hours of operation cost approximately $280,000. On a larger scale, drill
ships are more expensive to operate and operators can lose millions of dollars on a single
well due to down time resulting from rough operating conditions.
Clearly, knowledge of the dynamic characteristics o f vertically tethered systems
are needed to predict safe operating conditions and to design dynamically well-behaved
systems. However, intuitive understanding of vertically tethered systems is difficult
because the tension and motion are transmitted as a strain wave with finite and
frequency-dependent speed along the tether (only when taut) and the undersea platform
is subject to non-linear drag and added mass. Experimental measurements and analytic
models can provide this knowledge.
Although we may be able to design tethered systems that effectively operate in
normal sea conditions, storms can develop quickly and rapidly increase the sea state.
Operating in rough conditions may be unavoidable because tethered systems can take
many hours to recover when working at large ocean depths. Therefore, it is necessary to
develop mechanisms that uncouple the motions of the ship from the undersea platform
because this would increase the maximum operating sea state and provide safe recovery
in the event of extreme weather.
1.2 Previous Work in Tethered Underwater Systems
Experimental measurements are the most reliable but the most costly method of
quantifying the dynamic characteristics of vertically tethered systems. Measurements of
vertically tethered systems are uncommon and limited to the pressure and tension records
of CTDs (Garrett, 1994) and acceleration and rate gyro records o f diving bells and
submersibles during launch and recovery (Mellem, 1979). Measurements o f other
tethered systems are more common. Some excellent examples are Grosenbaugh (1996)
who measured the motion and tether tension of a deeply moored buoy and Yoerger et al.
(1991) and Hover and Yoerger (1992), who measured the motion of a deeply towed
underwater vehicle system. I did not find any work that uses motion and tension
measurements to perform a fundamental analysis of the dynamics o f the tether that
couples the surface ship and undersea platform during operation in typical and rough
seas.
In comparison with experimental measurements, analytic models provide a less
costly and more versatile method of quantifying the characteristics o f dynamic systems.
Two different modelling techniques are available to predict the response of tethered
systems — continuous (closed-form analytical) and discrete models. Continuous models
can provide quick estimates of many of the dynamic characteristics of tethered systems,
including motion and tension spectra, transfer functions, the natural frequencies, and the
onset of slack in the tether. Both Niedzwecki and Thampi (1991) and Huang and
Vassalos (1995) used a single degree-of-freedom model to characterise the response of a
vertically suspended mass to sinusoidal forcing. These simple models provide a first
order approximation to vertically tethered systems but they ignore the mass of the tether

(drill string in the case of Niedzwecki and Thampi (1991)) which is an important factor in
the response of the system. In an earlier publication Niedzwecki and Thampi (1988) also
derived a set of closed form solutions to a series of equations that represent a heave-
compensated, multi-segment drill string. This model included the drill sting mass, but
used a computational double sweep recursive process to calculate the response. An
analytical model with a single closed form solution that includes the mass of the tether
would be useful because it would provide a quick (non computational) tool to accurately
predict the response of vertically tethered systems.
Continuous models are effective tools but they have limitations. Equivalent
linearization techniques are used to approximate the quadratic drag for steady amplitudes
which enables closed form solutions and ffequency-domain analysis (Caughey 1963; and
Grosenbaugh 1996). Thus, these models are not appropriate when the sea state is time
dependent (non-stationary). Continuous models are also invalid for a slack tether, which
is the precursor to snap-loads, and it is difficult (if not impossible) to solve the
differential equations governing a tether when its properties are length dependent.
Discrete models are not necessarily constrained by these limitations and they are valid for
a wider range of operating conditions and system configurations. For example, they can
encompass non-linear properties, such as quadratic drag, temporally/spatially varying
properties, and different slack and taut tether representations. Additionally, a discrete
implementation can be quickly assembled to model multi-component systems connected
by tethers with different properties. Components, such as ROV cages, weights/floats, and
intermediate platforms can be easily added because they are each represented as a point

6
mass and the hydrodynamic, gravitational and buoyancy forces acting on them are
described by one differential equation.
Niedzwecki and Thampi (1991) developed a discrete multi-segment lumped—
parameter representation of a drill string connecting a ship to a subsea package and used
it to investigate snap loading. Driscoll and Biggins (1993) used a similar lumped
parameter model to perform a preliminary study of a caged ROV system. Although
discrete models of strictly vertical system are rare in the literature, discrete models of
towed systems are more common and their axial equations of motion are similar to those
of vertically tethered systems (Sanders, 1992, Ablow and Schechter 1983, and Hover et al
1994).
Both continuous and discrete representations do not model all the dynamic
processes acting in/on vertically tethered system and both use simplifying assumptions
(linearization, constant drag and added mass coefficients, linear elasticity, straight
elements, etc.) to reduce the complexity of predicting the response. Thus, validation
against experimental data is necessary to prove accuracy. However, validation of the
predicted axial response of these systems against data is virtually non-existent. A
refreshing example is Grosenbaugh, 1996, who compared motion and tension
measurements of a long vertically tethered surface mooring with his continuous model.
The model was accurate but its lower boundary condition is fixed and the mooring
system is therefore different from vertically tethered systems. Clearly, a fundamental
validation of the models of vertically tethered systems would prove their usefulness and
identify their limitations.

To solve the problems o f operation in rough seas outlined in the previous section,
both continuous and discrete models have been used to investigate and design ship-
mounted heave compensation systems to uncouple the ship and cage motions. Much
effort has been devoted to the design of actively controlled heave compensation (HC)
systems to reduce the heave motion and dynamic tension of drill strings and tethered
systems (Korde, 1998, Kirstein, 1986, Bennet and Forex, 1997, Gaddy, 1997). For active
systems to work well, the dynamic characteristics of the overboard system must be
accurately known so that depth dependent gains are chosen appropriately. Additionally,
active systems are complicated and require significant support equipm ent Passive ship-
mounted heave compensation systems have also been examined because they provide a
simpler design but they have received less attention. Both Hover et al., 1994 and
Niedzwecki and Thampi, 1988 present excellent analyses of passive systems. Hover
investigated a ship-mounted system for a deeply towed body by varying the values of the
compensator’s linear stiffness and damping over a range of sea states at a single operating
depth. Both works show that a poorly chosen stiffness of the compensator can increase
both the displacement of the platform and the tension in the tether. No work as been
found that investigates the effectiveness of a bottom mounted heave compensation
system.
1.3 Contributions of this Dissertation
The purpose of my work is to further the field of vertically tethered underwater
systems by providing:
a fundamental understanding and characterisation of the dynamics of vertically tethered system;

• a set of accurate and validated mathematical tools to help predict and understand the response to ship forcing; and
• a numerical implementation of a passive heave compensator and an investigation o f its effectiveness for different operating parameters and mounting locations.
One vertically tethered system that was readily available for investigation was the
ROPOS deep sea ROV system (Figure 1.1). This ROV is dynamically similar to most
tethered systems and suffers from all o f the operational problems. Therefore, ROPOS is
used as a case study in my research.
The first contribution is achieved by analyzing rapid and high resolution motion
and tension measurements of ROPOS. Both temporal and frequency domain techniques
were used to extract the fundamental dynamic characteristics, such as the natural
frequencies and the magnitude and phase of the platform response, from the data.
Additionally, several snap loads were measured and this provided sufficient evidence to
determine the cause and major characteristics of such loads.
For the second contribution, I develop and validate a continuous non-dimensional
model (which includes the mass o f the tether and has a single closed form solution) and a
finite-element lumped-mass model o f a vertically tethered system. The continuous
model is used to provide quick and accurate predictions o f the response of the undersea
platform and tension in the tether. As well, a discrete model is developed because it is
more versatile than the continuous model and has a larger range of validity, including
slack tether. Both representations are developed using widely accepted equations for
visco-elastic tethers and in the finite-element model, a standard discretization method is
vl^'i
Figure 1.1: Diagrammatic representation of the ROPOS ROV system consisting of a support ship (C.S.S. John P. Tully), winch, umbilical tether, cage and vehicle. ROPOS is investigating the actively-venting sulphide structure Godzilla (Robigou, 1993).

1 0
applied to the tether equations. Each model is formally validated against the
experimental measurements.
In the third contribution, I develop a discrete representation of a passive heave
compensator. This discrete representation is used in my finite-element model to
investigate both ship-mounted and cage-mounted heave compensation systems over a
large range of compensator stiffness and operating depth. Fundamental characteristics
such as the natural frequencies and transfer functions are used to evaluate and
characterise the effectiveness of the compensators at attenuating platform motion and
tension in the tether. Additionally, the performance of the compensated systems are
quantified for extreme operating conditions.
1.4 Dissertation Organisation
My contributions are contained in four logically progressing papers which are
entitled:
• The Motion of a Deep-Sea Remotely Operated Vehicle System. Part I:Motion Observations (Driscoll et al, 1999a);
• The Motion of a Deep-Sea Remotely Operated Vehicle System. Part 2: Analytical Model (Driscoll etal, 1999b);
• Development and Validation of a Lumped—Mass Dynamics Model of a Deep- Sea ROV System (Driscoll et al, 1999c); and
• A Comparison Between Ship-Mounted and Cage-Mounted Passive Heave Compensation Systems (Driscoll et al, 1999d).
These papers are contained in appendices A, B, C and D, respectively. The body of this
dissertation is divided into four chapters. Chapters 2 to 5, which correspond to each of the
appendices and explain the methods and procedures used, my contributions, and provide

11
the relationships between these papers. In chapter 6, the findings and contributions are
summarised and I discuss the outstanding problems and make recommendations for
future work.
1 2
Chapter 2
Motion Observations
The lack of data and the need to understand the dynamic characteristics of real
tethered systems led to an extensive field test in which we measured the motion and
tension o f the ROPOS ROV system. Motion and tension data were collected while the
system operated over the Juan de Fuca Ridge, approximately 200 km off the coast of
British Columbia, Canada. Measurements were made for five dives and included
deployment (descent to bottom), recovery (ascent to ship) and near bottom operation. The
maximum depth was 1 765 m and sea conditions were moderately rough. Typical vertical
displacements of the sheave were 2 m, peak-to-peak, and several intervals of calm and
rough seas led to displacements of 1 and 4 m, peak-to-peak, respectively (Appendix A,
Section 4).
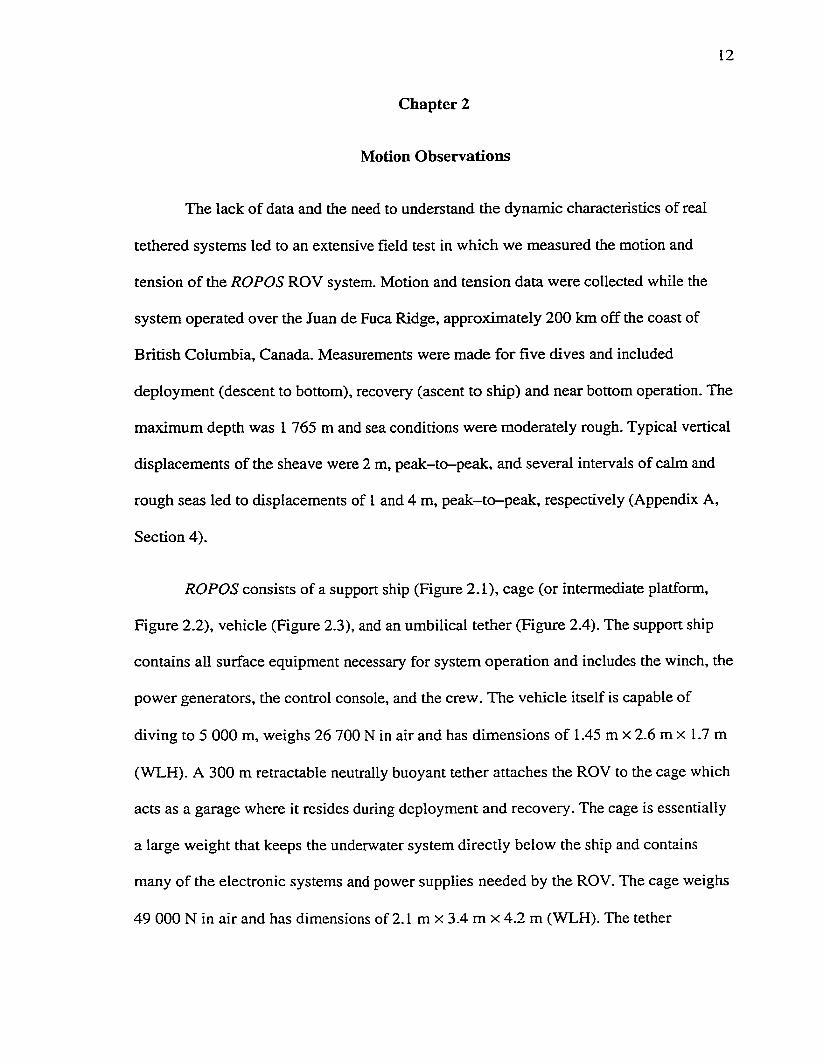
ROPOS consists of a support ship (Figure 2.1), cage (or intermediate platform.
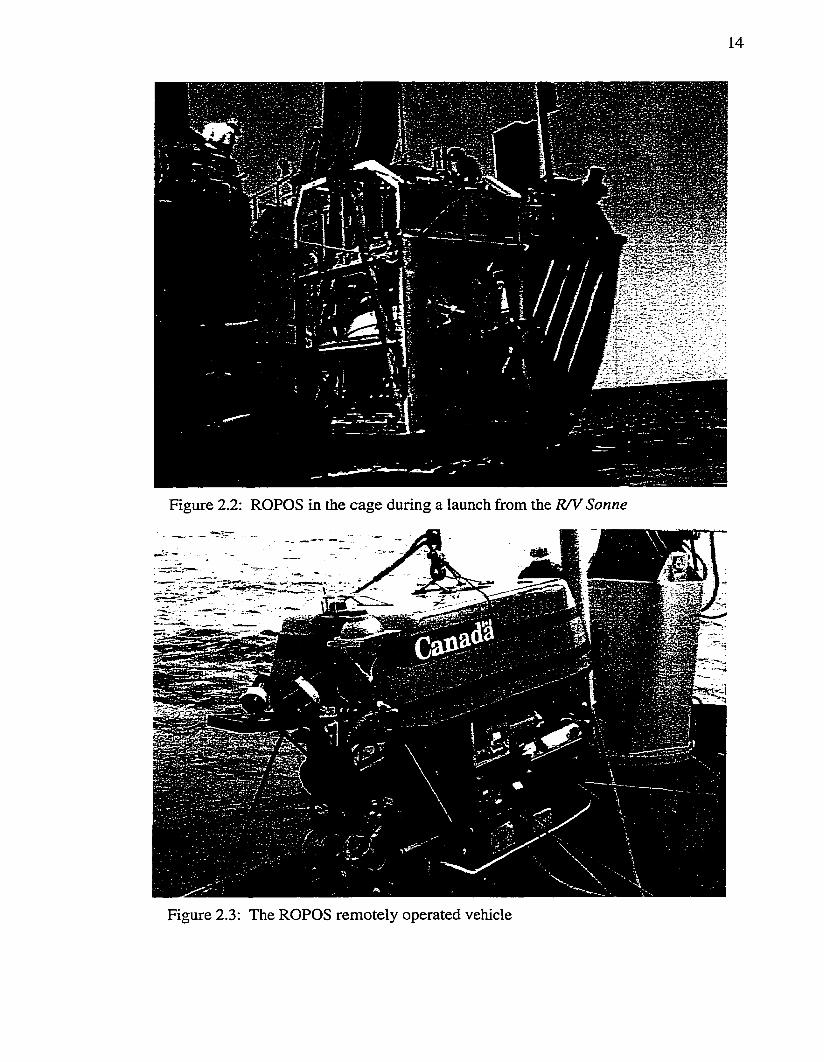
Figure 2.2), vehicle (Figure 2.3), and an umbilical tether (Figure 2.4). The support ship
contains aU surface equipment necessary for system operation and includes the winch, ± e
power generators, the control console, and the crew. The vehicle itself is capable of
diving to 5 000 m, weighs 26 700 N in air and has dimensions of 1.45 m x 2.6 m x 1.7 m
(WLH). A 300 m retractable neutrally buoyant tether attaches the ROV to the cage which
acts as a garage where it resides during deployment and recovery. The cage is essentially
a large weight that keeps the underwater system directly below the ship and contains
many of the electronic systems and power supplies needed by the ROV. The cage weighs
49 000 N in air and has dimensions of 2.1 m x 3.4 m x 4.2 m (WLH). The tether

13
connecting the ship and cage has three layers of steel armour surrounding a core of
electrical and optical conductors. The tether is 3 cm in diameter, 4 200 m long, weighs
30.5 N m '\ and has a maximum working load and breaking strength of 200 000 N and
550 000 N, respectively.
w w rnntn
Figure 2.1: Forward and deck views of the C.S.S. John P. Tully. The ROV, cage and A-frame are shown in the deck view.
14
« 1 5
Figure 2.2: ROPOS in the cage during a launch from the R /V Sonne
Figure 2.3: The ROPOS remotely operated vehicle

15
PowerConductors
OpticMatrix
SignalConductors
ArmourFigure 2.4: A cross-section o f the tether used in the ROPOS ROV system.
2.1 Data Acquisition and Processing
We wanted to measure the motion of the tether at the ship, the motion of the cage
and the tension in tether. Therefore, we instrumented the top of the ship’s A-frame
(directly above the sheave that supports the tether) and the top of the ROV cage with tri
axial accelerometers and rate gyros. A pressure sensor was installed on the cage to
measure depth and a load cell was used in the axle of the sheave to measure tension. Data
were acquired by the real time Ocean Data Acquisition System (Appendix A, Figure 2,
from hereon I use the format — Figure A2) which communicated sampling commands and
data serially between the ship-board computer and the remote instrumentation sites. The
data, collected from the A-frame and cage, were synchronised in time and can be related
at any instant even though they were separated by up to 1 765 m.
The ship and cage rotate differently and thus, the measurements from each site
(the ship—fixed and cage—fixed frames of reference) were transformed into a common

16
inertial (earth-fixed) frame of reference for comparison (Figure 2.5). The Euler angles
(Etkin, 1972, Chapter 4) were synthesised iteratively from a combination of
accelerometer and rate gyro measurements and they were used to transform the
acceleration measurements (Figure A 3). Once transformed, the acceleration signal were
integrated using filtering techniques (Antoniou, 1979) to obtain records o f velocity and
position of the ship and cage.
C
Figure 2.5: Body—fixed and inertial (earth-fixed) reference frames.
17
2.2 Wave-Frequency Motion Observations
Translational acceleration of the support ship occurs in two frequency bands, the
low—frequency band and the high-frequency band, which are separated by a spectral gap
at 1.4 Hz (Figure A4). Variance in the low- frequency band is due to swell and developed
wind waves while the high-frequency variance has been attributed to mechanical
vibrations of the ship. The spectral distribution of ship motion wiU not change for other
sea states because the motion of waves that are much shorter (high frequency) than the
hull length will always be greatly attenuated while the mechanical vibrations will not
change in frequency with varying sea state. Within the low-frequency band, we restricted
the analyses to the range o f 0.1 to 0.25 Hz that contains 90% of the variance of the
vertical acceleration and we denoted it as the wave—band.
In the absence o f time varying currents or large horizontal excursions of the
support vessel, coherencies between all six degrees o f motion of the ship and cage show
that the ship and underwater platform are only coupled vertically (Figure A15). The
displacements of the underwater platform due to surge, sway, roll, pitch, and yaw
motions of the ship are small compared to the vertical scale 0(1:1000) of the tether and
such motions are not effectively transmitted by the tether. Analysis of the translation and
rotation of the ship show that most of its heave is due to the pitching of the vessel about
its nominal centre of gravity (CoG). Therefore, vertical motion imparted to the overboard
system can be significantly reduced by reducing the distance between the CoG and the
A-frame.
18
One major finding is that the cage response is weakly non-linear, although it is
subject to quadratic drag. This is evidenced by the relative variance at the odd harmonics
of the fundamental frequency of excitation which is trivial (~2% of the total variance).
The magnitude of the transfer function between the ship and cage, , is
asymmetric and peaks at a slightly lower frequency than the first natural frequency, f , of
the system (Figures A6 and A7). Thus, with symmetric forcing, more motion is
transferred from the ship to the cage at frequencies less than / , than at frequencies above
the natural frequency. The tether’s stiffness in inversely proportional to its length and the
natural frequencies of the system decrease (increase) with increasing (decreasing)
operating depth. Consequently, the peak of moves to lower (higher) frequencies
and increases (decreases) in value with increasing (decreasing) operating depths. This
implies that there exists a critical depth for which the frequency of the maximum ship
motion and the peak of the transfer function nearly align and the cage motion will be
maximised. We estimate this depth to be 2 500 m. We also estimate that /j will be within
the wave —band between 1 450 and 5 000 m and thus, the system will be in resonance for
most of its operating depths. Measurements reflect this — the vertical motion of the cage
is larger than that o f the ship (Figure A5). Another important consideration is that the
second and third natural frequencies decrease with increasing operating depth and they
will move into the wave-band at deeper depths. Other vertical systems have similar non-
dimensional parameters (discussed in Chapter 3) and will likely suffer from the same
resonance conditions.
19
At wave frequencies, the phase between the ship and cage motion changes non—
linearly with frequency and the lag of the cage changes significantly through the wave
band. As a result, the time histories of ship and cage motion will not be identical. Instead,
the various spectral components o f the motion o f the ship will be phase shifted by
different amounts as they propagate down the tether.
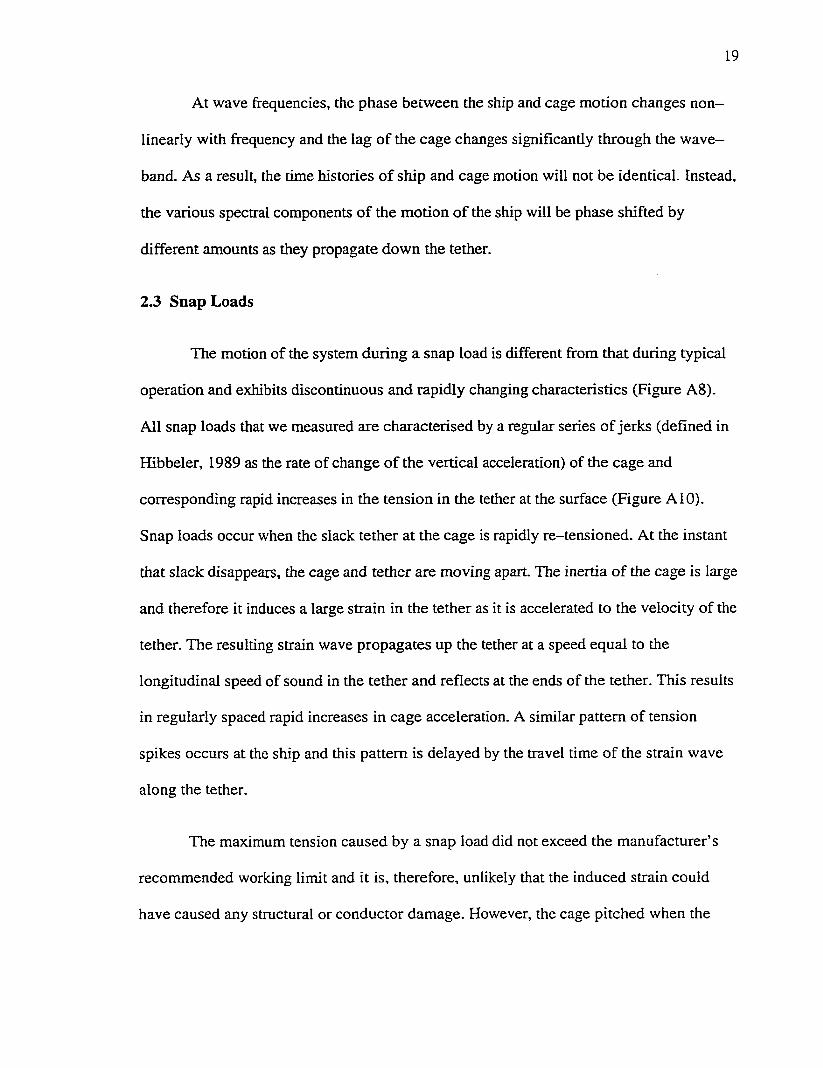
2.3 Snap Loads
The motion of the system during a snap load is different from that during typical
operation and exhibits discontinuous and rapidly changing characteristics (Figure A8).
All snap loads that we measured are characterised by a regular series o f jerks (defined in
Hibbeler, 1989 as the rate of change of the vertical acceleration) of the cage and
corresponding rapid increases in the tension in the tether at the surface (Figure A 10).
Snap loads occur when the slack tether at the cage is rapidly re-tensioned. At the instant
that slack disappears, the cage and tether are moving apart. The inertia of the cage is large
and therefore it induces a large strain in the tether as it is accelerated to the velocity of the
tether. The resulting strain wave propagates up the tether at a speed equal to the
longitudinal speed of sound in the tether and reflects at the ends of the tether. This results
in regularly spaced rapid increases in cage acceleration. A similar pattern of tension
spikes occurs at the ship and this pattern is delayed by the travel time of the strain wave
along the tether.
The maximum tension caused by a snap load did not exceed the manufacturer’s
recommended working limit and it is, therefore, unlikely that the induced strain could
have caused any structural or conductor damage. However, the cage pitched when the

2 0
tether was slack because the centre of weight and buoyancy are horizontally offset
(Figure A 10). When re-tensioned, the tether is bent tightly and beyond the minimum
radius of curvature recommended by the manufacturer at the cage termination. This likely
fractured the fibre optic conductors and stressed the steel armour. Additionally, the cage
was accelerated by up to half o f the acceleration of gravity and this could shake free
electrical and mechanical components.
2.4 Discussion
The operating problems of the ROPOS ROV are common to other vertically
tethered (and likely deeply towed) systems and may degrade their performance. For
example, CTDs are delicate instruments that are used to obtain profiles o f sea water
properties. Vertical excursions create turbulence that disturbs the water around the CTD
and contaminates the measurements. Also, the jerk from a snap load would likely disrupt
the water flow through the CTD rendering measurements made at that time meaningless.
To obtain smooth profiles, free falling instruments have been developed. These
instruments are typically connected to the ship by a light tether that is used for
communication and recovery. During descent, the tether is fed out rapidly so that slack
builds on the surface and the vehicle is essentially decoupled from the ship. However,
during recovery, slack can occur at the surface because the tether is nearly neutrally
buoyant and it falls slowly through the water but rapidly through air. The resulting snap
loads can damage the tether and shake the body violently (Lueck, 1999). In this case, the
snap loads starts at the surface.
2 1
Clearly, vertically tethers systems must be designed to be dynamically well
behaved and, for safety’s sake, operators must be aware o f the dangerous operating
conditions. Since motion measurements are expensive and not always possible, tools are
needed that can predict the response of tethered systems. In the next two sections we
develop a continuous model and a discrete model that represent the ROPOS ROV system.
The motion observations have outlined many characteristics that can aid in the
development of these models. In particular, the only significant relationship between the
ship and cage is in the vertical direction in the absence of strong cross-currents. Thus, the
remaining five degrees of freedom need not be modelled and a one-dimensional model o f
the vertical system should be sufficient to accurately reproduce these measurements. The
striking characteristics of the ROV system also provide challenging tests for the models.
Realistic models should reproduce: (0 the transfer function between ship and cage
motions (both magnitude and phase), (ü) the natural frequency and harmonics, and
(fii) the regular pattern of rapid increases in the cage acceleration and tether tension
during a snap load.

2 2
Chapter 3
Continuous Model
Analytical models are attractive tools in the design and analysis of tethered
systems because they can be used to predict the behaviour of system during the design
process while avoiding the expense and time of iterative prototyping and sea trials. They
can also be used to evaluate existing systems without the cost of experimental
measurements. Two modelling techniques were introduced in Chapter 1: continuous
(closed form) and discrete models. Discrete models are valid over a wider range of
conditions than continuous models but they can be difficult to set up, require large
computer resources and take long periods of time to investigate a few simple cases.
Continuous models have a smaller range of validity than discrete models but they can
quickly calculate the important dynamic characteristics of tethered systems. In this
chapter, we summarise the development and validation of a continuous one-dimensional
linearized model and its closed form solution. The details are given in Appendix B.
3.1 Analytical Model
In the absence of time varying currents or large horizontal excursions of the
support vessel, vertically tethered systems are only excited by heave motion and
horizontal and rotational motions are not transmitted to the undersea platform
Additionally, the response of the underwater platform was found to be weakly non-linear
within the range of measurements presented in Chapter 2. Therefore, a one-dimensional
linearized analytic model is sufficient to represent most vertically tethered systems. The
tether is approximated as an elastic rod and its elongation is described by a hyperbolic
23
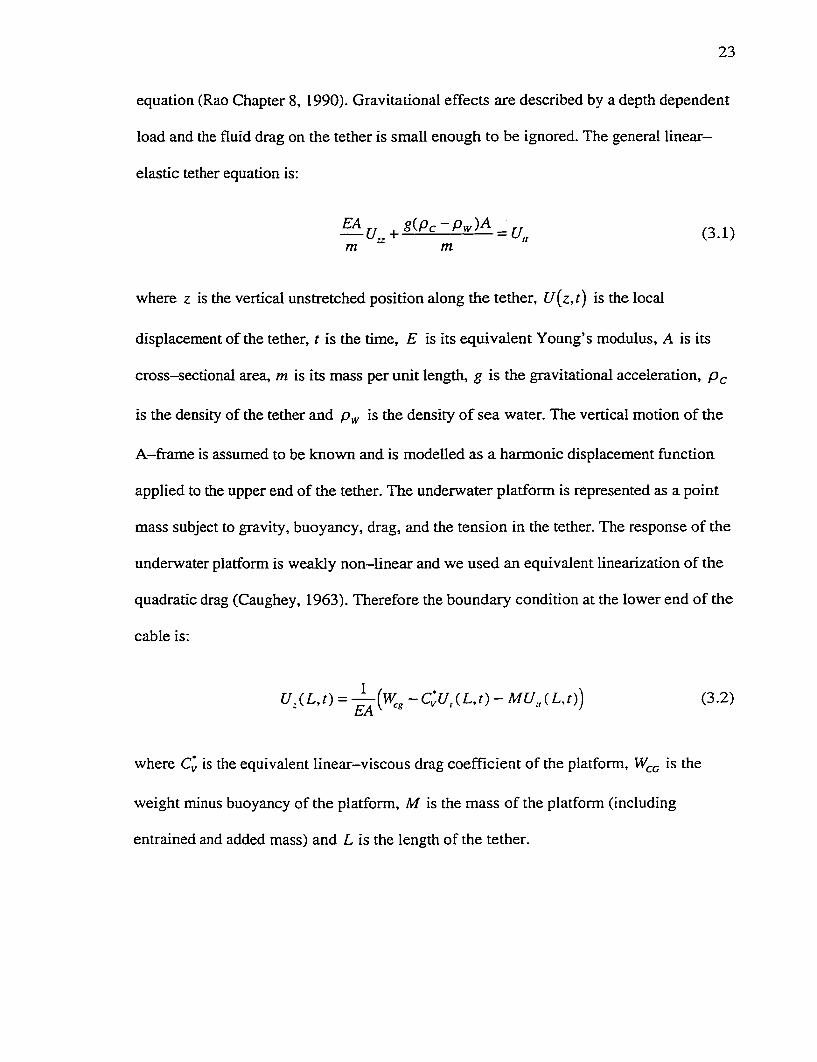
equation (Rao Chapter 8, 1990). Gravitational effects are described by a depth dependent
load and the fluid drag on the tether is small enough to be ignored. The general linear-
elastic tether equation is:
g(Pc Pw)A = u„ (3.1)m m
where z is the vertical unstretched position along the tether, U{z,t) is the local
displacement of the tether, t is the time, E is its equivalent Young’s modulus, A is its
cross-sectional area, m is its mass per unit length, g is the gravitational acceleration, P(~
is the density of the tether and is the density o f sea water. The vertical motion of the
A—frame is assumed to be known and is modelled as a harmonic displacement function
applied to the upper end of the tether. The underwater platform is represented as a point
mass subject to gravity, buoyancy, drag, and the tension in the tether. The response of the
underwater platform is weakly non-linear and we used an equivalent linearization of the
quadratic drag (Caughey, 1963). Therefore the boundary condition at the lower end of the
cable is:
where Cÿ is the equivalent linear-viscous drag coefficient of the platform,
weight minus buoyancy of the platform, M is the mass of the platform (including
entrained and added mass) and L is the length of the tether.

24
For generality, the governing differential equation and its boundary conditions are
non-dimensionalized and the resulting closed form solution is divided into two
independent parts, a static and a dynamic solution. The static solution is:
V'2
X z') = - ^ { z 'Y + - ^ + P z ' (3.3)y YEA
where
R — ^ S(.Pc Pw)^Yc^ m
and the non-dimensional parameters are denoted by (•) . The dynamic part is solved in
the frequency domain and its solution is:
, f(sinû)' + (Tcos£ü'}sindüV + {cos£ü'-o'sinûj'}cos£ü'z')e-'“"w \ z \ t ' ) = i — ;---------- ------ (3.4)
costu — asm tu
where
a = Cœ'-j^, C = -^ . co' = oJ — ,mL \ EA c
a ' is the non-dimensional frequency and the two non-dimensional parameters Ç and ^
represent the cage-to-tether mass ratio and the drag force on the underwater platform-
to-elastic force in the tether ratio respectively. They may also be considered as the
dimensionless mass o f the platform and its dimensionless drag.
The dimensional model is a function of several dimensional variables; however,
when the frequency is non-dimensionalized by L /c , the response at any given frequency
25
is determined by only Ç and ^ . This implies that designers need only determine optimal
values for these two non-dimensional coefficients instead of five dimensional variables.
Since the non-dimensional variables are functions of five dimensional variables
( M ,E ,A ,m , and ), there is flexibility in design because the optimal values for the
non-dimensional variables can be achieved using different combinations of those five
dimensional variables.
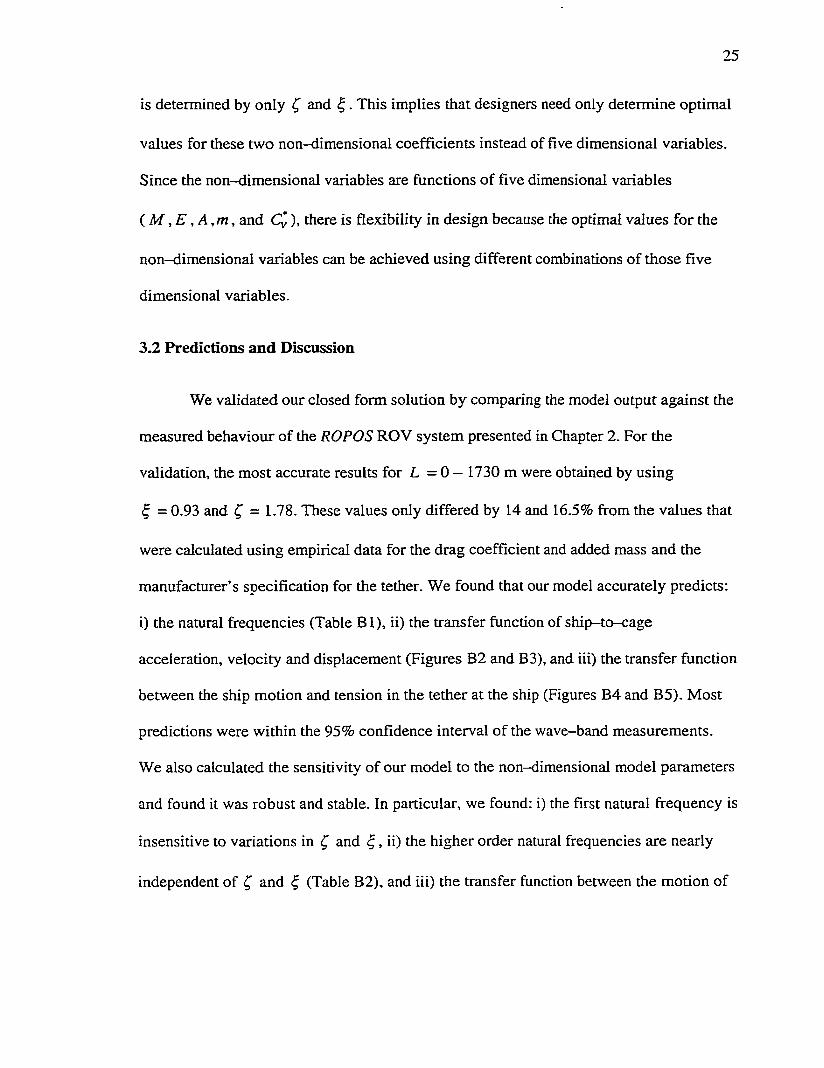
3.2 Predictions and Discussion
We validated our closed form solution by comparing the model output against the
measured behaviour of the ROPOS ROV system presented in Chapter 2. For the
validation, the most accurate results for L = 0 — 1730 m were obtained by using
^ = 0.93 and Ç — 1.78. These values only differed by 14 and 16.5% from the values that
were calculated using empirical data for the drag coefficient and added mass and the
manufacturer’s specification for the tether. We found that our model accurately predicts:
i) the natural frequencies (Table B 1), ii) the transfer function of ship-to-cage
acceleration, velocity and displacement (Figures B2 and B3), and iii) the transfer function
between the ship motion and tension in the tether at the ship (Figures B4 and B5). Most
predictions were within the 95% confidence interval of the wave-band measurements.
We also calculated the sensitivity of our model to the non-dimensional model parameters
and found it was robust and stable. In particular, we found: i) the first natural frequency is
insensitive to variations in Ç and ^ , ii) the higher order natural frequencies are nearly
independent of Ç and ^ (Table B2), and iii) the transfer function between the motion of
26
the ship and cage and between the motion of the ship and tension in the tether are only
moderately sensitive to variations in ^ and ^ (Figures B7, B8, and B9).
For comparison with the parameters of the ROPOS ROV system ( = 0.93 and
^ = 1.78), the parameters for a more streamlined and massive platfonn (a piston coring
tool) and a less streamlined platform (a water sampling rosette) are ^ = 0.46 and
Ç = 2.50; and(^ = 1.27 and Ç = 1.9, respectively for L = I 730 m. These values are
reasonably close (within a factor of 2) to those for the ROPOS system, and therefore, our
model should be valid for most tethered systems and each o f these systems will have
similar dynamic characteristics. O f particular interest, the magnitude o f the transfer
function between ship and platform motion will not be reduced by reasonable changes in
Ç and ^ . That is, minor alterations in the system cannot reduce the motion of the cage so
it is less than that of the ship.
Measurements in Chapter 2 show that when any of the natural frequencies occur
in or near the wave-band, the cage motion will be larger than the motion of the ship.
These conditions make operation difficult and would likely result in snap loading.
Therefore, the ability to accurately predict these frequencies during a design is important
for the development of a safe, reliable and effective system. We found that the natural
frequencies are nearly independent of the cage drag and can be accurately calculated
using:
m'tan((u') = -^ . (3.5)

27
By analysing (3.5) we found that the second and higher order natural frequencies occur at
integer multiples of 0.5 and are nearly independent of Ç . This is also reflected in our
measurements (Figure B l). The first natural frequency changes only slightly when the
value of Ç is varied. This has significant implications because many other vertically
tethered systems have similar values o f Ç, and are likely operating in resonance.
Predicting the tension in the tether for any given sea condition is important
because it provides a quantitative criterion for the selection o f a tether. We developed a
simple and accurate non-dimensional transfer function between the ship motion and
tension in the tether. The total (static + dynamic) tension is largest at the surface and the
transfer function at that point is:
£o'(sin m ' + cr cos m') (coscy' —crsinm ')
W L \l i h A j
Predicting the tension at the cage is useful because it can be used to predict the sea
conditions for which the tether becomes slack and snap loading will occur. Although the
model is only valid when the tether is taut, it can be used to predict the critical amplitude
o f ship motion that the tether tension at the cage goes to zero:
EAYc^= ^ --------- (3.7)(Û acosco — o'sinty
We validated (3.7) by overlaying plots of estimated from the model and Y that
contains 99% of the measured amplitudes (in the wave-band) in a long record in which a
2 8
few snap loads occurred in extreme conditions (Figure B6). Slack tether occurs when
> Y . Indeed Y did exceed the lines of zero tension over a small range at higher
frequencies in the wave-band. Thus, (3.7) provides a relatively simple, quick and
accurate means o f determining the safe operating range of most tethered systems and
their susceptibility to snap loading. However, it implicitly assumes a single frequency
wave, when, in reality, waves energy is spread over a band of frequencies.
Our continuous model provides quick and accurate estimates of the dynamic
characteristics o f vertically tethered systems. However, our model has limitations. The
actual drag acting on the cage is quadratic, but it is linearized for a “steady” amplitude of
vertical motion. Thus, our model is not appropriate for unsteady wave conditions. Our
model is also invalid for a slack tether, which is the precursor to snap-loads. Finally,
properties of the tether must be uniform along its length.
29
Chapter 4
Finite-Element Lumped-Mass Model
Discrete models are not constrained by the limitations of continuous models and
they are valid for a wider range of operating conditions and system configurations. We
chose a finite-element implementation because it is versatile and can model the
complicated characteristics o f vertically tethered systems. In this chapter, we give an
overview of the development and validation of a one-dimensional finite-model lumped-
model of a vertically tethered system. The details are given in Appendix C.
4.1 Model Development
The system is broken down into three individual sub-systems: the support ship
with its A-frame, the tether, and the cage and ROV. As in Chapter 3, a one-dimensional
model is sufficient. The model is developed using a single inertial reference frame
located at the mean sea surface, with downward displacements defined as positive. We
represent the tether as a long elastic cylinder that is suspended directly below the ship’s
A-frame and the balance of forces (per unit length) at any point in the tether is:
^ ^ + W + F = ma (4.1)ds
where s is the vertical unstretched co-ordinate along the tether, W(r) is the in situ weight
(per unit length), T{s) is the tension in the tether, F(r) is the hydrodynamic force (per
unit length), and m is the effective mass (per unit length including entrained water).
30
Although (4.1) is in a slightly different form than the governing equation (3.1) used in the
continuous model, in the limit of zero tether drag and linear cage drag, they are identical.
The tether is discretised by first dividing it into N segments (elements) which
have the same properties as the continuous tether and the location of any point is defined
using a coupled set of reference and elastic co-ordinates (Shabana, 1989). The end points
of each element are denoted as the nodes of the system. We use an elemental trial
solution with a linear shape function to approximate the elastic displacement at any point
in an element. By applying Galerkin’s method of weighted residuals (Burnett 1987) to
(4.1) (Appendix E) and replacing the consistent—mass matrix with a lumped-mass matrix
(Logan 1992) to uncouple the acceleration terms, we obtain the following finite-element
equations o f a visco-elastic tether element i :
Hhk2
~z+ m.l,% 0 ' 'ar' ■ 1 - r
+-^(D-
z 0 4 -1 1 _ jr - \ P ? \&L2)
where
/ , “> = 1/2 On, - p . A, ) g/i - 1 /2 p.. D ,C U (1/3 (Z + »<'> )|Z-I-
+ l/6(Z +ù,“ )|z + Kf-’|-l/12(ii,<'>-li,
/ ; ” > = l/2 (m ,-p .A ,.)g l,- l/2 p ..D ,C ^ ,l,( l/6 (Z + ii;'>)|Z + ii‘
+ i/3 (z + ù ,“ ’) |z + s ; - ’| - i / i 2 ( i i ' ' ’ - i i ' - ’)|i<;'’ -û ,“ ’|)
is the element length, E. is the effective Young’s modulus of the tether, D- is the
diameter o f the tether, is the tangential drag coefficient, and are the elastic
31
displacements of the upper and lower nodes, respectively, and are the boundary
conditions for the continuity o f strain between nodes of connecting elements at the upper
and lower nodes, respectively, and ( ') represents a time derivative.
Similar to our continuous model, the vertical motion o f the ship is modelled as a
prescribed displacement function applied to the upper end (first node) o f the tether,
Z = i t ) . Because the motion of the first node is prescribed, measured (actual) ship
motion data can be used as input. Thus, our model can be validated by directly comparing
the calculated cage motion and tension in the tether against the actual values for the same
ship motion. The equation governing the motion of the cage and ROV is nearly identical
to (3.2) but the linear drag is replaced by the more accurate quadratic representation.
The complete model is obtained when the N tether elements are assembled end-
to-end and joined at their node points. Nodes are numbered consecutively from the top
node, 1, to the bottom node, N + \. The second time derivative of the prescribed ship
motion is the acceleration of node 1 and the cage and ROV are included by adding their
mass to that of node N + \ and applying the forces acting on them to that node. The
assembled set o f differential equations is given in Appendix C. A Runge-Kutta fourth-
fifth order numerical integration routine with adaptive step size is used to obtain the
temporal response.
4.2 Model Predictions and Results
We used our measurements of the motion and tension of the ROPOS ROV system
to determine the unknown model coefficients and to verify manufacturer’s specifications.
32
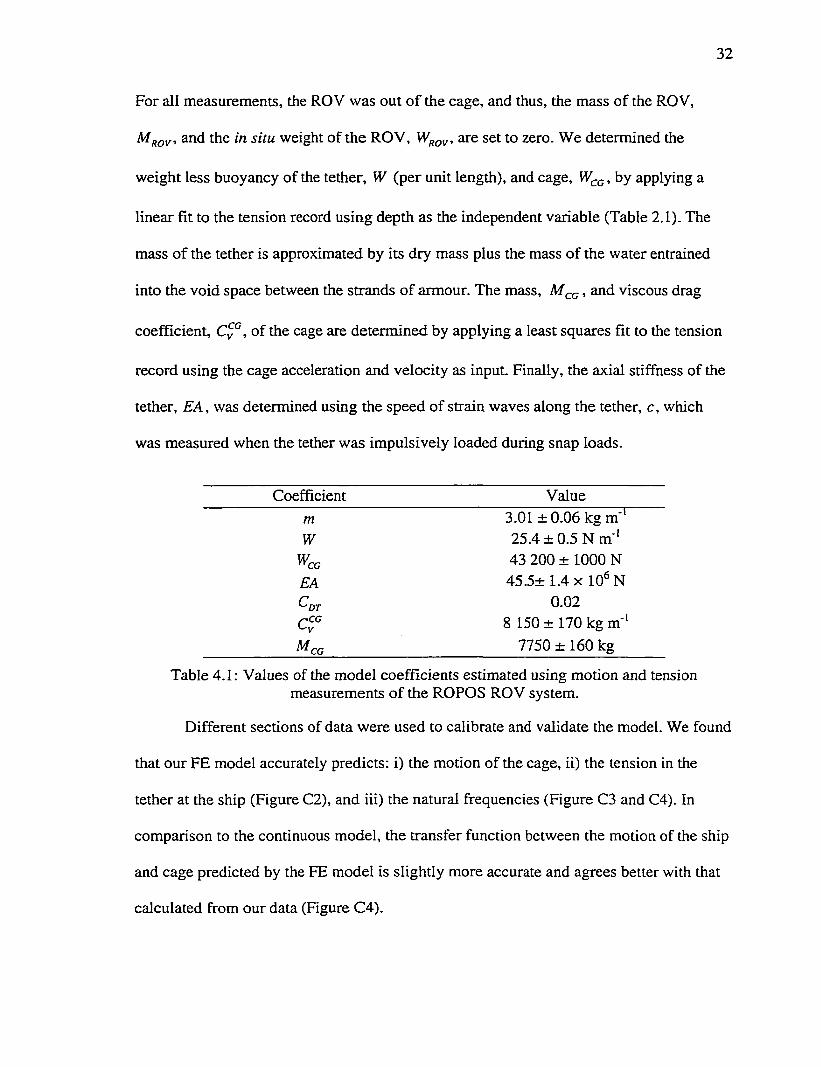
For all measurements, the ROV was out o f the cage, and thus, the mass o f the ROV,
and the in situ weight of the ROV, are set to zero. We determined the
weight less buoyancy of the tether, W (per unit length), and cage, , by applying a
linear fit to the tension record using depth as the independent variable (Table 2.1). The
mass of the tether is approximated by its dry mass plus the mass of the water entrained
into the void space between the strands of armour. The mass, , and viscous drag
coefficient, of the cage are determined by applying a least squares fit to the tension
record using the cage acceleration and velocity as input. Finally, the axial stiffness of the
tether, EA, was determined using the speed of strain waves along the tether, c, which
was measured when the tether was impulsively loaded during snap loads.
Ooefficient Valuem 3.01 ±0.06 kg m*'W 25.4 ± 0.5 N m '‘
Wca 43 200 ± 1000 NEA 45.5± 1.4 X 10 NCpT 0.02f^C G 8 150 ± 170 kg m '
^ C C 7750 ± 160 kg
Table 4.1; Values of the model coefficients estimated using motion and tension measurements of the ROPOS ROV system.
Different sections of data were used to calibrate and validate the model. We found
that our FE model accurately predicts: i) the motion of the cage, ii) the tension in the
tether at the ship (Figure 02), and iii) the natural frequencies (Figure 03 and 04). In
comparison to the continuous model, the transfer function between the motion of the ship
and cage predicted by the FE model is slightly more accurate and agrees better with that
calculated from our data (Figure 04).

33
Although our FE models is accurate, it is not exact and there exists a small
(-11% ) disagreement between the real and predicted cage motion. The sensitivity
analysis indicated that differences between our measured and modelled results cannot be
explained by parameter uncertainty. This suggests that there is a significant physical
process that is not accurately modelled for oscillatory flow about a body. The differences
may be due to the limitations of the concept of a constant drag coefficient and a constant
added mass (Simiu and Scanlan 1978 and Sarpkaya and Isaacson 1981). To test this
notion, we added a simple wake model that makes some account o f the history of motion
and the accuracy of the simulated response improved (Figure C4). In particular, the wake
model improved the predictions of the larger motions and the real and predicted transfer
function between the motion of the ship and cage were nearly identical within the wave
band (Figure C4). For smaller platforms that experience similar vertical motions, such at
CTDs, the assumption of a constant drag coefficient and added mass may be less valid
because wake will be more developed. Thus, the predicted response of vertically tethered
systems should improve if the time varying forcing acting on oscillating packages
attached to tethers are more accurately modelled.
Snap loads occurred in less than 1% of the motion cycles in the record we used
for validation. Such threshold conditions are very difficult to predict because they require
the numerical model to be very precise and our model did not reproduce these snap loads
even with the inclusion of the wake model. Therefore, we increased the ship motion by
10% to induce a snap load so we could study the response. Indeed, our model did
reproduce the snap loads and all the associated characteristics o f the acceleration of the
cage and of the tension at the ship (Figure C6). Therefore our discrete model can be used
34
to investigate the response of vertically tethered systems in extreme seas where existing
continuous models are invalid.
4.3 Discussion
O ur finite-element lumped-mass model is a useful tool that accurately predicts
the response of a caged ROV system to surface excitation and it should be applicable to
all vertically tethered system operating in any sea condition. It is also flexible because
different systems can be modelled by changing the values of the coefficients without
modifying the actual model. Additionally, complex components, such as heave
compensation systems, can be added as a specialised element.
Both the continuous and discrete model show that the response of the cage is
relatively insensitive to variations in the model coefficients (Figures B7, B8, B9 and C5).
This implies that large changes in the model coefficients (and thus, significant physical
changes to the real system) are needed to significantly alter the response of the cage to
ship motion. However, in many cases, altering the system to fix one operational problem
may exacerbate another. For example, increasing the mass and in situ weight o f the cage,
decreases the occurrence of snap loads, but increases the static tension in the tether and
rms cage motion. Heave compensation systems provide an alternative because they can
change the response of the overboard system without major physical modifications.
35
Chapter 5
Ship and Cage-Mounted Passive Heave Compensation
In Chapters 2, 3 and 4, we identified several problematic characteristics of the
ROPOS system which are likely shared with many other vertically tethered systems. In
particular, the system is in resonance for much of its operating range, the motion of the
ship is amplified at the cage, the motion amplification increases with increasing operating
depth (until the first natural frequency begins to move out of the wave-band), and the
rapid re-tensioning of slack tether at the cage impulsively loads the tether and jerks the
cage. Heave compensation systems would help alleviate these problems and increase the
operating envelope of vertically tethered systems. In this chapter we develop a discrete
representation of a passive heave compensation system and add it to our finite-element
model to investigate the effectiveness o f a ship-mounted and a cage-mounted
compensation system.
5.1 Heave Compensator Design and Numerical Implentation
Vertically tethered systems can be complex and multifaceted and the addition of a
heave compensation system adds additional complexity. We chose a passive design
because of its simplicity. However, the load in the tether at the surface increases with
increasing operating depth, and thus, the ship-system must be actively adjusted for the
variable weight of the overboard system. By contrast, a cage-mounted compensator only
supports the weight of the cage and it can be completely passive. To facilitate this passive
design, we chose a ram-tensioner design that consists of a pneumatic spring and a viscous
damper. Its operation is described in detail in Appendix D.
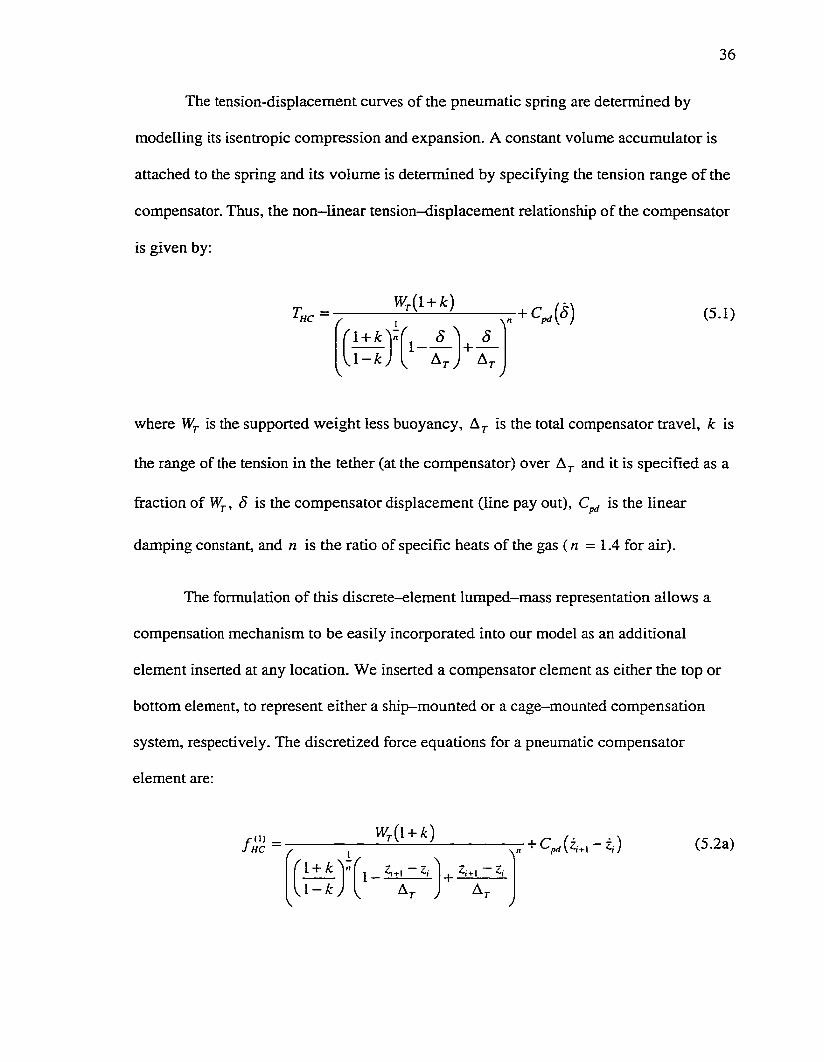
36
The tension-displacement curves of the pneumatic spring are determined by
modelling its isentropic compression and expansion. A constant volume accumulator is
attached to the spring and its volume is determined by specifying the tension range of the
compensator. Thus, the non—linear tension-displacement relationship of the compensator
is given by:
Vfy(l + Â:)'■HC f I
1 - <5 '" <5+ —h - k )
\ \ Ar ; Ar J
(5.1)
where Wj. is the supported weight less buoyancy, is the total compensator travel, k is
the range of the tension in the tether (at the compensator) over and it is specified as a
fraction of WÇ, Ô is the compensator displacement (line pay out), is the linear
damping constant, and n is the ratio of specific heats of the gas (n = 1.4 for air).
The formulation of this discrete-element lumped-mass representation allows a
compensation mechanism to be easily incorporated into our model as an additional
element inserted at any location. We inserted a compensator element as either the top or
bottom element, to represent either a ship-mounted or a cage-mounted compensation
system, respectively. The discretized force equations for a pneumatic compensator
element are:
f H )I HC ~
W (l + A:)r 1
l + A:1-A :
1 - - + -Zn., — Z;
A .
(5.2a)
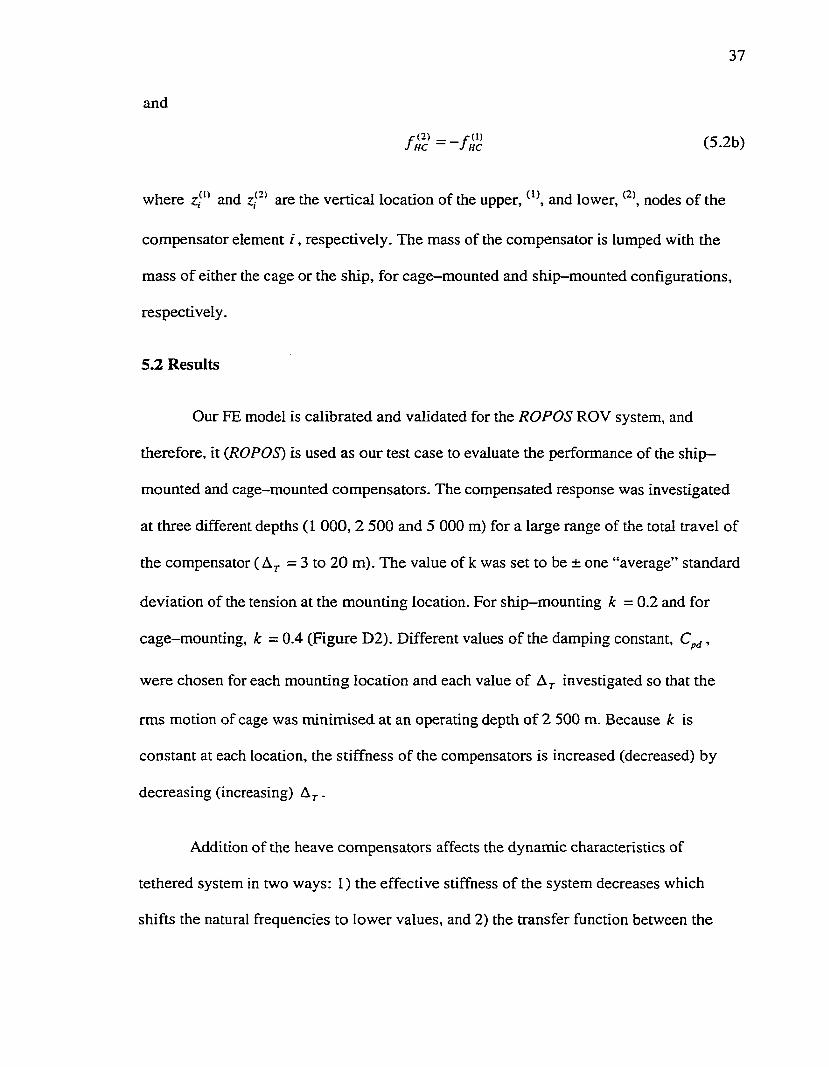
37
and
Æ ’ = - Æ (5.2b)
where r?" and r?"* are the vertical location o f the upper, and lower, nodes o f the
compensator element i , respectively. The mass of the compensator is lumped with the
mass of either the cage or the ship, for cage-mounted and ship-mounted configurations,
respectively.
5.2 Results
Our FE model is calibrated and validated for the ROPOS ROV system, and
therefore, it (ROPOS) is used as our test case to evaluate the performance of the sh ip-
mounted and cage-mounted compensators. The compensated response was investigated
at three different depths (1 000, 2 500 and 5 000 m) for a large range of the total travel of
the compensator ( = 3 to 20 m). The value of k was set to be ± one “average” standard
deviation of the tension at the mounting location. For ship—mounting k = 0.2 and for
cage-mounting, k = 0.4 (Figure D2). Different values of the damping constant, ,
were chosen for each mounting location and each value of A^ investigated so that the
rms motion of cage was minimised at an operating depth o f 2 500 m. Because k is
constant at each location, the stiffness of the compensators is increased (decreased) by
decreasing (increasing) A ^.
Addition of the heave compensators affects the dynamic characteristics of
tethered system in two ways: 1) the effective stiffness of the system decreases which
shifts the natural frequencies to lower values, and 2) the transfer function between the
38
motion of the ship and cage peaks at a much lower frequency than the first natural
frequency and its asymmetry is increased (Figure D8). In the cases investigated, the peak
of the transfer function was shifted to the low frequency side of the wave-band. Thus,
under normal operating conditions, we found that both the ship-mounted and the cage-
mounted compensators reduce the vertical motion of the cage, decrease the rms and peak
tension in the tether (Figure D6), and kept the tether taut, thereby eliminating snap loads
(Figure D5). For all but the maximum operating depth, 5 000 m, we also found that the
effectiveness of the compensators increased with increasing . At 5 000 m, the second
natural frequency of the cage compensated system was brought closer to and eventually
into the wave-band as was increased. Thus, the effectiveness of the compensators
decreased as the second mode was excited.
It is necessary to prove heave compensation systems do not exacerbate operating
problems when sea condition unexpectedly increases above its specified maximum. To
simulate storm sea states, we increased the record of ship motion by a factor of two and
three. The significant A-frame displacement, , is defined here as the average
amplitude of the 25% largest displacements, analogous to the classical definition of
significant wave height. The measured displacement of the A-frame used has = 7.2 ft
(2.2 m), and the records amplified by factors of two and three have = 14.4 ft (4.4 m)
and =21.7 ft (6.6 m), respectively. In very rough seas with a significant A-frame
displacement of = 4.4 m, the uncompensated system experienced many snap loads.
The ship and cage compensated systems with A^ = 5 m do not experience any snap loads
and do not hit their end stops (Figure DIO). However, in extreme sea conditions, of

39
5^ = 6.6 m, the tether at the cage goes slack and the piston hits its end stops for both
compensator mounting locations (Figure D ll) . The cage-mounted compensator is
compliant so subsequent re-tensioning is gradual and snap loads are not produced. Rapid
re-tensioning and snap loads do occur in the ship compensated system although, they are
significantly reduced in comparison to those of the uncompensated system. When the
compensators (both ship- and cage-mounted) hit their upper end stops, rapid increases in
tension, analogous to a snap load, develop, but the spikes in the tension record are smaller
than those of the snap loads.
Although the compensators are effective for most of the conditions investigated,
we identified two conditions for which the compensated system may have a larger
response than the uncompensated system. First, the peak of the transfer function was
shifted to the frequency range of swell (fully developed surface ocean waves, 0.05-
0.1 Hz), and thus, the systems response to swell will increase. Second, the second natural
frequency of the system with the cage-mounted compensator may be brought into the
wave-band, exciting the second mode and increasing the rms tension and cause the cage
to oscillate out of phase with the ship.
5.3 Discussion
Addition of either a ship-mounted or cage-mounted compensator can improve the
operating characteristics of vertically tethered system and significantly increase the range
of sea states that are safe. However, when a passive compensation system is added to any
vertically tethered system, the characteristics of that compensator must be carefully
chosen so that the desired response is achieved over the full operating range.

40
Additionally, our model can be used to identify operating depths and conditions for
which the compensated response will be greater than that of the uncompensated system.

41
Chapter 6
Conclusions and Future Work
There were three primary objectives of this research. The first was to measure the
motion and tether tension of a vertically tethered system and use that data to characterise
and understand the dynamic interaction between the support vessel and the undersea
platform. The second objective was to develop tools that can help us understand and
predict the response to ship excitation. The third objective was to investigate the
effectiveness of a ship-mounted and a cage-mounted passive pneumatic heave
compensation device at reducing the vertical motion of the undersea platform, decreasing
the rms tension in the tether and eliminating snap loads.
The operating problems, such as snap loading and large vertical oscillations of the
undersea platform, that plague vertically tethered system were introduced in Chapter 1.
Besides making operations troublesome, these problems limit the operating sea state, can
damage the tether and instrumentation on the platform and degrade scientific
measurements. Understanding the dynamics that cause these problems is difficult because
the system is very complex and its response is non-linear. Only a few publications
address modelling of vertically tethered systems and their investigations are very specific.
No work exists for vertically tethered systems that examines their fundamental dynamic
characteristics or rigorously validates their analytical and numerical representations
against experimental measurements.
A typical vertically tethered system, a caged deep>-sea ROV, was instrumented
and data of the motion of the ship and undersea platform and the tension in the tether at
42
the ship were simultaneously measured using a centralised data acquisition system while
the system operated at sea. After processing the data, analysis of the rapid and high
resolution measurements yielded the fundamental dynamics of that system. It was found
that: i) the system is essentially one-dimensional in the absence of time varying cross
currents and large horizontal excursions of the ship; ii) the first natural frequency is
within the wave-band and the system is in resonance for much of its operating range;
iii) the platform motion is larger than that of the ship; and iv) the platform response is
weakly non-linear. Of particular interest, the characteristics of a snap load are not
random as predicted by Huang and Vassalos, (1995). Instead, snap loads are
characterised by a regular set of rapid increases in the acceleration of the cage and the
tension at the ship which are equally spaced at the travel time of a tensile wave through
the tether.
A linearised non-dimensional analytical model of a vertically tethered system and
its closed form solution were presented in Chapter 3. The solution is simple in form, yet it
is a powerful tool because it is accurate and provides a physical basis for many of the
characteristics observed in the measurements (Chapter 2). In particular, the solution
provides simple equations that can be used to estimate: i) the natural frequencies, ii) the
transfer function between the motion of the ship and cage, and iii) the transfer function
between the motion of the ship and the tension in the tether of most vertically tethered
systems. Although the solution is only valid for a taut tether, it can predict ship motion
that produces slack tether and snap loads. The most notable insight gained arises from the
model’s simplicity — the dynamic response of vertically tethered system is governed by
only two parameters and that response is not very sensitive to changes in those

43
parameters. In most other vertically tethered system the value of the two coefficients
differ by at most a factor of two from the ROPOS ROV system, and thus, they will share
similar operating characteristics and problems.
The finite-element model presented in Chapter 4 was developed so that it can
represent any vertically tethered system and can be reconfigured to model more complex,
multi-component systems. Once calibrated using data from the experimental
measurements, the discrete representation proved more accurate than the analytic model
and it was valid over all sea conditions. However, it did not reproduce the snap loads that
occurred in the measurements. Analysis of the small discrepancy between the real and
predicted response of the platform showed that the concept of a single drag coefficient
and a single added mass coefficient for the platform many not be completely accurate for
oscillatory motion. A simple wake model was added to account for the time history of the
motion and indeed, it improved the predicted response but still did not reproduce any
snap loads. Although the constant coefficient concept yielded reasonable results in the
caged ROV model, it is likely that this concept is less accurate (correct) for smaller
platforms. By increasing ship motion by 10%, the discrete model with the wake
representation accurately reproduced the snap loads that occurred during the
measurements and their non-linear characteristics - a regularly spaced series of rapid
increases in the acceleration of the cage and tension at the ship. Thus the model is also
capable of modelling the transition between slack and taut tether.
A discrete representations of a heave compensator was added to the finite—model
in Chapter 5. This representation was easily incorporated into the finite—model because of
its generality. Passive ship-mounted and cage-mounted compensators were found to

44
effectively uncouple ship and cage motion and to increase the range of safe sea states.
During extreme seas, the snap loading did not occur for the cage compensated system
because the transition between slack and taut was more gradual. Conversely, snap loading
did occur with the ship-mounted system but the rate o f change of cage acceleration and
tension in tether were significantly reduced in comparison to the uncompensated
response. When the compensators hit their upper end stops, rapid increases in tension
resulted and were larger for the ship compensated system than for the cage compensated
system. Although passive compensators can be effective, their stiffness and damping
characteristics must be chosen carefully and the response of the compensated system
should be investigated over all depths. If the characteristics are improperly chosen, the
platform response could increase and exacerbate the operational problems.
6.1 Suggestions for Future Work
The success of my work described in this dissertation encourages future work to
expand the range o f understanding of tethered systems in general and increase the
applicability o f my models. In particular, future work should address the following issues
and problems:
• During deep operation, horizontal currents may cause the undersea platform to
move large horizontal distances with little change in depth. If these currents are
time varying or if the ship is being dynamically positioned, the systems may
oscillate horizontally which makes navigation and positioning of ROVs difficult,
degrades the measurements from horizontal profilers, and makes precision landing
of packages on the ocean floor impossible. To investigate these situations, my
e
#
45
models can be extended to include horizontal motions by including rotating
reference frames, the normal components of drag acting upon the tether and
underwater platform and the horizontal motion variables.
Once extended to include horizontal motions my model could be used to
investigate a much larger range of systems such as towed vehicles, moored buoys,
and tension leg platform by simply changing the boundary conditions on the ends
of the tether. For example, the bottom boundary condition can be changed to
reflect the hydrodynamics of a tow fish.
The internal forces in a slack tether are not zero and they may exert forces on
attached segments or bodies. By including bending and compressive stiffness in
my model, these forces may be approximated. This would allow the tether shape to
be estimated during compression or low-tension and increase the accuracy of snap
load predictions.
The concept of a constant drag coefficient and a constant added mass is not
completely accurate for oscillatory flow. Instead, these coefficients are time
varying and the time history of the flow is important. Further work on oscillating
bodies may provide a more accurate representation of the hydrodynamic forces.
Although active compensation system are more complex than passive systems,
they may provide better compensation and eliminate the jerks that occur when the
piston hits its end stops. In addition, active systems can use software to predict the
future ship motion (for example, by linear prediction) and use this information to

46
optimally move the compensation system. Clearly this could be a fruitful direction
for research in control systems.
47
References
Ablow, C.M. and Schechter, S. 1983. Numerical simulation of undersea cable dynamics.
Ocean Engineering. 10, 443-457.
Antoniou, A. 1979. Digital filters: analysis and design. McGraw-Hill, New York.
Bennett, P. and Forex, S. 1997, Active heave: the benefits to operations as seen in the
north sea. Proceedings o f the SPE/IADC Drilling Conference., 207-217.
Burnett, D.S. 1987, Finite element analysis from concepts to applications. Addison-
Wesley Publishing Company, Don Mills, Ontario.
Caughey, T.K. 1963. Equivalent linearization techniques. Journal o f the Acoustic Society
o f America 35, 1706-1711.
Driscoll F.R. and Biggins L. 1993. Passive damping to attenuate snap loading on
umbilical cables of remotely operated vehicles. IEEE Oceanic Engineering
Society Newsletter 28, 17-22.
Driscoll F.R., Lueck R.G., and Nahon N. 1999a. The motion of a deep-sea remotely
operated vehicle system. Part 1: motion observations. Ocean Engineering, in
press.
Driscoll F.R., Lueck R.G., and Nahon N. 1999b. The motion of a deep-sea remotely
operated vehicle system. Part 2: analytic model. Ocean Engineering, in press.
48
Driscoll, F.R., Lueck, R.G., and Nahon, N. 1999c. Development and validation of a
lumped—mass dynamics Model of a deep-sea ROV system. Submitted to Applied
Ocean Research.
Driscoll, F.R., Nahon, N., and Lueck, R.G. 1999d. A comparison of ship-mounted and
cage-mounted passive heave compensation systems. Submitted to the Journal o f
Offshore and Arctic Engineering.
Etkin, 1972. Dynamics o f atmospheric flight. John Wiley & Sons, New York.
Gaddy, D.E. 1997, Ultradeep drillship will react to heave with electric-heave
compensating draworks. Oil & Gas Journal, July, 68
Garret, J. 1994, Safe operating conditions for the IQS WOCE rosette package. Internal
report. Institute of Ocean Sciences, Sidney, British Columbia, Canada.
Grosenbaugh, M.A. 1996. On the dynamics of oceanographic surface moorings. Ocean
Engineering, 32, 7-25
Hibbeler, R.C. 1989. Engineering mechanics - statics and dynamics. MacMillan
Publishing Company, New York.
Hover, F.S. and Yoerger, D.R. 1992. Identification of low-order dynamic models for
deeply towed underwater vehicle systems. International Journal o f Offshore and
Polar Engineering, 2, 38—45.

49
Hover, F.S., Grosenbaugh, M.A. and Triantafyllou, M.S. 1994. Calculation of dynamic
motions and tension in towed underwater cables. IEEE Journal o f Oceanic
Engineering, 19, 449-457
Huang, S. and Vassalos, D. 1995. Chaotic heave motion of marine cable-body systems.
Proceedings o f the ISOPE-Ocean Mining Symposium, Tsukuba, Japan, 83—90.
ISE 1998, International Submarine Engineering Hysub 5000, 1734 Broadway Street, Port
Coquitlam, B.C., Canada, V3C 2M8, web page,
http://www.ise.bc.ca/rov.html#hys5000.
Jenkins G.M.and Watts D.G. 1968. Spectral analysis and its applications. Holden—Day,
San Francisco.
BCirstein, H. 1986, Active heave compensation systems on board vessels and offshore
rigs. Marine Technology, 17, 59-61.
Korde, U.A. 1998, Active heave compensation on drill-ships in irregular waves. Ocean
Engineering, 25, 541-561.
Logan, D.L. 1992. A first course in the finite element method. PWS-KENT Publishing
Company, Boston.
Lueck, R. 1999, Personal communications. Centre for Earth and Ocean Research,
University o f Victoria, B.C., Canada.
50
Mellem T. 1979. Surface handling of diving bells and submersibles in rough sea.
Proceedings o f the Offshore Technology Conference, Houston, Texas, 1571-
1580.
Niedzwecki, J.M. and Thampi, S.K 1988. Heave compensated response of long multi
segment drill strings. Applied Ocean Research, 10, 181-190.
Niedzwecki, J.M. and Thampi, S.K. 1991. Snap loading of marine cable systems. Applied
Ocean Research, 13, 210—218.
Rao, S.S. 1990. Mechanical vibrations. Addison—Wesley Publishing Company, New
York.
Robigou, V. 1993. Journal o f Geophysical Research Letters, 20, Cover Page.
Sanders, J.V. 1982. A three-dimensional dynamic analysis of a towed system. Ocean
Engineering, 9, 483 —499.
Sarpkaya, T. and Isaacson, I. 1981, Mechanics o f wave forces on offshore structures. Van
Nostrand Reinhold Company, Toronto.
Shabana, A. A. 1989. Dynamics o f multibody systems. John Wiley & Sons, New York.
Simiu,E. and Scanlan, R.H. 1978. Wind effects on structures — an introduction to wind
engineering. John Wiley & Sons, Inc, New York.
51
Yoerger, D.A., Grosenbaugh, M.A., Triantafyllou, M.S. and Burgess, J.J. 1991. Drag
forces and flow-induced vibrations of a long vertical tow cable — part 1 : steady-
state towing conditions. Journal o f Offshore Mechanics and Arctic Engineering,
113, 117-127

52
Appendix A
The Motion of a Deep-Sea Remotely Operated Vehicle System.
Part 1: Motion Observations
53
The Motion of a Deep-Sea Remotely Operated Vehicle System.Part 1: Motion Observations
F. R. Driscoll^*, R. G. Lueck and M. Nahon^
{In press. Ocean Engineering, 1999)
“ Department o f Mechanical Engineering and School of Earth and Ocean Sciences, University of Victoria,Victoria, B.C., V8W 3P6
'’School o f Earth and Ocean Research, University o f Victoria, Victoria, B.C., Canada, V8W 3P6 Department o f Mechanical Engineering, University o f Victoria, Victoria, B.C., Canada, V8W 3P6
Abstract
Rapid and high resolution motion and tension measurements were made of a caged deep-sea ROV
system. Simultaneous measurements were made o f all six components o f motion at the cage and ship A—
frame and of the tension in the tether at the ship. Data were collected for cage depths of 0 to 1 765 m. The
most significant forcing was in the wave-frequency band (0.1 - 0.25 Hz) and accounted for over 90% of
the variance of vertical acceleration. The vertical acceleration of the cage lagged the acceleration of the A—
frame by up to 1.9 s and its variance was larger by up to a factor 2.2. For moderate displacements of the A—
frame ( <2 m ), the system is only weakly non-linear because the harmonics (3"' and 5*) of the vertical
acceleration of the cage account for less than 2% of the total variance. The system is essentially one
dimensional because only the vertical motion o f the cage and the vertical motion o f the A-frame were
coherent, while horizontal motions o f the cage were weak and incoherent with any component of motion of
the A-frame. The natural frequency of the system is 0.22 Hz at 1 730 m, and we estimate that it is within
the wave-band for depths between 1 450 m and the full operating depth o f 5 000 m.
Large vertical excursions of the A-frame produce momentary slack in the tether near the cage.
Retensioning results in snap loads with vertical accelerations o f 0.5 gravity. Large rates of change of
tension and vertical acceleration first occur at the cage during its downward motion and propagate to the
surface with the characteristic speed (3 870 m s"') o f tensile waves for the tether. Six echoes are clearly
* Corresponding author.

54
detectable at both ends o f the tether, and their pattern is extremely repeatable in different snap loads. Due to
misalignment o f the tether termination with the centres o f mass and buoyancy, the cage pitches by up 14°
during a snap. The resulting small radius of curvature poses the greatest stress on the tether.
Keywords: Tethered marine systems, remotely operated vehicles, ROV, tether, snap
loading, cable dynamics, motion and tension measurements.
1. Introduction
Caged remotely operated vehicles (ROVs) are vital tools that provide safe and
effective access to deep water the world over. ROV systems have many applications,
including scientific exploration of deep ocean phenomena; assembly, inspection and
repair of undersea structures; and dangerous military operations. However, operation of
these systems is usually restricted to calm conditions because slack cable and large snap
loads can occur during rough seas. Operation during rough seas can cause structural
damage to the tether (umbilical cable) and its internal electrical and optical conductors
that reduces the life of the tether and endangers the recovery of the ROV.
Increasing the tether life and maximising the safe operating range of ROV
systems is not an easy task. Fig. 1 shows a typical caged ROV system where the ship and
undersea unit are connected by a long elastic structural member — the tether. Capable of
sustaining only tensile loading and having length—dependent properties, the tether is a
complex dynamic system in itself. The cage adds an additional level of complexity
because of its non-linear dynamic characteristics. An accurate numerical model should

be very useful to predict unsafe sea conditions and can identify changes necessary to
improve system operation.
The focus in modelling tethered underwater vehicles has been on towed systems
(see Ablow and Schechter, 1983; Hover and Yoerger, 1992; Hover, Grosenbaugh and
TriantafyUou, 1994; and Chapman, 1984), and only a few authors have addressed
vertically—tethered systems (Niedzwecki and Thampi, 1991; Driscoll and Biggins, 1993;
and Huang and Vassalos, 1995). In these works, discrete approximation methods are used
for modeling the complex non-linear dynamics of these undersea vehicle systems.
However, we did not find any work comparing the motion and tension in a model of a
vertically tethered system against real data in our literature review. Validation against
real motion and tension measurements is essential in proving the reliability of these
models as an effective tool. Validation data was found for deep sea ocean moorings
(Grosenbaugh, 1996), as well as motion and tension measurements for a diving bell
operating near the surface and in the air-sea interface (Mellem, 1979). The lack of
available data for vertically-tethered systems and the need to validate our finite-element
lumped-mass model led to an extensive field test in which we measured the motion and
tension of a caged ROV system.
In this paper, we present the motion and tension in the tether of a caged ROV
system operating at sea. We provide a detailed overview of the ROV system and
instrumentation used. Signal processing that converts the data into a useful form for our
analysis is presented. We expand a technique that combines different measurements into
a single enhanced signal. While the model validation is not directly addressed in this
56
paper, this data nevertheless provides many insights into the dynamic characteristics of
the caged ROV system. In particular, the system is weakly non-linear, the vertical cage
motion is larger than that of the ship, and the system is not operating far from its natural
frequency. Additionally, several snap loads were recorded that provide novel insights into
some mechanisms leading to premature tether failure. Lastly, the data supports the
assumption that the dominant motion occurs in the vertical direction and that a o n e-
dimensional model should be sufficient to predict the motion of the cage. It is shown in
Part n of this paper that the transfer function (both magnitude and phase) between ship
and cage motion and the natural frequency and harmonics can be accurately predicted by
a continuous one-dimensional model.
2. ROV System and Instrumentation
2.1 ROPOS remotely operated vehicle system
Motion data were collected for the ROPOS (Remotely Operated Platform for
Oceanographic Science) deep sea ROV system (an International submarine Engineering
Hysub 5000, ISE 1998) while it was operating over the Juan de Fuca Ridge,
approximately 200 km off the coast of British Columbia, Canada. ROPOS is a caged
ROV system capable of diving to 5 000 m, which weighs 26 700 N in air and has
dimensions of 1.45 m x 2.6 m x 1.7 m (WLH). A 300 m retractable tether attaches the
ROV to the cage (garage), where it can reside during deployment and recovery. The cage
is essentially a large weight that keeps the underwater system directly below the ship and
contains many of the electronic systems and power supplies needed by the ROV. The
cage weighs 49 000 N in air and has dimensions o f 2.1 m x 3.4 m x 4.2 m (WLH). The

57
tether connecting the ship and cage has three layers of steel armour surrounding a core of
electrical and optical conductors. The tether is 3 cm in diameter, 4 200 m long, weighs
30.5 N m '\ has a maximum working load and breaking strength of 200 000 N and
550 000 N, respectively. The support vessel used is the arctic survey vessel CSS John P.
Tully which is 69 m long with a beam of 14 m.
2.2 Instrumentation
We wanted to measure the motion o f the tether at the ship, the motion o f the cage
and the tension in the tether. Thus, two sites were instrumented: the top of the ship’s A—
frame (directly above the sheave that supports the tether) and the top of the ROV cage.
The accelerations and rotation rates were measured using tri-axial, orthogonal
accelerometers and rate gyros at each location. Corresponding accelerometers and rate
gyros axes were closely aligned. A pressure sensor was used to measure the cage depth
and its rate of change. A load cell in the axle o f the sheave was used to measure tension
in the tether at the A-frame. Thermometers were located in each gyro sensor and the cage
accelerometers to allow temperature correction of the signals, though the actual
corrections proved to be small and of no practical consequence.
Signals from the accelerometers, rate gyros and load cell were low-pass filtered
and sampled at 256 Hz to a resolution o f 16 bits. Eight-pole elliptic low-pass filters with
a cutoff at 100 Hz were used to suppress aliasing. Temperature, pressure and its analog
derivative were sampled at 32 Hz to a resolution of 16 bits (Table 1).
58
The data were sampled sequentially from both sites by a single computer aboard
the ship. The data were acquired by the software/hardware Ocean Data Acquisition
System, ODAS (Fig. 2), developed at the University of Victoria. CD AS was chosen
because of its ability to rapidly interrogate sensors that are widely distributed, with a
pattern and temporal co-ordination determined by a central computer. The sampling jitter
is negligible (less than 10'^ s) and the samples from the remote cage and the ship A—
frame are completely synchronised. Sampling commands and data were communicated
serially from the ship-board computer to the remote sites using shielded and twisted wire
pairs for the A-frame and a pair o f fibre optic conductors for the cage. Thus, it is possible
to relate the instantaneous motions of the A-frame to those o f the cage even though these
two sites are separated by up to 1 765 m (the maximum operating depth for the cruise
discussed here).
3. Signal Processing
3.1 Reference Frames
Three independent reference frames are used in the data processing: an inertial
(earth fixed) frame, I ; and two instrumentation body—fixed frames, one attached to the
cage, and one attached to the ship, . The inertial reference frame [X Y Z) has
its origin at the mean sea surface. X and Y are perpendicular horizontal directions and Z
points down and is aligned with gravity. At the cage, the instrument frame B'' has
directions pointing from stem to bow, starboard to port, and top to
bottom, respectively. The origin is in the pressure case at the top of the cage. The ROV

59
exits from the front (bow) of the cage, in the positive -direction. The ship reference
frame (x^ z^) is defined similarly and has its origin at the top of the A—frame.
The axes of the accelerometers and rate gyros are aligned with the instrument frames.
3.2 Euler angle transformation o f accelerometers
The ship and cage reference frames are independent and rotate differently; thus,
the signals in each need to be transformed into a fixed, common frame of reference for
comparison. The inertial frame is a convenient choice and allows easy removal o f the
gravitational signal in the accelerometers. Premultiplying the accelerometer records by
the rotation matrix L ib transforms the data into the inertial frame. L jb is constructed using
three consecutive Euler angle rotations about the z, y and x axes, in that order. The
rotation angles are defined as: yr —yaw about z; 0 -pitch about y; and 0 -ro ll about x
(Etkin Chapter 4, 1972).
A ' = L , ^ ' ( 1)
cy/cd cyfs6s(p — syfc(p cy/s6c(p + syfs(p 'K^IB — syrcd sy/s6s(p + cy/c(p syfs6c(j) — cyfs({> A '= a ' = <
- s 6 c6s(p C 0 C 0 _a :_ a'.
s- = sin(-) c- = cos(-)
where A ' and a ' are the acceleration vectors (including gravitational acceleration)
expressed in the inertial and instrumentation reference frames.

60
3.3 Accelerometer Integration
Accelerometers measure force per unit mass along their axis of sensitivity. Thus,
if an accelerometer measures along an axis that is not perpendicular to gravity, it will
report inertial acceleration as well as the component of gravity. Because the
instrumentation frames rotate around all three axes of I with respect to gravity, the
acceleration measurements are “contaminated” by gravitational acceleration. After
transforming the accelerometer signals from the instrumentation frame to the inertial
frame, the “contamination” only appears in the vertical component as a constant offset
that is easily removed by subtraction.
A = L ,gU '-g g = [0,0,g]^
where A is the translational acceleration vector in the inertial reference frame and g is
the gravitational acceleration.
Motion measurements at the top end of the tether and at the cage centre of gravity
were required. The ship board accelerometers were mounted very close to the sheave and
provided the former. However, the cage mounted accelerometers were located a distance
from the cage centre of gravity. The accelerations of the centre of gravity of the cage,
therefore, had to be calculated using;
+0) x(m xr*''')) (2)
61
where and are the cage accelerations at the centre of gravity and at the sensor
mounting point respectively; r ’ ’’ = r ^ ’’ is the position vector from the
cage centre of gravity to the sensor mounting point, expressed inB*" ; and
0) = [ty^ OJy (o .^ and A = [a^ A^ A, are the vectors of angular velocities and
angular accelerations, expressed in
The vertical velocity of the ship and cage, in the inertial frame, were calculated by
integrating the inertial acceleration records. The accelerations of the ship and cage were
first high-pass filtered, to remove bias, and integrated by convolving the resulting signal
with a first-order low-pass Butterworth filter (Antoniou Chapter 5, 1979). The resulting
velocity records of the ship and cage were integrated using the same technique to
calculate the position.
3.4 Pressure Record Enhancement
A pressure sensor attached to the cage provided an accurate measure of depth.
However, the range of the pressure signal was 5 000 m and since the digitization was
limited to 16 bits; the digital resolution was very coarse. The analog derivative of the
pressure signal was also recorded and had a much smaller range, thus preserving the high
resolution of the pressure signal. Combining the pressure and pressure derivative records
(Mudge and Lueck, 1994), the resolution of the signal was increased from 0.15 to 0.02 m.
This is equivalent to using a 19 bit A/D converter. For operation at a nominally stationary
depth, the acceleration at the location of the pressure sensor was calculated using (2). The
two cage vertical position records, one from the integration of the acceleration records
62
and one from the pressure record were overlaid and were nearly identical. For a 2 000 s
record with vertical motions of 0.86 m rms, the difference between the position signals
was less than 0.04 m rms, which is close to the resolution of the pressure signal and
mostly due to the wider bandwidth of the acceleration record.
3.5 Euler angle calculation
The Euler angles, jS = [^ 6 were not directly measured. They were instead
synthesised from a combination of the accelerometer and rate gyro measurements. At
very low frequencies ( / < 01 Hz ), the inertial accelerations are very small and the
gravitational acceleration g dominates the accelerometer output, thus:
[a')^ = LB,g (3)
where {a')^ is the low-frequency component of the acceleration vector and L^, —
After low-pass filtering a ' , a low-frequency estimate of roll, and pitch, 0^ is
provided by solving the first and second components of (3) for:
0^ = sin -1 (4a)
(pi = sin 'gcos(0^)
This technique cannot yield a low-frequency yaw estimate.
(4b)
63
Higher frequency information about the roll and pitch is provided by the gyros in
terms of rotation rates. The time derivatives of the Euler angles were found according to
(Etkin Chapter 4, 1972):
P = T bOJ (5)
"l sin(0)tan(0) cos(0) tan(0) 0Ts = 0 cos(0) -sin(0) 0
0 sin(0)sec(0) cos(0)sec(0) V
The estimate of Tg requires a priori knowledge of the roll and pitch angles, but
these are known only for low frequencies (from the accelerometers). Therefore, an
iterative method is used to accurately calculate Euler rates (Fig. 3). In the first iteration,
Tg is calculated using 0^ and 0^, and the resulting Euler rates are used to calculate the
Euler angles. In subsequent iterations, Tg is recalculated using roll and pitch angles from
the previous iteration. Using this method, the roll and pitch rates converge to 0.01% of
their final value after three iterations.
Direct integration of the Euler rates should yield the Euler angles. However, the
Euler rates are subject to slight error in the form o f an offset (bias), causing the integrated
signal to drift. High-pass filtering can reduce the drift, but also eliminates all information
with frequencies less than the filter cut-off. The pre-emphasized (Mudge and Lueck,
1994) roll 0£-(t) (pitch B^(jt) ) was obtained by combining the low-frequency roll 0^
(pitch 0^) with the roll rate 0 (pitch rate 0):
64
where is a filter cut off frequency (explained next). The pre-emphasised roll and
pitch C^£, 0£- ) contain low-frequency information from the accelerometers (^ ^ ,9 ^ ) and
high-frequency information from the gyros ( 0 ,0 ) . The roll and pitch signals are
recovered for all frequencies by low-pass filtering (deconvolving) the pre-emphasised
signals with a single-pole low-pass with a cut-off at (Mudge and Lueck, 1994).
Using this technique, information is preserved at all frequencies and the resulting signals
are drift free. Measurements that contain low-frequency yaw information, such as
compass heading, were not available, and therefore we could not apply a similar
procedure to the yaw rate. Instead, the yaw rate was high—pass filtered and directly
integrated to yield the yaw angle. Therefore, the relative bearing between the ship and
cage is unknown, but this is not essential in our analysis.
4. Motion Observations
Motion and tension measurements were made during five dives (Table 2), which
include periods of deployment (descent to bottom), recovery (ascent to ship) and near
bottom operation. The ascents and descents were interrupted at a variety of depths for
approximately 5 minutes to provide stationary data (Table 3). Data were collected for up
to 3.5 hours when the cage was at its terminal depth for scientific operations of the ROV
(typically 1 730 m). The maximum depth was 1 765 m. Sea conditions were moderately
rough and the sheave experienced typical vertical displacements of 2 m, peak-to-peak.
Several intervals of relatively calm and rough sea conditions occurred with sheave

65
displacements less than 1 m and greater than 4 m, respectively. The ship was station
keeping with the bow pointing into the waves during all operations and cross-currents
were typically less than 0.3 m s '\ Wave direction was steady and small adjustments in
position were made using ship thrusters.
The scope of this section is limited to measurements o f the system operating at
nominally constant depths. A total o f 13 140 s of data were recorded while the system
operated at 1 730 m, which we denote as the terminal depth. This is the largest data
record for stationary operation and constitutes 57% of the stationary data. We present this
data along with some examples from shallower depths.
For the terminal depth, spectra of the horizontal and vertical accelerations of the
ship and cage were calculated using a 5 000 s record (Fig. 4). The integral of a signal
spectrum over all frequencies up to the Nyquist frequency yields the signal variance:
where is the auto-spectrum of some signal X ; f is the frequency and is the
Nyquist frequency (half the sample frequency). Spectra were calculated by averaging the
periodograms of data segments 64 s long and overlapped by 50% (Press, et al Chapter 13,
1992). This method increased the statistical certainty of the spectra. For frequencies
above 32 Hz at this depth, there is negligible cage acceleration and the ship and cage
accelerations are incoherent. Therefore, in Fig. 4, we restrict the upper limit of the
frequency axis to 32 Hz. Spectra of the acceleration of the ship peak between 0.1 and
0.2 Hz and decrease rapidly to a minimum at 1.4 Hz. Above 1.4 Hz, there are bands of

66
significant variance and these have been attributed to vibrations of the A—frame. The
spectral gap at 1.4 Hz exists for all conditions and is not particular to operation at the
terminal depth (1 730 m). We use this gap to separate the wave-induced motions from
high-frequency excitations and will refer to these two regions as the wave-frequency and
high-frequency bands, respectively. Spectra of the acceleration of the cage also peak
between 0.1 and 0.2 Hz but there is no clear spectral gap.
4.1 Wave-frequency motion observations
Within the wave-frequency band, we restrict analyses to the frequency range
containing 90% of the variance of the vertical ship acceleration that extends from 0.1 to
0.25 Hz and denote this range as the wave-band. O f the remaining variance, 5% is at
lower frequencies and 5% is at higher frequencies. The motion records of the ship and
cage were high-pass filtered with a cu t-off at 0.1 Hz and are summarised in Table 4. The
motions o f the ship and cage are primarily vertical and the vertical motion of the cage is
larger than that o f the ship. For example, the variances of the horizontal accelerations of
the ship ( and Ay ) are smaller than the variance of vertical acceleration ( Af ) by
factors of 17 and 5.3, respectively. For the cage, the variances of horizontal accelerations
( A^ and Ay ) are smaller than the variance of vertical acceleration ( A ) by factors of
136 and 296, respectively. The ratio of vertical-to-horizontal cage variance is O(IO^) at
all depths from 0—1 765 m. The variance o f the vertical cage acceleration exceeds that of
the ship by a factor 2.19. The ratio of vertical cage-to-ship acceleration variance
decreases with decreasing depth, but remains larger than unity at all depths. For example.

67
at 975 meters the amplitude ratio is 1.53. The large peak-to-peak pitch motions in
Table 4 occur during snap loads which are addressed later.
The spectra of the cage acceleration also peak between 0.1 and 0.25 Hz. The
vertical acceleration peaks at 0.15 Hz and its third and fifth harmonics are evident at 0.44
and 0.73 Hz in Fig. 4(b). The cage is a bluff body, subject to quadratic drag, and thus, can
only produce spectral variance at odd harmonics of the fundamental frequency o f
excitation. A measure o f the non-linearity of the system is provided by the relative
strength of these wave-frequency harmonics. The variance below 0.3 Hz accounts for
98.3% of the total variance, while the subsequent harmonics only contribute 1.3 and
0.1%, respectively. Therefore, the vertical cage acceleration is weakly non-linear within
the range of our measurements. For these measurements, the application of linear system
theory (coherency, cross-spectra, transfer-functions, etc.) is justified. However, the drag
is a quadratic function o f cage velocity, and for higher sea-states, the non-linear response
will become important.
Time series of vertical ship and cage motions are very similar and the larger cage
peak-to-peak motion is evident when the signals are overlaid. A 150 s section is shown
in Fig. 5. The cage motion is larger than the ship motion and therefore implies the system
is operating near a resonant frequency and it is lightly damped within the range o f
motions recorded. Knowledge of the resonant frequencies is crucial to the design of a
ROV system. Either the resonance frequency must be kept outside of the range o f
operation, or the system must be built strong enough to survive operation at, or near, this

68
frequency. The propagation time that the ship motion takes to reach the cage can clearly
be seen in the lag between ship and cage motions.
A measure of the motion amplification between the ship and cage is provided by
the transfer function estimate (TFE). For two related signals, the transfer function is
estimated using:
(7)^XX
where is the cross—spectrum of the signals X (the input) and Y (the output), and
is the auto-spectrum of X . The magnitude o f the TFE between the vertical ship
and cage motion, \h ^s c changes with frequency (Fig. 6). At 0 Hz, is
approximately unity and increases through the wave-band to a maximum of 1.68 at
0.2 Hz. The vertical motion records are very close to Gaussian; therefore, we use the
parametric estimates o f statistical uncertainty as given by Jenkins and Watts (1968,
Chapter 3) to yield the 95% confidence interval (given by the vertical error bars in
Fig. 6). Only statistically coherent data are plotted. For shallower operating depths, the
peak of moves to higher frequencies (Fig. 7).
At wave frequencies, the cage heave lags the ship heave. The time lag is a
measure of the propagation time of motion along the tether from the ship to the cage and
is defined as:
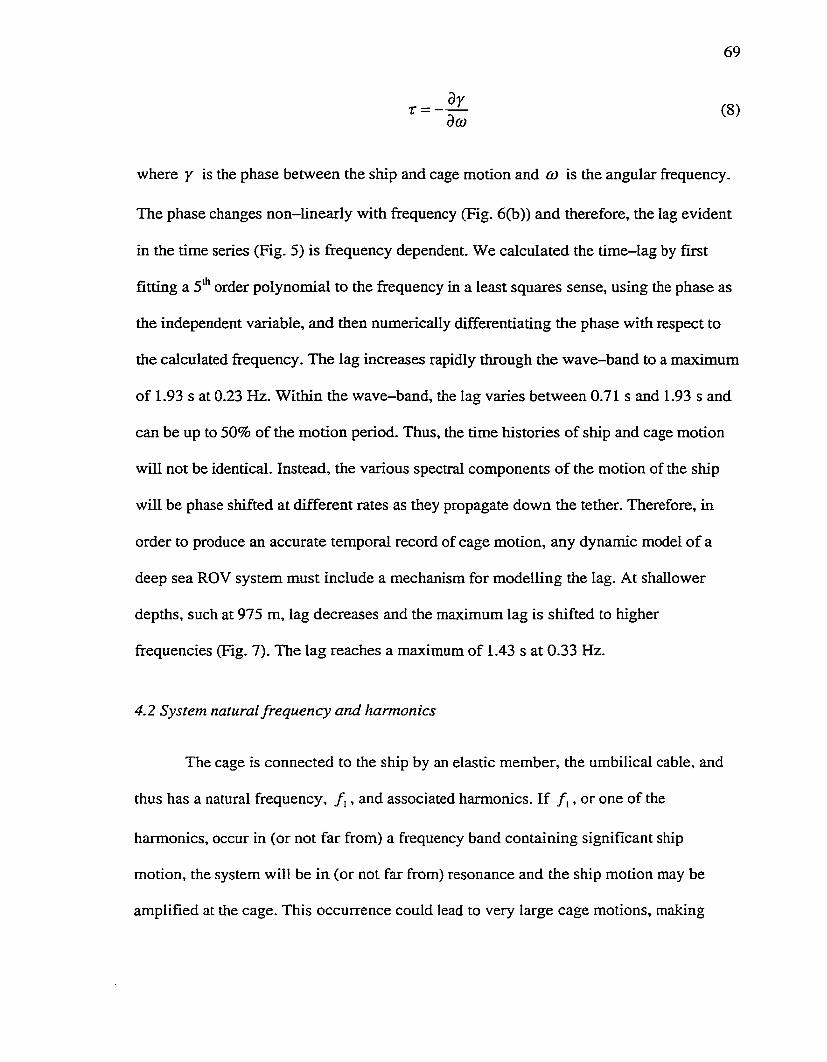
69
r = - | ^ (8)dû)
where y is the phase between the ship and cage motion and co is the angular frequency.
The phase changes non-Iinearly with frequency (Fig. 6(b)) and therefore, the lag evident
in the time series (Fig. 5) is frequency dependent. We calculated the time-lag by first
fitting a 5'*' order polynomial to the frequency in a least squares sense, using the phase as
the independent variable, and then numerically differentiating the phase with respect to
the calculated frequency. The lag increases rapidly through the wave-band to a maximum
of 1.93 s at 0.23 Hz. Within the wave-band, the lag varies between 0.71 s and 1.93 s and
can be up to 50% of the motion period. Thus, the time histories of ship and cage motion
will not be identical. Instead, the various spectral components o f the motion of the ship
will be phase shifted at different rates as they propagate down the tether. Therefore, in
order to produce an accurate temporal record of cage motion, any dynamic model o f a
deep sea ROV system must include a mechanism for modelling the lag. At shallower
depths, such at 975 m, lag decreases and the maximum lag is shifted to higher
frequencies (Fig. 7). The lag reaches a maximum o f 1.43 s at 0.33 Hz.
4.2 System natural frequency and harmonics
The cage is connected to the ship by an elastic member, the umbilical cable, and
thus has a natural frequency, f , and associated harmonics. If / , , or one of the
harmonics, occur in (or not far from) a frequency band containing significant ship
motion, the system will be in (or not far from) resonance and the ship motion may be
amplified at the cage. This occurrence could lead to very large cage motions, making
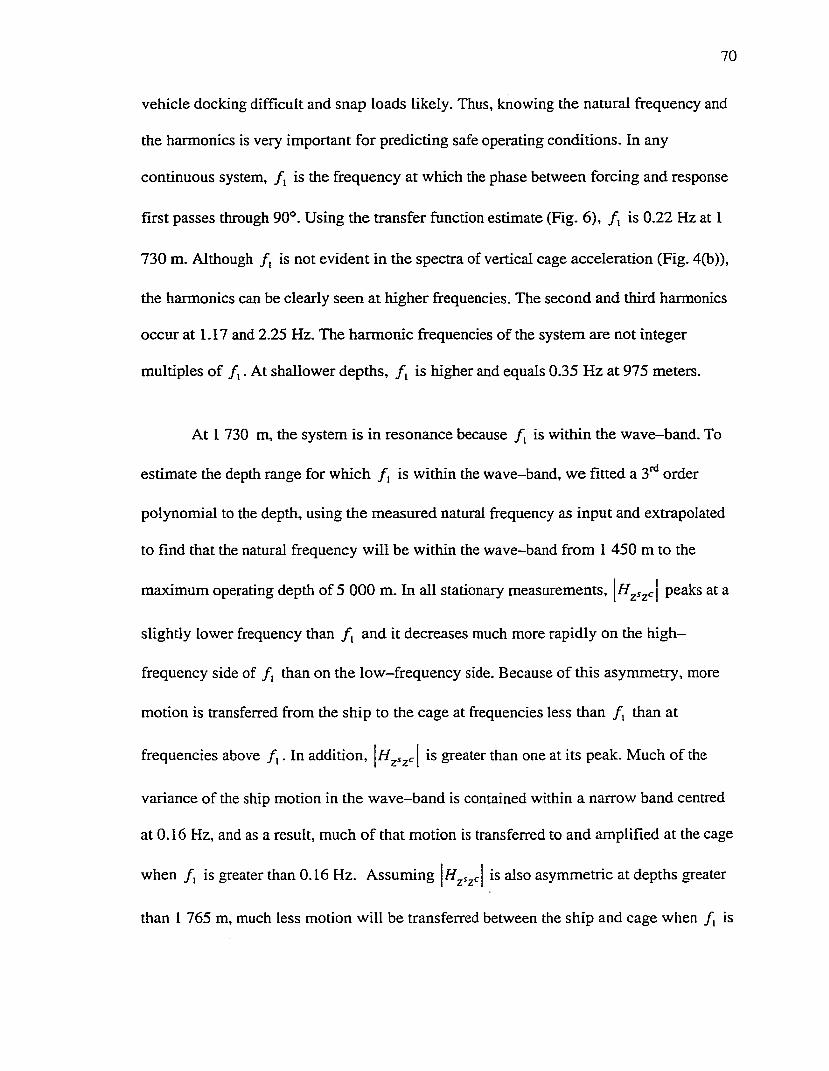
70
vehicle docking difficult and snap loads likely. Thus, knowing the natural frequency and
the harmonics is very important for predicting safe operating conditions. In any
continuous system, / , is the frequency at which the phase between forcing and response
first passes through 90°. Using the transfer function estimate (Fig. 6), / j is 0.22 Hz at I
730 m. Although is not evident in the spectra of vertical cage acceleration (Fig. 4(b)),
the harmonics can be clearly seen at higher firequencies. The second and third harmonics
occur at 1.17 and 2.25 Hz. The harmonic frequencies of the system are not integer
multiples of / , . At shallower depths, / j is higher and equals 0.35 Hz at 975 meters.
At 1 730 m, the system is in resonance because / , is within the wave-band. To
estimate the depth range for which / , is within the wave-band, we fitted a 3"* order
polynomial to the depth, using the measured natural frequency as input and extrapolated
to find that the natural frequency will be within the wave-band from 1 450 m to the
maximum operating depth of 5 000 m. In all stationary measurements, peaks at a
slightly lower frequency than / , and it decreases much more rapidly on the high-
frequency side of / , than on the low—frequency side. Because of this asymmetry, more
motion is transferred from the ship to the cage at frequencies less than f^ than at
frequencies above / , . In addition, is greater than one at its peak. Much of the
variance of the ship motion in the wave-band is contained within a narrow band centred
at 0.16 Hz, and as a result, much of that motion is transferred to and amplified at the cage
when / , is greater than 0.16 Hz. Assuming is also asymmetric at depths greater
than 1 765 m, much less motion will be transferred between the ship and cage when / , is

71
less than 0.16 Hz. We estimate that / , coincides with the spectral peak of ship
acceleration (0.16 Hz) at 2 940 m.
4.3 High-frequency motion observations
In the high-frequency band ( / > 1.4 Hz), the system is excited by broad-band
ship vibration and narrow-band cage vibration which are small in magnitude and do not
significantly excite the cage. Consequently, the transfer function estimate suffers from
large uncertainty and is not presented for the high-frequency band. However, snap loads
do provide significant excitation in the high-frequency band and w e discuss the
associated transfer function in the following section.
4.4 Snap Loads
Snap loads cause structural damage to the tether and its internal electrical and
optical components. Additionally, large vertical cage displacement, cage pitching, and
excitation of system harmonics occurred during snap loads in the ROPOS ROV system.
Thus, an understanding of snap loads and the ensuing cage motion is essential to the
development of counter-measures that increase tether life, reduce undesirable cage
motion, and possibly eliminate snap loads. In our literature search, we were not able to
find any measurements of snap loads for a deep-sea ROV system. Here, we present an
overview of the motion and tension measurement for several snap loads recorded when
the system was operating at the terminal depth (1 730 m).
For a typical snap load, the tether tension, vertical ship and cage motions, and the
cage pitch are shown in Fig. 8. The motion of the system during a snap load is different

72
from that during normal operation. Most notably, the cage experiences a large pitch and
the A-frame “rings”. As well, the motion exhibits non-linear characteristics such as a
nearly discontinuous vertical cage acceleration. Using 16 s records of 8 snap loads, the
variance and maximum deviations for these measurements were calculated (Table 5).
During a snap load, the variances of the vertical acceleration of ship and cage and the
pitch of the cage were larger than their variances during typical operation by factors of
5.8, 3.21 and 13, respectively. Other motions (e.g. roll, yaw, etc) were only slightly
affected by snap loads and remained within their normal range (Table 4).
AU snap loads are characterised by a series o f jerks: rapid increases in the vertical
acceleration. These jerks typicaUy begin when the ship and cage are near the bottom of
their motion cycle and continue for at least one wave period. A jerk typically lasts for
0.15 s, during which, the cage may accelerate by up to 5 ms ". Rapid increases in tether
tension cause the cage jerks. In Fig. 9, the acceleration records of 8 snap loads are
overlaid. Clearly, the jerks are not random, but occur at regular intervals, common to all
snap loads at the same operating depth. A measure o f a jerk is often defined as the time
derivative of the acceleration (Hibbeler, 1989, Chapter 12). In Fig. 10 (a), the jerk records
for the same 8 snap loads are overlaid and are remarkably similar. The cage jerks have
corresponding rapid increases in tether tension (measured at the surface) that lag in time
(Fig. 8). The mass o f the ship is much larger than that o f the cage and therefore, the
acceleration of the ship is only minimally affected by a snap load. The rapid increases in
tension are emphasised by taking the first time derivative of the tension records
corresponding to the 8 snap loads. Again, we see that all 8 records are remarkably similar
(Fig. 10(b)). Thus, we ensemble averaged the records of the derivatives of jerk and
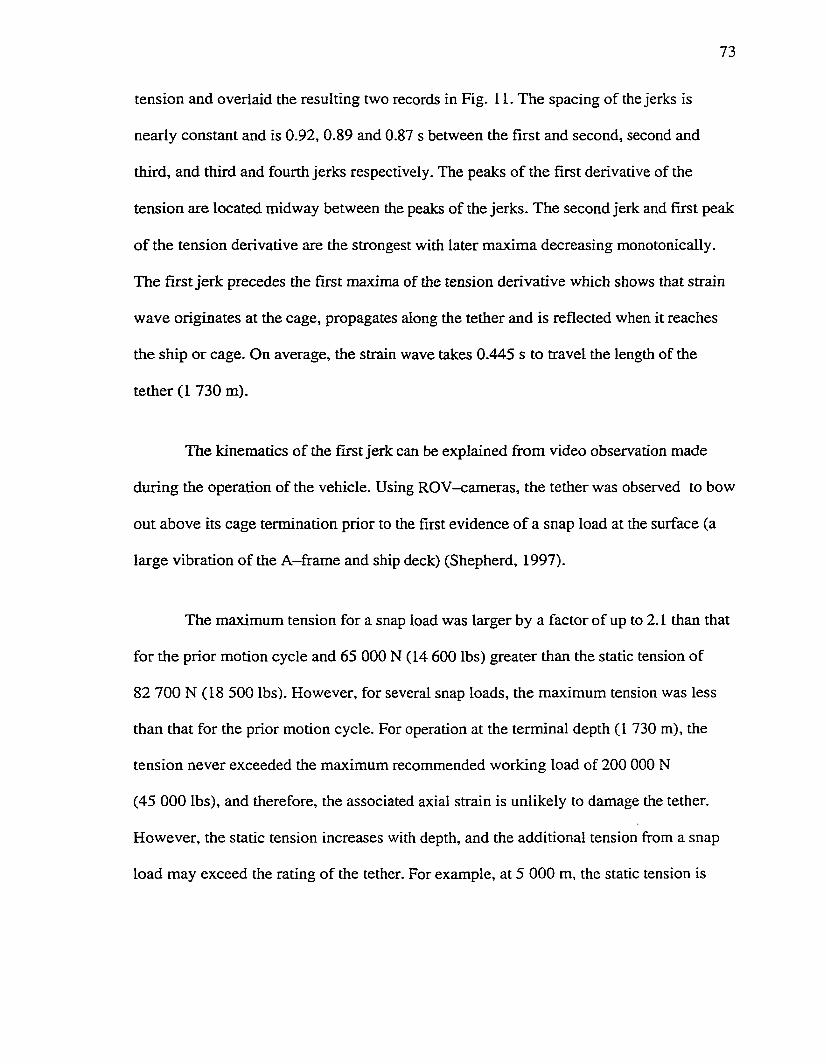
73
tension and overlaid the resulting two records in Fig. 11. The spacing of the jerks is
nearly constant and is 0.92, 0.89 and 0.87 s between the first and second, second and
third, and third and fourth jerks respectively. The peaks of the first derivative of the
tension are located midway between the peaks of the jerks. The second jerk and first peak
o f the tension derivative are the strongest with later maxima decreasing monotonically.
The first jerk precedes the first maxima of the tension derivative which shows that strain
wave originates at the cage, propagates along the tether and is reflected when it reaches
the ship or cage. On average, the strain wave takes 0.445 s to travel the length of the
tether (1 730 m).
The kinematics o f the first jerk can be explained firom video observation made
during the operation of the vehicle. Using ROV-cameras, the tether was observed to bow
out above its cage termination prior to the first evidence o f a snap load at the surface (a
large vibration of the A—frame and ship deck) (Shepherd, 1997).
The maximum tension for a snap load was larger by a factor o f up to 2.1 than that
for the prior motion cycle and 65 000 N (14 600 lbs) greater than the static tension of
82 700 N (18 500 lbs). However, for several snap loads, the maximum tension was less
than that for the prior motion cycle. For operation at the terminal depth (1 730 m), the
tension never exceeded the maximum recommended working load of 200 000 N
(45 000 lbs), and therefore, the associated axial strain is unlikely to damage the tether.
However, the static tension increases with depth, and the additional tension from a snap
load may exceed the rating of the tether. For example, at 5 000 m, the static tension is
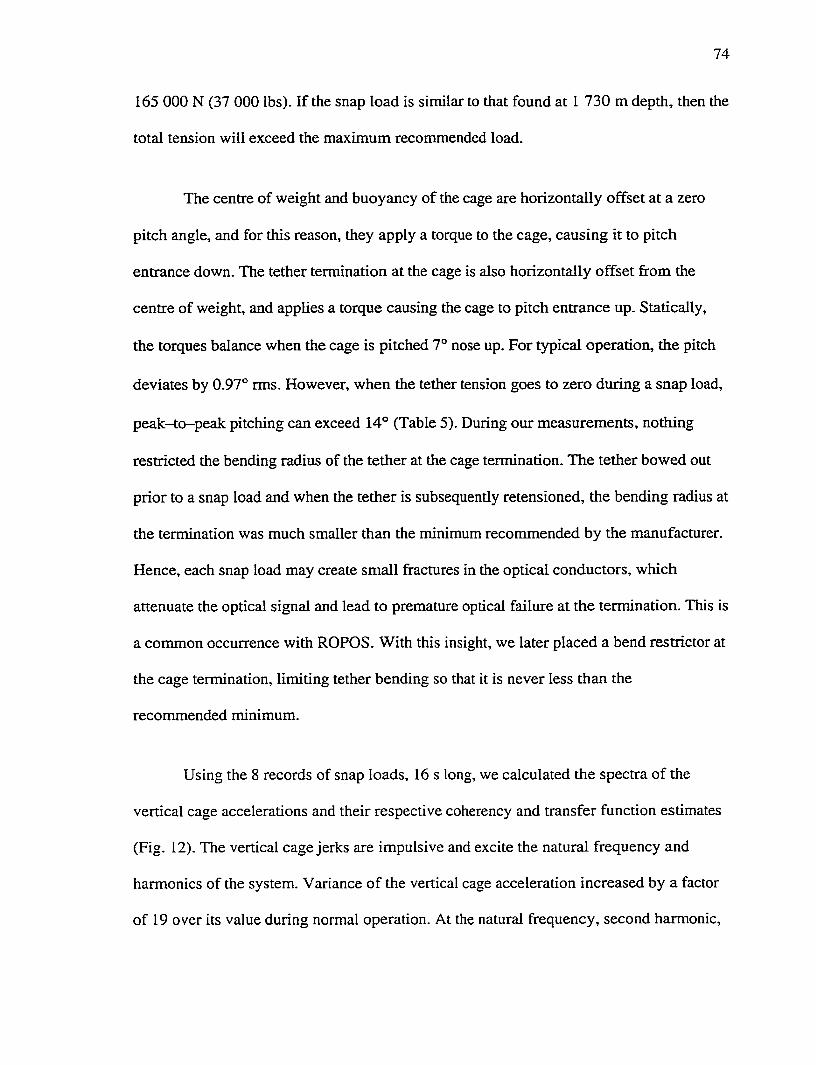
74
165 000 N (37 000 lbs). If the snap load is similar to that found at I 730 m depth, then the
total tension will exceed the maximum recommended load.
The centre of weight and buoyancy of the cage are horizontally offset at a zero
pitch angle, and for this reason, they apply a torque to the cage, causing it to pitch
entrance down. The tether termination at the cage is also horizontally offset from the
centre of weight, and applies a torque causing the cage to pitch entrance up. Statically,
the torques balance when the cage is pitched 7° nose up. For typical operation, the pitch
deviates by 0.97° rms. However, when the tether tension goes to zero during a snap load,
peak-to-peak pitching can exceed 14° (Table 5). During our measurements, nothing
restricted the bending radius of the tether at the cage termination. The tether bowed out
prior to a snap load and when the tether is subsequently retensioned, the bending radius at
the termination was much smaller than the minimum recommended by the manufacturer.
Hence, each snap load may create small fractures in the optical conductors, which
attenuate the optical signal and lead to premature optical failure at the termination. This is
a conunon occurrence with ROPOS. With this insight, we later placed a bend restrictor at
the cage termination, limiting tether bending so that it is never less than the
recommended minimum.
Using the 8 records of snap loads, 16 s long, we calculated the spectra of the
vertical cage accelerations and their respective coherency and transfer function estimates
(Fig. 12). The vertical cage jerks are impulsive and excite the natural frequency and
harmonics of the system. Variance of the vertical cage acceleration increased by a factor
of 19 over its value during normal operation. At the natural frequency, second harmonic.

75
and third harmonic, the transfer function estimate exceeds 100, 10, and 3 respectively,
and it is between 1 and 2 at higher frequencies. The ship and cage are typically in phase
or 180° out of phase f o r / > 1 Hz. These phase characteristics are consistent with that of
an elastic system. However, the changes in phase do not occur at the natural frequency or
the harmonics. The effects o f snap loads at deeper operation are not clear, but will surely
exacerbate the undesirable motions and tether damage outlined in this section.
Excitation of the harmonics is also seen in the high-frequency oscillation o f the
acceleration record of the A—frame (Fig. 8). The scale o f the high-frequency vertical cage
motion is much smaller than at wave frequencies and is not clearly visible in Fig. 8. Thus,
we high-pass filtered the vertical cage acceleration and position records to isolate the
high-frequency motion imparted during a snap load (Fig. 13). The high-frequency
motion decays slowly which indicates that the system is highly under-damped at these
frequencies and velocity amplitudes.
5. Wave Frequency Motion Relationships
Development of efficient and accurate dynamic models requires a prior
knowledge of what motion variables are important and must be included in the model. In
this section, we use spectral techniques to identify (/) the ship motion variables that are
important in forcing the system, (ü) the cage motion variables that respond coherently
and {Hi) the significance of the response. Motion measurements were made of all 6
degrees of freedom at the ship and cage; 3 translational accelerations, and 3 rates o f
rotation. Each of these measurements corresponds to a unique motion variable. We will
identify relationships between any two variables (motion variable pairs) of the set of 12
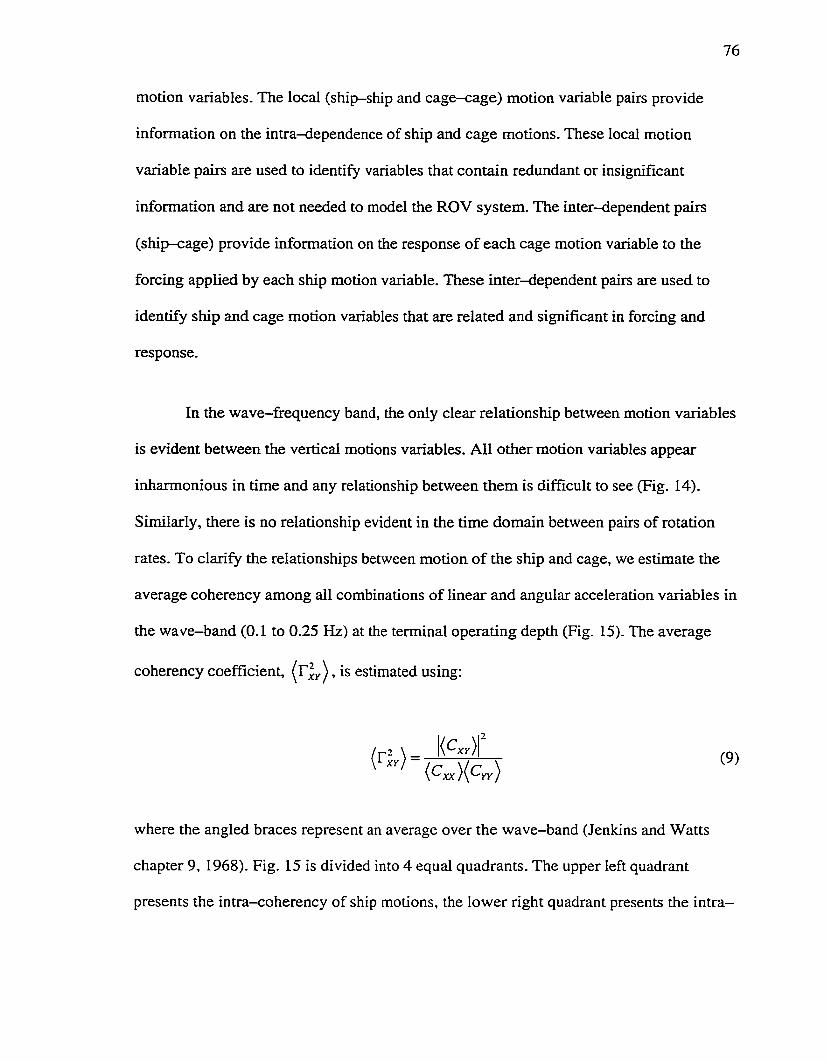
76
motion variables. The local (ship-ship and cage—cage) motion variable pairs provide
information on the intra-dependence of ship and cage motions. These local motion
variable pairs are used to identify variables that contain redundant or insignificant
information and are not needed to model the ROV system. The inter-dependent pairs
(ship-cage) provide information on the response of each cage motion variable to the
forcing applied by each ship motion variable. These inter—dependent pairs are used to
identify ship and cage motion variables that are related and significant in forcing and
response.
In the wave-frequency band, the only clear relationship between motion variables
is evident between the vertical motions variables. All other motion variables appear
inharmonious in time and any relationship between them is difficult to see (Fig. 14).
Similarly, there is no relationship evident in the time domain between pairs of rotation
rates. To clarify the relationships between motion o f the ship and cage, we estimate the
average coherency among all combinations of linear and angular acceleration variables in
the wave-band (0.1 to 0.25 Hz) at the terminal operating depth (Fig. 15). The average
coherency coefficient, , is estimated using:
where the angled braces represent an average over the wave-band (Jenkins and Watts
chapter 9, 1968). Fig. 15 is divided into 4 equal quadrants. The upper left quadrant
presents the intra-coherency of ship motions, the lower right quadrant presents the intra-

77
coherency between cage motions and the lower left quadrant presents the inter-coherency
between the ship and cage motions. The information is symmetric about the diagonal and
thus, the upper triangle is left blank for clarity. Any variable pair having coherency
greater than 0.4 is significant and there are five significant ship-cage motion pairs:
A^ - A^, - A^, A | - A f , and A^ - A^ (Table 6).
Three ship motion variables, A | , A ^ , and A^ are related to A^ (Table 6). We
will now show that A^ and Ay are redundant and can be eliminated because much of the
acceleration of the A-firame is due to the roll and pitch accelerations of the ship about a
point of minimal vertical acceleration (2). For this reason, A | is 41% and 76% coherent
with A^ and Ay, respectively. The vertical acceleration of the ship measured at the A -
firame is, (the angular velocity terms are small and omitted):
A^ = A ^-^ + A^ - A^y/?f (10)
where is the vertical ship acceleration at the centre of rotation; and
^CR-MP _ ^^cR-up ^CR-MP -g position vector from the point of minimal
vertical acceleration to the instrumentation mounting point. All vector components are
expressed in the inertial frame. The part of A^ due to the angular accelerations is
therefore:
A = A ^ ( I I )
Solving (11) for and Ry' in the frequency domain gives:
78
c c cU " ^'4,4 ) - ^
c c cn C R - M P ( ^ 1-2 \ __ m i , \
[ ^ - ^ ^ W r ) - ~ 7^ -----------
Applying the average of (12a) and (12b) over the wave-band to the data from 1 730 m,
we find that the ship predominantly pitches about an axis located 30 m ahead of the
accelerometers on the A-frame. Using the same development for A y , we find that ± e
ship rolls about an axis located 15 m below the accelerometers. These axes intersect near
the nominal centre of gravity of the ship. Using this intersection as the ship’s
predominant centre of rotation, Ay and Ay account for 90% of ± e variance of the A | ,
while only 10% is due to heave. Thus, we conclude that A | already includes all the
effects of Ay and Ay, making redundant an explicit consideration of the variable pairs
A^ — A^ and A^ — A^ .
Both the ship motion variables Ay and Ay are related to Ay . Again, Ay is
redundant because its effect is included in Ay . We will now show that we can reject the
relationship pair Ay — Ay as negligible in comparison to Ay — Ay . Statically, the cage
pitch is 7° (entrance up) and therefore, the outer surfaces are inclined with respect to the
vertical axis. When moved vertically, the inclined surfaces cause water to flow
asymmetrically around the cage which forces the cage sideways. Thus, the X—
acceleration of the cage is directly related to its vertical motion, explaining the 76%
coherency between Ay and Ay (Fig. 15) and the 63% coherency between Ay and A y .
79
We introduce the relative coherent variance (the magnitude squared of the transfer
function averaged over the wave-band), a measure o f variance transferred between
related variables, to compare the variance transferred between variable pairs. The relative
coherent variance between signals X (the input) and Y (the output) is:
Between Af and A ^ , the relative coherent variance is only 0.01 and it is even smaller
between A | and A ^ . For comparison, the relative coherent variance between A^—A is
1.95. Therefore, we declare the relationship pair A |—A^ as negligible.
Neither measurement system carried a compass, and therefore we do not have a
measure of the absolute orientation of the ship and cage in the horizontal plane. We did
measure the rate of rotation about the vertical axis and integrated it to obtain the angular
position around the vertical axis. However, the integration ignored frequencies below
0.025 Hz to suppress the bias in the rate measurement. The ship orientation was nearly
steady fo r /< 0.025 Hz due to the active station keeping. Therefore, the horizontal
orientation of the ship and cage in the inertial frame are each unknown by a constant of
integration, and the two frames could be in relative rotation at frequencies below
0.025 Hz. Hence, the individual components of acceleration in the horizontal plane
cannot be compared directly. However, the horizontal acceleration can be compared by
combining the X and V components into a vector or complex time series ( A„ = A + JAy )
which is composed of a counter-clockwise rotating component (positive frequencies) and
80
a clockwise component (negative frequencies) (Mooers, 1973). In the wave-band, the
horizontal acceleration of the ship and cage were 15% (10%) coherent and had a relative
coherent variance of 0.0059 (0.0035) for clockwise (counter-clockwise) rotations. These
low values can be attributed to the hydrodynamic damping o f the horizontal motion of the
tether and to the large (= 1:1000 ) horizontal-to—vertical aspect ratio of the position vector
connecting the ship and cage. As a result, the relative coherent variance between
horizontal acceleration of the ship and cage are small in comparison to that of the vertical
accelerations and therefore, can be neglected for modelling purposes.
The variance of the vertical acceleration of the cage is 2.19 times greater than the
vertical acceleration of the ship and the signals are 89% coherent with a relative coherent
variance of 1.95. Clearly, and are more closely related than any other non-
redundant variable pair and have the largest relative coherent variance. Therefore, the
only significant relationship in the wave-band is between the vertical motion variables
(of the ship and cage) and a one-dimensional model should be sufficient to predict cage
motion due to ship forcing.
6. Discussion
Knowing the natural frequency of an ROV system is essential to identify ships
with compatible motion characteristics and to predict the safe operating conditions at the
desired depth of operation. The natural frequency of the ROV decreases with increasing
operating depth and is 0.35 Hz at 975 m and 0.22 Hz at 1 730 m. The forcing is
predominately in the wave-band (0.1-0.25 Hz). Within the depth range of our
measurements, the vertical cage motion was larger than that of the ship and the cage-to-
8 1
ship motion ratio increased with depth. These measurements are consistent with a system
being forced at frequencies equal to or not far from its natural frequency. The fact that the
ship-to-cage amplitude ratio increases with depth is also consistent with the natural
frequency moving towards the wave-band. We estimate that the natural frequency wül be
within the wave-band for the depth range 1 450 to 5 000 m. Because of the asymmetry of
the transfer function about the natural frequency, we predict the greatest amplification of
cage motion wLU be for depths between 1 450 and 2 940 m where is higher than the
peak of the wave-band (0.16 < < 0.25 Hz). Considering these characteristics, it is not
surprising that snap loads and large vertical cage displacements were common at the
terminal operating depth (1 730 m). One large displacement during a docking attempt
sheared the tether cormecting the cage and ROV. Luckily, the ROV was positively
buoyant and so eventually floated to the surface.
The lag is an important factor characterising the relationship between ship and
cage motions. For example, in dynamic models o f ROV systems, the lag must be
included to accurately predict time histories of cage motion. Within the wave-band, the
lag changes non—linearly with frequency and the frequency corresponding to the
maximum lag decreases with depth. This lag-frequency relationship results because the
phase is a function of the elastic, inertial and drag properties of the entire system. At
1 730 m, the maximum lag is 0.91 s. However, all strain waves resulting from the snap
loads consistently take 0.445 s to propagate the length of the tether with very little
dispersion of the frequency content. The propagation speed is equal to the longitudinal
speed of sound in the tether, approximately 3 870 ms '.
82
We initially thought that snap loads damage the tether and its internal electrical
and optical conductors. However, the magnitudes o f the tension spikes are smaller than
initially thought, and the maximum tension recorded at the sheave, 145 500 N
(32 600 lbs), never exceeded the manufacturer’s recommended limit of 200 000 N
(45 000 lbs). Was the tension at the cage larger than the maximum recommended by the
manufacturer? At the cage, the static tension is 40 500 N (9000 lbs), half of that at the
ship. Assuming that the magnitudes of the tension spikes at the cage, less the mean
tension, are similar to those measured at the sheave, the manufacturer’s recommended
limit was also never exceeded at the cage. Thus, it is unlikely that the strain induced by
tension caused any structural or internal damage to the tether. However, tether damage
occurs regularly with ROPOS and most likely results from the bending of the tether at the
cage termination when the tether bows while it is slack and when the cage pitches during
retensioning. Using the ROV cameras, the tether was observed to bow significantly prior
to the snap load. During the subsequent retensioning, the cage pitched from 4 to —12°
(Fig. 8). Thus, with the tether under tension, a tight bend formed in the tether as the cage
pitched and was likely much less than the minimum bending radius recommended by the
tether manufacturer. Tight bending of this type causes fractures to form in the fibre optic
communication lines and stresses the steel armour. With this knowledge, we understand
why tether damage only occurs in a short section (< 2 m) at the cage termination. For
example, near the end of the experiment, the fibre optic lines failed, and a 2 m section of
tether at the cage termination was removed. The tether was reterminated, and
communication was re-established with the cage. Frequent retermination may have
prevented fatigue failure of the armour (and the loss o f the cage and ROV).
83
Snap loads may also impact the components of the cage. The jerks (resulting from
the snap loads) were rapid and large in magnitude, both shocking and vibrating the cage.
During several jerks, the cage acceleration was up to half of gravity, and it rapidly
oscillated with an amplitude of up to 5 cm peak-to-peak at its second harmonic
frequency (1.17 Hz). Under these conditions, electronic and mechanical components can
be shaken free and structural damage may occur from the large and rapid changes in
acceleration. Although the tension spikes did not damage the tether directly, the resulting
motions are very destructive and thus, snap loads need to be eliminated to reduce damage
to the cage.
The initial purpose of our experiment was to obtain data for validating our
existing one-dimensional dynamic numerical model of the ROV. The analysis of the data
has outlined many motion characteristics that can be used to validate our model and
justify our one-dimensional assumption. In particular, the only significant relationship
between the ship and cage motion is in the vertical direction. Only the vertical motions
need to be included in a model and the remaining 5 degrees of freedom need not be
modelled. Thus, a one-dimensional dynamic model should be sufficient to accurately
reproduce these measurements.
The striking characteristics of the ROV system provide challenging tests for
numerical models. Realistic models should reproduce: (/) the non-linear transfer function
between ship and cage motions (both magnitude and phase), (n) the natural frequency
and harmonics, and (a/) the regular pattern of cage acceleration and tether tension during
a snap load.

84
7. Conclusions
We have made the first rapid and high resolution measurements o f a caged deep
sea ROV system which consists of a support ship, winch, umbilical tether, cage and
ROV. In this investigation, the ROV and cage were vertically suspended below the
support ship by a compliant umbilical tether. We simultaneously measured all six
components of motion of the ship (at the A-frame) and of the cage and the tension in
tether. By combining the low—frequency portion of the accelerometer records with the
high-frequency part of the rates o f rotation, we determined drift free roll and pitch
records and the true inertial accelerations.
Over 90% of the variance of the vertical acceleration of the ship was in the wave
band (0.1 to 0.25 Hz) and this component of acceleration was the only significant forcing
on the system. We found that the vertical motion of the cage exceeded that of the ship
and that it was weakly non-linear for all depths (0-1 765 m). The cage motion lagged the
ship motion by up to 1.9 s at 1 730 m and the natural frequency of the system was within
the wave-band for depths greater than 1 450 m. The phase of the transfer function
between ship and cage motion decreased non-linearly with frequency. The magnitude of
the transfer function was greater than one near the peak frequency and was asymmetric
with respect to the natural frequency. As a consequence of this asymmetry, much more
ship motion is transferred to the cage at frequencies below, than above, the natural
frequency. We estimate that the dangerous operating range is between 1 450 and 2 940 m
where most of the ship motion will be transferred to and amplified at the cage.
85
At 1 730 m, the system was in resonance and subject to snap loads. Prior to each
snap load, momentary slack developed in the tether at the cage. Rapid retensioning jerks
the cage and produces a localised strain in the tether directly above the cage. A strain
wave then propagates along the tether at 3 870 ms'^ (the characteristic speed of sound in
the tether) and is reflected at the ship and cage. A regular pattern o f spikes in cage
acceleration/tension in the tether results and is repeated in 8 different snap loads. The
temporal spacing o f the spikes is determined by the travel time o f the strain wave. The
tension spikes did not exceed the tether’s maximum working load (recommended by the
manufacturer) but the acceleration spikes at the cage were as large as half of gravity. The
cage also pitched by up to 14° which caused a tight bend in the tether at the cage
termination and damaged the fibres housed within the tether.
We applied spectral techniques to determine that only in the vertical direction was
there significant forcing (by the ship) and response (by the cage). Thus, a one
dimensional model should be sufficient to represent this ROV system and reproduce the
characteristics of the real system.
Acknowledgements
The authors gratefully thank John Garrett, Kim Juniper, Steve Scott, Keith
Shepherd, Bob Holland and the Captain and crew of the CSS John P. Tally operated by
the Institute of Ocean Sciences in Sidney, B.C. Canada for graciously providing access to
the ROPOS ROV system and berthing during the experiment. Additionally, we would
like to thank Jim McFarlane and the staff of International Submarine Engineering (ISE)
for their continual support and assistance in this project. F.R. Driscoll was financially

86
supported by scholarships from the Natural Science and Engineering Research Council
(NSERC), the Science Council of British Columbia (SCBC) and ISE. This work was
partially supported by the US Office o f Naval Research under contract NOOO14-93-1-
0362 and N SERC.
References
Ablow, C.M. and Schechter, S. 1983. Numerical simulation of undersea cable dynamics.
Ocean Engineering. 10,443—457.
Antoniou, A. 1979. Digital filters: analysis and design. McGraw-Hill, New York.
Chapman D.A. 1984. Towed cable behaviours during ship turning maneuvers. Ocean
Engineering. 11, 327-361
Driscoll F.R. and Biggins L. 1993. Passive damping to attenuate snap loading on
umbilical cables of remotely operated vehicles. IEEE Oceanic Engineering
Society Newsletter 28, 17-22.
Etkin, 1972. Dynamics o f atmospheric flight. John Wiley & Sons, New York.
Grosenbaugh, M.A. 1996. On the dynamics of oceanographic surface moorings. Ocean
Engineering. 32, 7-25
Hibbeler, R.C. 1989. Engineering mechanics — statics and dynamics. MacMillan
Publishing Company, New York.
87
Hover, F.S., Grosenbaugh, M.A. and Triantafyllou, M.S. 1994. Calculation o f dynamic
motions and tension in towed underwater cables. IEEE Journal o f Oceanic
Engineering. 19, 449—457
Hover, F.S. and Yoerger, D.R. 1992. Identification of low-order dynamic models for
deeply towed underwater vehicle systems. International Journal o f Offshore and
Polar Engineering. 2, 38—45.
Huang, S. and Vassalos, D. 1995. Chaotic heave motion of marine cable-body systems.
Proceedings o f the ISOPE-Ocean Mining Symposium, Tsukuba, Japan. 83—90.
ISE 1998, International Submarine Engineering Hysub 5000, 1734 Broadway Street, Port
Coquitlam, B.C., Canada, V3C 2M8, web page,
http://www.ise.bc.ca/rov.html#hys5000.
Jenkins G.M.and Watts D.G. 1968. Spectral analysis and its applications. Holden-Day,
San Francisco.
Mellem T. 1979. Surface handling of diving bells and submersibles in rough sea.
Proceedings o f the Offshore Technology Conference, Houston, Texas. 1571—
1580.
Mooers, C.N.K. 1973. A technique of the cross spectrum analysis of pairs o f complex-
valued time series with emphasis on properties of polarized components and
rotational invariants. Deep-Sea Research. 20, 1129-1141.

88
Mudge, T.D. and Lueck, R.G. 1994. Digital signal processing to enhance oceanographic
observations. Journal o f Atmospheric and Oceanic Technology. 11, 825—836.
Niedzwecki, J.M. and Thampi, S.K. 1991. Snap loading of marine cable systems. Applied
Ocean Research. 13, 210-218.
Press,W.H., Teukolsky, S.A., Vetterling, W.T. and Flannery, B.P. 1992. Numerical
recipes in C, second edition. Cambridge University Press, Cambridge.
Shepherd, K. 1997. Personal communication. Institute of Ocean Sciences, Department of
Fisheries and Oceans, Sidney, B.C., Canada.
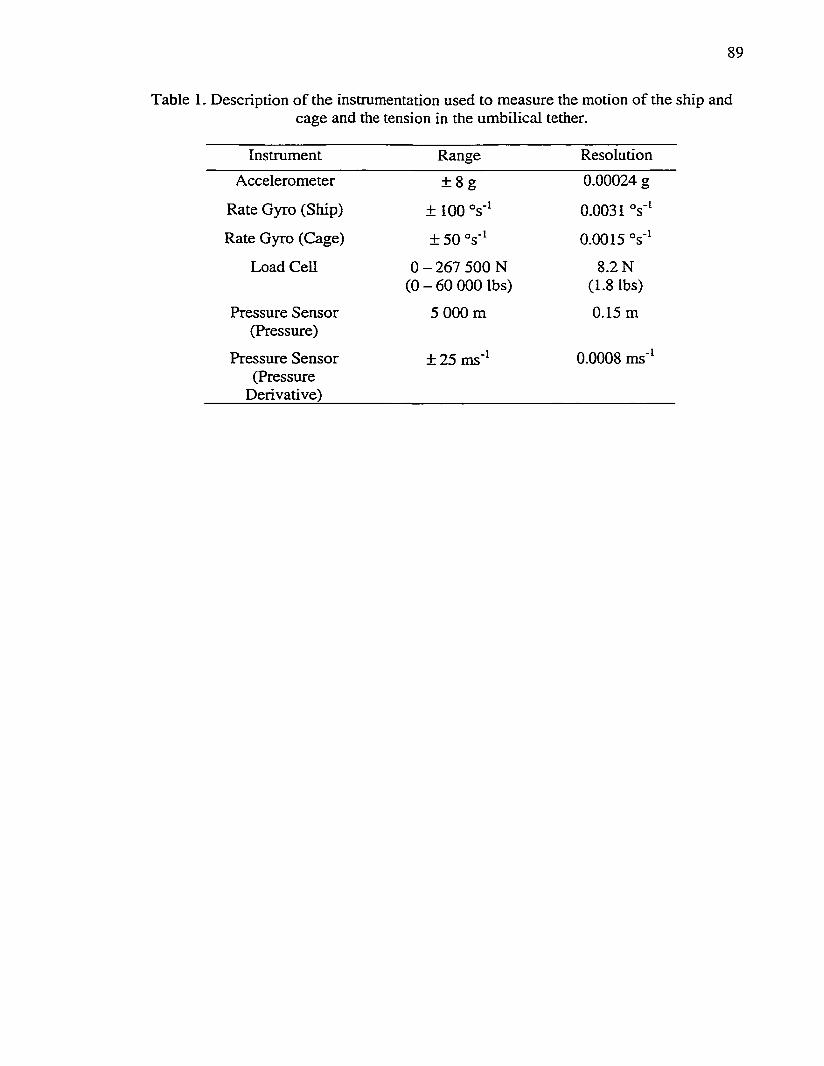
89
Table 1. Description of the instrumentation used to measure the motion o f the ship andcage and the tension in the umbilical tether.
Instrument Range Resolution
Accelerometer ± 8 g 0.00024 g
Rate Gyro (Ship) ± 100 °s'^ 0.0031 °s'^
Rate Gyro (Cage) ± 50 °s'^ 0.0015 °s‘^
Load Cell 0 - 267 500 N (0 - 60 000 lbs)
8.2 N (1.8 lbs)
Pressure Sensor (Pressure)
5 000 m 0.15 m
Pressure Sensor (Pressure
Derivative)
± 25 ms'^ 0.0008 ms'^
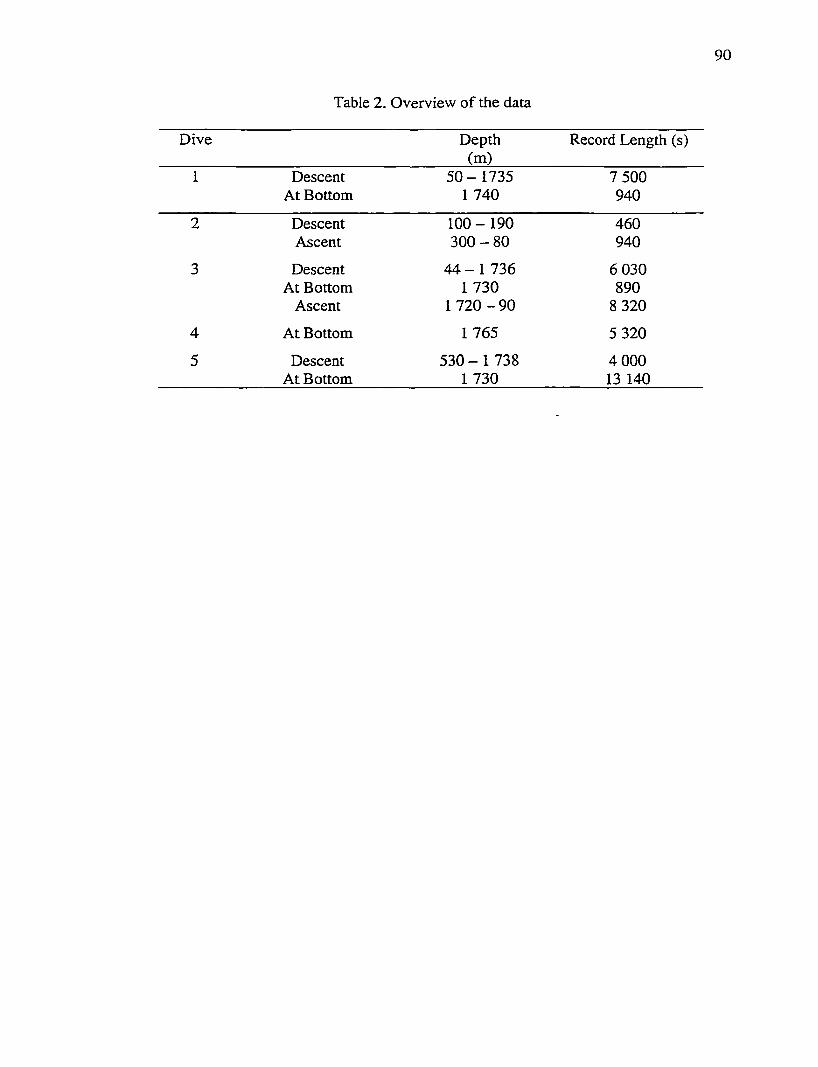
90
Table 2. Overview of the data
Dive Depth(m)
Record Length (s)
1 Descent 5 0 - 1735 7 500At Bottom I 740 940
2 Descent 100 - 190 460Ascent 300 - 80 940
3 Descent 4 4 - 1 736 6 030At Bottom 1 730 890
Ascent 1 720 - 90 8 320
4 At Bottom 1 765 5 320
5 Descent 530 - 1 738 4 000At Bottom 1730 13 140

91
Table 3. List of the depth and duration of the motion records for stationary operation, excluding records for operation at the terminal depth.
Depth(meters)
Record Time (sec)
233 320488 320631 460778 320975 620
I 133 3601 378 360

92
Table 4. Summary of the motions for a 5 000 s record o f the system operating near1 730 m.
Variance MaximumPeak-to-peak
Variance Maximum(absolute)
0.0096 m^ 0.65 m A: 0.0133 m V 0.90 ms'^yS 0.0698 m- 2.74 m 0.0436 m^s"^ 0.99 ms'^
0.328 m^ 3.79 m A: 0.230 m s"* 2.42 ms'^
0.275 C f 6.79° ¥ 0.170 (°s'^)^ 2.25 °s'^0.930 (°)^ 6 .34° ¥ 0.700 (°s'^)^ 3.21 °s"^
w" 0.0924 (°)^ 2.45° v " 0.0855 (°s‘ )^ 1.39 °s'^0.0035 m^ 0.57 m A 0.0037 m^s"^ 1.11 ms'^
yC 0.0003 m^ 0.18 m A 0.0017 m^s^ 1.19 ms'^0.686 m^ 5.34 m A 0.502 m^s-^ 4.17 ms'^
(p 0.0427 C Ÿ 3.01 ° 0.844 (°s'^)^ 7.9 °s'^0.560 ( ° f 14.86 ° ¥ 4.66 (°s'^)^ 31.87 °s'^0.215 C Ÿ 10.48 ° iir 0.588 (°s‘ )^ 9.57 °s'^

93
Table 5. Summary of the large motions recorded during 8 snap loads.
Variance MaximumPeak-to-peak
Variance Maximum(absolute)
0.943 m^ 4.34 m 4 1.26 m V 4.64 ms'^1.98 m^ 5.81 m A? 1.47 m s"* 5.17 ms'^
9.02 (°)^ 14.2° ¥ 58.7 (°s'^)^ 45.4 °s'^
Variance Maximum MaximumPeak-to-peak
Tension 1.13x10^ 0.116x10^ N 0.146x10^ N

94
Table 6. Coherency and relative coherent variance between ship—cage variable pairs.
{h „ )89 % 1.9576% -
41 % -
4 - A : 63 % 0.014
Ai,- A : 52% -
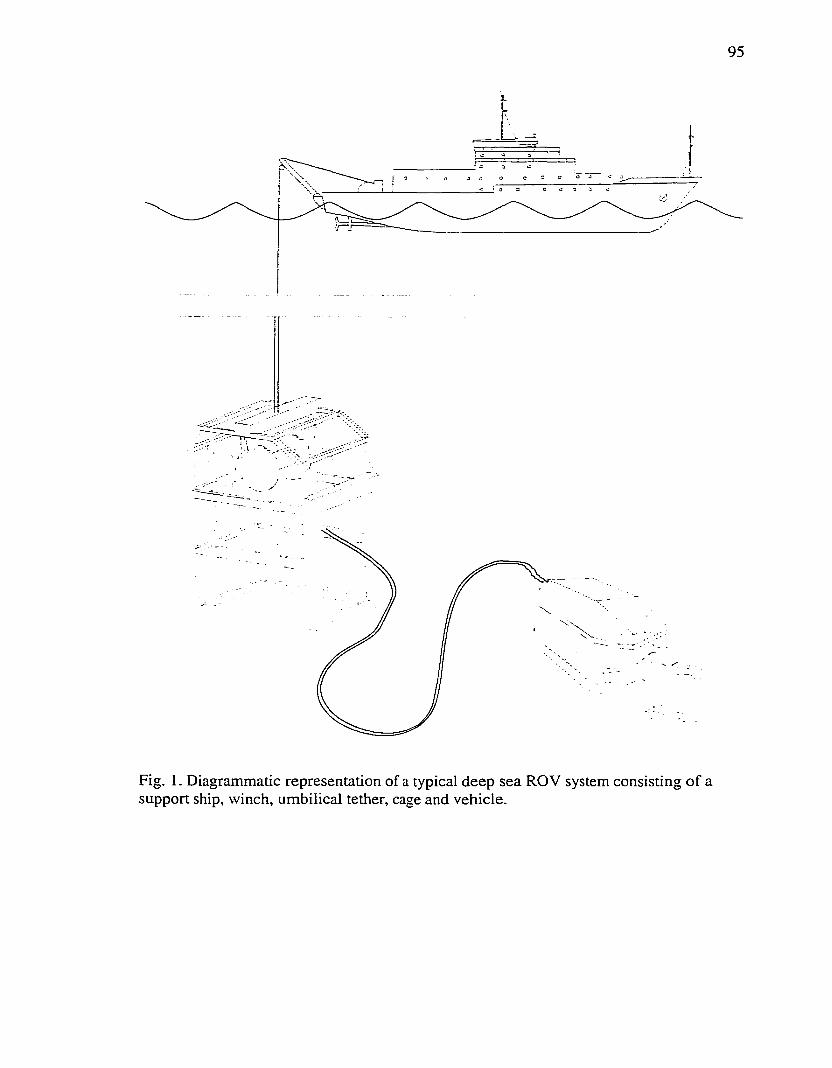
95
Fig. 1. Diagrammatic representation of a typical deep sea ROV system consisting o f a support ship, winch, umbilical tether, cage and vehicle.

96
Ofsfi
i Data Acquisition!; Computer ^
ShipboardTransceiver
Analog to Digital Converter
Remote Transceiver
- — JcÆF'«rer.» "iff k t —«-fA iTês
■4Analog
Filtering/ProcessingFibre Optic Modem 3 % ÏÎS V êéi; JSsSlssate»»
Analog Instrumentation«g am m a4200 m
«mmw*Fibre Optic Modem _
?ïSrS«
ma;
Remote Transceiver
Analog to Digital Converter
Analog Filtering/Processing
Analog Instrumentation
Fig. 2. Conceptual diagram of the Ocean Data Acquisition System used to measure the motions of a deep sea ROV system. The arrows represent the flow of instructions to, and data from, the instruments. Each white block represents a group of components performing a specific task (measuring, processing, transmission etc.).

97
n > l« = 1
Fig. 3. Flow chart of the processing of the tri-axial accelerometer signals. The signals are first transformed from the instrumentation body-fixed frame to the inertial frame using an Euler angle transformation. The Euler angles are solved iteratively. The gravitational “contamination” of the acceleration signals is removed and the resulting signals are integrated to yield velocity and position.

98
i Spectral Gap
Wave Band
(b).
13'
cvj
,-5
,0 1-2 ,-1 1010 10 10f[Hz]
Fig. 4. Spectra of the inertial acceleration records of the ship (a) and cage (b) at a depth of 1 730 m. The wave-band (horizontal bar in (a)) contains 95% of the variance of vertical ship acceleration. The arrows are the spectral gap (a), the 3 ' and 5^ harmonic of the peak cage motion (b) and the natural frequency ( / i ) (b).
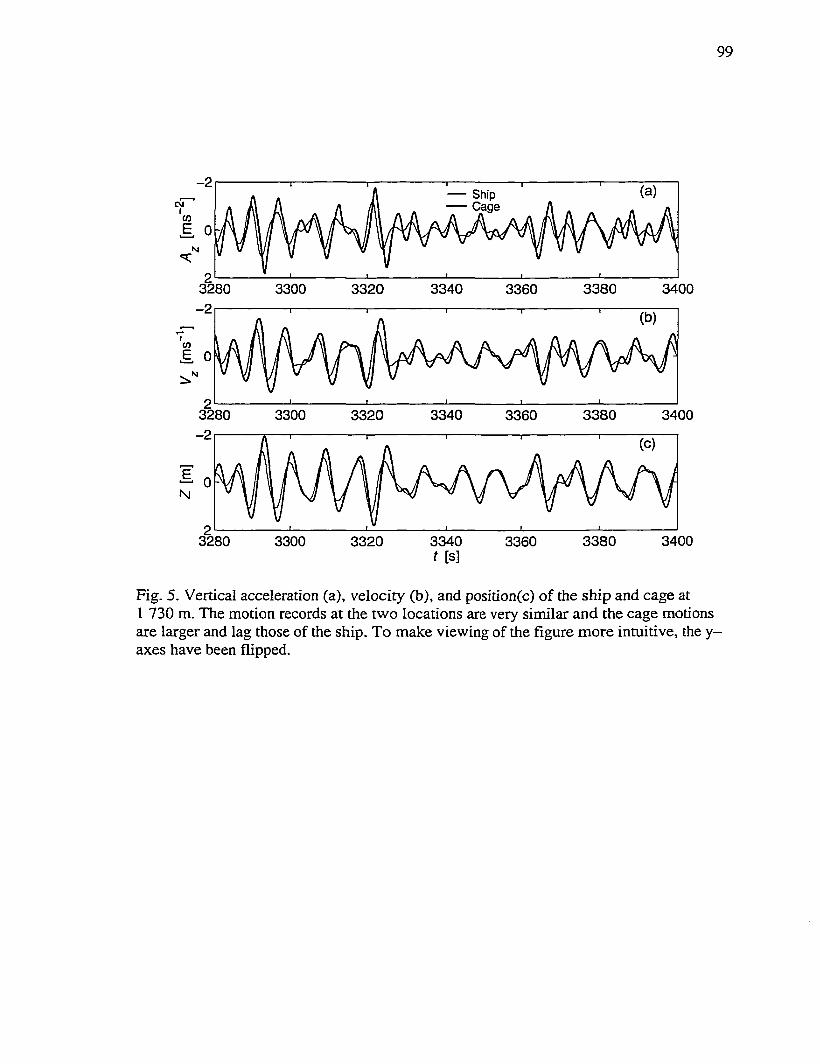
99
-2 Ship Cage
3280 3300 3340 3380 34003320 3360-2
3280 3300 3340 33803320 3360 3400-2
EN
3280 3300 3380 34003320 3340 3360t [s]
Fig. 5. Vertical acceleration (a), velocity (b), and position(c) of the ship and cage at 1 730 m. The motion records at the two locations are very similar and the cage motions are larger and lag those of the ship. To make viewing of the figure more intuitive, the y- axes have been flipped.

1 0 0
MWave Band
0.05 0.1 0.15 0.2 0.25 0.3 0.35
1.5o® -0.5 (b) -
0.5 H-0.75
0.05 0.1 0.25 0.40.15 0.2 f [Hz]
0.3 0.35
Fig. 6. Transfer function estimate (a) and phase (b—Left axis) between ship and cage motions estimated from the acceleration records at 1 730 m. In (b), the thin Line is a 5^— order polynomial fit to the frequency, using phase as the independent variable. The thick line is the time-lag (right axis) between the ship and cage acceleration.
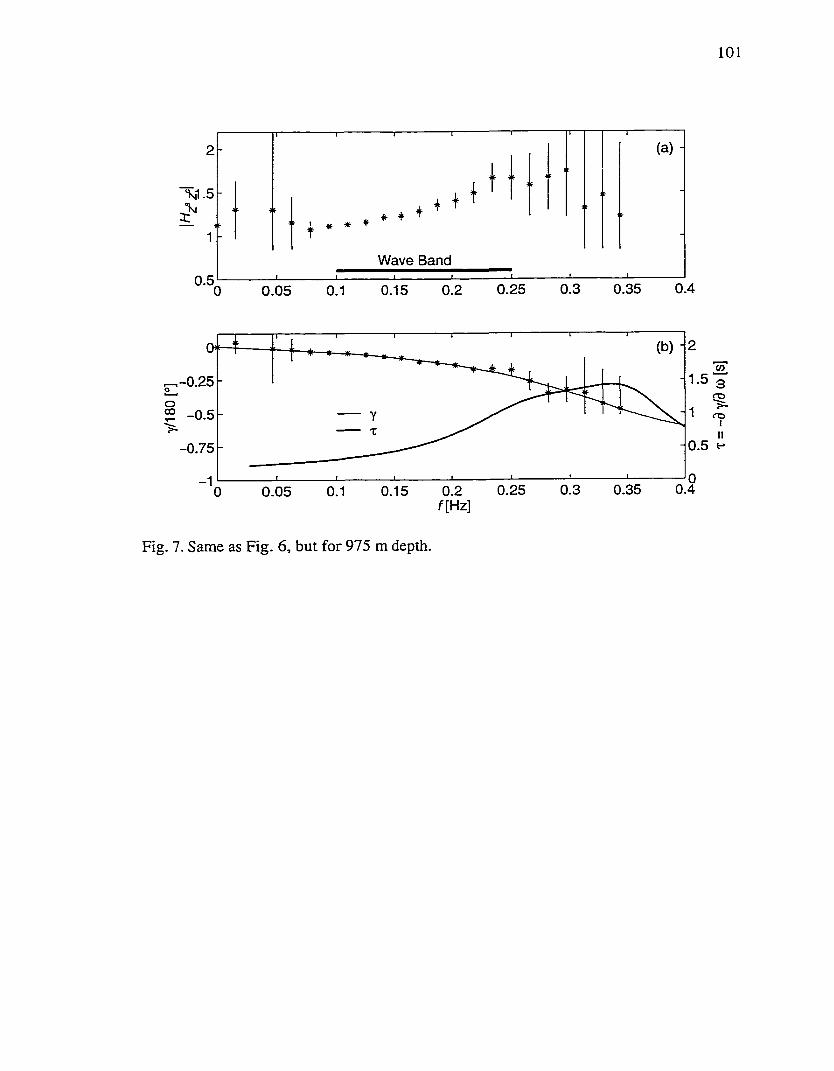
1 0 1
Wave Band
0.05 0.1 0.15 0.2 0.25 0.3 0.35 0.4
(b) -U)
1.5-0.25o“ -0.5 Y
0.5-0.75
0.40.350.30.250.20.150.10.05f[Hz]
Fig. 7. Same as Fig. 6, but for 975 m depth.

1 0 2
x 1 0
160 170145 150 155 165 175
t[s]
-4g - 2
160145 150 155 165 170 175-2
EN
160145 150 155 165 170 175
o —5-10
145 155 160 165 170150 175
Fig. 8. Records of tension, vertical acceleration , vertical position Z and pitch 6 , during a typical snap load. The snap load is identified by the large spikes (jerks) in the acceleration of the cage and rapid changes in the tension. Thin and thick lines are measurements at the ship and cage, respectively.
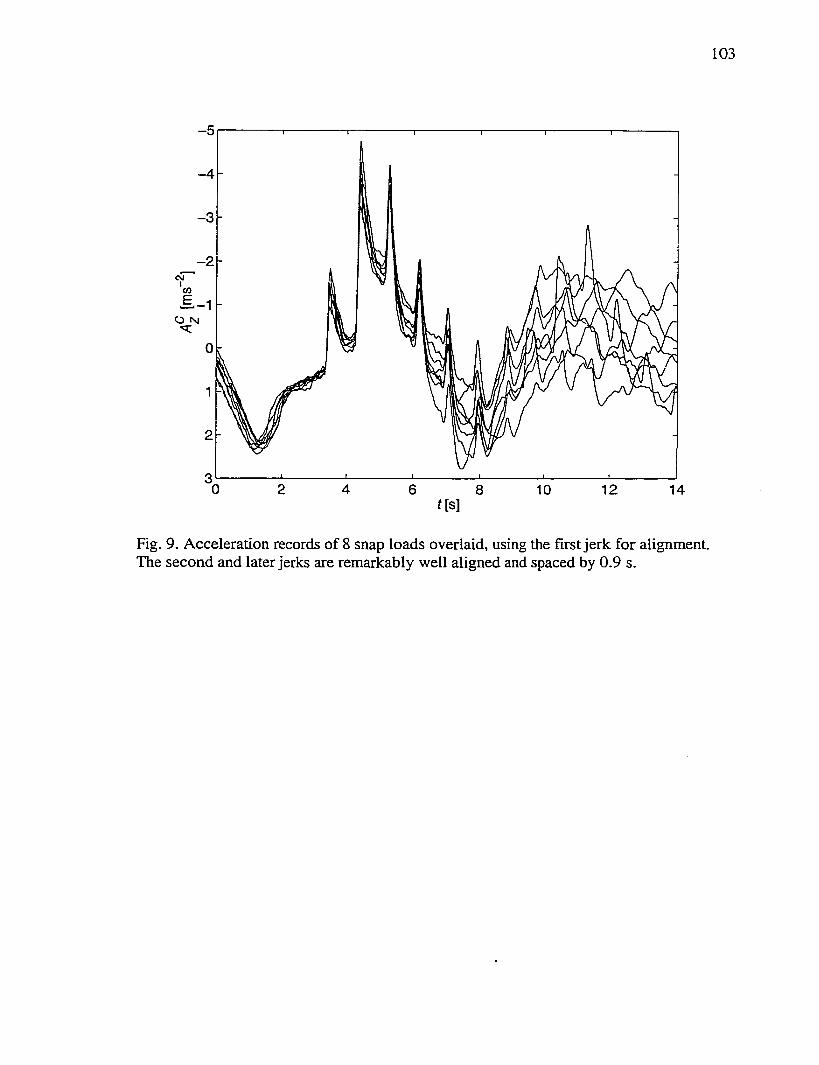
103
-5
-4
-3
- 2CJ
5 .-1O N
12 14t[s]
Fig. 9. Acceleration records of 8 snap loads overlaid, using the first jerk for alignment. The second and later Jerks are remarkably well aligned and spaced by 0.9 s.
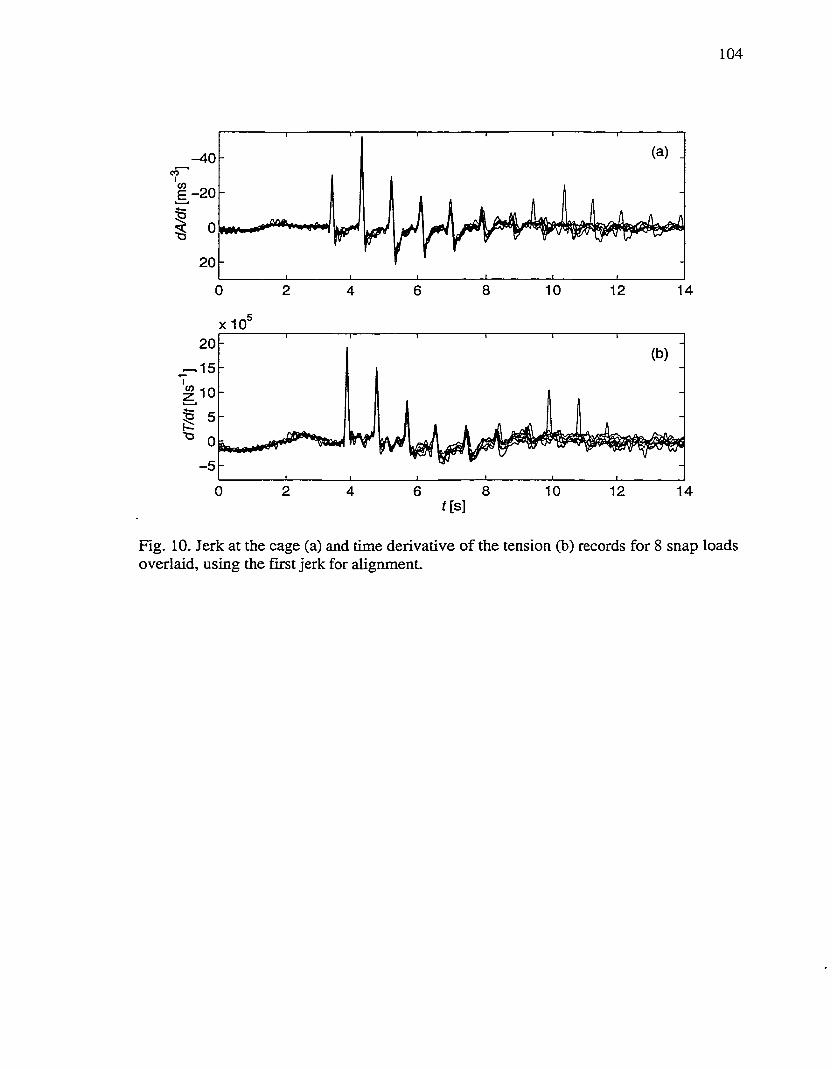
104
-40CO
I
20
0 2 8 10 12 1464
xIO20
15I
-5
0 2 8 106 12 144t[s]
Fig. 10. Jerk at the cage (a) and time derivative o f the tension (b) records for 8 snap loads overlaid, using the first jerk for alignment.
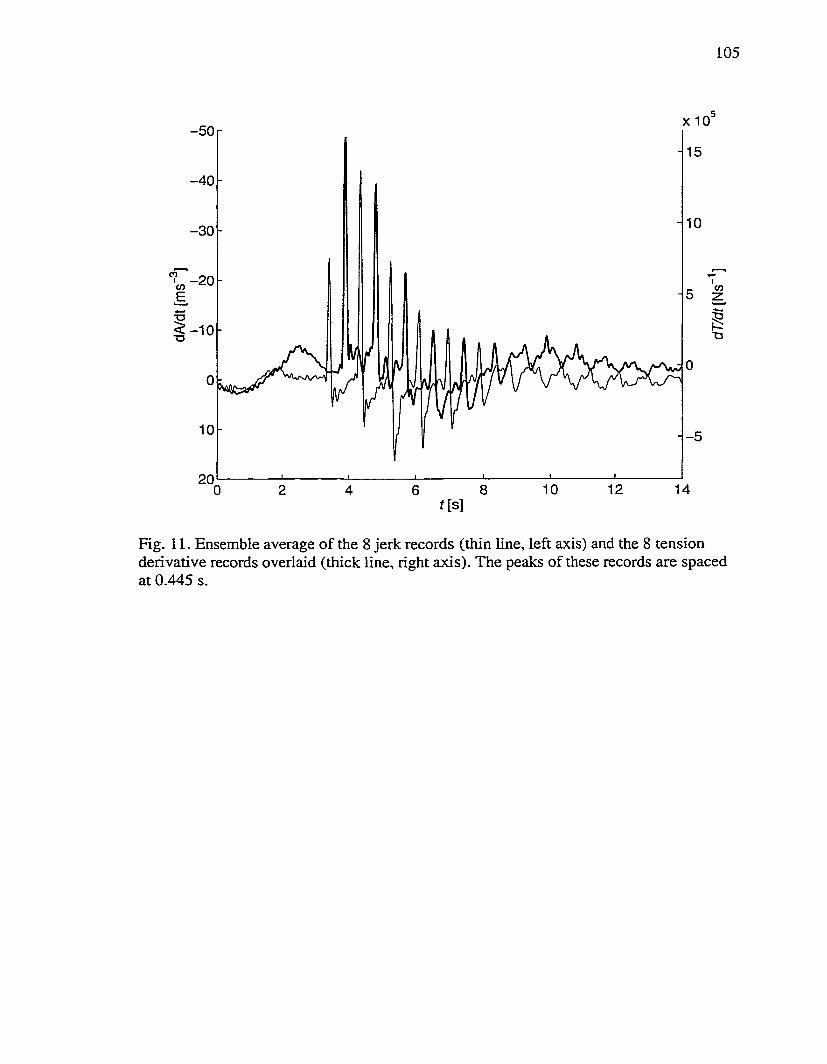
105
-50
-40
-30
CO
-5
2012 14
f[s]
Fig. 11. Ensemble average of the 8 jerk records (thin line, left axis) and the 8 tension derivative records overlaid (thick line, right axis). The peaks of these records are spaced at 0.445 s.

106
1 0
“Kj
10"
O-
- 0.2
§ - 0 .4
-S-—0.6
- 0.8
-1
+-+
J
Ilf p ff
4 6f [Hz]
Fig. 12. The magnitude (a) and phase (b) of the transfer function estimated between the vertical ship and cage motions during the 8 snap loads.
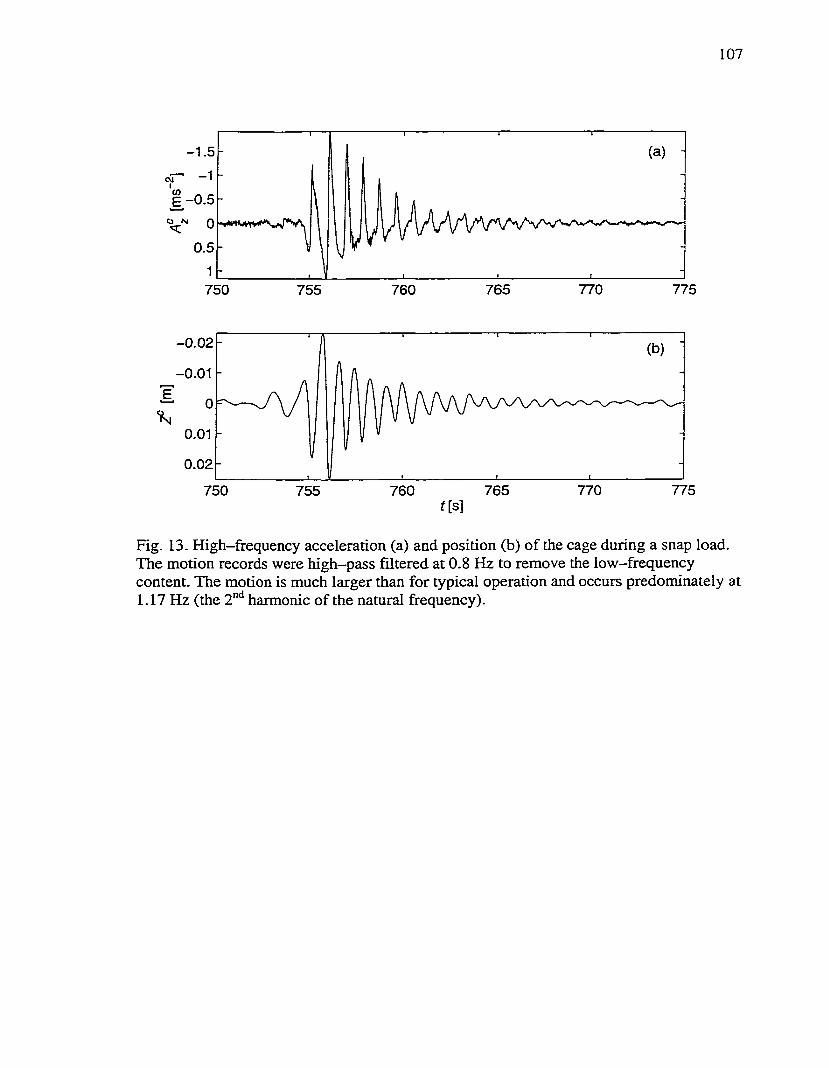
107
-1 .5
cvi
É,-0.5
0.5
765 770 775750 755 760
- 0.02
- 0.01E
%0.01
0.02
775765 770750 760755t[s]
Fig. 13. High-frequency acceleration (a) and position (b) of the cage during a snap load. The motion records were high-pass filtered at 0.8 Hz to remove the low-frequency content. The motion is much larger than for typical operation and occurs predominately at 1.17 Hz (the 2"^ harmonic of the natural frequency).
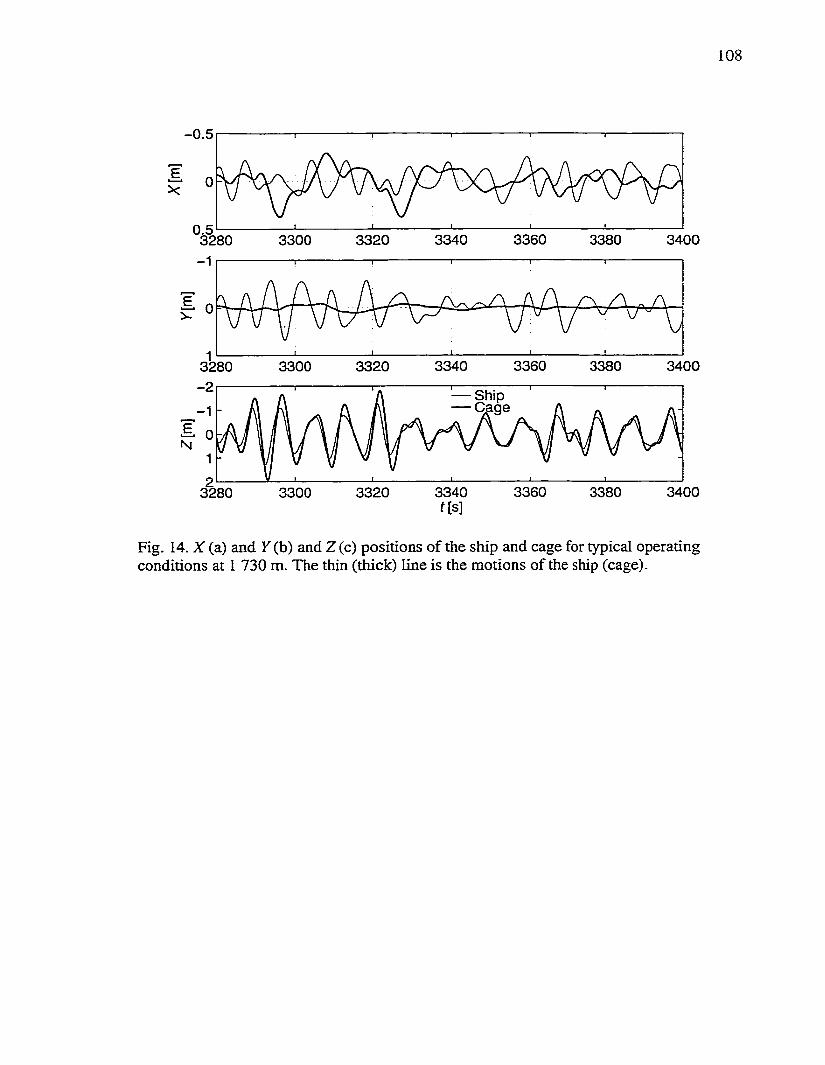
108
-0.5
%
3360 34003320 3340 33803300
0
3280 33603340 3380 34003300 3320-2 — Ship
— Cage
33603340f[s]
3380 340033203280 3300
Fig. 14. X (a) and Y (b) and Z (c) positions of the ship and cage for typical operating conditions at 1 730 m. The thin (thick) line is the motions of the ship (cage).
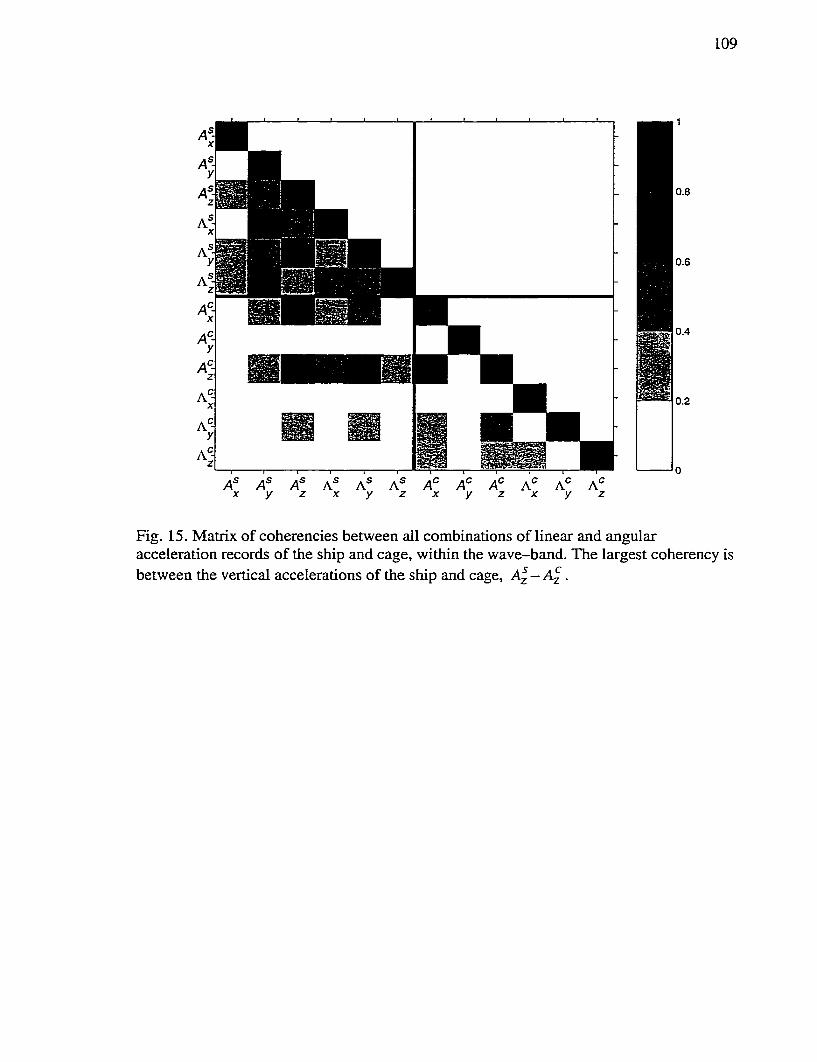
109
Fig. 15. Matrix of coherencies between all combinations of linear and angular acceleration records of the ship and cage, within the wave-band. The largest coherency is between the vertical accelerations of the ship and cage, A^—A^.
1 1 0
Appendix B
The Motion of a Deep-Sea Remotely Operated Vehicle System.
Part 2: Analytical Model

I l l
The Motion of a Deep-Sea Remotely Operated Vehicle System.Part 2: Analytical Model
F. R. Driscoll^*, R. G. Lueck*’ and M. Nahon^
(In press. Ocean Engineering, 1999)
“ Department of Mechanical Engineering and School o f Earth and Ocean Sciences, University of Victoria,Victoria, B.C., V8W 3P6
'"School of Earth and Ocean Research, University o f Victoria, Victoria, B.C., Canada, V8W 3P6 “iDepartment o f Mechanical Engineering, University o f Victoria, Victoria, B.C., Canada, V8W 3P6
Abstract
We developed a continuous linear-elastic one-dimensional analytic model that should accurately
represent a vertically tethered system subject to surface excitation. Our model accurately predicts: (a) the
transfer function between the motion o f the ship and cage, (b) the transfer function between ship motion
and tension in the tether and (c) the natural frequency and its harmonics o f the ROPOS deep-sea ROV
system for depths between 0 - 1 765 m up to moderately rough sea conditions. By solving the ship-cage
motion transfer function for the onset of zero tension in the tether, we were able to predict the amplitude of
ship motion that triggers a snap load. The solution to our model requires only two non-dimensional
parameters representing the mass ratio of the cage and tether and the force ratio o f drag to tension. The
predicted transfer function and natural frequency are not excessively sensitive to the value o f these
parameters for the ROPOS ROV system.
Keywords: Tethered marine systems, remotely operated vehicles, ROV, tether, snap
loading, cable dynamics, cable modelling.
Corresponding author.
1 1 2
1. Introduction
Remotely Operated Vehicles (ROVs) are the work horses of the deep sea
industry. ROV systems effectively accomplish tasks in the dangerous high pressure
environment o f deep water while their human operators remain safely onboard the
support ship. In addition to safety issues, ROVs have many advantages over other deep
water work systems such as manned submersibles. In particular, ROVs can stay at the
underwater work site indefinitely because their power is supplied by the ship, and the
crew can be rotated without recovering the vehicle. These advantages are possible
because the ship and undersea unit (cage and ROV) are connected by a tether (umbilical
cable). The tethers typically consist of a core of electrical and optical conductors used to
send power to and communicate with the ROV, surrounded by layers of armour used to
support the undersea unit and protect the internal core. While the tether is the ROV’s
greatest advantage, it is also the greatest disadvantage. Operation in rough seas results in
slack tether and large ‘snap’ loads which can damage the tether amour and the internal
conductors. With damaged conductors, conununication and power to the vehicle is cut off
and the undersea unit becomes inoperable. Also during rough seas conditions, large
vertical motions o f the cage occur that make vehicle docking and system recovery
difficult.
The ship and undersea unit are connected by a long elastic structural member-the
tether, which can only sustain tensile loading and has length dependent properties.
Clearly, the tether is very complex itself, but the addition of the non-linear characteristics
of the cage make intuitive understanding of the system difficult. Thus, knowledge of the
113
dynamic interaction between the ship and cage is required to effectively build and safely
operate ROV systems. Designing systems that operate far from, or at least can survive
operation in, resonance requires accurate prediction of the natural frequencies and
harmonics. Knowing the effects of ship motion on cage motion and tension in the tether
is necessary to allow selection of ships with compatible motion characteristics that will
not significantly excite the system so that snap loads result. This knowledge is obtained
from experimental measurements and analytic models.
In part 1 of this paper (Driscoll, Lueck and Nahon, 1999 (hereafter DLN)), we
presented motion and tension measurements of an ROV system operating at several
depths between the surface and 1 765 m, and these yielded several significant insights
into the system dynamics. In particular, the natural frequency and harmonics were
determined and the natural frequency was found to be within the wave-band ( the
frequency band that contains 90% of the variance of the vertical acceleration of the ship,
0.1-0.25 Hz). The transfer function between ship and cage motion was also estimated and
we found that the vertical cage motion was greater than that of the ship, which is
consistent with the system operating at or near the natural frequency. Finally, several
snap loads were recorded that exhibited remarkable temporal regularity.
In comparison with experimental measurements, analytic models provide a much
more efficient and less costly method of quantifying the characteristics of dynamic
systems. Probably one of the greatest advantages of analytic models is that they can be
used to test and evaluate the behaviour of a system during the design process. Recent
modelling of vertically tethered systems has been done extensively with discrete models
114
(Niedzwecki and Thampi, 1991, Hover and Yoerger, 1992, Driscoll and Biggins, 1993.
and Huang and Vassalos, 1995) and little emphasis has been given to the effectiveness of
continuous models. Although discrete models can calculate the response of systems over
a much larger range than continuous models, they can be difficult to set up, require large
computer resources and take long periods of time to investigate a few specific cases.
Continuous models have a smaller range of application but can provided quick and
accurate quantification o f the dynamic characteristics. During the design process, when
time is a significant factor, continuous models excel. Niedzwecki and Thampi, 1988
derived a closed form solution to a set of equations for a heave-compensated, multi-
segment drill string. Huang and Vassalos used a simple single degree-of—freedom model
to characterise the response of a vertically suspend mass to sinusoidal forcing.
Continuous models are not common in recent literature and the validation of discrete and
continuous models against data is virtually non-existent. A refreshing example is,
Grosenbaugh, 1996, who compared motion and tension measurements of a long vertically
tethered surface mooring with a continuous model. The model was accurate and an order
of magnitude faster than numerical simulations.
In this paper, we develop a continuous one-dimensional linear-elastic model for a
vertically tethered ROV system and find the closed form solution. Expressions for the
natural frequency and harmonics, transfer function between ship and cage motion and
transfer function between ship motion and tether tension are determined and agree well
with those estimated from measurements o f the ROPOS ROV system (DLN). We also
developed an expression for the tension at all points along the tether which is used to
predict the conditions for which snap loading will occur.

115
2. Analytical Model
Within the range o f measurements presented in part 1 (DLN), the system was
found to be weakly non-linear and with significant motion occurring only in the vertical
direction. Therefore, we developed a continuous one-dimensional linear-elasitc analytic
tether model of a caged deep-sea ROV system for vertical motions. Three coupled
equations are used to model the system: a hyperbolic partial differential equation for the
linear-elastic tether; a displacement function for the A-ffame motion; and a second-
order differential equation for the cage. Hydrodynamic added-mass and drag are only
included in the cage equation where an equivalent linearization technique is applied to
the quadratic drag.
2.1. Tether equation
The tether that is suspended vertically below the ship’s A-frame can be
approximated as an elastic rod when it is taut and therefore is modelled using a
hyperbolic equation (Rao Chapter 8, 1990). The strain in the tether is less than 0.004 at
the manufacturer’s maximum recommended working load and the armour is wrapped
around an incompressible core; therefore, the dilation of the tether will be very small and
its cross-section is assumed to be constant. Gravitational effects on the tether are large.
Since the tether constitutes 75% of the total overboard weight at full depth (5000 m), the
static strain varies significantly along the length of the tether and can change by a factor
of 4 between the cage and surface. Therefore, gravitational effects are included as a depth
depended distributed load applied to the tether. The tangential fluid drag on the tether is
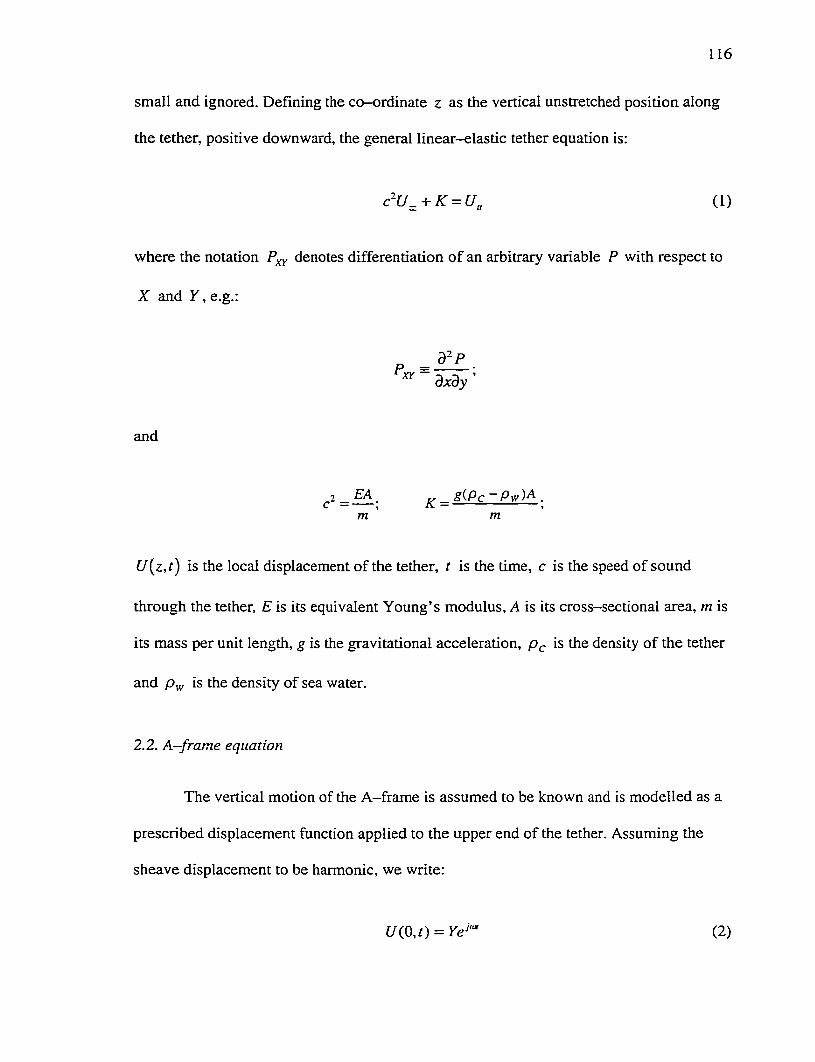
116
small and ignored. Defining the co-ordinate z as the vertical unstretched position along
the tether, positive downward, the general linear—elastic tether equation is:
c-U^ + K = U„ (1)
where the notation P^y denotes differentiation of an arbitrary variable P with respect to
X and Y , e.g.:
dxdy ’
and
Q - —Eâ-- _ &(Pc Pw)^ .m ' m
U{z,t) is the local displacement of the tether, t is the time, c is the speed of sound
through the tether, E is its equivalent Young’s modulus, A is its cross-sectional area, m is
its mass per unit length, g is the gravitational acceleration, is the density of the tether
and is the density of sea water.
2.2. A—fram e equation
The vertical motion of the A-frame is assumed to be known and is modelled as a
prescribed displacement function applied to the upper end of the tether. Assuming the
sheave displacement to be harmonic, we write:
f/(0,O = (2)
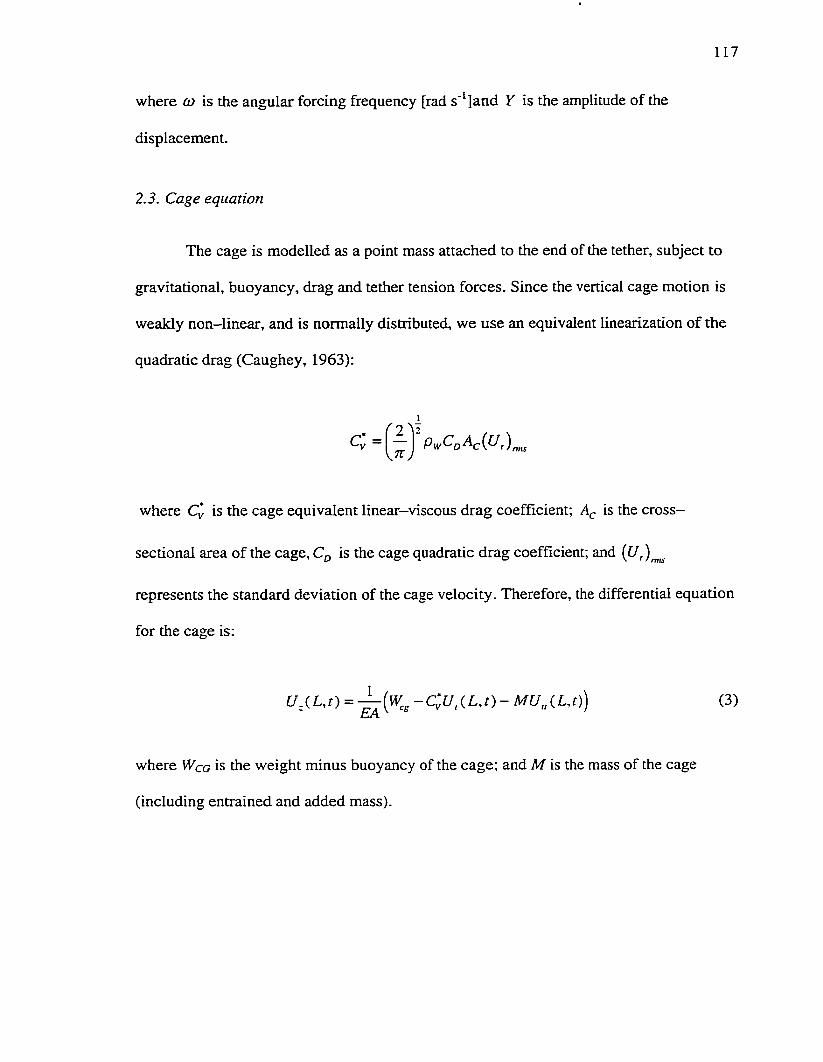
117
where Cû is the angular forcing frequency [rad s'^]and Y is the amplitude of the
displacement.
2.3. Cage equation
The cage is modelled as a point mass attached to the end of the tether, subject to
gravitational, buoyancy, drag and tether tension forces. Since the vertical cage motion is
weakly non-linear, and is normally distributed, we use an equivalent linearization of the
quadratic drag (Caughey, 1963):
P w ^ 0 ^ c ( j ^ t ) r
where Cj is the cage equivalent linear—viscous drag coefficient; A . is the cross-
sectional area of the cage, is the cage quadratic drag coefficient; and { U , ) ^
represents the standard deviation of the cage velocity. Therefore, the differential equation
for the cage is:
where Wcg is the weight minus buoyancy of the cage; and M is the mass of the cage
(including entrained and added mass).
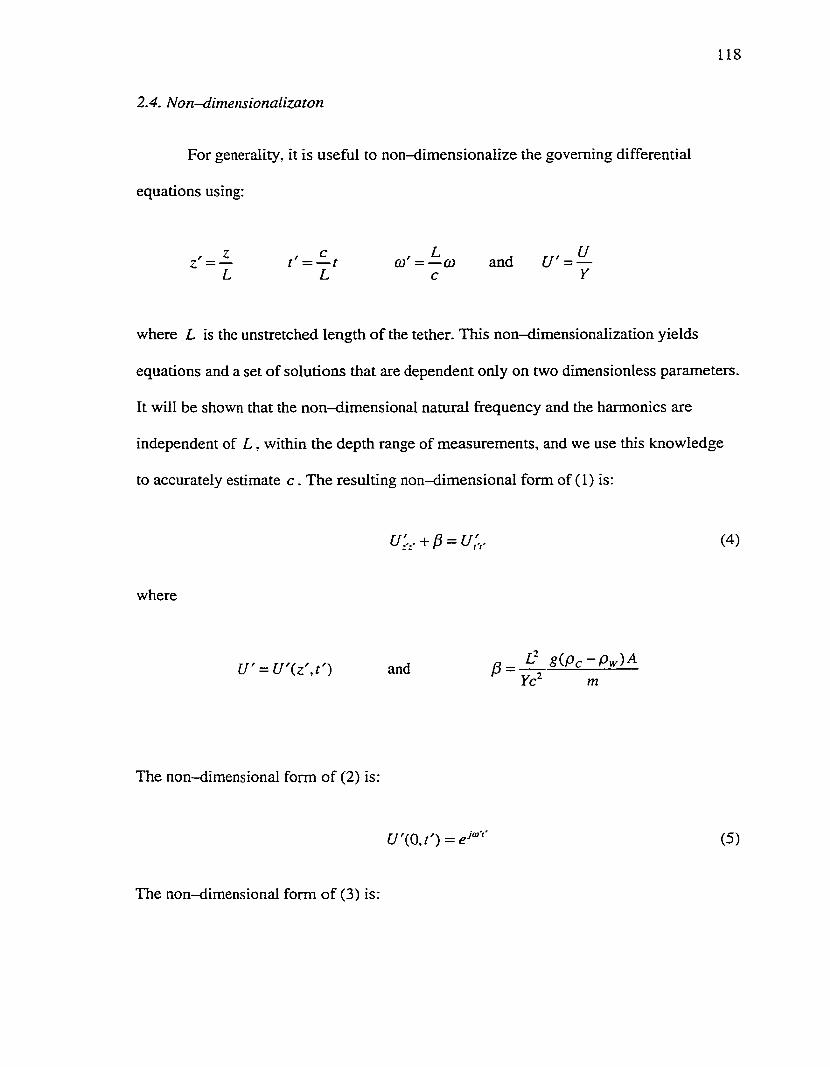
1 1 8
2.4. Non—dimensionalizaton
For generality, it is useful to non-dimensionalize the governing differential
equations using:
— t ' = — t Cû'= —o) and U '= —L L c Y
where L is the unstretched length of the tether. This non—dimensionalization yields
equations and a set of solutions that are dependent only on two dimensionless parameters.
It will be shown that the non-dimensional natural frequency and the harmonics are
independent of L , within the depth range of measurements, and we use this knowledge
to accurately estimate c . The resulting non-dimensional form of (1) is:
U L.+ P = U;,. (4)
where
U' = U'iz',n andYc~ m
The non-dimensional form of (2) is:
C/'(0,^') = (5)
The non-dimensional form of (3) is:
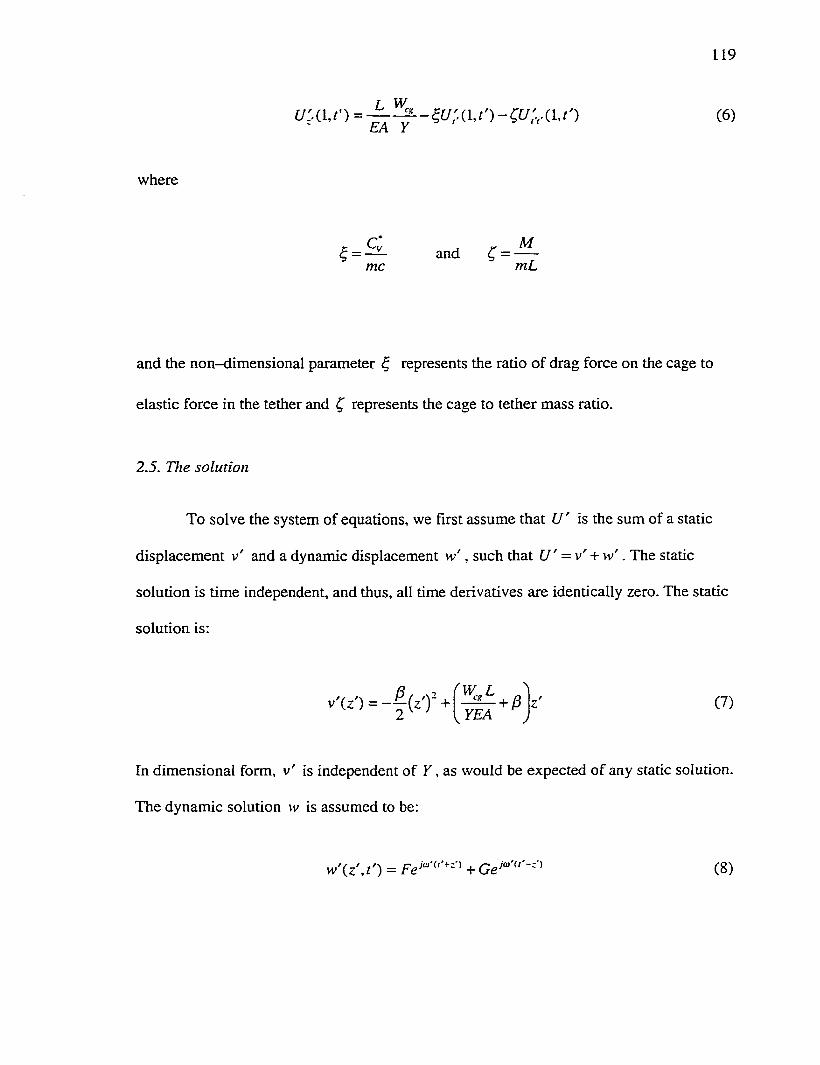
119
r w
where
^ = and Ç = ~me mL
and the non-dimensional parameter ^ represents the ratio of drag force on the cage to
elastic force in the tether and Ç represents the cage to tether mass ratio.
2.5. The solution
To solve the system of equations, we first assume that U ' is the sum of a static
displacement v' and a dynamic displacement w ' , such that U ' = v' + w ' . The static
solution is time independent, and thus, all time derivatives are identically zero. The static
solution is:
V2 y YE A
(7)
In dimensional form, v ' is independent of T , as would be expected of any static solution.
The dynamic solution vv is assumed to be:
w\ z \ t') = (8)
120
Once equations (7) and (8) are substituted back into (4), we use (5) and (6) to solve for
the coefficients F and G and we find that the dynamic solution is:
, , ffsinty' + crcosty 'jsinm z' + lco stü '-c rs in tü 'jco sty z 'le^ " 'w \ z \ t ' ) = M----------------------- i------------ _L— .— ------------1------------L------- (9)cosdü -crsin tu
where
cr = Ç œ '- j^
The dynamic solution in non-dimensional time and space is only a function of cu', ^ and
Ç . In the analysis, the most accurate results for L = 0 — 1 730 m were obtained by using
^ = 0.93 and Ç, = 1.78 . These values only differed by 14 and 16.5% from the values that
were calculated using empirical data for the drag coefficient and added mass and
manufacturer’s specification data for the tether.
3. Model Predictions
In this section, we use the analytic model to calculate many o f the system
characteristics presented in part 1. In particular, the natural frequency and system
harmonics predicted by (9) agree with the measured data from part 1. Within the wave
band, the transfer function between ship and cage motion estimated from the data and
calculated using the model are very close in magnitude and are almost identical in phase.
Using ship motion for input, the model accurately predicts the tension in the tether (at the
surface) within the wave-band. Also, the model is used to predict the onset o f zero
tension in the tether, and thus, the ship motions for which snap loading will occur.

121
Of course, experimental data will not be available for most applications of our
model and therefore exact values of ^ and Ç will not be known; and best estimates will
have to be used in analyses. Therefore, if the model is to be useful, it must be robust and
stable for variations in ^ and Ç . In the last part of this section, we investigate the
sensitivity o f the model to variations in ^ and C,.
3.1. Natural frequency and harmonics
If the natural frequency or any of the harmonics should occur in or near the wave
band, the cage motion wiU be larger than the motion of the ship. Large motions would
likely result in snap loading and make operation difficult. Therefore, the ability to
accurately predict these frequencies during a design is important for the development of a
safe, reliable and effective system. The natural frequency (û\ ( iTifi ) is the smallest value
of a>' for which the magnitude of the denominator of (9) is a minimum. The harmonics,
£U , cUj ..., occur at subsequent minima. We cannot directly solve for the minimum
because the slope of the denominator is discontinuous at the minima and is therefore not
differentiable. However, when:
c o ' » ^ (10)
we can neglect the imaginary part of a and the denominator becomes purely real.
Neglecting the imaginary part o f the denominator is equivalent to ignoring the drag. The
natural frequency and harmonics can be found by setting the real part of the denominator
to be identically zero:
122
Using I 765 m as a reference, co{ is almost equal to the r.h.s. of (10). However, at the
second harmonic, co' is 6 times larger than the r.h.s. o f (10). We therefore used (9) to
calculate the natural frequency and (11) to calculate the harmonics. For clarity and
simplicity, we refer only to cyclic frequencies ( f / ) for the remainder of this paper.
Equations (9) and (11) yielded nearly identical values for each of the harmonics, / / and
/ j ' , at each depth investigated, even though, at 5 000 m, iT tf' is only 2.3 times larger
than the r.h.s. of (10). This is because the frequency for which the denominator of (9) is a
minimum is relatively unaffected by drag, , for the harmonics.
The non-dimensional natural frequency ranges between / , '= 0 at 0 m and
f{ = 0.16 at 5 000 m. The harmonics occur at integer multiples of 0.5. They are nearly
independent of depth and shift only slightly to higher frequencies with increasing depth
(Table 1). At the harmonic frequencies, more motion is transferred between the ship and
cage, and therefore, the coherency, T ", between the ship and cage motions at these
frequencies will be much larger than at intermediate frequencies. Thus, we use the
coherency between the vertical acceleration records of the ship and cage to highlight the
properties of the harmonics identified by the model. In particular, when the frequency
axis is non-dimensionalized and scaled by 2, the peaks of the coherency for all depths
occur at integer values (Fig. 1).
123
For several depths. Table I compares the measured values of the natural
frequency, f ' , and the second, , and third, , harmonics against the values
calculated using (9) and (11). The calculated and measured values agree remarkably well.
The predicted natural frequency is within the 95% confidence interval of the measured
90° phase (DLN). The harmonics predicted by (9) and (11) are almost identical and are
within 5% of the measured values. Equation (9) is slightly more accurate. Thus, (9) and
(11) provide a simple and accurate method of predicting the natural frequency and its
harmonics.
3.2. Transfer function and phase
In the high-frequency band ( / > 1.4 Hz.), the ship motion is small and does not
significantly excite the cage (DLN). Consequently, the error in the estimate of the
transfer function is large above 1.4 Hz in the absence of snap loads. Therefore, we restrict
our analysis to frequencies within the wave-band, 0.1 to 0.25 Hz, because a high degree
of certainty exists for spectral estimates in this range.
In part 1 (DLN), we presented the transfer function estimates between vertical
ship and cage acceleration records for depths of 1 730 and 975 m. For both cases, the
magnitude of the transfer function estimates were greater than unity and the phase
between the motions decreased with increasing frequency in the wave-band. The transfer
function between ship and cage motion H^s^dcü' ) , where the first subscript, (the
vertical position o f the ship), is the input and the second subscript, (the vertical

124
position of the cage), is the output, is found from (9) by simply dividing w (l,f') by
w'(0,r'):
T ^ — T---- ; (12)costo — crsinû)
and thus, the phase is:
f - i âZH^s^Acû')=Y = tan~'
c o t co'-Çcû'(13)
The magnitude of the transfer function, its phase and lag estimated from the data are
compared against (12) and (13) in Fig. 2 and 3 for 1 730 and 975 m, respectively. The
vertical error bars give the 95% confidence interval o f the estimates. The magnitude of
the transfer functions calculated using (12) agrees very well with those estimated from
the data. For example, a t 1730, the calculated magnitude of the transfer function and that
estimated from the data differ by at most 10% in the wave-band. The calculated
magnitude is slightly less up to 0.18 Hz, after which, it is sUghtly larger. At 975 m, the
agreement is even better with differences only reaching a maximum of 2% within the
wave-band. The phase calculated from (13) and estimated from the data agree
exceptionally well in the wave-band for all depths measured. In Fig. (2(b)) and (3(b)), we
see that the calculated phase is always within the 95% confidence interval of the
measurements.
The estimated lag (DLN) agrees very well with the frequency derivative o f (13)
for all depths (Figs. 2(a) and 3(b)). For 1 730 m, the agreement is good for all
125
frequencies. At 0.23 Hz, both lags peak and they differ by only 8%. For 975, the
agreement is good up to 0.21 Hz. At higher frequencies, the agreement is not as good but
the error bars on the measured data are large.
3.3. Tension
If the tension in the tether exceeds the manufacturer’s recommended working
limit, damage to the structural and internal conductors may result. Therefore, predicting
the tension in the tether for any given sea condition is important because it provides a
quantitative criterion for the selection of a tether. In this section, we use the solution to
our model to develop an expression to calculate the tension at any location along the
tether. Then using the prescribed motion of the ship (5), we calculate the transfer function
between the ship motion and the tension in the tether. W e use this transfer function to
predict the frequencies and amplitudes of vertical ship motion for which the tether goes
slack and snap loading is likely.
The tension in the tether is proportional to the strain in the tether. Therefore, the
tension at any location in the tether is:
EAYT = — U:. (14)L
We define the non-dimensional tension as:
T' = - ^ T (15)YEA

126
Substituting U[. = v'. + w'. into ( 14), we see that the tension is the sum of a static tension
and a dynamic tension 7%. , such that T ' = T'^ + 7%. . The static tension is:
W L
For operation at I 730 m, the static tension at the surface calculated using (16) and ± a t
measured are very close and are 82 157 and 82 530 N respectively. The dynamic tension
is:
ty 'flsincü'+ acosû}'} costü 'z '- (costy ' - (T sinû)'} sin 'TL = — --------------------- — ■■ .------------ (17)COSCÛ - a s in tu
The transfer function between the ship motion and the tension in the tether is calculated
by dividing (17) by the prescribed ship motion (5). Since the tension was only measured
at the surface, we validate (17) by comparing the calculated transfer function at that
point,
against the measured transfer function. The measured transfer function is compared
against (18) in Figs. 4 and 5 for 1 730 and 975 m, respectively. Again, the vertical error
bars give the 95% confidence interval of the estimates. For all depths, the estimated and
calculated transfer functions agree very well for frequencies up to 0.2 Hz in the wave
band, but deviate at higher frequencies. The maximum difference is 16% at 0.25 Hz for
1 730 m and this difference decreases with decreasing operating depth. At 975 m, the
127
maximum difference is only 10% and the calculated transfer function agrees, within the
95% confidence interval, with all measurements within the wave-band.
Snap loading is preceded by the tension going to zero and slack developing in the
tether. Although the model is only valid when the tether is taut, it can be used to predict
the ship motion for which the tension in the tether approaches zero. Therefore, we use (5)
and (17) to predict the amplitudes and frequencies for which the tether will go slack at the
cage. The tension at the cage is the sum of the static and dynamic tension at z ' = 1 :
W L+ (19)
and
r -^ — 1 (20) cos ty - c r sin CÜ
where H^sjc is the vertical ship position-cage tension transfer function. The critical
amplitude at which the tether tension (19) goes to zero is given by:
EA(Ü a
c o s A ) — C T S i n û J
Lines of zero tension, , are plotted in Fig. 6 in the frequency range of 0 to 0.4 Hz for
operating depths of 930 and 1 730 m. Snap loads are predicted to occur when the
amplitude of surface displacement, Y , exceeds the critical value. The amplitude for
128
which the tension is zero decreases with increasing frequency to a minimum near the
natural frequency. The vertical motion o f the cage is normally distributed, and therefore,
an estimate of T that contains 99% o f the measured amplitudes (in the wave-hand) can
be calculated using:
Y = 25^jc^dû)
where C | is the spectrum of the vertical displacement of the ship and the integration is
done over the wave-band. Indeed Y did exceed the lines of zero tension over a small
range at higher frequencies in the wave—band (Fig. 6) — the tether remained taut for most
sea conditions; however, in a few cases during extreme motions, Y did exceed the lines
of zero tension, slack developed and snap loads resulted.
3.4. Sensitivity
Only two non-dimensional variables, ^ and Ç are needed in our model to
characterise any vertically tethered system and determine the associated transfer
functions, natural frequency and harmonics. If motion/tension data are not available (e.g.
in the design process), values for ^ and Ç can be calculated using estimates of the tether
stiffness, cage drag coefficient, rms vertical velocity, tether mass per unit length, and the
mass of the cage (including entrained water). Using this method, precise values of ^ and
^ will not be known. If small changes in ^ and Ç result in large changes in the model
predictions, the utility of the model would be limited. Therefore, our model must yield
reasonably accurate results for small variations in ^ and Ç if it is to be considered a

129
useful tool. We calculated the relative changes in natural frequency, its harmonics and the
magnitude and phase of the transfer functions to variations of ^ and ^ of up to ± 25%
around their optimal values. We did this by calculating:
1
where X is any function of interest. The phase of the transfer function was close to zero
at lower frequencies and to avoid large unrepresentative values for the relative change,
we calculated the change of phase for variations of ^ and Ç .
Sensitivities of the natural frequency and its harmonics were calculated using (9)
and (11), respectively (Table 2). The largest percent change of the frequencies predicted
by (9) was 17% at 5 000, but this corresponds to a change in magnitude of only 0.017 Hz.
The largest variation at any depth was only 0.05 Hz. Equation (11) was only slightly
affected by variations of ^ and Ç, . Clearly, the calculated values of the natural frequency
are insensitive to variations in ^ and and thus, (9) and (11) provide good estimates the
natural frequency and its harmonics.
For operating depths of 975 and 1 730 m. Figs. 7 and 8 present the sensitivity of
the transfer function between the vertical motion of the ship and cage to
variations in and Ç . Scaling both the frequency and vertical axes in proportion to
yields a sensitivity to the mass ratio, that is independent of depth. A similar result is
obtained for the sensitivities to the force ratio, , by scaling only the frequency axis in

130
proportion to . W ithin the wave-band, the magnitude is most sensitive to variations in
^ while the change in phase is most sensitive to variations in ^ . In the wave-band,
±25% variations in either parameter yield a maximum change in the magnitude and
phase of o f only 33% and 20° at 1 730 m, respectively. Therefore, we
conclude that a reasonably accurate prediction of the magnitude and phase can be
obtained using “rough” estimates of ^ and Ç. An interesting phenomenon can be seen in
Fig. 7(b) where the sensitivities are identically zero at 0.22 Hz (0.31 Hz) for depths of
1 730 m (975 m). The phase is independent of ^ at these frequencies. A similar result
occurs between 0.21 and 0.23 Hz (0.3 and 0.35 Hz) for 1 730 m (975 m) where the
magnitude of the transfer function is only slightly sensitive to variation in Ç (Fig. 8(a)).
The sensitivity o f the magnitude of the transfer function between ship
displacement and tension at the surface, is also independent of depth when the
frequency is scaled in proportion to for variations o f ^ and Ç and when the
sensitivity is scaled by for variations of Ç . The maximum change of the transfer
function was 28 and 35% for variations in ^ and respectively (Fig. 9). At 0.16 Hz
(0.21 Hz) and between 0.26 and 0.3 Hz (0.35 and 0.4 Hz) the magnitude of the transfer
function is independent of ^ and only slightly sensitive to changes in Ç , respectively for
1 730 m (975 m) operation.
131
4. Discussion and Conclusion
The merit of any analytic model is its ability to predict the response of the
modelled system to specified inputs and to quantify system characteristics. We developed
a continuous linear-elastic one-dimensional model to describe the behaviour of vertically
tethered systems. Boundary conditions are a prescribed displacement at the surface
(usually imparted by surface waves) and a force balance at the bottom end of the tether
(tension, weight, drag and mass acceleration). Our model gives ROV designers and
operators a quick and inexpensive tool to estimate cage motions, tension in the tether, the
natural firequency and harmonics of the system and many other characteristics at all
operating depths for a given vertical motion of the ship. We validated our model by
comparing the model output against measurements of a real ROV system (the ROPOS
deep-sea ROV system) and found that: (a) predicted values o f the natural frequency
differed by at most 10% and were within the 95% confidence interval of the measured
values; (b) measured and calculated values of the harmonics differed by at most 5%; (c)
the magnitude of the calculated transfer function, between the motion of the ship
and cage differs from that estimated from the data by at most 10% within the wave-band
and the depth range 0 — 1 726 m; (d) the calculated phase of H^sjc is always within the
95% confidence interval of the measurements; and (e) the maximum difference between
the measured and calculated magnitude of the transfer function of ship motion and
tension in the tether (at the surface) is only 16%. Our model is accurate but it has
limitations. The drag acting on the cage is quadratic, but it is linearized for a “steady”
amplitude of vertical motion. Thus, our model is not appropriate for non-stationary
motions. Also, the model is invalid for a slack tether, and so, it does not apply to a snap
132
load. However, our model can be used to predict the minimum amplitude of surface
motion that leads to zero tension and the onset of a snap load. Discrete models are not
limited by either these conditions.
Any model should be robust and stable with respect to variations in its
parameters. The solution to our model is a single non-dimensional equation that depends
on two non-dimensional parameters which represent the force ratio of drag to tension, ^ ,
and the mass ratio of the cage and tether, ^ . We calculated the sensitivity of our model to
these parameters and found that: (a) the natural frequency predicted by (9) is insensitive
to variations in ^ and ^ ; (b) the harmonics predicted by (II) are nearly independent of
^ and Ç ; and (c) the transfer functions between the motion of the ship and cage and
between the motion of the ship and tension in the tether are only moderately sensitive to
variations in ^ and Ç .
For comparison with the parameters of the ROPOS ROV system ( < = 0.93 and
Ç = 1.78), the parameters for a more streamlined and massive platform (a piston coring
tool) and a less streamlined platform (a water sampling rosette) are ^ = 0.46 and
Ç = 2.50; and^ = 1.27 and ^ = 1.9 ,respectively for L = 1 730 m. These values are
reasonably close (within a factor of 2) to those for the ROPOS system, and therefore,
each of these systems will have similar dynamic characteristics — motion amplification
at the underwater platform, frequency dependent lag and natural frequencies close to the
wave-band. Because the ratio of to ^ for the piston coring tool is less than for the
ROPOS system, the natural frequency and its harmonics are more accurately predicted by

133
(11) than for the ROPOS system. In the extreme case of a streamlined body suspended by
a stiff tether, ~ 0 and (11) provides exact values for the natural frequency and its
harmonics.
The tether length, L , and the speed o f tensile waves, c , provide the non-
dimensionalization of frequency and time. The harmonics of the natural frequency are
nearly independent of to ^ and occur at integer multiples of c(2L)“‘ (see Fig. 1).
Although, most parameters of a tether (mass per unit length, diameter, etc.) are usually
available, the tensile stiffness, EA (used to calculate c ), may be unavailable or only
poorly determined. The stifrhess, E A , can be determined by force-strain measurements
using specialised equipment. The non-dimensionalization offers an alternative approach.
Impulsive loading of the tether (e.g. suddenly stopping the winch) generates a tension
(strain) wave. This tension wave is lightly damped, travels along the tether at a speed c
and is reflected at its terminations (the ship and cage) (DLN). The speed o f the tensile
waves, c , is independent of the tension in the tether and can be estimated from the time
between successive tension maxima (spikes) at the surface.
When the non-dimensional parameters ^ and Ç cannot be estimated using
experimental measurements, they can be estimated using the tether stiffness, cage drag
coefficient, rms vertical velocity, tether mass per unit length, and the mass of the cage
(including entrained water). Can we accurately estimate ^ and Ç using information
available during the design process? Using empirical data for the drag coefficient and
added mass, the tether manufacturer’s specification data and the measured rms vertical
cage velocity, we initially estimated values o f < = 1.06 and C = 2 520L"‘ which differ by
134
only 14 and 16.5% from the values that give the best agreement with the measured
transfer function between the vertical motions o f the ship and cage. The uncertainty stems
mainly from the estimation of entrained mass, tether stiffness and, to a lesser extent, the
drag coefficient. (When data for the cage velocity is not available, it can be estimated by
iterative use of the model). Had we used the initial estimates of ^ and Ç , our predictions
for the natural frequency, f ' , and its harmonics, and , the magnitude and phase
for the transfer function between the motion of the ship and cage and the magnitude of
the transfer function between ship motion and tension in the tether (at the surface) would
have differed by only 3%, 0.9%, 0.3%, 14%, 15° and 19%, respectively, from the real
system at 1 730 m.
Acknowledgements
We would like to thank Jim McFarlane and the staff of International Submarine
Engineering (ISE) for their continual support and assistance in this project. F.R. Driscoll
was financially supported by scholarships from the Natural Science and Engineering
Research Council (NSERC), the Science Council of British Columbia (SCBC) and ISE.
This work was partially supported by the US Office o f Naval Research under contract
NOOO14-93-1-0362 and NSERC .
135
References
Caughey, T.K. 1963. Equivalent linearization techniques. Journal o f the Acoustic Society
o f America 35. 1706-1711.
Driscoll F.R. and Biggins L. 1993. Passive damping to attenuate snap loading on
umbilical cables of remotely operated vehicles. IEEE Oceanic Engineering
Society Newsletter 28, 17-22.
Driscoll, F.R., Lueck, R.G., and Nahon, M. 1999. The motion of a deep-sea remotely
operated vehicle. Part 1: motion observations. Submitted to Ocean Engineering.
Grosenbaugh, M.A. 1996. On the dynamics of oceanographic surface moorings. Ocean
Engineering. 32, 7-25.
Hover, F.S. and Yoerger, D.R. 1992. Identification o f low-order dynamic models for
deeply towed underwater vehicle systems. International Journal o f Offshore and
Polar Engineering. 2, 38—45.
Huang, S. and Vassalos, D. 1995. Chaotic heave motion of marine cable-body systems.
Proceedings o f the ISOPE-Ocean Mining Symposium, Tsukuba, Japan. 83—90.
Niedzwecki, J.M. and Thampi, S.K. 1988. Heave Compensated Response of Long
Multi—segment Drill Strings, Applied Ocean Research. 10, 181-190.
136
Niedzwecki, J.M. and Thampi, S.K. 1991. Snap loading of marine cable systems. Applied
Ocean Research. 13, 210—218.
Rao, S.S. 1990. Mechanical Vibrations. Addison—Wesley Publishing Company, New
York.
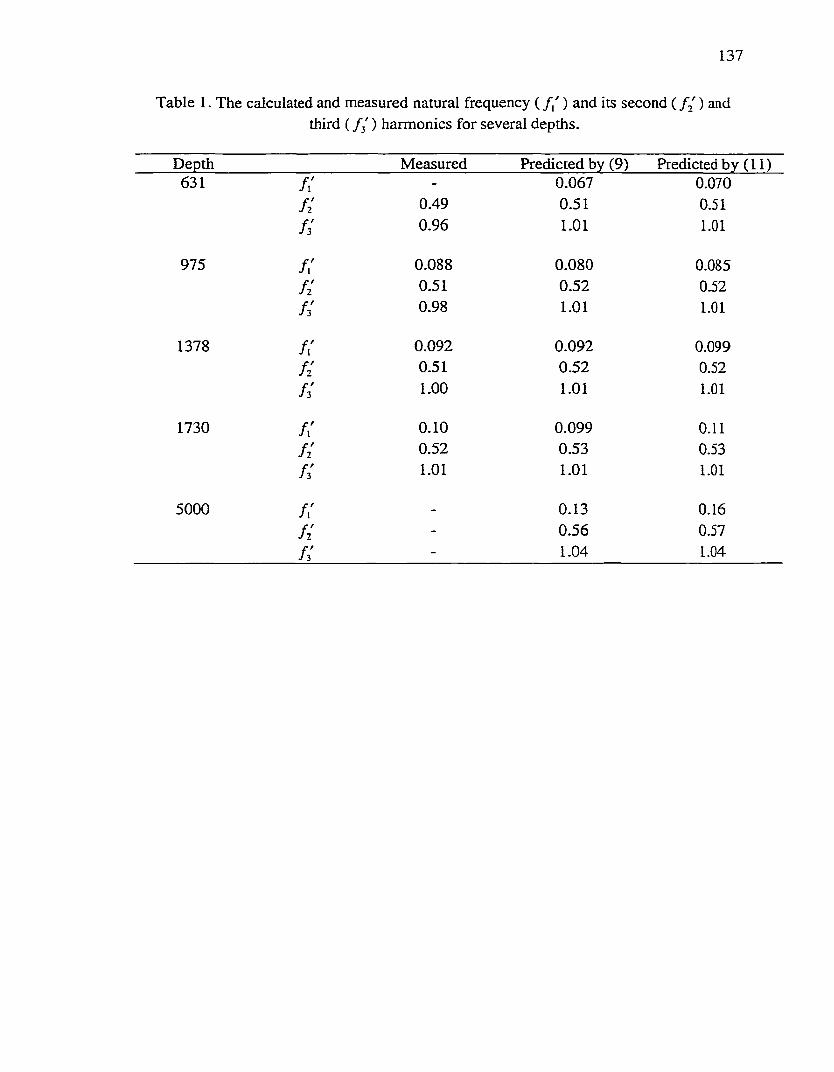
137
Table I . The calculated and measured natural frequency ( f ' ) and its second ( / / ) andthird ( / j ' ) harmonics for several depths.
Depth Measured Predicted by (9) Predicted by (11)631 /i ' - 0.067 0.070
f i 0.49 0.51 0.51
/ / 0.96 1.01 1.01
975 / . ' 0.088 0.080 0.085f i 0.51 0.52 0.52/ / 0.98 1.01 1.01
1378 K 0.092 0.092 0.099f i 0.51 0.52 0.52
f i 1.00 1.01 1.01
1730 f i 0.10 0.099 0.11f i 0.52 0.53 0.53f i 1.01 1.01 1.01
5000 f i - 0.13 0.16f i - 0.56 0.57
f i - 1.04 1.04

138
Table 2. Percent changes in the predicted natural frequency and its second and third harmonic for ±25% variations in the non-dimensional parameters ^ and Ç, .
Depth +25% ^ -25% ^ +25% C -25% C631 -2.4 1.9 -9.2 12.8
f i - - -0.4 0.6
f i - - -0.1 0.2
975 f i -3.7 2.8 -8.7 11.7
f i - - -0.6 1.0
f i - - -0.2 0.3
1378 f i -5.1 3.8 -8.1 10.6
f i - - -0.8 1.3
f i - - -0.2 0.4
1730 f i -6.4 4.6 -7.6 9.9
f i - - -1.0 1.5
f i - - -0.3 0.4
5000 f i -17.0 10.1 -5.1 6.2
f i - - -2.0 3.0
f i - - -0.7 1.1

139
631 m 975 m 1376 m 1726 m
B
Averaged irî i>
$%
0 % 0
F = 2fUc
Fig. 1. Coherency, F " , between the vertical acceleration records of the ship and cage for several depths as a function of frequency (non-dimensionalized by depth and the speed of tensile waves in the tether).
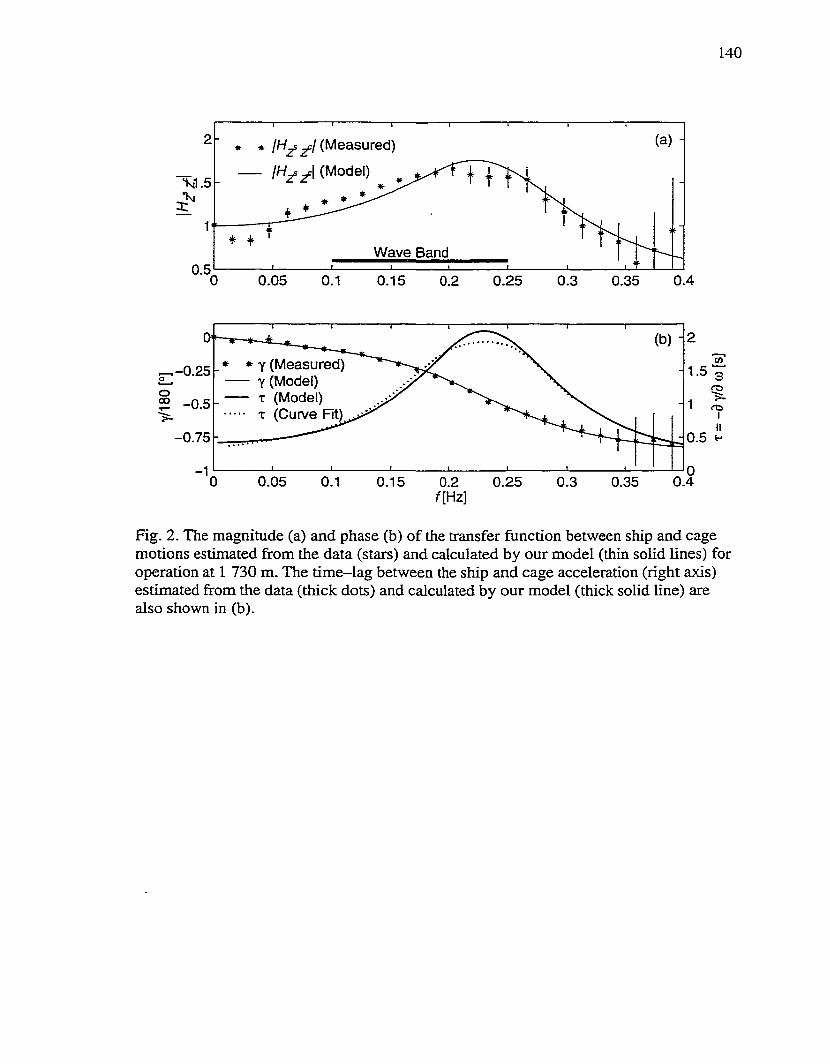
140
(a) -[H ^ 1 (Measured)
/H s cl (Model)
Wave Band0.5
0.05 0.1 0.15 0.25 0.3 0.40.2 0.35
* * Y (Measured) Y (Model)
„ -0 .2 5
T (Model)T (Curve
-0.75 0.5 H
0.05 0.1
Fig. 2. The magnitude (a) and phase (b) o f the transfer function between ship and cage motions estimated from the data (stars) and calculated by our model (thin solid lines) for operation at 1 730 m. The tim e-lag between the ship and cage acceleration (right axis) estimated from the data (thick dots) and calculated by our model (thick solid line) are also shown in (b).

141
» * /H^s^/(Measured)
( M o d e n ^
Wave Band0.5 0.35 0.40.30.2 0.250.150.10.05
* * y (Measured) Y (Model)
^ -0 .2 5
T (Model)T (Curve Fit)
0.5 H-0.75
Fig. 3. Same as Fig. 2, but for 975 m depth.
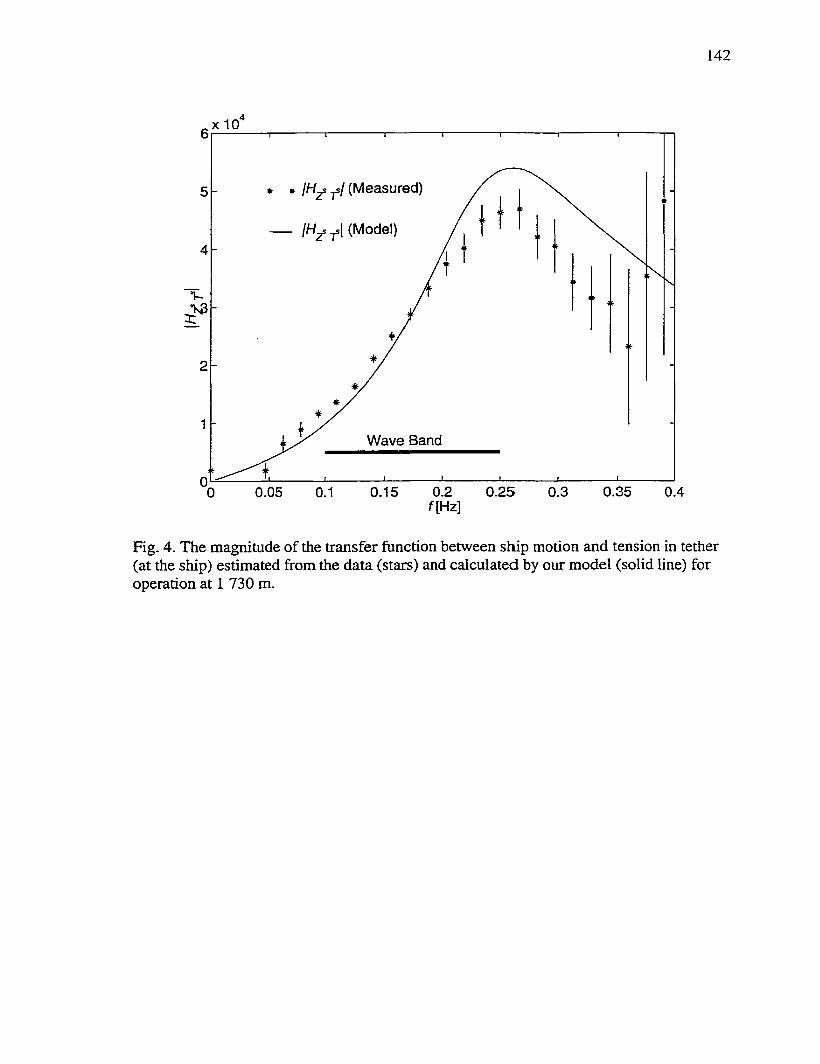
142
x10
/H^ï f l (Measured)
— IH^ ^1 (Model)
Wave Band
0.350.2f[Hz]
0.25 0.3 0.40.05 0.150.1
Fig. 4. The magnitude of the transfer function between ship motion and tension in tether (at the ship) estimated from the data (stars) and calculated by our model (solid line) for operation at 1 730 m.
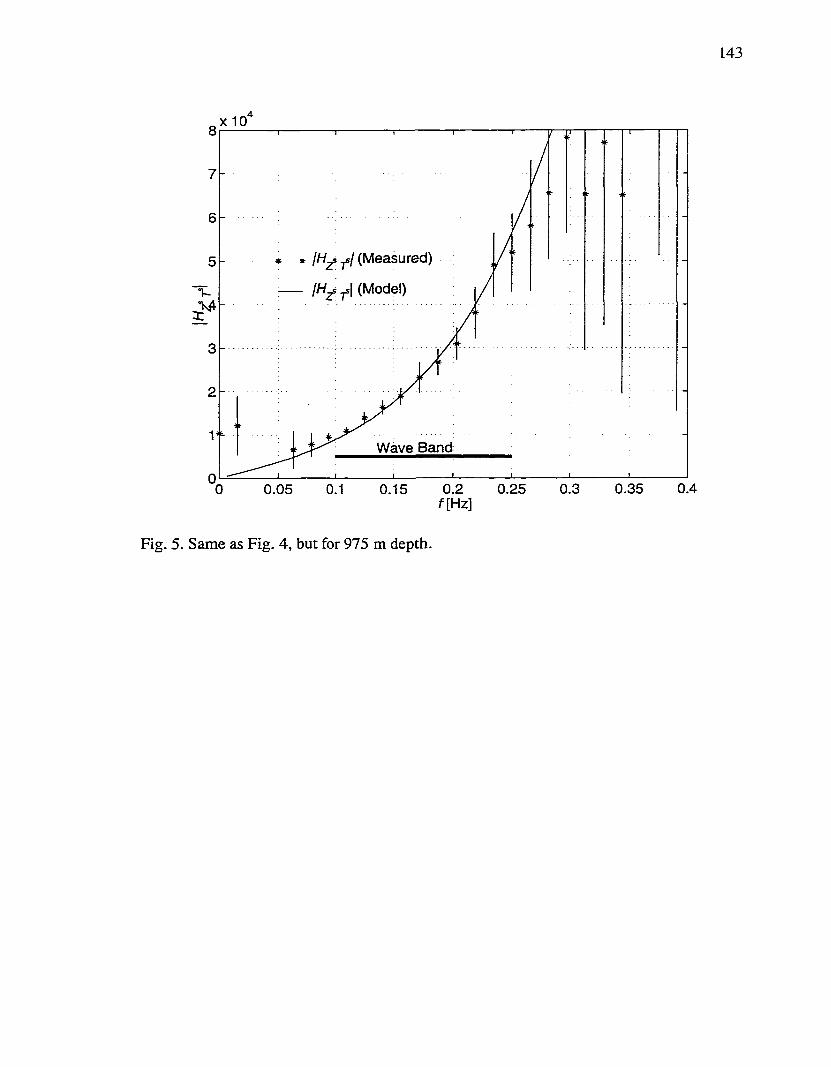
143
X 10
/H^s f l (M easured)
IHf (Model)
Wave Band
0.40.3 0.350.2f[Hz]
0.250.05 0.1 0.15
Fig. 5. Same as Fig. 4, but for 975 m depth.
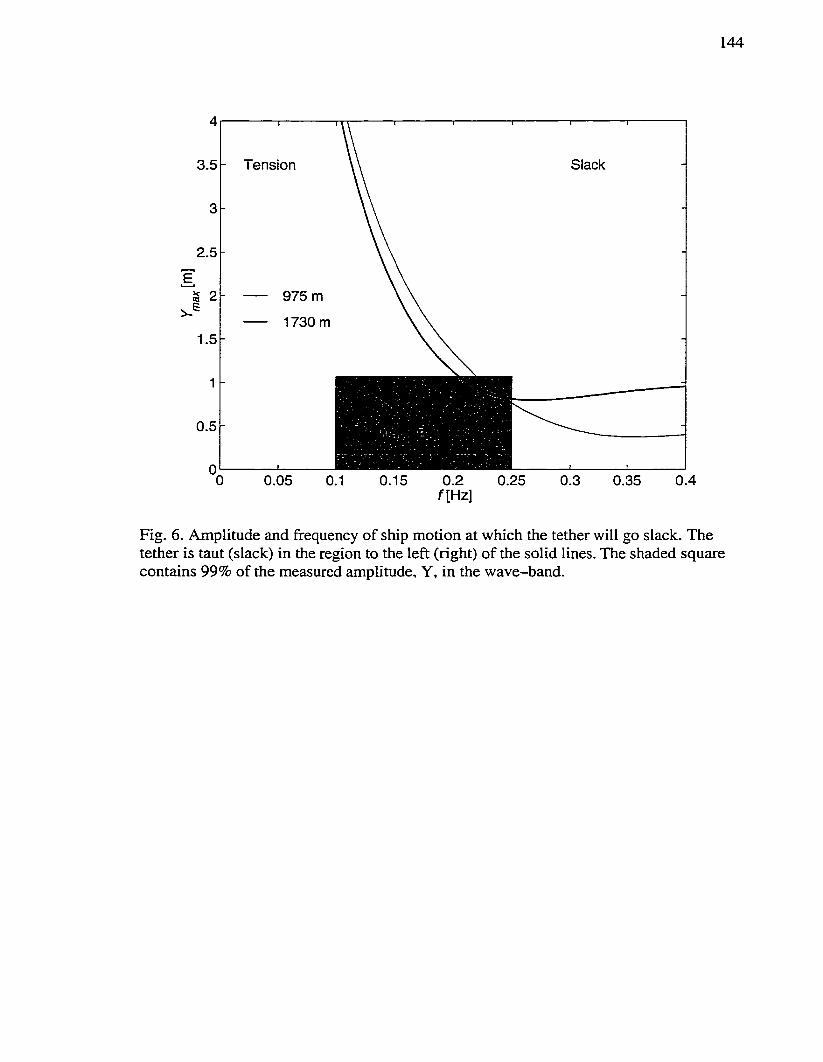
144
Tension Slack3.5
2.5
975 m
1730 m1.5
0.5
0.40.05 0.1 0.15 0.2f[Hz]
0.25 0.3 0.35
Fig. 6. Amplitude and frequency of ship motion at which the tether will go slack. The tether is taut (slack) in the region to the left (right) of the solid lines. The shaded square contains 99% of the measured amplitude, Y, in the wave-band.
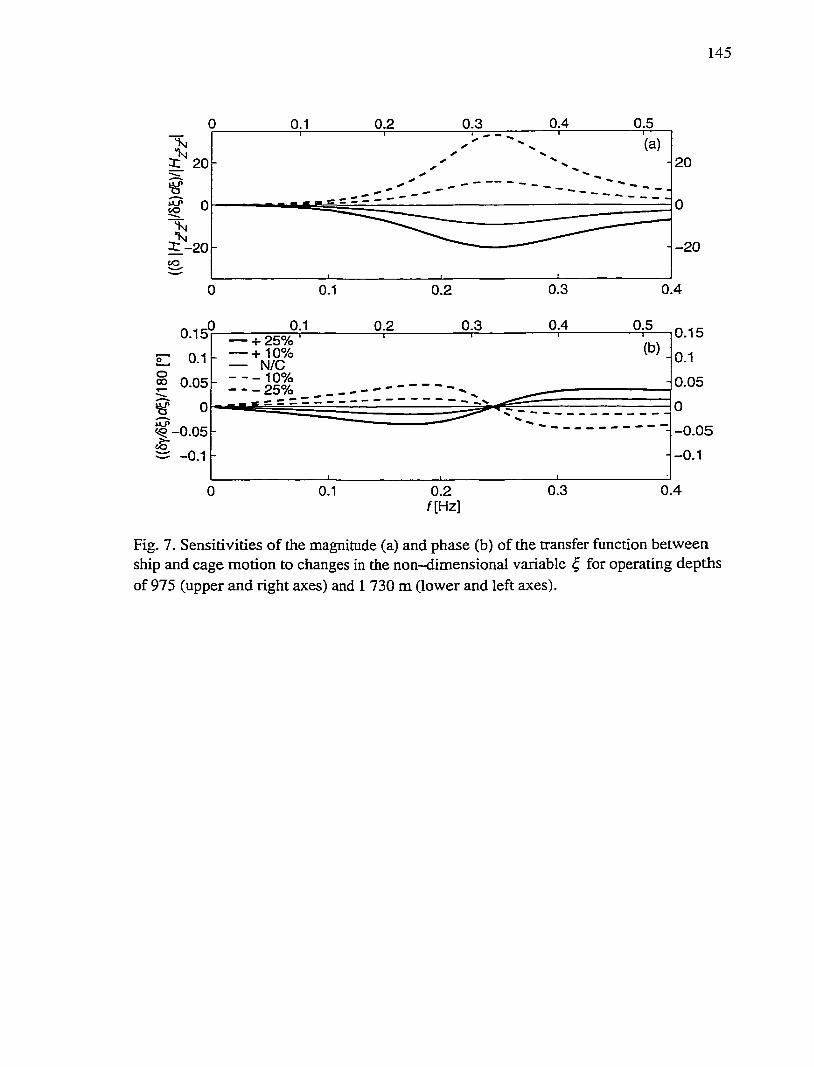
145
0.4 0.50.30.1 0.2
2020
— - ' -
-20CO
0.3 0.40 0.1 0.2
+ 25% + 10%
N/C - 10% - 25%00 0.05
-0.05«e -0.05
Fig. 7. Sensitivities of the magnitude (a) and phase (b) of the transfer function between ship and cage motion to changes in the non-dimensional variable ^ for operating depths of 975 (upper and right axes) and 1 730 m (lower and left axes).
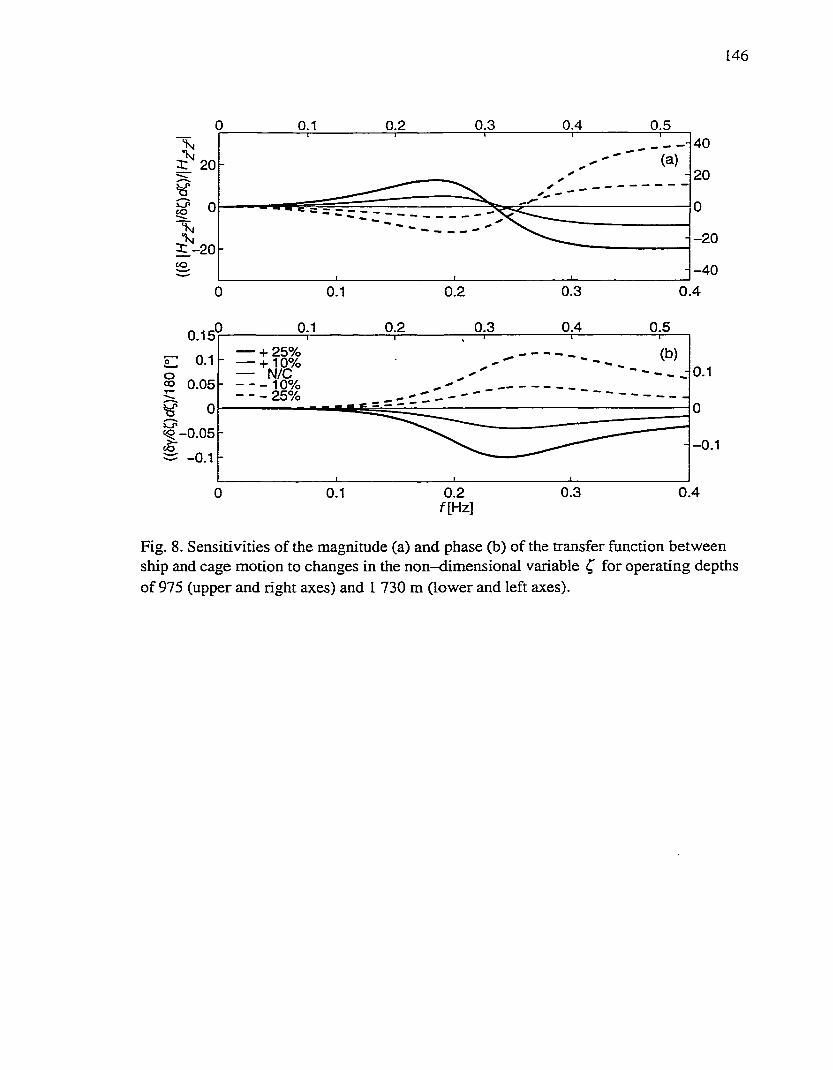
146
0.1 0.2 0.3 0.4 0.540
20- 20
v_pto 0
-2 0
-400.3 0.40 0.1 0.2
0.40.2 0.3 0.50.10.15— + 25%
- - - 10 %
- - - 25%
0.10.1
00 0.05
y 0O'«5 -0.05ë -0.1
- 0.1
0.3 0.40.20 0.1f[Hz]
Fig. 8. Sensitivities of the magnitude (a) and phase (b) of the transfer function between ship and cage motion to changes in the non-dimensional variable Ç for operating depths of 975 (upper and right axes) and 1 730 m (lower and left axes).
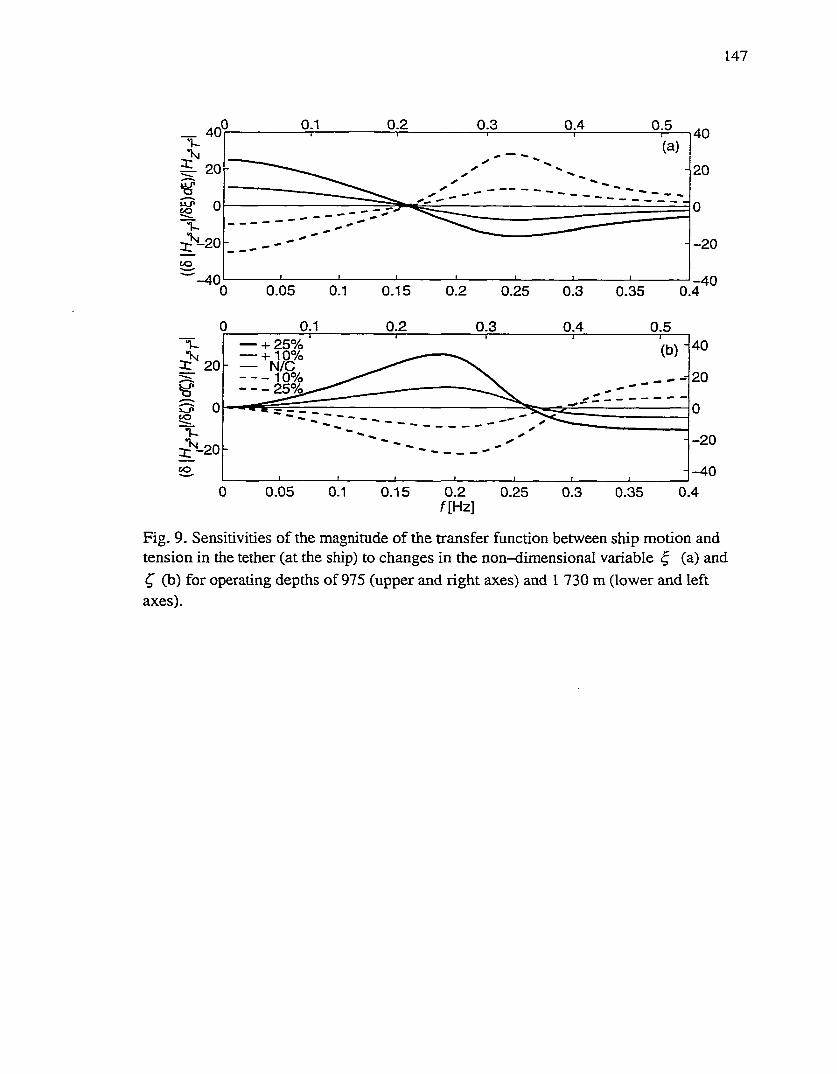
147
0.1 0.2 0.3 0.4 0.540 40
20 20
-20to
-40 -400.05 0.1 0.15 0.2 0.25 0.3 0.35 0.4
0.1 0.2 0.3 0.4 0.5— + 25%
10% 25%,
20
u1-
^ - 2 0CO
-20
-400 0.05 0.1 0.15 0.2 0.25 0.40.3 0.35
f[Hz]
Fig. 9. Sensitivities of the magnitude of the transfer function between ship motion and tension in the tether (at the ship) to changes in the non-dimensional variable ^ (a) and Ç (b) for operating depths of 975 (upper and right axes) and 1 730 m (lower and left axes).
148
Appendix C
Development and Validation of a Lumped—Mass Dynamics Model of a Deep Sea
ROV System

149
Development and Validation of a Lumped-Mass Dynamics Model of a Deep-Sea ROV System
F. R. Driscoll
Departments o f Mechanical Engineering and School o f Earth and Ocean Sciences,University o f Victoria, Victoria, B.C., Canada. V8W 3P6
R. G. Lueck
Centre fo r Earth and Ocean Research, University o f Victoria, B.C., Canada. V8W 3 P6
M . Nahon
Department o f Mechanical Engineering, University o f Victoria, Victoria, B.C., Canada.V8W3P6.
{Submitted to Applied Ocean Research)
We develop a one-dimensional finite-element lumped-mass model o f a vertically tethered
caged ROV system subject to surface excitation. Data acquired during normal operation at
sea are used with a Least-Squares technique to estimate the coefficients required by the
model. Our model correctly predicts a) the motion o f the cage and the tension in the tether at
the ship, b) the spectrum o f cage acceleration in the wave-band, c) the transfer function
between the vertical motion o f the ship and cage, and d) the natural frequency of the system
and its harmonics. A simple model o f the wake of the cage was added to our simulation and
this reduced the error in the calculated motion and tension by almost a factor o f 2 and
brought the calculated transfer function within the 95% confidence interval of the
measurements. By increasing ship motion slightly, our model accurately reproduced eight
snap loads and their non-linear characteristics — a regularly spaced series o f rapid increases
in the records of the acceleration o f the cage and tension at the ship — that occurred during
the measurements used for validation.
Key Words: Tethered marine systems, finite element analysis, offshore engineering.
Remotely Operated Vehicle, snap loading, cable modelling.
150
INTRODUCTION
Caged remotely operated vehicles (ROVs) are robots that effectively operate in
the dangerous high-pressure environment o f deep water while their human controllers
remain safely aboard the support ship (Figure 1). The tether connecting the ship and cage
provides the ROV with the ability to stay at the underwater work site indefinitely and
allows real-time communication with the ROV. However, the tether also couples the ship
motion to the cage, and, as a result, these systems do not operate in rough seas. Rough
seas cause slack tether, large snap loads and erratic cage motion^ which damage the
tether and its internal electrical and optical conductors. The resulting degradation reduces
the life of the tether and endangers the recovery o f the ROV. Many other vertically
tethered systems are dynamically similar to caged ROVs, including CTDs (conductivity
temperature and depth measuring platforms), drill strings, water sampling rosettes,
tethered equipment being lowered to the ocean floor, and piston coring tools. Reliable
tools are needed to predict the behaviour of vertically tethered systems so that designers
can minimise motions and tensions and users can know which sea states will produce
snap loads. In this paper, we develop a finite-element lumped-mass model o f a vertically
tethered caged ROV system and use it to predict the cage motion and tension in the tether
for prescribed ship motion.
Two tools are available to predict the response of vertically tethered systems —
continuous (closed-form analytic) and discrete models. Continuous models can be used to
accurately calculate many of the dynamic characteristics of tethered systems, including
motion and tension spectra, transfer functions, natural frequency and its harmonics, and

151
the onset of slack in the tether ■“*. However, continuous models have limitations.
Equivalent linearization techniques are used to approximate the quadratic drag for steady
amplitudes which enables closed form solutions and frequency-domain analysis
Thus, these models are not appropriate during unsteady wave conditions. Continuous
models are also invalid for a slack tether, which is the precursor to snap-loads, and it is
difficult (if not impossible) to solve the differential equations governing a tether when its
properties change along its length. Discrete models are not constrained by the limitations
of continuous models and they are valid for a wider range of operating conditions and
system configurations. Niedzwecki and Thampi^ developed a discrete multi—segment
lumped-paramter representation of a drill string connecting a ship to a subsea package
and used it to investigate snap loading. They reproduced many of the snap load and
motion characteristics that were observed by Driscoll et aÛ for a real system, namely, a
repeating pattern o f rapidly increasing tension during snap loads and vertical motion at
the platform that was greater than at the ship.
The predicted behaviour can be sensitive to the model coefficients, such as added
mass®, and choosing representative values is difficult because many components are
complex and asymmetric (armoured/faired tether, ROV cages and Conductivity
Temperature and Depth measuring platforms). For example, Yoerger et a f found that the
normal drag coefficient of a long vertical tow cable is amplified well above the value for
a rigid cylinder and that it depends on operating conditions. Therefore, coefficients must
be calibrated using measured data to obtain confidence in a model. Additionally, discrete
models are approximations to real systems, and therefore, validation against real data is
essential in proving their accuracy and reliability. In our literature search, we found one

152
work that calibrates coefficients o f a deep towed vehicle using data’ and one that
compares results of a discrete model of a towed system against its actual motion®.
However, no work was found that uses data to calibrate and validate discrete models o f
vertically tethered systems.
In this paper, a finite-element lumped-mass model of a vertically tethered ROV
system is developed by applying Galerkin’s method to a continuous representation o f the
tether. Motion and tension measurements of the ROPOS ROV system^ are used to
accurately determine values for the model coefficients. In particular, a least-squares
technique is used to estimate the drag coefficient and mass (including added and
entrained mass) of the ROV cage. The vertical motion of the top element is prescribed
with actual ship motion and our model is validated by comparing the calculated and
measured motion of the cage and tension in the tether. A simple representation of the
wake of the cage is also developed and its addition improves model accuracy. Finally, we
compare the predicted and actual response during snap loads.
DISCRETE MODEL
For a typical deep-sea ROV system operating in the absence of time varying
currents or large horizontal excursions of the support vessels, the ship and cage are only
coupled vertically \ The displacement of the cage due to surge, sway, roll, pitch and yaw
motions is small compared to the vertical scale 0(1:1000) of the tether and such motions
are not effectively transmitted by the tether. Therefore, a one-dimensional model is
sufficient to represent a caged ROV system. For modelling purposes, the system is
broken down into three individual sub-systems: the support ship with its A-frame, the
153
tether, and the cage and ROV. We use a finite-element lumped—mass model to represent
the tether, a displacement function to prescribe the ship motion and a second order
differential equation to represent the cage and ROV unit. The model is developed using a
single inertial reference frame located at the mean sea surface, with downward
displacements defined as positive.
Tether model
The tether is a long elastic structural member that can only sustain tensile loads
and may have length—varying properties. We represent the tether as a long elastic
cylinder that is suspended directly below the ship’s A-frame. Defining j as the vertical
unstretched co-ordinate along the tether, the balance of forces (per unit length) at any
point in the tether is*:
ciT^ + W + F = ma ( 1)ds
where
^ = i P c ~ P w ) ^ S (2)
is the in situ weight (per unit length), T{s) is the tension in the tether, F{s) is the
hydrodynamic force, m is the effective mass (per unit length including entrained water),
a is the inertial acceleration, g is the gravitational acceleration, A(j) is the cross-
sectional area of the tether, p^is) is the density of the tether and is the density of sea
water. The added mass forces are zero for flow tangent to a cylinder‘s, and therefore.
154
F(s) is only composed of drag forces. The hydrostatic pressure induces circumferential
and radial stress and a depth dependent axial strain in the amour strands of the tether".
The ratio of the standard deviations of the strain induced by the tension to the strain
induced by the pressure at any point in the tether is 1000 because the tether only
oscillates short vertical distances (< 3 m). Thus, hydrostatically induced axial strain is
considered constant in time and it is neglected in our analysis. Assuming the water is
stationary in the far field, F{s) is^ :
F(s) = ~ p ^ D i e + l)C^^Ü\Ü\ (3)
where e is the local strain in the tether, D(^)is the diameter o f the tether, is the
tangential drag coefficient, ( ') represents a time derivative and Ù is the velocity of the
tether. The relationship between tension and axial strain is:
T(s) = EAe (4)
where E is the effective Young’s modulus of the tether.
We chose a finite-element implementation because it is versatile and can model
the complicated non-linear characteristics of vertically tethered systems. For example,
we can quickly assemble complex models of multi-component systems connected by
tethers with different and length dependent properties because elemental tether equations
are developed from a generalised linear-elastic tether subject to unspecified boundary
conditions. Components, such as ROV cages, weights/floats, and intermediate platforms
155
can be easily added because they are each represented as a point mass and the
hydrodynamic, gravitational and buoyancy forces acting on them are described by one
differential equation.
The tether is discretised by first dividing it into N segments (elements) which
have the same properties as the continuous tether. The end points of each element are the
nodes of the system. Each element i is of length and has an associated body—fixed
reference frame attached to the upper node with the z axis pointing downward along the
element. The top of the tether is attached to the ship’s A-frame. To facilitate the finite-
element derivation, the location of any point p in element i is defined using a coupled set
of reference and elastic co-ordinates^^:
z!’ = Z + sl’ + u f (5)
where Z is the position of the top, node 1, of the tether in the inertial frame, s f is the
constant length position vector from node 1 to a point p along the undeformed tether and
uf is the cumulative elastic displacement of the tether up to point p . We use an elemental
trial solution, u f to approximate the elastic displacement, uf :
where 0, y(5) is a shape function and 09^(r) is a time-dependent coefficient (yet to be
defined). Each tether element has only one degree o f freedom and a linear shape function
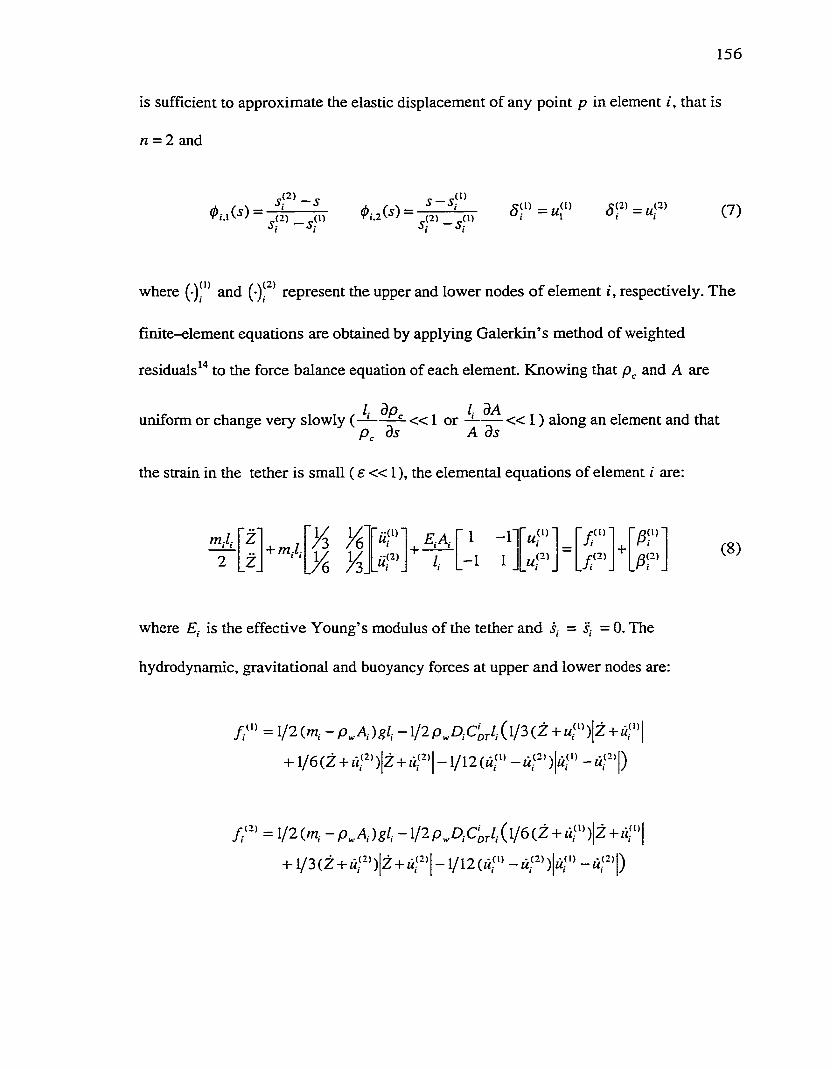
156
is sufficient to approximate the elastic displacement o f any point p in element i, that is
n = 2 and
(2 ) (7)
where ( ). and (•). represent the upper and lower nodes o f element i, respectively. The
finite-element equations are obtained by applying Galerkin’s method of weighted
residuals to the force balance equation of each element. Knowing that and A are
uniform or change very slowly « 1 or — « 1 ) along an element and thatds A ds
the strain in the tether is small ( e « 1), the elemental equations of element i are:
m .-Z . + m.l.■;(l)
M;(2 )+
E,.A, ■ 1 -1 -1 1
u ( 1)
u.(2 )' i r
/r - \+ (8)
where E. is the effective Young’s modulus of the tether and i,- = j. = 0. The
hydrodynamic, gravitational and buoyancy forces at upper and lower nodes are:
= l/2(m , -p,^A,.)gZ, + +
+ l/6 (Z + f<' ’)|z + £ i'- '|- l/12 (û ;" - û f i )
= l/2(m , -p^A,.)gZ, - l / 2 p ^ ^ Q r 4 ( V 6 ( Z + « ;")|z+«!
+ i / 3 ( z + i i ; - ’)|z+M‘->|-i/i20i/'> -w f ' i )
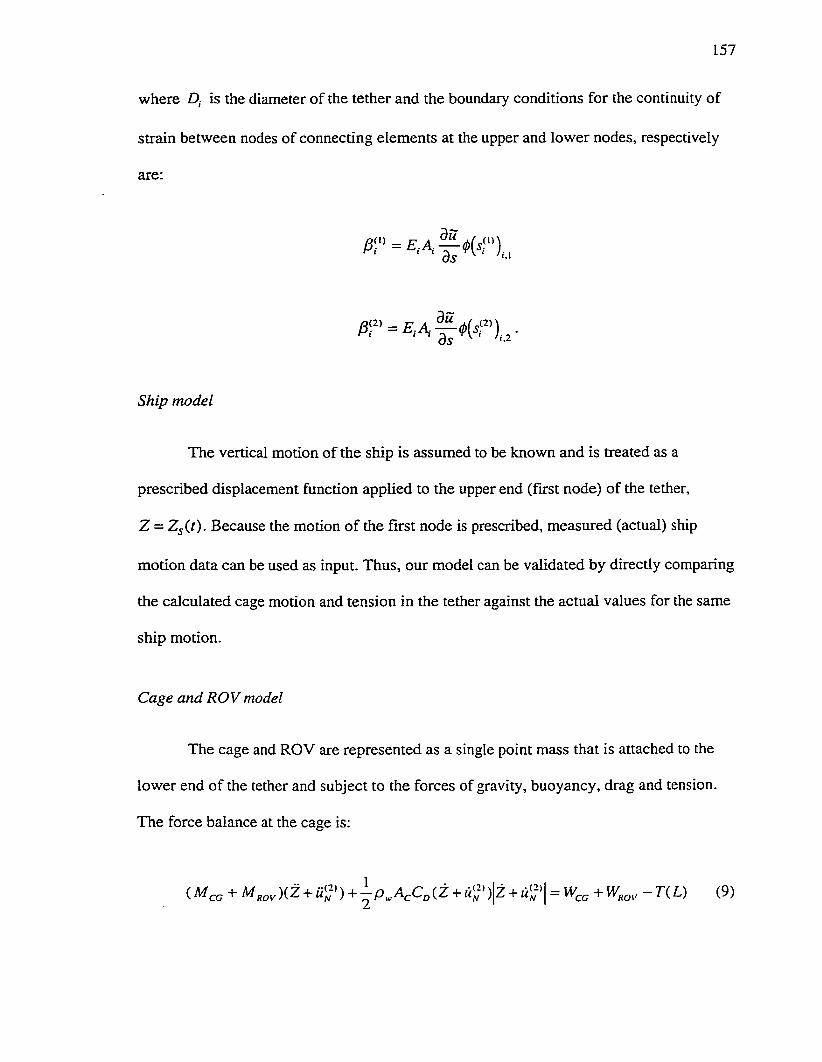
157
where D. is the diameter of the tether and the boundary conditions for the continuity of
strain between nodes of connecting elements at the upper and lower nodes, respectively
are:
Ship model
The vertical motion of the ship is assumed to be known and is treated as a
prescribed displacement function applied to the upper end (first node) of the tether,
Z = Z^(r). Because the motion of the first node is prescribed, measured (actual) ship
motion data can be used as input. Thus, our model can be validated by directly comparing
the calculated cage motion and tension in the tether against the actual values for the same
ship motion.
Cage and ROV model
The cage and ROV are represented as a single point mass that is attached to the
lower end of the tether and subject to the forces of gravity, buoyancy, drag and tension.
The force balance at the cage is:
( McG + )(Z + (Z + )|z + I = - r ( L) (9)
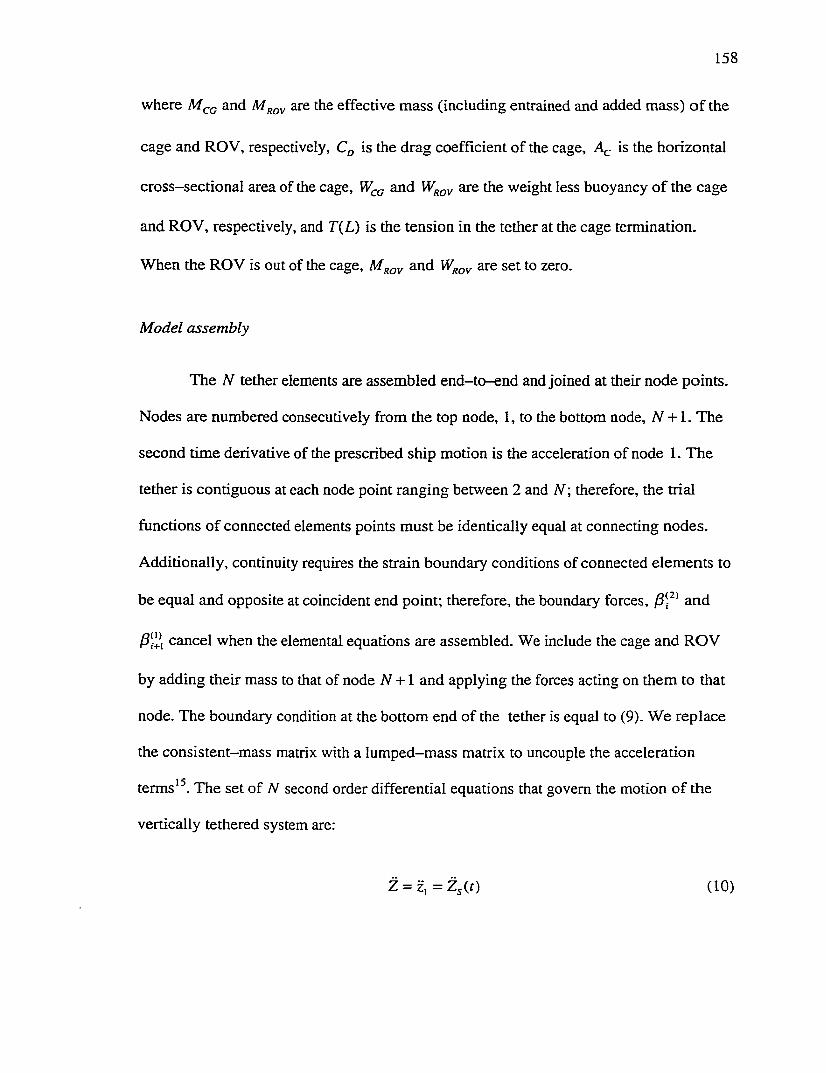
158
where M^c and are the effective mass (including entrained and added mass) o f the
cage and ROV, respectively, Cg is the drag coefficient of the cage, is the horizontal
cross-sectional area of the cage, and are the weight less buoyancy o f the cage
and ROV, respectively, and T{L) is the tension in the tether at the cage termination.
When the ROV is out of the cage, Af^gy and W gy are set to zero.
Model assembly
The N tether elements are assembled end-to-end and joined at their node points.
Nodes are numbered consecutively from the top node, 1, to the bottom node, N + 1. The
second time derivative of the prescribed ship motion is the acceleration of node 1. The
tether is contiguous at each node point ranging between 2 and N\ therefore, the trial
functions o f connected elements points must be identically equal at connecting nodes.
Additionally, continuity requires the strain boundary conditions of connected elements to
be equal and opposite at coincident end point; therefore, the boundary forces, and
cancel when the elemental equations are assembled. We include the cage and ROV
by adding their mass to that of node N + 1 and applying the forces acting on them to that
node. The boundary condition at the bottom end of the tether is equal to (9). We replace
the consistent-mass matrix with a lumped—mass matrix to uncouple the acceleration
terms'^. The set of N second order differential equations that govern the motion of the
vertically tethered system are:
Z = z, =Z^(r) (10)

Mz ■>rKu=f
where the lumped-mass matrix, M e is:
159
( 11)
M = - 2
'0 m,/j + m L, 0 0 00 0 rnj^ + m U, 0 0
0 0 0 00 0 0 0 Triff + 2M(-q + ZAfyggy
the stiffness matrix, K s , is:
K =
£iAi ^
k0
0
0
0
0
A
0
0
0
0
‘■W-1
'■N
0
0
E N N
the external force matrix, / e R , is:
f =
Æ , + / r
and the position, z e and displacement, u G vectors are, respectively:ATxl

1 6 0
Z =
’ Zt ' Z 0
Zz z + 4 " + z 4 ‘> z , - 4 ‘> -Z
Z3 z + j ( " + ( 4 " z 3 - 4 " - z: z u = ;
ZwJ-N+l
where and are zero.
Numerical implementation
The N second order differential equations given by (10) and (11) are rewritten as
2 N first order differential equations, thus allowing the use o f a conventional ODE
integration routine. We use a Runge-Kutta fourth-fifth order numerical integration
routine with adaptive step size which takes small time steps during periods of rapid
change and large time steps when changes are slow^^. This method provides good
accuracy with only moderate computational effort.
CALIBRATION
The utility of any dynamic model lies in its ability to accurately predict the
response to specified input. We collected data for the ROPOS ROV system while it
operated at depths of up to 1 730 m and use these data to accurately determine the
unknown coefficients, to verify manufacturer’s specifications and to validate our
numerical model. ROPOS is a large ROV that dives to 5 000 m, and is attached to the
cage by an umbilical tether. The cage itself weighs 49 000 N in air and has dimensions of
2.1 m X 3.4 m x 4.2 m (WLH) and is connected to the ship by a triple armoured tether

161
that is 0.03 m in diameter, 4 200 m long and weighs 30.5 Nm'^ in air. The motion was
measured at the ship's A-frame directly above the sheave that supports the tether (and
thus, at the first node), and at the cage. The tension in the tether was measured at the
sheave on the A-frame. For all measurements used, the ROV was out of the cage, and
thus, and W^^y are set to zero.
Values for most of the model’s coefficients are difficult to determine. The cage is
a three-dimensional bluff body with two planes of symmetry and complex geometry. Its
drag coefficient, Cp and added mass (included in M^c ) cannot be accurately determined
using empirical values of coefficients for bodies of simple geometry. The linear stiffness,
EA , of the tether is difficult to estimate because the tether consists of an inner core of
several different materials surrounded by layers of armour strands that are counter-
helically wound. Thus, we use experimental data to determine accurate values of the
coefficients.
We determined the weight less buoyancy of the tether, W (per unit length), and
cage, from a least-squares linear fit of tension to depth for the range of 218 to
1 730 m. Tether deployment was halted (steady length) for each measurement. The slope
W and offset (Table 1) agreed well with the manufacturer's specifications. The
mass of the tether is approximated by its dry mass plus the mass of the water entrained
into the void space between the strand of armour. The wet mass is 2% larger than the dry
mass (Table 1).
The mass and drag coefficients of the cage are determined by expressing (9) as:
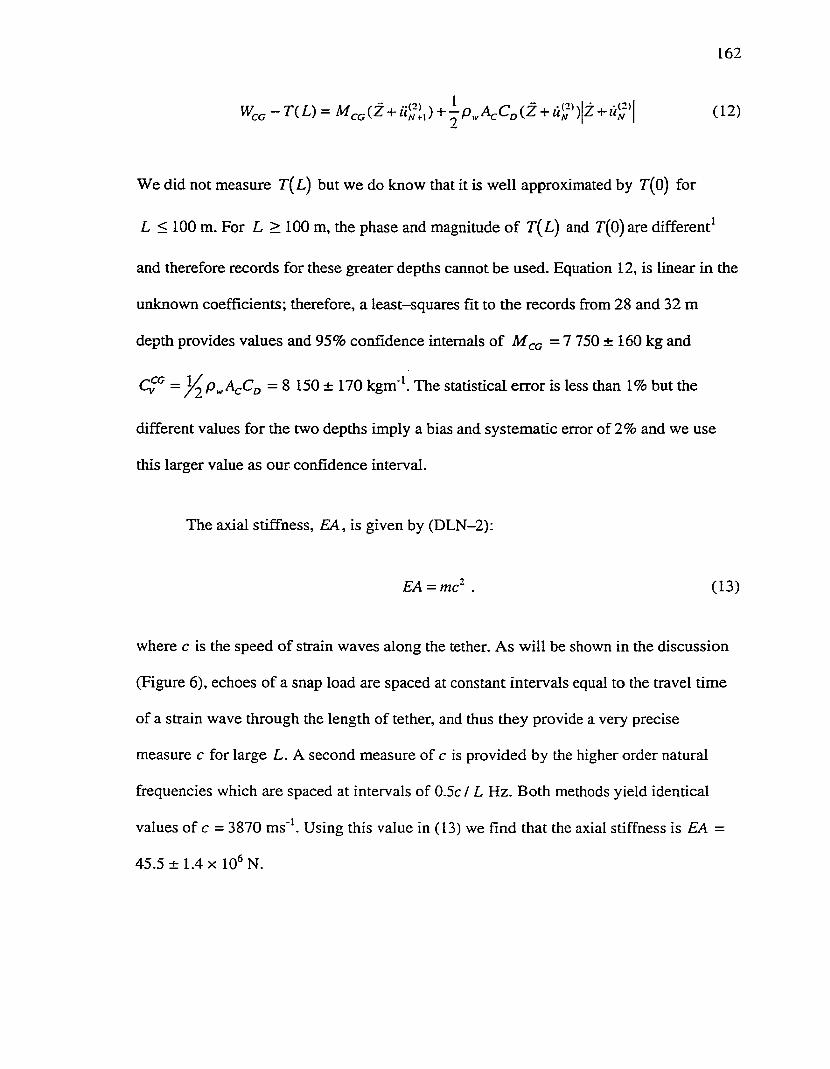
162
We did not measure 'T(L) but we do know that it is well approximated by T(0) for
L < 100 m. For L > 100 m, the phase and magnitude o f T(L) and T(0) are different^
and therefore records for these greater depths cannot be used. Equation 12, is linear in the
unknown coefficients; therefore, a least-squares fit to the records from 28 and 32 m
depth provides values and 95% confidence internals o f = 7 750 ± 160 kg and
Pw^c^D — 8 150 ± 170 k g m T h e statistical error is less than 1% but the
different values for the two depths imply a bias and systematic error of 2% and we use
this larger value as our confidence interval.
The axial stiffness, £A, is given by (DLN—2):
EA = m c - . (13)
where c is the speed of strain waves along the tether. As will be shown in the discussion
(Figure 6), echoes of a snap load are spaced at constant intervals equal to the travel time
of a strain wave through the length of tether, and thus they provide a very precise
measure c for large L. A second measure of c is provided by the higher order natural
frequencies which are spaced at intervals of 0.5c / L Hz. Both methods yield identical
values of c = 3870 ms"\ Using this value in (13) we find that the axial stiffness is EA =
45.5 ± 1.4 X 10 N.

163
VALIDATION
Our model is validated by directly comparing the real and simulated motion of the
cage and tension in the tether for the same forcing at the top node. We validated the
model for several depths, but for brevity we will focus on operation at 1 730 m.
Numerical results are calculated using 50 elements and the estimated coefficients
(Table 1). The motion of node 1 is prescribed by a 5 000 s time series of ship motion that
was not used to estimate the coefficients.
The model provides a very good approximation of the actual displacement of the
cage (Figure 2). The displacement of the cage is about 50% greater and lags behind that
o f the ship. This particular section of data has a large range o f amplitudes and includes a
snap load which starts at r = 627 s. The larger amplitudes are underestimated by the
model and the snap (sudden change of acceleration at the cage) was not reproduced.
Quantitatively, the standard deviation of the difference between the simulated and
measured position of the cage (tension at the ship) is =0.11 m ( = 4 000 N)
and the ratio of ( c r ^ ) to the rms of the measured values is 0.12 (0.28).
The spectra (the distribution of variance with frequency) o f the real and simulated
vertical cage acceleration are compared for the same 5 000 s record of ship motion
(Figure 3). The model with wake is addressed in the discussion. The frequency domain
analyses will focus on the wave-band that extends from 0.1 to 0.25 Hz because this band
contains 90% of the variance of ship motion. The real and simulated spectra agree well
within the wave-band at 1 730 m — the largest difference is 13% at 0.14 Hz and the

164
spectra are equal at 0.175 Hz. For L = 975 m (not shown) the real and simulated spectra
are almost identical and the largest difference is only 7% at 0.14 Hz. Above 1 Hz,
significant excitation is only produced by the impulsive snap loads and no wave
excitation is transferred to the tether because the large inertia and length of the ship low -
pass filter the short (high-frequency) waves.
The cage is a bluff body, subject to quadratic drag, and thus produces variance at
odd harmonics of the fundamental frequency of excitation, 0.15 Hz (the peak of the
spectrum in Figure 3). The third and fifth harmonics are evident at 0.44 and 0.73 Hz
(Figure 3). Our model over predicts the variance at those frequencies; however, the
system remains weakly non-linear* because the harmonics only contributed a small
fi-action to the total variance. For example, at 1 730 m, the variance at the harmonics
provided only 4.6 and 0.3% of the total variance of the cage acceleration.
The transfer function estimate (TFE) provides a measure of the motion
amplification and phase difference between the ship and cage and it is estimated using:
where C^s^c is the cross-spectrum of ship>-displacement, , and cage-displacement,
, and C s- s is the auto-spectrum of . We restrict our analysis of the TFE to the
wave-band (0.1 - 0.25 Hz) because the error in the real TFE is large and the modelled
cage response is not significant at higher frequencies. At 1 730 m, agreement between the
real and simulated TFE is good up to 0.2 Hz at 1 730 m and the largest difference in

165
magnitude is only 8% at 0.13 Hz. The model over predicts the cage response at the higher
frequencies within the wave. The simulated phase is always slightly larger than the real
phase and the maximum difference is 15° at 0.2 Hz (near the middle o f the wave-band).
These discrepancies are attributed, in part, to the assumption of a constant drag
coefficient and a constant added mass of the cage which is not completely accurate for
oscillatory flow around a bluff body. This issue is addressed in the discussion. At 975 m,
the magnitude and phase of the TFE agree exceptionally well — the largest differences
are 0.05 (4%) at 0.19 Hz and 10° at 0.25 Hz.
The depth dependent natural frequencies, /„ , provide another characteristic to
validate our model. The predicted and observed first natural frequency (indicated by the
first 90° phase shift o f (Figure 4)) agree within 7%. Although very little excitation
occurs above 1 Hz, the model exactly predicts the second, third, and fourth natural
frequencies at 1.17, 2.24 and 3.36 Hz (Figure 3).
SENSITIVITY
During the design process, the model coefficients are not accurately known;
therefore, our model output must be reasonably insensitive to variations of its coefficients
to be a useful design tool. Nine coefficients are used in our model: N , L, , m, Cy°,
C^T ’ ^cc ^ ’ and EA where L is the deployed length of tether. The tether drag can be
ignored because the ratio of tether—to—cage drag is 0.06. Gravitational and buoyancy
forces only affect the static solution, and the dynamic response of the system in the
wave-band is independent of the number of elements used when N >5 (this will be

1 6 6
addressed in the Discussion). Thus, only five coefficients affect the dynamic response of
the model: L, , m, and EA. In previous work^ we have shown that the non-
dimensional transfer function between ship and cage motion is only a function of two
non-dimensional parameters, namely:
Mcame ’ mL
when the frequency is non-dimensionalized with:
, _ , m LCÜ = L J ---- (Ü = —C l )
EA c
where co' is the non-dimensional frequency. Therefore, there are only three independent
parameters that characterise the dimensional response and we only need to examine the
dependence of the model on Cy^, , and EA. We do this by calculating ± e relative
changes in the magnitude and the absolute changes of the phase o f the transfer function
between vertical motions of the ship and cage for variations of Cy^, , and EA, o f
± 15% about their nominal values (Figures 5). The sensitivities of the TFE to EA look
similar to those of but the magnitude and phase do not scale. The dotted line is the
difference between the real and calculated TFE (using the nominal coefficient values) and
is addressed in the Discussion.
In the mid to upper wave band (0.15 < f < 0.25 Hz), the changes in the TFE are,
at most, o f the same order as the changes in the coefficients and the magnitude is most

167
sensitive to while the phase is most sensitive to EA.. In the lower wave-band, ( / <
0.15 Hz) the magnitude and phase o f are not sensitive to of EA, , and Cy^.
Therefore, reasonably accurate predictions of the magnitude and phase of the transfer
function can be obtained using “rough” estimates of EA, M(-g , and As in our
continuous model'*, the sensitivities o f the phase are zero at 0.25 Hz (0.22 Hz in'*) and the
phase is independent of ; and between 0.22 and 0.23 Hz (0.21 and 0.23 in'*) the
magnitude of is only slightly sensitive to variations in Also notable is that the
signs of the sensitivities are preserved between our continuous and finite-element
models.
The bounds of uncertainty for the estimated values of , Cy^ and EA are less
than 5% and thus all their probable values are contained within the ±15% sensitivities. At
most frequencies in the wave-band, the difference between the real and calculated TFE
(the dotted line in Figure 5) is much larger than the ±15% sensitivities; therefore, the
model results cannot be significantly improved with realistic changes in , Cy'^ and
E A . Additionally, because the sensitivities change sign (either in magnitude and phase) at
different frequencies (not coincident with the error) we cannot expect that changes in
M cc, Cy'^ and EA will improve the predictions at all frequencies within the wave-band.
DISCUSSION
Calculations were significantly reduced by replacing the consistent—mass matrix
with the lumped-mass matrix which uncouples the acceleration terms in the elemental
equations. We also calculated the motion of the cage and tension at the ship using the
168
consistent-mass representation with 50 elements and the same 5 000 s record o f ship
motion. Results from the two representations are identical. Noticeable differences only
occur when a small number of elements (< 5) is used. For example, predictions o f the
second harmonic of the natural frequency differ by 0.26 and 0.06 Hz for a two element
and a three element model, respectively.
The run time of our simulation increases quadratically with the number of
elements and, therefore, we want to use as few elements as possible. In our model, the
mass of each element is “lumped” at its nodes and, as a result, the mass distribution and
(therefore) the accuracy of the static results increases with increasing elements. However,
the dynamic motion of the cage and tension at the ship were found to be nearly
independent of the number of elements for predictions within the wave-band. Thus, the
practical considerations for the lower bound of N are as follows. The prediction of zero
tension (snap loads) depends on the total (static + dynamic) tension in the tether and,
therefore, a fine element break-up is required. An ^/-element model can only predict up
to A natural frequencies and the accuracy of the predicted values increases by increasing
N.
We have characterized the hydrodynamic forces on the cage in terms o f a drag
coefficient multiplied by the speed and velocity. Although this formulation is common
practice, there are several reasons to be suspicious. The velocity of the cage is unsteady
and it is both positive and negative. For steady external (far from the body) flows, the
drag coefficient changes with changing speed because of variations in the point of
boundary layer separation and the pattern of recirculation over the body and in its wake.
169
The boundary layer and wake of an accelerating body that has reached a given speed are
never the same as those over the same but non-accelerating body at that speed. In
addition, the boundary layer during acceleration is not the same as during deceleration
(for the same speed). The motion history becomes an important factor in determining the
drag forces on the body. These and many other aspects of unsteady flow past bluff bodies
(mainly cylinders) are discussed in Sarpkaya and Isaacson*^.
The inertial forces on the cage have been represented by its acceleration
multiplied by its effective mass. This, too, is common practice but this formulation
obscures the physics of unsteady flow around bluff bodies and only makes sense if the
relative rate of change of velocity is small and the drag coefficient is not sensitive to
small changes in Reynolds number. The notion of added mass becomes simplistic when
the relative change of velocity is large and when the velocity changes direction because
the history of the flow becomes important. For example, the added mass can momentarily
become negative when vortices detach from the body during acceleration and very large
when they reattach during deceleration. A key parameter of oscillatory flow is the ratio of
amplitude of travel to the length scale of the body and this ratio was always less than 0.6
for the cage examined here. In this parameter range, the notion of added mass is
reasonable for cylinders and the good predictions of the discrete model indicate that this
notion is also judicious for the ROPOS cage. The concept of an added mass will be less
effective for larger ratios of amplitude to length scale. Thus, we cannot expect
hydrodynamic forces on the cage to be represented, with complete accuracy, by a single
drag coefficient and a single added mass.

170
The sensitivity analysis indicates that differences between measured and modeled
motions cannot be explained by parameter uncertainty. The differences may be due to the
limitations o f the concept o f single drag coefficient and a single added mass. To test this
notion, we added a simple wake model that makes some account o f the history of motion.
Our objective is to motivate additional work on the unsteady forces on bluff bodies
attached to tethers rather than to promote this particular model. We assume that, at each
time step, the water directly behind the cage (on its lea side) has the same velocity as the
cage. We track the position of these water parcels and assume that their momentum
decays exponentially with time. When a water parcel overtakes the cage (typically when
the cage decelerates) we add an additional force to the lea side that is proportional to the
velocity difference between the cage and this parcel. The decay time for momentum is
2.9 s and was chosen by trial and error. The corresponding length scale is 2.9 m for
typical speeds and is comparable to both the height of the cage and the maximum
amplitude of motion.
Including the wake model significantly improves the results of our model for
operation at 1 730 m. The standard deviation of the difference between the calculated and
measured position of the cage (tension in the tether) is improved by a factor o f 1.6 (1.8)
and it is = 0.07 m ( = 2 200 N) vs 0.11 m (4 000 N) for the model without
wake. The new ratio o f c r ^ ( ) to the rms of the measured values is 0.08 (0.16)
(Figure 3). The calculated and real spectrum and transfer function (both magnitude and
phase) between ship and cage motion are nearly identical, and the agreement in the upper
wave-band is notably improved (Figure 3). The error in the magnitude (phase) of the
171
TFE is reduced from 0.12 (15°) to 0.07 (7°), respectively. Surprisingly, addition o f the
wake model reduces the non-linearity of the predicted response and brings the predicted
spectrum of acceleration at the third and fifth harmonic of the fundamental frequency of
excitation into close agreement with the measured spectrum. Similar improvements were
found for an operation depth of L = 975 m.
Motion during a snap load is non-linear and different from that during normal
operation. Large and rapid downward displacements o f the ship produce slack tether at
the cage. A snap load results when the tether is re-tensioned because the velocities o f the
tether and cage are different. The induced strain wave travels along the tether with speed
c and it is reflected at its ends (the ship and cage). This results in a series of rapid
changes of cage acceleration (jerks) and tension at the ship and these changes are spaced
at intervals equal to the round trip travel time of strain waves'.
Snap loads occurred in less than 1% of the motion cycles in the 5 000 s record we
used to validate our model. Such threshold conditions are very difficult to predict because
they require the numerical model to be very precise. Without the wake model, our
simulation underestimated the large displacement and did not reproduce the slack tether
— the minimum tension was 10 000 N. With the inclusion of the wake model, the
calculated motion only slightly underestimated the large vertical displacement and the
tension in the tether at the cage approached zero. However, zero tension was still not
achieved and snap loads were not predicted. Therefore we increased the ship motion by
10% so that slack tether would result and we could investigate the response of our model
to this condition. Under these conditions, our model reproduced the observed snap loads
172
and the associated acceleration and tension profiles (Figure 6). The rapid changes of
acceleration and tension aligned with the measured values and agreed in magnitude. Most
notable is that the slope of the real and calculated acceleration is nearly identical at the
first jerk. We therefore conclude that our discrete model inherently has the ability to
produce characteristics associated with snap loads. A more realistic representation of the
drag and added mass could improve the prediction of slack tether so that threshold
conditions of snap loading could be better predicted.
CONCLUSIONS
We developed a one-dimensional finite-element lumped-mass model of a caged
remotely operated vehicle system using a coupled set of reference and elastic co
ordinates. The elastic displacements were approximated with a linear trial solution. Using
Galerkin’s method, we discretised the equation for the balance of forces at any point in
the tether and assembled the resulting elemental equations to obtain the finite-element
equations of motion for the system. The resulting model is a function of only nine
coefficients;iV, L, M^.^, m , Cp-j., W , and EA, when tether has constant
properties along its length.
Values of the model coefficients were estimated using motion and tension
measurements o f the ROPOS ROV system. Although many of the coefficients are readily
estimated, it is very difficult to determine accurate values of the mass, M(-c, and drag
coefficient, , of the cage and the stiffness of the tether, E A . A least-squares method
was used to determine values for and to an accuracy of 2% of their real values.
173
The stiffness, EA, was determined to 3% accuracy using the speed of tensile waves in the
tether, c, which was estimated from the time of successive tension maxima during a snap
load. These methods are useful because they only used data acquired during normal
operation of the ROV system and did not require any special procedures.
We prescribed the vertical motion of the top node using measurements of ship
motion and validated our model by comparing the output against the corresponding
measurements of cage motion and tension at the ship. Our model accurately predicts a)
the motion o f the cage and the tension in the tether, b) the spectrum of cage acceleration
in the wave-band, c) the transfer function between the vertical motion of the ship and
cage, and d) the natural frequency and harmonics of the system.
Sensitivities to the three independent parameters of the model indicate that the
mismatch between the simulated and real motion cannot be significantly improved by
adjusting the values of those parameters. However, inclusion of a simple wake model
improved the agreement between the real and calculated results by almost a factor of 2.
Eight snap loads also occurred in the measurements used to validate our model; however,
these were only threshold occurrences. Using the wake model and increasing the ship
motion by 10%, our model predicted the observed snap loads and accurately reproduced
their characteristics — rapid increases in the acceleration/tension record that are spaced at
regular intervals equal to the travel time of the strain wave along the length of deployed
tether.
174
ACKNOWLEDGEMENTS
We would like to thank Jim McFarlane and the staff of International Submarine
Engineering (ISE) for their continual support and assistance in this project. We would
also like to thank Inna Sharf for sharing her expertise in finite-element modelling and
Nedjib Djilali for sharing his expertise in fluid dynamics. F.R. Driscoll was financially
supported by scholarships from the Natural Science and Engineering Research Council
(NSERC), the Science Council of British Columbia (SCBC) and ISE. This work was
partially supported by the US Office o f Naval Research under contract N00014-93-1-
0362 and NSERC .
REFERENCES
1. Driscoll F.R., Lueck R.G. and Nahon N., The motion of a deep-sea remotely
operated vehicle system. Part 1 : motion observations. Ocean Engineering, in press,
(1999).
2. Hover, F.S., Grosenbaugh, M.A., and Triantafyllou, M.S., Calculation of dynamic
motions and tensions in towed underwater cables. IEEE Journal o f Oceanic
Engineering, 19 (1994), 449-457.
3. Grosenbaugh, M.A. On the dynamics of oceanographic surface moorings. Ocean
Engineering, 32 (1996) 7-25.
4. Driscoll F.R., Lueck R.G. and Nahon N., The motion of a deep-sea remotely
operated vehicle system. Part 2: analytic model. Ocean Engineering, in press,
(1999).
175
5. Caughey, T.K., Equivalent linearization techniques. Journal o f the Acoustic Society
o f America, 35 (1963) 1706-1711.
6. Niedzwecki, J.M. and Thampi, S.K., Snap loading of marine cable systems. Applied
Ocean Research, 13 (1991) 210—218.
7. Yoerger, D.R. Grosenbaugh, M.A. Triantafyllou M.S. and Burgess, J.J., Drag forces
and flow-induced vibrations of a long vertical tow cable — Part 1 : steady—stead
towing conditions. Journal o f Offshore Mechanics and Arctic Engineering, 113
(1991)117-127.
8. Hover, F.S. and Yoerger, D.R., Identification of low-order dynamics models for
deeply towed underwater vehicle systems. International Journal o f Offshore and
Polar Engineering, 2 (1992) 38-45.
9. Ablow, C.M. and Schechter, S. 1983, Numerical simulation of undersea cable
dynamics. Ocean Engineering, 10 (1983) 443-457.
10. Newman, J.N., Marine Hydrodynamics, The MIT Press, Cambridge Massachusetts,
1989.
11. Sparks, C.P., The influence of tension, pressure and weight on pipe and riser
deformations and stresses. Transactions o f the ASME, 106 (1984) 46-54.
12. Folb, R. and Nelligan, J.J., Hydrodynamic Loading on Armoured Towcables,
DTNSRDC report 82/116, 1983.
176
13. Shabana, A.A., Dynamics o f Multibody Systems, John Wiley & Sons, New York,
1989. pp. 470
14. Burnett, D.S., Finite Element Analysis From Concepts to Applications, Addison-
Wesley Publishing Company, Don Mills, Ontario, 1987. pp. 844
15. Logan, D.L., A First Course in the Finite Element Method, PWS-KENT Publishing
Company, Boston, 1992, pp. 662
16. Press,W.H., Teukolsky, S.A., Vetterling, W.T. and Flannery, B.P., Numerical
recipes in C, second edition, Cambridge University Press, Cambridge, 1992.
17. Sarpkaya, T. and M. Isaacson, 1981, Mechanics o f wave forces on offshore
structures. Van Nostrand Reinhold, New York, pp. 651
18 Robigou, V., Journal o f Geophysical Research Letters, 20 (1993), Cover Page
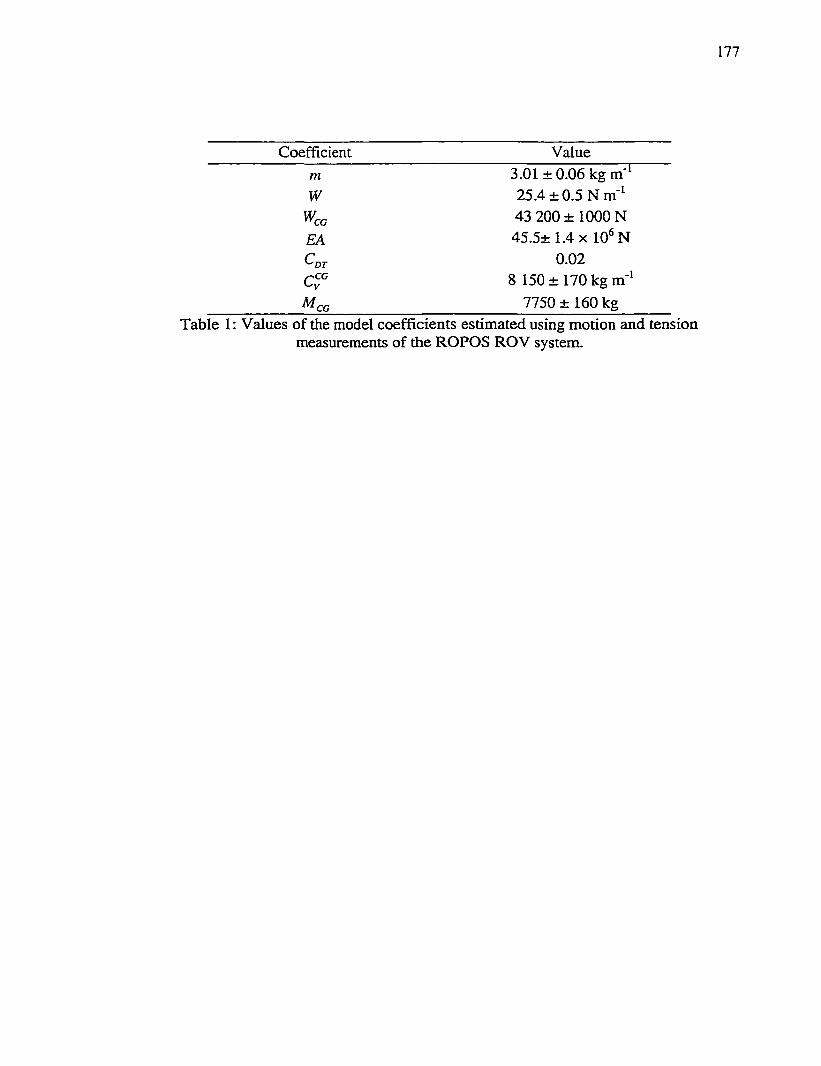
177
Coefficient Valuem 3.01 ±0.06 kg m‘‘W 25.4 ± 0.5 Nm'^
^ca 43 200 ± 1000 NEA 45.5± 1.4 X 10® N(-or 0.02^CG 8 150 ± 170 kg m'^
^CG 7750 ± 160 kgTable 1: Values of the model coefficients estimated using motion and tension
measurements of the ROPOS ROV system.

178
Fig 1. Diagrammatic representation of the ROPOS ROV system consisting o f a support ship (C.S.S. John P. Tally), winch, umbilical tether, cage and vehicle. ROPOS is investigating the actively-venting sulfide structure Godzilla*^
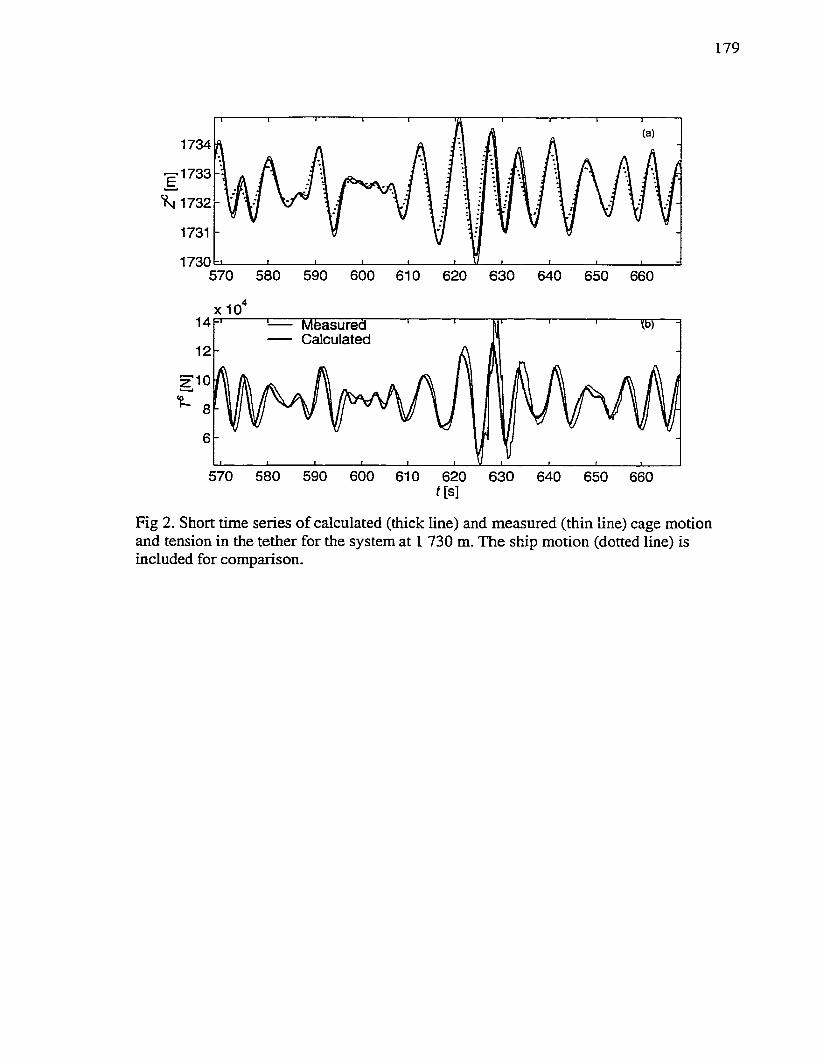
179
1734
1731
1730570 580 590 600 610 620 630 640 650 660
xIO14F '----- M ëasured
Calculated12
570 580 590 600 610 620 630 640 650 660f[s]
Fig 2. Short time series of calculated (thick line) and measured (thin line) cage motion and tension in the tether for the system at I 730 m. The ship motion (dotted line) is included for comparison.

180
10
-210CVJ
E
oW ave Band
M easured
Model without wake10
Model with wake,0•1 1010
f[Hz]
Fig. 3. Spectra of actual (thin solid line) and model calculated (dotted line - without wake, thick solid line — with wake) vertical acceleration records of the cage at a depth of 1 730 m. The arrows are the 3rd and 5th harmonic of the peak cage motion and the natural frequency.

1 8 1
(a) -
W ave Band0.5
0.05 0.3 0.350.1 0.15 0.2 0.25 0.4
5^-0.25* * Measured
Model without wake Model with wake-0.75
0.05 0.1 0.15 0.2 0.25 0.3 0.35 0.4
Fig. 4. Magnitude (a) and phase (b) of the actual (stars) and calculated (dotted hne - without wake, solid line — with wake) transfer function estimate between the ship and cage motion at a depth of 1 730 m.

1 8 2
+ 15% - 15%20
T3
CO
OO0 0.05 0.1 0.15 0.2 0.25 0.3 0.35
0.1 — +/-15% EA — +/— 15% M
- + / - 15%g 0.05 •
J .-0 .0 5
- 0.10.15 0.25 0.3 0.350.05 0.1 0.2
f[Hz]
Fig. 5. Sensitivities of the magnitude (a) and the phase (b) o f the transfer function between ship and cage motion to changes in (thin solid line), (dashed line), and EA (thick solid line) for operating depth of 1 730. The dotted line is the difference between the actual and simulated TFE.
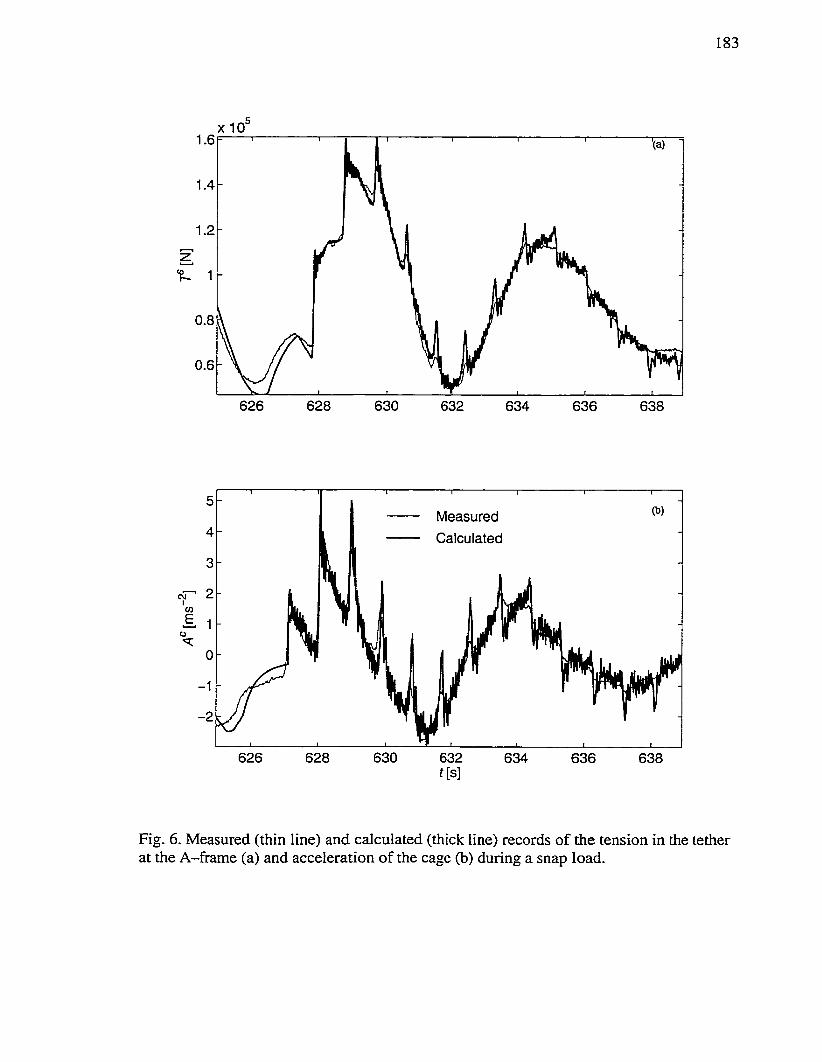
183
xIO
1.4
1.2
z
0.8
0.6
626 628 630 632 634 636 638
MeasuredCalculated
630 632 634 636
Fig. 6. Measured (thin line) and calculated (thick line) records o f the tension in the tether at the A-frame (a) and acceleration of the cage (b) during a snap load.
184
Appendix D
A Comparison of Ship-Mounted and Cage—Mounted Passive Heave Compensation
Systems
185
A Comparison of Ship—Mounted and Cage—Mounted Passive Heave Compensation Systems
Frederick R. Driscoll
Department o f Mechanical Engineering and School o f Earth and Ocean Sciences, University o f Victoria, P.O. Box 3055, Victoria, British Columbia, V8W 3P6, Canada, tel: (250) 721-6080, fa x: (250) 721-6051, [email protected]
Meyer Nation
Department o f Mechanical Engineering, University o f Victoria, Victoria,, P.O. Box 3055, Victoria, British Columbia, V8W 3P6, Canada, tel: (250) 721-6040, fax: (250) 721-6051, [email protected]
Rolf G. Lueck
Centre fo r Earth and Ocean Research, University o f Victoria,, P.O. Box 3055, Victoria, British Columbia, V8W 3P6, Canada, tel: (250) 721-8918, fax: (250) 721-6195, [email protected]
(Submitted to the Journal ofOjfshore Mechanics and Arctic Engineering)
Tethered marine systems experience large tensile loads in their tether when operating in
rough seas. Heave compensation systems can be used to reduce these loads and increase
the safe operating sea states. In this work, a discrete representation of a passive heave
compensator is developed and added to a finite-element model o f a deep sea ROV system
to investigate the performance o f ship-mounted and cage—mounted compensation systems.
Numerical simulations are performed for operating depths ranging from 3 280 to 16 400 f t
(I 000 to 5 000 m) and a range of compensator stiffnesses. Both ship and cage—mounted
systems reduced the natural frequencies, rms cage motion and rms tension, and extended
the operating sea state o f the ROV. During e.xtreme seas, the cage—mounted compensator
eliminated all snap loads. However, the compensator’s characteristics must be carefidly
chosen because a poorly designed compensator can e.xacerbate operational problems.

1 8 6
1 Introduction
A remotely operated vehicle (ROV) can remain at its underwater work site
indefinitely and can effectively and interactively accomplish tasks in dangerous
environments while its human operators remain safely onboard the support ship. These
advantages over autonomous underwater vehicles and manned submersibles are possible
because an umbilical cable connects the ROV to the support ship. Typical tethers consist
o f outer layers o f steel or kevlar armour that house an inner core of electrical and optical
conductors that are used to power and communicate with the ROV. Operation in rough
seas results in slack cable and snap loading which can damage the tether’s structural
armour and its internal conductors. This degradation reduces the life of the cable and
endangers the recovery of the ROV (Driscoll et al., 1999a and Niedzwecki and Thampi,
1991) and it interrupts communication and power which renders the vehicle inoperable.
When caged (or clumped mass) ROV systems operate in rough seas, large vertical
displacements of the cage can occur. In most cases, the ROV is attached to the cage by a
slack neutrally buoyant tether, and it remains vertically stationary in the water while the
cage oscillates. This makes docking difficult, if not impossible. If the cage and vehicle
collide during a docking attempt, structural damage can result to both units. In this paper
we investigate the ability of two different systems to alleviate these problems: a sem i-
active ship—mounted and a passive cage-mounted compensation system.
The operational problems of deep-sea ROV systems in rough seas are dangerous
and expensive. Thus, any heave compensation system which could alleviate these
problems would be of great benefit. For example, during an experiment in which we

187
measured the ship and cage motion and the tension in the tether to validate our numerical
model (Driscoll et al, 1999a), the system operation was severely limited by rough
weather. In particular, during a two week interval at sea only five hours of useful
operation were logged; the main umbilical tether had to be re-terminated because the
optical conductors were broken by many snap loads; and the tether connecting the cage
and ROV was sheared during a docking attempt due to the large vertical motion of the
cage. In subsequent analysis, we determined that this uncompensated deep-sea ROV was
in resonance at depths greater than 4750 ft (1450 m) and the resulting cage motion was
greater than that o f the ship (Driscoll et al. 1999a and 1999b). Ideally, an effective heave
compensation device should reduce the vertical motion of the cage to make docking of
the ROV easier, eliminate snap loading and decrease the rms and peak tension in the
tether. If these benefits are achieved, heave compensation will increase the operating
range and operating life of the ROV system.
Much effort has been focussed on the effective design of actively controlled heave
compensation systems to reduce the heave motion and dynamic tension of drill string and
tethered systems (Korde, 1998, Kerstein, 1986, Bennet and Forex, 1997 and Gaddy,
1997). For active systems to work well, the dynamic characteristics o f the overboard
system must be well known to chose appropriate values o f the depth dependant gains.
Additionally, active systems are complex and require significant support equipment.
Recently, a few works have looked at passive ship-mounted heave compensation systems
because of their simplicity. Both Hover et al. (1994) and Niedzwecki and Thampi (1988)
presented excellent analyses of passive systems. Hover investigated a ship-mounted
system for a deeply towed body by varying the values of the compensator’s linear
188
stiffness and damping over a range of sea states at a single operating depth. Niedzwecki
and Thampi used a lumped parameter model to investigate a ship-mounted pneumatic
system with linear stiffness for a large hard rock drilling base suspended by a series o f
drill strings. In both of these works, the authors found that appropriate values of
compensator stiffness must be chosen or the motion and tension at the end of tether may
be increased in specific sea states. The potential benefits o f a system mounted on the
undersea platform have been overlooked and we did not find any work that investigates
the effectiveness of a cage mounted system.
In this paper, a lumped parameter heave compensation element is developed and
included in our existing finite-element lumped-mass model (Driscoll et al., 1999c) to
investigate the effectiveness o f ship-mounted and cage-m ounted pneumatic heave
compensation systems. A passive design is used at the cage; while a semi-active design
is needed at the ship to adjust for the depth dependent static tension in the tether. We
investigate the attenuation of the cage motion and tension in the tether (at the A-frame)
for a range of operating depths and compensator travel.
2 Design of heave compensators
ROVs are sophisticated multifaceted systems and a heave compensation system
would add an additional level o f complexity. To minimise this, we focussed our analysis
on a passive design because o f its simplicity. Passive systems are virtually autonomous
requiring little, if any, external support. They have few components, all of which are
relatively simple and easy to maintain. By comparison, semi—active and actively
controlled systems must be supported by external equipment including computers.

189
sensors, data acquisition systems, motors, compressors, and hydraulic systems and may
also require human intervention. Because of their complexity, these systems can be
expensive and difficult to maintain.
The overboard weight less buoyancy of an ROV system can increase by several
times between surface and its maximum depth of operation (e.g. by a factor of 4 for the
ROPOS ROV system (Remotely Operated Platform for Oceanographic Science) an
International Submarine Engineering Hysub 5000, ISE 1998). Therefore, a ship-mounted
system must be strong and it must compensate for the changing weight less buoyancy of
the overboard system using some level of active control. By contrast, a cage-mounted
compensator only supports the weight less buoyancy of the cage and it can be completely
passive because the static tension at the cage termination is constant. Thus, if a cage-
mounted system is effective, it is a desirable alternative to a ship-mounted heave
compensation system.
For this investigation, we chose a ram-tensioner utilising a pneumatic spring as
our heave compensation mechanism (Fig. 1). On the high pressure side, the spring is
connected to a constant volume accumulator and the low pressure side is evacuated. The
unequal pressure acting on the opposing faces of the piston creates a force that balances
the inertial, hydrodynamic and gravitational forces of the supported system. In static
equilibrium, the piston is stationary, approximately mid way between its end stops. When
the ship heaves up (down), tension in the tether increases (decreases) and the piston
moves toward the high (low) pressure end which increases (decreases) the pressure and
feeds tether out (in). This has two benefits: it reduces the motion of the supported system

190
and thereby, the dynamic loading (inertial and hydrodynamic forces) in the tether is also
reduced. The end stops (not shown in Fig. 1) are large springs of equal stiffness and when
the compensator is fully retracted, the outer spring brings the tension to zero. A linear
damping mechanism is also used in conjunction with the pneumatic spring.
The tension-displacement curves of the pneumatic spring are determined by
modelling the thermodynamic compression and expansion. The pneumatic spring cycles
at wave frequencies (0.1 to 0.25 Hz) and the gas temperature only changes by 10% over
ambient for the maximum change in volume investigated. Thus, the operation of the
spring is well approximated by an adiabatic relationship because compression and
expansion are fast enough that heat transfer is negligible. The irreversible (friction)-to-
reversible work ratio is very small — 1:200 for a typical cycle and the spring is
considered to be isentropic. Thus, the thermodynamic relationship governing the
compression and expansion of our pneumatic spring, using an ideal gas, is (Moran and
Shapiro, Chapter 6, 1992):
p y = constant (1)
where P is the pressure, V is the volume of the gas contained in the spring, and n is the
ratio of specific heats of the gas. An accumulator is used to increase the volume of the
system in order to obtain the desired tension-displacement characteristics of the spring.
Its volume is determined by specifying the tension range of the compensator. If we
specify the median tension to be the supported weight, Vfy, and the extreme tension just
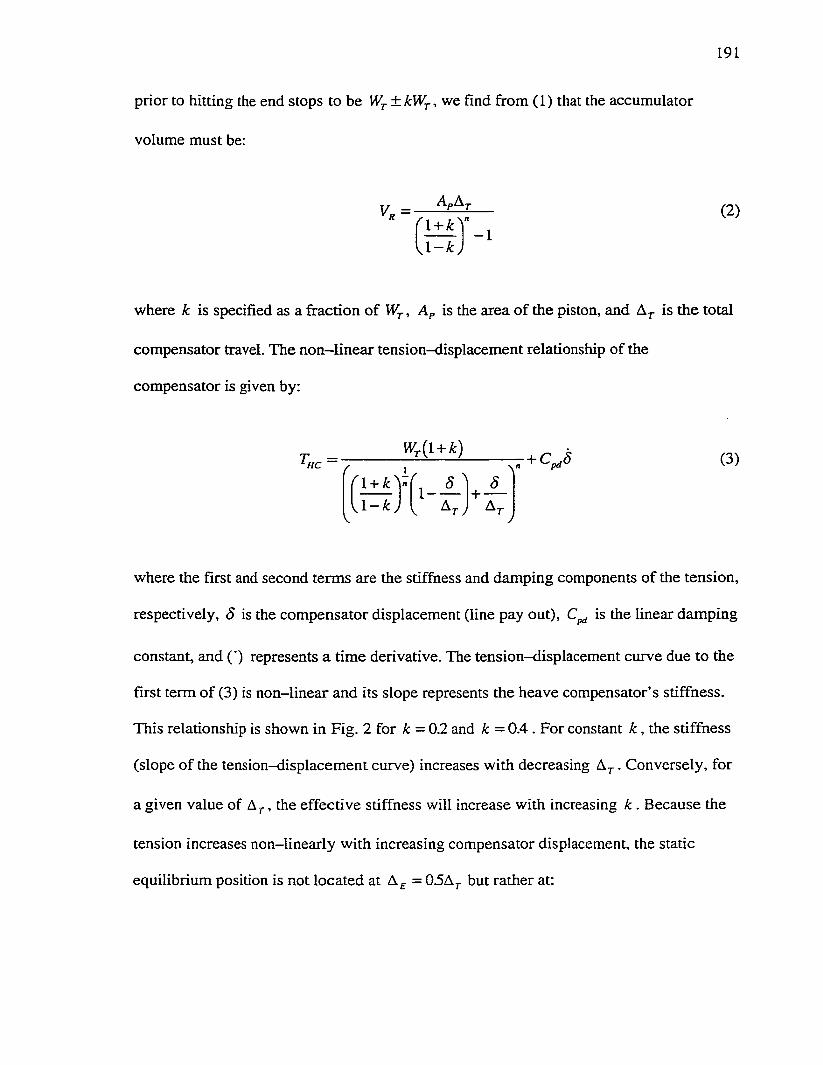
191
prior to hitting the end stops to be WÇ ±ÆWÇ, we find from (1) that the accumulator
volume must be:
_l + k X
. i - l c )
(2)- 1
where k is specified as a fraction of Ap is the area of the piston, and is the total
compensator travel. The non-linear tension-displacement relationship of the
compensator is given by:
W^(l + A:)/ 1 ,
l + fcV^l - k ,
(3)
1 -
where the first and second terms are the stiffness and damping components of the tension,
respectively, 5 is the compensator displacement (line pay out), is the linear damping
constant, and (') represents a time derivative. The tension-displacement curve due to the
first term of (3) is non-linear and its slope represents the heave compensator’s stiffness.
This relationship is shown in Fig. 2 for A: = 0.2 and k = 0.4 . For constant k , the stiffness
(slope of the tension-displacement curve) increases with decreasing . Conversely, for
a given value of A^, the effective stiffness will increase with increasing k . Because the
tension increases non-linearly with increasing compensator displacement, the static
equilibrium position is not located at A^ = 0 5 but rather at:

192
(4)
V
For example, we find that if = 0.4 and n = 1.4, then = 0.67Ay. The system
pressure at static equilibrium is determined by = ApWÇ.
3 Dynamics Simulation
In previous work, we developed a finite-element lumped-mass model o f an ROV
system without heave compensation (Driscoll et al., 1999c) and it was validated against
experimental measurements. For example. Fig. 3 shows a comparison o f model and
experimental results for the vertical position o f the cage and the tension in the tether at
the ship. Thus, we only provide here a brief overview of that model. The model is
developed using a single inertial reference frame located at ± e mean sea surface, with
downward displacements defined as positive. The vertical motion of the A—frame is
assumed to be known and is modelled as a prescribed displacement function applied to
the upper end of the tether. The tether is broken down into several visco—elastic elements
which are connected at their node points (end points. Fig. 4). The mass (including
entrained water) of each element is “lumped” equally at its node points. Applied at each
node are the forces due to the viscous drag, internal strain, internal damping, weight, and
buoyancy that act on/in the connecting elements. The tension-strain relationship of each
element is assumed to be linear. The first node of the cable is attached to the A—frame
and its motion is therefore prescribed. The cage is modelled as a point mass attached to
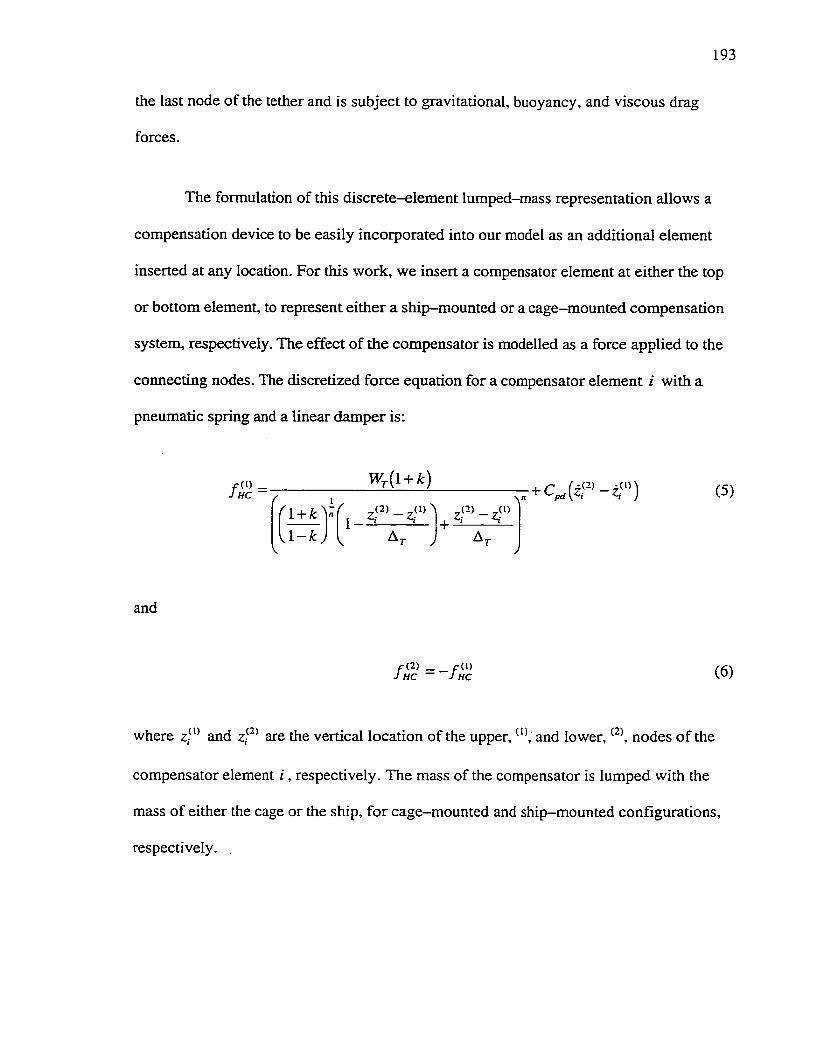
193
the last node of ± e tether and is subject to gravitational, buoyancy, and viscous drag
forces.
The formulation of this discrete-element lumped-mass representation allows a
compensation device to be easily incorporated into our model as an additional element
inserted at any location. For this work, we insert a compensator element at either the top
or bottom element, to represent either a ship-mounted or a cage-mounted compensation
system, respectively. The effect of the compensator is modelled as a force applied to the
connecting nodes. The discretized force equation for a compensator element i with a
pneumatic spring and a linear damper is:
1 + fc l - k
1-
(5)
Ar
and
HC (6)
where and z/"’ are the vertical location of the upper, and lower, nodes of the
compensator element i , respectively. The mass of the compensator is lumped with the
mass of either the cage or the ship, for cage-mounted and ship-mounted configurations,
respectively.
194
The complete model consists of iV +I nodes, where N is the number o f elements.
The motion of each node point is governed by a second order differential equation. Since
the motion of the first element is prescribed, the system is completely described by a set
o f N simultaneous second order differential equations. The temporal response is
calculated by rewriting the N second order equations as a set o f 2 first order
equations and using a fourth-fifth order Runge-Kutta technique with adaptive step size to
numerically integrate this initial value problem (Press et al., 1992).
4 Results — Normal Operating Conditions
We investigate the ship-mounted and cage-mounted pneumatic heave
compensation systems for the ROPOS (Remotely Operated Platform for Oceanographic
Science) ROV system. ROPOS is a deep sea ROV system (an International Submarine
Engineering Hysub 5000 (ISE, 1998)) which is capable of diving to 16 400 ft (5 000 m).
The cage weighs 11,000 Ibf (49 000 N) in air and has dimensions of 6.9 x 11.2 x 13.8 ft
(2.1 X 3.4 X 4.2 m) (WLH). The tether has three layers of steel armour, is 1.17 in (3 cm)
in diameter, weighs 2.1 Ibfi ft (30.5 Nm'^), and has a maximum working load and
breaking strength of 45 000 Ibf (200 000 N) and 123 5000 Ibf (550 000 N), respectively.
Our finite-element model is used to evaluate the performance of the pneumatic
heave compensation systems at three different depths, 3 280, 8 200, and 16 400 ft (1 000,
2 500 and 5 000 m) which span the operating range of the ROPOS ROV system in caged
mode. For each of these depths, separate analyses are performed for the compensator

195
located at the cage and at the ship. The motion of the top node is prescribed with ship
motion which we measured during field operation (Driscoll et al, 1999a).
In this investigation the stiffness of the compensators is specified by choosing
values for the range of travel. Ay, and the tension range of the compensator, k . Only two
values of k are used: one for the cage and one for the ship. In each case, the value o f k
is determined by:
1. calculating the response of the uncompensated system;
2. determining the average standard deviation of the tension in the tether at the
A-frame and at the cage for all three depths;
3. setting k so the tension range of the compensator is ± one “average” standard
deviation of the tension at the mounting location.
This results in A: = 0.2 for ship-mounting and k = 0.4 for cage-mounting. The stiffness
o f the compensator is varied by investigating a wide range of travel of the compensator
Ay = 10 to 65.6 ft (3 to 20 m) at each of the two mounting locations and three operating
depths. For each set of Ay and k , we use the value of damping constant, , that
minimises the rms motion of the cage at mid operating depth.
4.1 Tim e Domain Results
Both the ship—mounted and cage-mounted systems attenuate the deviations o f the
tension and the vertical cage motion about their mean (Fig. 5). The ship-mounted system
196
provides slightly better reduction of both tension and displacement. Large downward
displacements o f the ship produce slack tether at the cage in the uncompensated system.
A snap load results when the tether is re-tensioned because the velocities of the tether
and cage are different. Between 620 and 635 s, a snap load occurs in the uncompensated
system (evident from the spiky tension record in that region). In all compensated cases
investigated, the snap load is eliminated and the tension during that time interval is
markedly reduced.
A measure of the effectiveness of the compensation systems is provided by the
rms reduction ratio. For a new signal X and the original signal Y , the rms reduction
ratio is:
where cr^ and CTy are the standard deviation of X and of Y , respectively. For a
compensator to be effective, R must be less than one, and smaller values of R indicate
greater attenuation. We chose the rms reduction ratio because it provides an average
rheasure of the effectiveness of the heave compensated systems over the range of
simulated ship motions. However, depending on the specific emphasis, other criteria such
as the reduction of extrema may be more appropriate. For the tension range, k , specified,
the ship-mounted compensation systems is slightly more effective than cage-mounted
systems — most values of the rms reduction ratios of the vertical motion of the cage,
R^c , and tension in the tether at the ship, R^ for the ship-mounted systems are less than
197
the corresponding values for the cage-mounted systems (Fig. 6). The greatest attenuation
in cage motion is achieved for the 8 200 ft (2 500 m) cases.
At all depths except 16 400 ft (5 000 m), the effectiveness of the ship and cage
mounted compensators increase with decreasing compensator stiffness — values of R^c
and decrease with increasing compensator travel. A y. However, returns are
diminishing because d^R^^ and d}R^s f dt -j- are both positive. As a result, R^^
itself begins to increase when Ay > 16.4 ft (5 m) with cage-mounted compensation at
16 400 ft (5 000 m) and this will be addressed in the discussion. At all other depths,
dR^s / (^Ay < 0. The tether did not go slack in any of the compensated cases investigated
and no snap loads are predicted. In fact, the minimum tension in the tether at the cage
increases with increasing Ay and increasing operating depth.
4.2 Frequency Domain Results
The spectra of cage acceleration and the transfer function between ship and cage
motion provide a measure of the attenuation of cage motion at different frequencies. Due
to space limitations, we only present the frequency domain information for the ROV at
8 200 ft (2 500 m) and Ay = 16.4 ft (5 m). The variance of the vertical acceleration of the
cage is much smaller for the compensated systems than for the uncompensated system
(Fig. 7(a)). The variance preserving spectra with a linear vertical scale (Fig. 7(b)) clearly
show that the compensated systems significantly reduce cage motion within the wave
band — the narrow frequency band between 0.1 and 0.25 Hz that contains 90% of the
variance of ship motion. Again we see that the ship compensator is slightly more
198
effective than the cage-mounted compensator. In the other cases at different depths and
different values of , the spectra are very similar and the variance decreased with
increasing A^.
The transfer function between ship and cage motion, , is a measure of
the motion transferred between the ship and cage at different frequencies. When
> 1, the motion transferred at that frequency is amplified, when
( / ) | ^ 1’ the motion transferred is attenuated. As is evident in Fig. 8(a), motion
amplification occurs through most o f the wave-hand for the uncompensated system. As
well, |^ z iz c ( /) | of the uncompensated system is asymmetric about the system’s first
natural frequency, / , — the frequency at which the phase between forcing and response
first passes through 90° (Fig. 8(b)). Also, the magnitude of the transfer function peaks at a
sUghtly lower frequency than / , and decreases much more rapidly on the high frequency
side o f the peak frequency than on the low frequency side. Because of this asymmetry,
more motion is transferred from the ship to the cage for frequencies below / ; than for
frequencies above .
Addition of the passive heave compensation systems is equivalent to inserting an
elastic member between either the ship and tether, or the cage and tether, which reduces
the stiffness of the system and its natural frequencies. The resulting asymmetry of
[fTzs^cC/)! increases and it peaks at a much lower frequency than for the uncompensated
case (Fig. 8(a)). For both ship and cage-mounted compensators at a depth o f 8 200 ft

199
(2 500 m) and = 16.4 ft (5 m), peaks below the wave-band and is less
than one through most of the wave-band (Fig. 8(a)). The response remains similar at
other depths with a slight improvement for shallower operation. The other variants
investigated (i.e. other values of A .) are also effective and reduced within the
wave-band.
Although the peak of the transfer function at a depth of 8 200 ft (2 500 m) and
Ay = 16.4 ft (5 m) is outside the wave band, it is larger than that for the uncompensated
system and it is within the frequency range o f swell (fully developed surface ocean
waves), between 0.02 and 0.12 Hz. This implies that the system’s response to swell will
increase with the addition of either heave compensation system.
4.3 Compensator Travel
The heave compensator’s range of travel. A y, must be sufficient so that the piston
does not hit its end stops during normal operation. If the piston collides with its upper end
stop, the system may be impulsively loaded, similar to a snap load. With our choice of k ,
the piston in either compensator never reaches its upper or lower travel limits (Fig. 9)
during typical operating conditions. However, for a smaller total range o f travel. Ay =
9.8 ft (3 m), both ship and cage-mounted compensators use their full range of travel and
the pistons will likely collide with their end stops if the sea state increases. At the other
extreme when the total range of travel is large. Ay = 65.6 ft (20 m), the compensators use
only a fraction of Ay. If this is true for the maximum operating sea conditions, the range
of travel should be reduced while maintaining the desired stiffness. This is done by

200
appropriately choosing the minimum and maximum operating tension of the
compensators. An interesting phenomenon occurs as increases: the total range the
cage-mounted compensator travels (Fig. 9(c)) increases while that o f the ship-mounted
compensator asymptotically approaches 11.5 ft (3.5 m). This point is addressed further in
the discussion.
5 Results - extreme operating conditions
Storms can develop in short periods of time and rapidly increase sea conditions.
An ROV system can take many hours to recover when working at full depth. It is
therefore necessary to ensure that a heave compensation system does not exacerbate
operating problems when the sea state unexpectedly increases above a specified
maximum. To simulate storm sea states, we increase the record of ship motion by a factor
o f two and three. The significant A-ffame displacement, , is defined here as the
average amplitude of the 25% largest displacements, analogous to the classical definition
of significant wave height. The measured displacement of the A-ffame used has =
7.2 ft (2.2 m), and the records amplified by factors of two and three have = 14.4 ft
(4.4 m) and = 21.7 ft (6.6 m), respectively. We then evaluate the ship and cage-
mounted compensators with Ay = 16.4 ft (5 m) because these give a good compromise
between performance, complexity and size in the prior results.
Under these conditions, the uncompensated system suffers from many snap loads
at 8 200 ft (2 500) m (Fig. 10) with increasing severity for the larger ship motion,
= 21.7 ft (6.6 m) (Fig. 11). By including heave compensation, snap loading is

2 0 1
eliminated for = 14.4 ft (4.4 m) and the pneumatic compensator never reaches its end
stops. For =21.7 ft (6.6 m), slack regularly develops in the tether at the cage
termination and the compensators hit their end stops. The cage-mounted compensator is
compliant so subsequent re-tensioning is gradual and snap loads are not produced
(Fig. 12). Rapid re-tensioning and snap loads do occur in the ship compensated system.
However, in comparison to the uncompensated system, the time interval of slack is
smaller and therefore, the relative velocity between the cage and tether and the resulting
“snap” are reduced. W hen the compensators hit their upper end stops the system is
impulsively loaded and rapid increases in tension, analogous to a snap load, develop, but
are less in magnitude than the uncompensated snap loads. More weight is supported by
the ship-mounted compensator than the cage-mounted system and thus, the jerks in the
ship compensated system are larger when collisions with the end stops occur. By
decreasing the compensator’s stiffness while keeping constant at 16.4 ft (5 m) we
find that the compensator hit the end stop with higher velocity than for compensators
with higher values o f the stiffness. This results in larger impulsive loads.
6 Discussion
An effective heave compensation system must reduce the rms motion of the
undersea platform and the rms tension in the tether at all operating depths and during
typical sea states. Also, effective systems should operate well in extreme sea states.
Values for the stiffness and damping parameters of passive compensation systems cannot
be changed during operation. Therefore, if passive systems are to be effective, values of

202
parameters must be chosen to achieve the best balance between performance during
normal operation (depth and sea state) and extreme sea states.
Our results show that both ship and cage compensated systems are effective in the
operating range of 3 280 (I 000) to 16 400 ft (5 000 m). The best reduction in cage
motion and tension in the tether is achieved for the mid operating depth of 8 200 ft
(2 500 m). This occurs for two reasons. First, the damping is optimised for this depth.
Second, the uncompensated system is in resonance and the variance of vertical motion
transferred to the cage is maximised at this depth — the spectral peak of ship motion, the
natural frequency, and the frequency of the peak of the transfer function between ship
and cage motion all align. Effectively, this is a worst case scenario for the uncompensated
system. At 3 280 (1 000) and 16 400 ft (5 000 m), the first natural frequency and peak the
of the transfer function of the uncompensated system shift to higher and lower
frequencies, respectively, which reduces the motion of the cage and tension in the tether.
Addition of the heave compensators shifts the peak of the transfer function to below the
wave-band for all depths between 3 280 (1 000) and 16 400 ft (5 000 m) and resonance
never occurs. Thus, the largest reduction in motion and tension due to compensation
occurs at 8 200 ft (2 500 m) because this is when the motion of the cage is the largest in
the uncompensated system.
Intuitively, one would think that the effectiveness of any compensation system
would improve by decreasing the compensator’s stiffness. Taken to the limit, an infinitely
compliant system would achieve a constant tension system and keep the cage stationary
by uncoupling the ship and cage. However, this is not necessarily true. For example, at
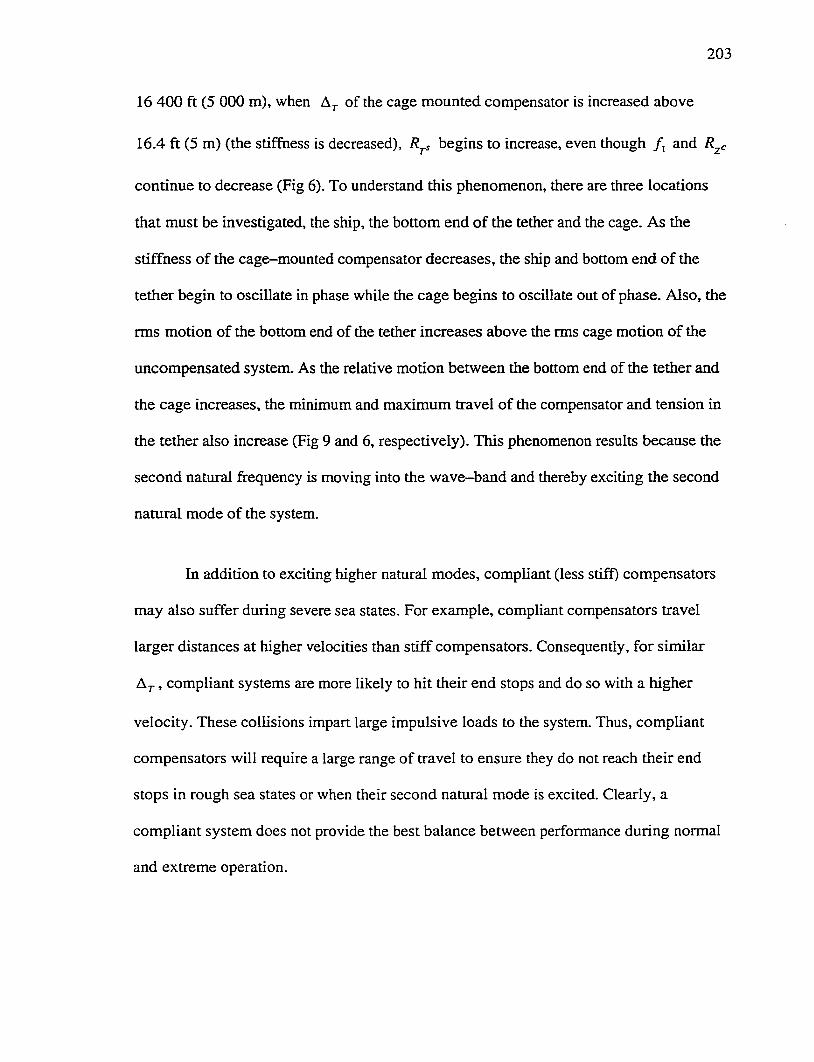
203
16 400 ft (5 000 m), when of the cage mounted compensator is increased above
16.4 ft (5 m) (the stifftiess is decreased), begins to increase, even though / , and R^c
continue to decrease (Fig 6). To understand this phenomenon, there are three locations
that must be investigated, the ship, the bottom end of the tether and the cage. As the
stiffness of the cage-mounted compensator decreases, the ship and bottom end of the
tether begin to oscillate in phase whüe the cage begins to oscillate out of phase. Also, the
rms motion of the bottom end of the tether increases above the rms cage motion of the
uncompensated system. As the relative motion between the bottom end of the tether and
the cage increases, the minimum and maximum travel of the compensator and tension in
the tether also increase (Fig 9 and 6, respectively). This phenomenon results because the
second natural frequency is moving into the wave-band and thereby exciting the second
namral mode of the system.
In addition to exciting higher natural modes, compliant (less stiff) compensators
may also suffer during severe sea states. For example, compliant compensators travel
larger distances at higher velocities than stiff compensators. Consequently, for similar
A-j. , compliant systems are more likely to hit their end stops and do so with a higher
velocity. These collisions impart large impulsive loads to the system. Thus, compliant
compensators will require a large range of travel to ensure they do not reach their end
stops in rough sea states or when their second natural mode is excited. Clearly, a
compliant system does not provide the best balance between performance during normal
and extreme operation.

204
For a reasonable range of total travel and stiffness ( A . < 19.7 ft (6 m)) that
achieves a good balance between normal operation (depth and sea state), and extreme sea
states, both cage-mounted and ship—mounted systems achieve similar attenuation o f cage
motion and the tension in the tether (by approximately a factor of 2). Our results show
that if the stiffness and damping characteristics are appropriately chosen, both systems
attenuate the motion of the cage and tension in the tether and eliminate snap loading for
all operating depths. Thus, the ROV system can operate in rougher seas with less damage
to the tether and cage. However, in extreme seas, the cage-mounted system performs
better and eliminates all snap loads while the ship-mounted system does not.
Perhaps the greatest advantage of the cage-mounted system is its simplicity.
When mounted on the ship, any compensation system will require adjustment during
deployment/recovery to counteract the increasing/decreasing overboard weight o f the
tether. Thus, the ship-mounted system will require external input and adjustment which
would render it much more complicated than the cage—mounted compensator. In the case
o f the ROPOS ROV system, the overboard weight increases by a factor of 4 when the
system is lowered from the surface to its maximum operating depth. Thus, the ship-
mounted system would also have to be built to withstand forces that are four times
greater than for a cage-mounted unit. The cage-mounted compensator has the advantage
of a constant mean load, and requires no adjustment. Because the cage-mounted system
is autonomous and simpler in design, it is less likely to fail and will require less
maintenance. By contrast, the design of a cage-mounted system would have to deal with
issues of survivability at great depths. Nevertheless, we believe that the cage is a better

205
location for mounting a passive compensation system since it would provide similar
performance in a much simpler form.
7 Conclusions
In this paper, we compared the performance of ship-mounted and cage-mounted
pneumatic compensation systems for the ROPOS ROV. The compensation systems were
investigated over the range of operating depths o f the ROV systems, and for a range of
compensator displacements (and stiffness). The ship and cage-mounted compensation
systems proved effective at reducing the rms cage motion and rms tension at the ship.
The best results are achieved at an operating depth of 8 200 ft (2 500 m) with the most
compliant compensators. For all but the maximum operating depth, 16 400 ft (5 000 m),
the effectiveness o f the compensators increased with increasing range of travel. Ay. At
16 400 ft (5 000 m), the second natural frequency of the system of the cage compensated
system was brought closer to, and eventually into, the wave-band as Ay was increased.
Thus, the rms reduction ratio of the tension began to increase with increasing Ay and the
cage motion became out of phase with the ship motion. During extreme seas, snap
loading did not occur for the cage compensated system even though the tether went slack.
Conversely, snap loading did occur in the ship compensated system in extreme seas and
the entire overboard system was jerked (albeit much more mildly than without a
compensation system) when the upper end stop was reached.
The reduction in the cage motion and tension in the tether (by approximately a
factor o f 2) were similar for the ship and cage-mounted compensation systems in all

206
cases investigated. Although the ship mounted system was slightly more effective, we
believe that the cage mounted system would be a better choice because of its simplicity
and operation in extreme seas.
Acknowledgements
The authors gratefully thank Jim McFarlane and the staff of International
Submarine Engineering (ISE) for their continual support and assistance in this project.
F.R. Driscoll was financially supported by the Natural Sciences and Engineering
Research Council (NSERC), the Science Council of British Columbia (SCBC) and ISE.
This work was also supported by the Office of Naval Research under contract N00014-
93-1-0362 and NSERC.
References
Bennett, P. and Forex, S., 1997, “Active heave: the benefits to operations as seen in the
north sea,” Proceedings of the SPE/IADC Drilhng Conference, pp. 207-217.
Driscoll F.R., Lueck R.G., and Nahon M., 1999a, “The motion of a deep-sea remotely
operated vehicle system. Part 1: motion observations,” Ocean Engineering, in press.
Driscoll F.R., Lueck R.G., and Nahon M., 1999b, “The motion of a deep-sea remotely
operated vehicle system. Part 2: analytic model,” Ocean Engineering, in press.

207
Driscoll, F.R., Lueck, R.G., and Nahon, M., 1999c, “Development and Validation of a
Lumped-Mass Dynamics Model of a Deep-Sea ROV System,” Submitted to Applied
Ocean Research.
Gaddy, D.E., 1997, “Ultradeep drillship will react to heave with electric-heave
compensating draworks,” Oil & Gas Journal, July, pp. 68
Hover, F.S., Grosenbaugh, M.A., and TriantafyUou, M.S., 1994, “Calculation of dynamic
motions and tension in towed underwater cables,” IEEE Journal o f Oceanic Engineering.
Vol. 19, pp. 449—457.
ISE 1998, International Submarine Engineering Hysub 5000, 1734 Broadway Street, Port
Coquitlam, B.C., Canada, V3C 2M8, web page, http://www.ise.bc.ca/rov.html#hys5000.
Kirstein, H., 1986, “Active heave compensation systems on board vessels and offshore
rigs,” Marine Technology, Vol 17, pp. 59-61.
Korde, U.A., 1998, “Active heave compensation on drill-ships in irregular waves,”
Ocean Engineering, Vol. 25, pp. 541-561.
Mellem T., 1979, “Surface handling of diving bells and submersibles in rough sea,”
Proceedings of the Offshore Technology Conference, Houston, Texas, pp. 1571-1580.
Moran, J.M. and Shapiro, H.N., 1992, “Fundamentals of Engineering Thermodynamics,”
John Wiley & Sons, Inc. pgs 804.

2 0 8
Niedzwecki, J.M., and Thampi, S.K., 1988, “Heave compensated response of long multi
segment drill strings,” Applied Ocean Research, Vol. 10, pp. 181-190.
Niedzwecki, J.M., and Thampi, S.K., 1991, “Snap loading o f marine cable systems,”
Applied Ocean Research, Vol. 13, pp. 210—218.
W.H. Press, S.A., Teukolsky, W.T., Vetterling, and B.P. Rannery, et al, 1992,
“Numerical Recipes in C,” Cambridge University Press.

209
Accumulator
Max. Line In Max Line OutFig.l. Diagrammatic representation of a cage mounted heave compensation system at full extension, half extension and full retraction.
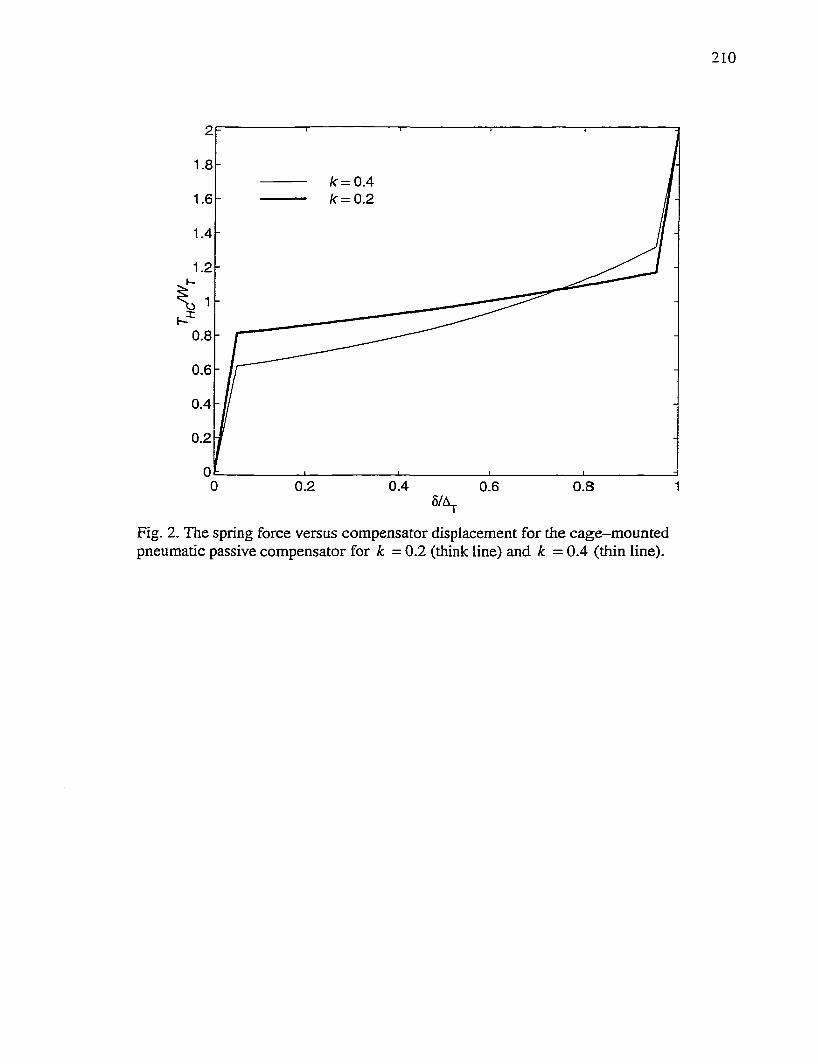
210
1.8k = O Ak= 0.2
1.4
1.2
0.8
0.6
0.4
0.2
0 0.40.2 0.80.6 1S/A
Fig. 2. The spring force versus compensator displacement for the cage-mounted pneumatic passive compensator for k = 0.2 (think line) and k = 0.4 (thin line).
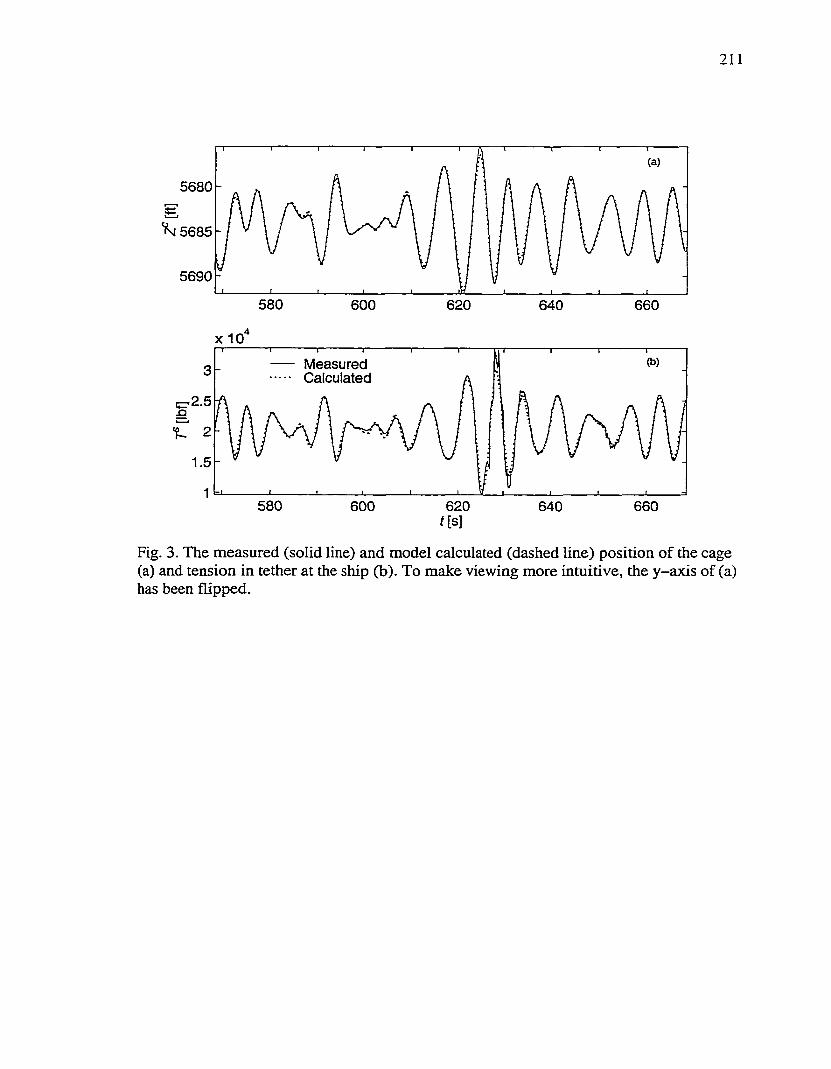
211
5680
'i*'4 5685
5690
580 600 620 640 660
x1 0
— Measured Calculated3
2.5
2
1.5
1580 620600 640 660
f[s]
Fig. 3. The measured (solid line) and model calculated (dashed line) position of the cage (a) and tension in tether at the ship (b). To make viewing more inmitive, the y-axis of (a) has been flipped.

212
Node I
Element I
Node
Element 2
Node
Element 3
Node
Ship-MountedCompensator
NodeN-1
Element N-1
Node N
Element NCage-MountedCompensator
Cage (Node N+1)
Fig. 4. Diagrammatic representation o f the fmite-element lumped-mass model. The compensators (when included) are represented by the elements enclosed by the dashed lines.

213
8210
Ç 8215
8220
580 600 620 640 660
xlO3.5 With C age Mounted HO
With Ship Mounted HO
1.5
580 600 620 640 660t[s]
Fig. 5. Short time series of the cage motion (a) and tension in tether at the ship (b) for the uncompensated system, for the system with ship—mounted compensation and for the system with cage-mounted compensation

214
0.8
0.4
0 10 20 30 40 50 60
(b) -
0.20 10 20 30 40 6050
Fig. 6. The rms reduction ratio for the position o f the cage (a) and the tension in the tether at the ship (b) are plotted for ship-mounted (dashed lines) and cage-mounted (solid lines) compensation systems.
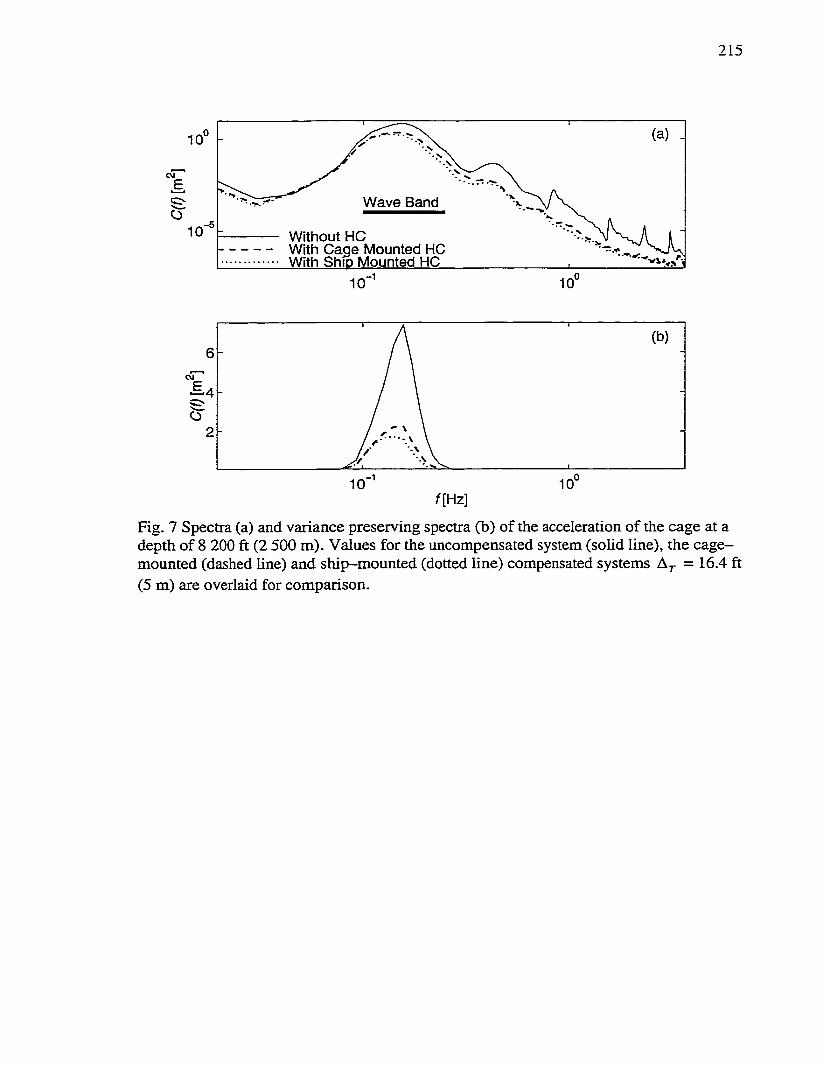
215
10
CMe* xW ave Band
-510 Without HCWith C age Mounted HO With Ship Mounted HC
10'^ ,010
6CM
- \2
,0■110 10f[Hz]
Fig. 7 Spectra (a) and variance preserving spectra (b) of the acceleration of the cage at a depth of 8 200 ft (2 500 m). Values for the uncompensated system (solid line), the cage- mounted (dashed line) and ship-mounted (dotted line) compensated systems = 16.4 ft (5 m) are overlaid for comparison.
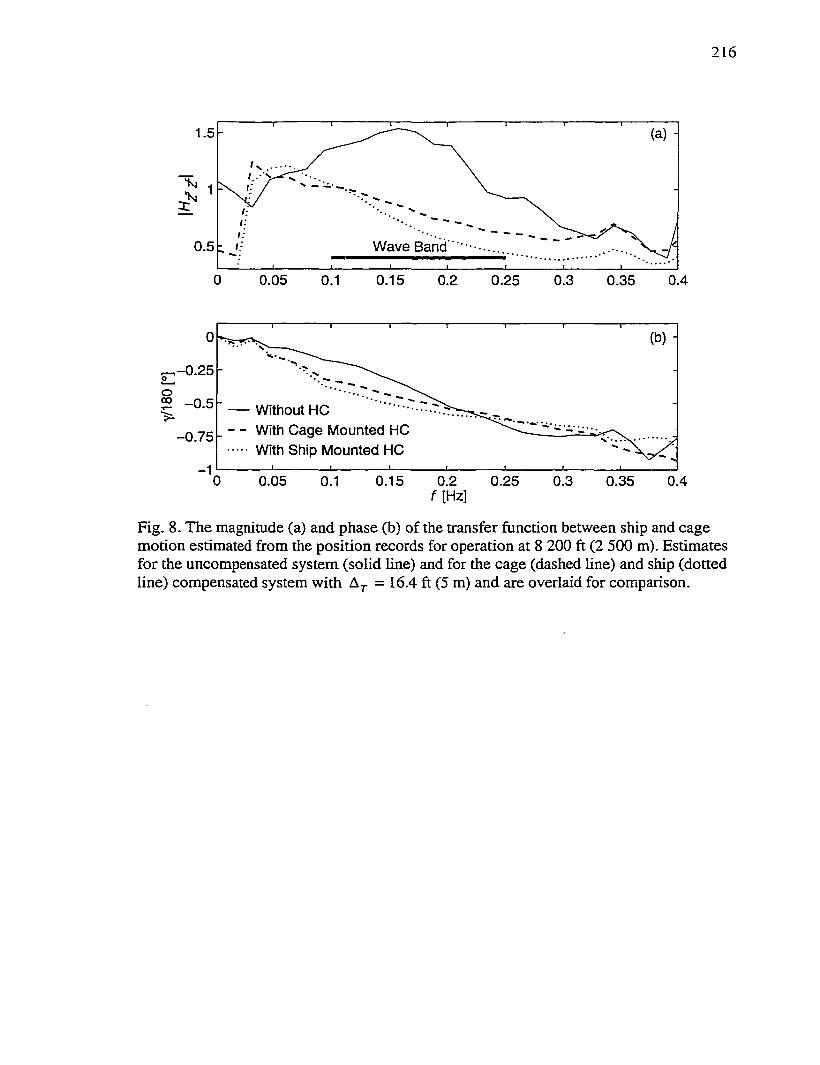
216
(a) -
W ave Band0.5
0 0.05 0.150.1 0.2 0.25 0.3 0.35 0.4
-0 .2 5
Without HC With C age Mounted HC With Ship Mounted HC
0.05 0.1 0.15 0.2 0 .25 0.3 0.35 0.4f [Hz]
Fig. 8. The magnitude (a) and phase (b) of the transfer function between ship and cage motion estimated from the position records for operation at 8 200 ft (2 500 m). Estimates for the uncompensated system (solid line) and for the cage (dashed line) and ship (dotted line) compensated system with = 16.4 ft (5 m) and are overlaid for comparison.
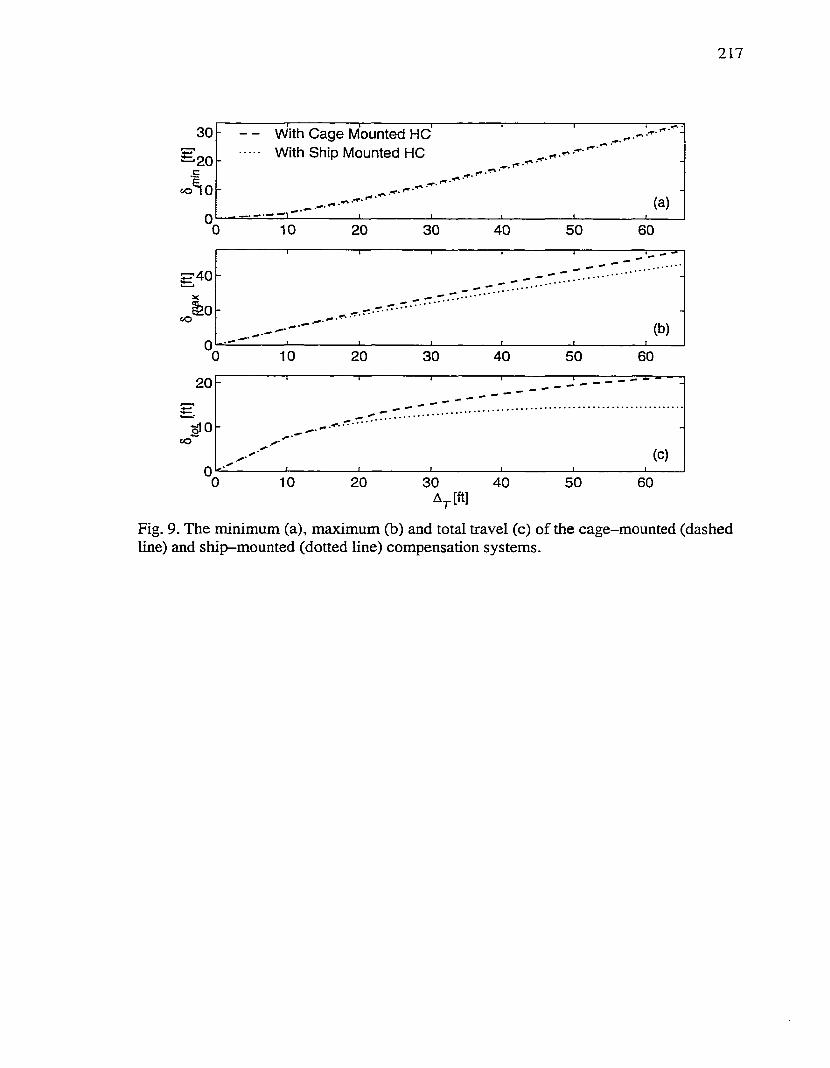
217
30
20
<o
10 20 30 40 50 60
40
to
10 20 30 40 50 60
20
to
20 30 5040
With C age Mounted HC With Ship Mounted HC
A^[ft]
Fig. 9. The minimum (a), maximum (b) and total travel (c) of the cage-mounted (dashed line) and ship-mounted (dotted line) compensation systems.

218
X 10
730 740 750 760 770 780
-3 0 - - Without HC •With C age Mounted HC With Ship Mounted HC
730 740 750t[s]
760
(b) .
770 780
Fig. 10. The tension in the tether at the ship (a) and the acceleration of the cage (b) for the uncompensated system (solid Une), cage compensated system (dashed line) and ship compensated system (dotted line)for = 14.4 ft (4.4 m).
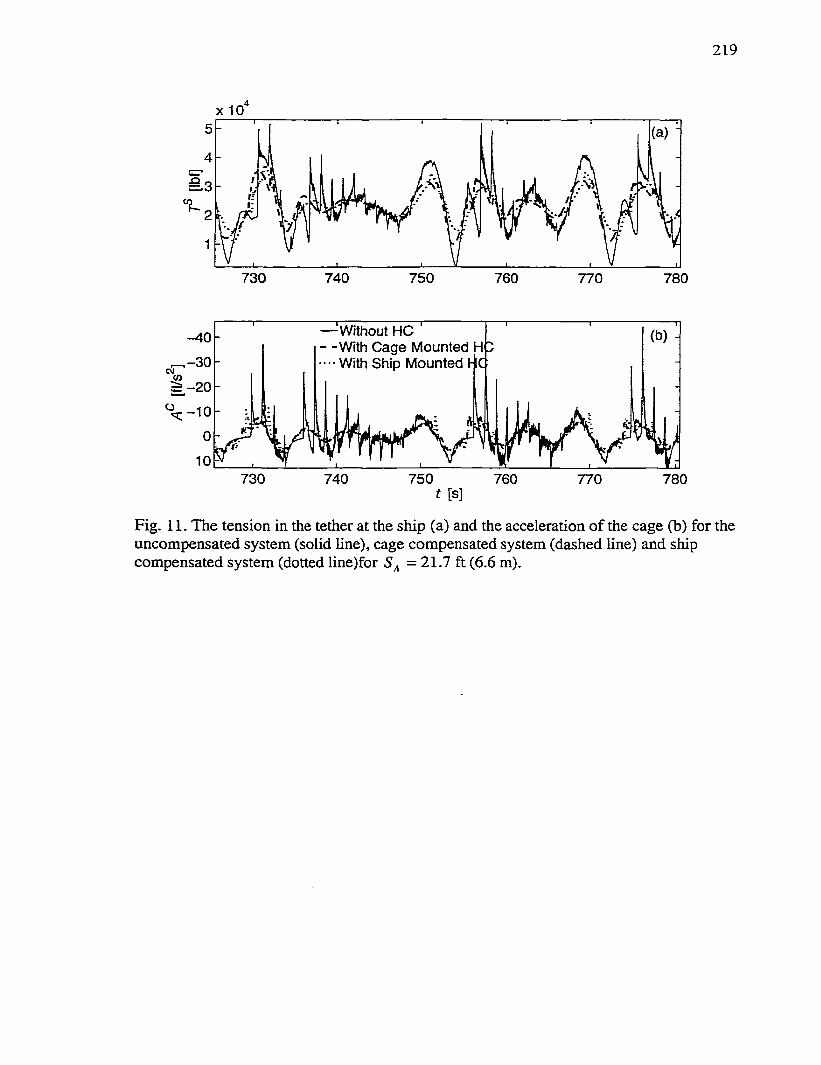
219
X 10
730 740 750 760 770 780
— Without HC - - With C age Mounted •••• With Ship Mounted h
(b) --40
CM
10730 750740 760 770 780
t [s]
Fig. 11. The tension in the tether at the ship (a) and the acceleration of the cage (h) for the uncompensated system (soUd line), cage compensated system (dashed line) and ship compensated system (dotted line)for 5^ = 21.7 ft (6.6 m).
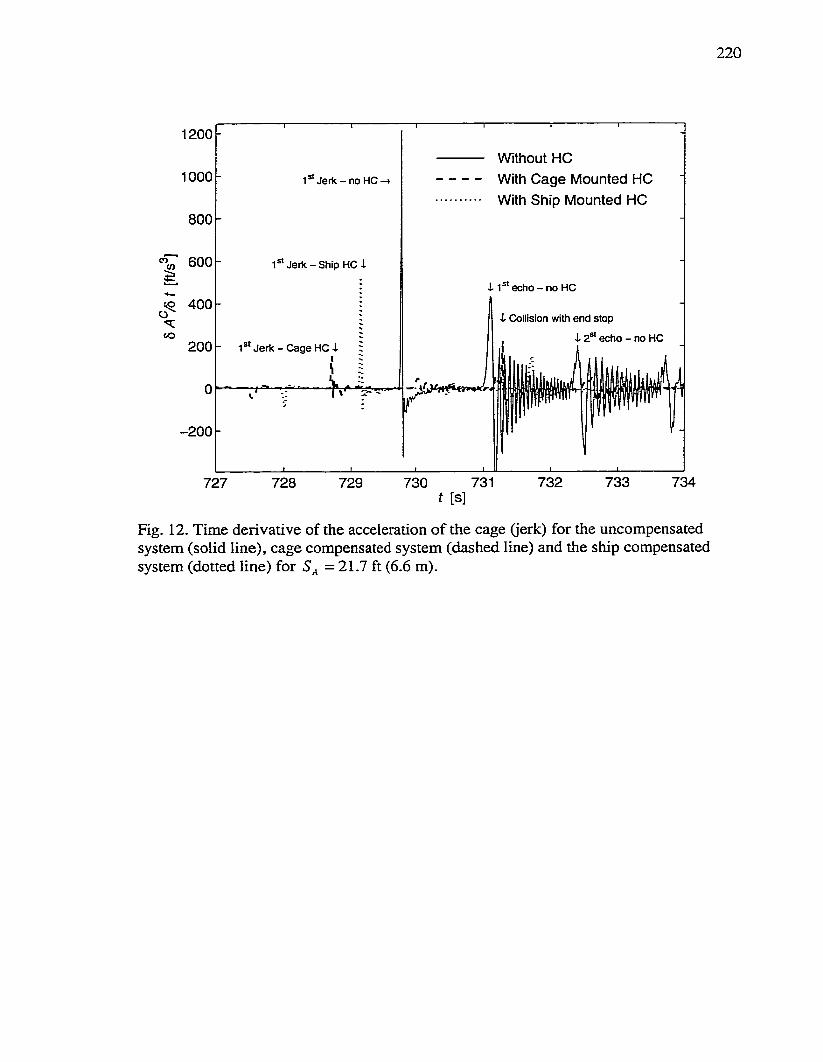
220
1200 -
1000 -
800-
600-%CO 400
üC<o
-200
Without HC1®'Jerk- n o HC- With C age Mounted HC
With Ship Mounted HC
1®* Jerk - Ship HC i
i 1®*echo - no HC
i Collision with end stop
i 2®* echo - no HC1 Jerk - Cage HC i
727 728 729 730 731f [S]
732 733 734
Fig. 12. Time derivative of the acceleration of the cage (jerk) for the uncompensated system (solid line), cage compensated system (dashed line) and the ship compensated system (dotted line) for = 21.7 ft (6.6 m).

221
Appendix E
Discretization of the T e ther Equation
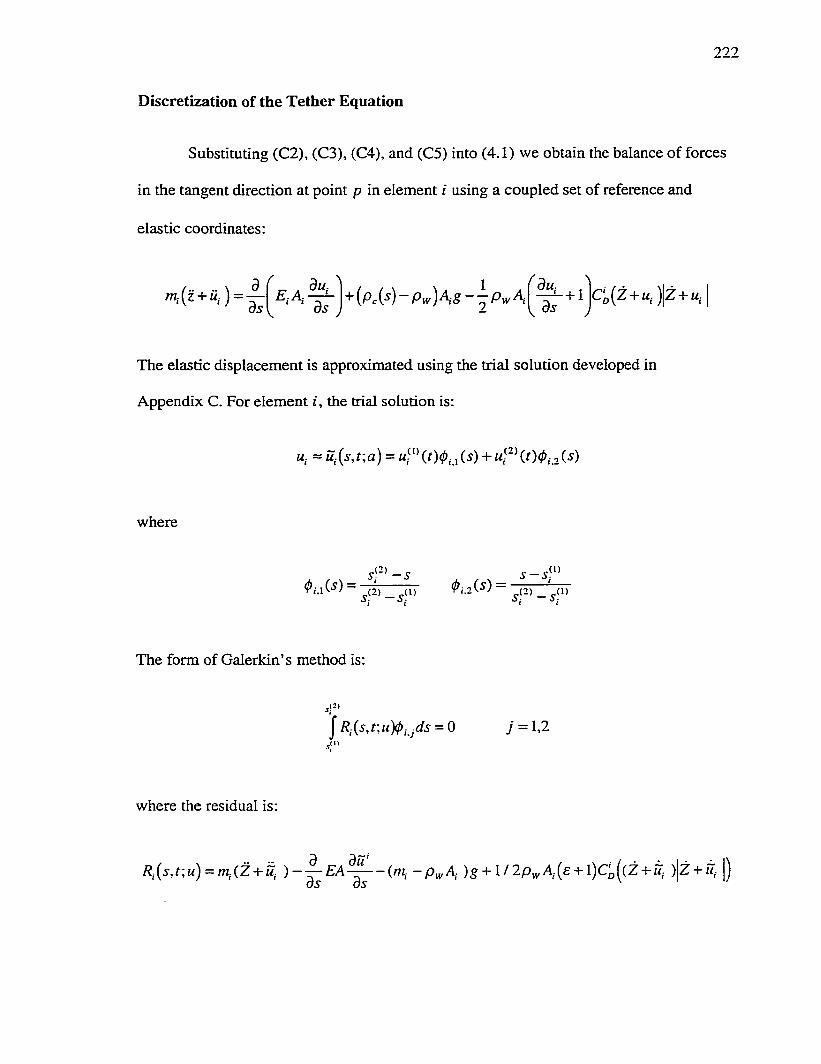
222
Discretization of the Tether Equation
Substituting (C2), (C3), (C4), and (C5) into (4.1) we obtain the balance of forces
in the tangent direction at point p in element i using a coupled set of reference and
elastic coordinates:
dsCi{Z + u,)|z + «,
The elastic displacement is approximated using the trial solution developed in
Appendix C. For element i, the trial solution is:
u. = iï.{s,f,a) = j(s) +
where
- s
The form of Galerkin’s method is:
} Ri{s, t; uypijds = 0 7 = 1,2
where the residual is:
R^{s,t\u) = m.{Z + u. — {m .-p ^A f )g + l/2p^A ,.(£ + 1)Cô((Z + M; ) |z + z<,. |)

223
where e « 1 and therefore 6 + 1 = 1. The integral is simplified by termwise separtion of
5
the residual such that R- = and the coresponding terms are:k=l
/ ? , . = m,.(z); R.^{s,t;u) = m-fw;. ) R .j{s j;u ) =
R.^{s,t\u) = -(jn^-p^A^)g-, and = 1 /2p ,^A ,.q ((Z + m,. )|z + fi. );
Terms /?,- j and R- do not invovle the trial solution integrate to:
R.j^(5, f;u) J <p. j (,s)ds = Y2 R;,,{s , t;u)l. j = 1,2; k = 1,6
where I = s\~ . Applying Galerkin’s method to the consistent mass
representation:
ju-(p.j(s)dss<'>
/M; ju.^.2(s)ds= m d %
We integrate R^ by parts and obtain:
— E;A;
— E;A; ds
E,A, ■ 1 - r k ' " ' + k ! " 'h -1 1 _ k k j

224
where the boundary terms are:
P'l"
j3r-’ = £ , A ^ « ^ P ’)u
Expanding Rj(z,i;u) and evaluating for positive Z+u.
j C „{Z + Ù ,) \,d s
^ j Q(z+à;)V,,*Pw^D^ih
and thus, when Z + u. is either positive or negative over element i, the discritized form of
Rj{z,t;u) is:
r / " ' i _ Pw^D^ih2