UMCES Horn Point Laboratory Demonstration Oyster Farm ...
49
UMCES Horn Point Laboratory Demonstration Oyster Farm Oyster Production Equipment Comparisons 2016 – 2018
Transcript of UMCES Horn Point Laboratory Demonstration Oyster Farm ...

UMCES Horn Point Laboratory Demonstration Oyster Farm
Oyster Production Equipment Comparisons 2016–2018

This project and body of work reflect the combined efforts of a tireless group of dedicated individuals.
Maryland Sea Grant College provided funding (grant #NA17OAR4170220) for the installation of infrastructure and gear, and the communications team provided copyediting and graphic design for this publication.
This project was supported by funding from the Chesapeake Bay Foundation under award number NA14NMF4740362 from the National Oceanic and Atmospheric Administration, U.S. Department of Commerce. The statements, findings, conclusions, and recommendations are those of the author(s) and do not necessarily reflect the views of the National Oceanic and Atmospheric Administration or the Department of Commerce
The University of Maryland Center for Environmental Science Horn Point Laboratory staff and interns—Dakota Abbott, Stephanie Alexander, Jeff Alexander, Bob Carey, Alex Golding, Lisa Guy, Zack Hoisington, Alicia Klages, Alan Roache, Jessie Todd, Julie Trommatter, Steven Weschler, Stacey Willey, Amanda Ault, Christian Baran, Chelsie Bateman, Jonathan Bland, Kenneth Bradford, Andrew Braker, Thomas Butler, Patrick Clark, Jack Elstner, Brianna Fragata, Francesca Galasso, Emmaline Gates, Shelby Glessner, Ashley Gray, Janet Hansen, Hayden Hollingsworth, Dan Lekites, Erin Lyons, Cole Meyerhoff, Kelly Morsey, Samantha Moxey, Tasha Noveletsky, Andrew Shipton, Annahid Samiljan, Courtney Sewell, Jeremiah Sturmer, Chelsey Tull, Henry Ulrich, Angelina Watts, and Shane Wetmore—worked to install and operate the demonstration farm, rain or shine. Their efforts are greatly appreciated and this work would not have been possible without them.
The team at the Auburn University Shellfish Laboratory provided valuable input throughout the project.
Finally, Maryland’s oyster growers deserve special mention for providing valuable insight for working on the water.
UM-SG-UME-2020-02
Copies of this publication may be obtained by visiting the Maryland Sea Grant website: mdsg.umd.edu/topics/oysters/oyster-aquaculture-and-restoration

Oyster Production Equipment Comparisons 2016–2018
Shannon Hood1*, Donald Webster2, Donald Meritt1, Louis Plough1, Matthew Parker2
AbstractThe demonstration oyster farm at University of Maryland Center for Environmental Science (UMCES) conducted studies on a variety of contained culture equipment for a two-year period. The report provides information on commercially relevant aspects of oyster production associated with each equipment type employed. Unbiased information is provided on the various equipment types, allowing oyster growers to assess the tradeoffs associated with each equipment type. While acknowledging this study is limited to a single site, it suggests potential areas for future investigation.
1 University of Maryland Center for Environmental Science Horn Point Laboratory2 University of Maryland Extension*Corresponding author: Shannon Hood | [email protected] | 410 221 8225


TABLE OF CONTENTS 5
TABLE OF CONTENTS
Introduction . . . . . . . . . . . . . . . . . . . . . . . . . . . . . . . . . . . . . . . . . . . . . . . . . . . . . . . . . . 11Methods . . . . . . . . . . . . . . . . . . . . . . . . . . . . . . . . . . . . . . . . . . . . . . . . . . . 12
Site . . . . . . . . . . . . . . . . . . . . . . . . . . . . . . . . . . . . . . . . . . . . . . . . . . . . 12Equipment . . . . . . . . . . . . . . . . . . . . . . . . . . . . . . . . . . . . . . . . . . . . . . 14Oyster Production . . . . . . . . . . . . . . . . . . . . . . . . . . . . . . . . . . . . . . . . . 19Data Collection . . . . . . . . . . . . . . . . . . . . . . . . . . . . . . . . . . . . . . . . . . . 21Statistical Analysis . . . . . . . . . . . . . . . . . . . . . . . . . . . . . . . . . . . . . . . . 22
Results . . . . . . . . . . . . . . . . . . . . . . . . . . . . . . . . . . . . . . . . . . . . . . . . . . . . . . . . . . . . . . 23Oyster Survival . . . . . . . . . . . . . . . . . . . . . . . . . . . . . . . . . . . . . . . . . . . . . . 23Oyster Growth by Season . . . . . . . . . . . . . . . . . . . . . . . . . . . . . . . . . . . . . . 23
2016: Shell Height Growth (hinge to bill) . . . . . . . . . . . . . . . . . . . . . . . . 232017: Total Growth Since Deployment . . . . . . . . . . . . . . . . . . . . . . . . . 252018: Total Growth Since Deployment . . . . . . . . . . . . . . . . . . . . . . . . . 26Net Growth Per Year . . . . . . . . . . . . . . . . . . . . . . . . . . . . . . . . . . . . . . . 30
Shell Morphology . . . . . . . . . . . . . . . . . . . . . . . . . . . . . . . . . . . . . . . . . . . . 31Width Index . . . . . . . . . . . . . . . . . . . . . . . . . . . . . . . . . . . . . . . . . . . . . 31Galtsoff Shape Index . . . . . . . . . . . . . . . . . . . . . . . . . . . . . . . . . . . . . . 323:2:1 Ratio . . . . . . . . . . . . . . . . . . . . . . . . . . . . . . . . . . . . . . . . . . . . . . 32Condition Index . . . . . . . . . . . . . . . . . . . . . . . . . . . . . . . . . . . . . . . . . . 32
Worm Presence . . . . . . . . . . . . . . . . . . . . . . . . . . . . . . . . . . . . . . . . . . . . . . 34Cost Estimates . . . . . . . . . . . . . . . . . . . . . . . . . . . . . . . . . . . . . . . . . . . . . . 35
Capital Costs and Installation . . . . . . . . . . . . . . . . . . . . . . . . . . . . . . . . 35Production Costs . . . . . . . . . . . . . . . . . . . . . . . . . . . . . . . . . . . . . . . . . 35
Discussion . . . . . . . . . . . . . . . . . . . . . . . . . . . . . . . . . . . . . . . . . . . . . . . . . . . . . . . . . . . 37BST™ Crosshatch . . . . . . . . . . . . . . . . . . . . . . . . . . . . . . . . . . . . . . . . . . . . 37
Installation and Operation Notes . . . . . . . . . . . . . . . . . . . . . . . . . . . . . . 37Production Notes . . . . . . . . . . . . . . . . . . . . . . . . . . . . . . . . . . . . . . . . . 37
BST™ Longline . . . . . . . . . . . . . . . . . . . . . . . . . . . . . . . . . . . . . . . . . . . . . . 38Installation and Operation Notes . . . . . . . . . . . . . . . . . . . . . . . . . . . . . . 38Production Notes . . . . . . . . . . . . . . . . . . . . . . . . . . . . . . . . . . . . . . . . . 38
OysterGro® . . . . . . . . . . . . . . . . . . . . . . . . . . . . . . . . . . . . . . . . . . . . . . . . . . 38Installation and Operation Notes . . . . . . . . . . . . . . . . . . . . . . . . . . . . . . 38Production Notes . . . . . . . . . . . . . . . . . . . . . . . . . . . . . . . . . . . . . . . . . 39
Rack and Bag . . . . . . . . . . . . . . . . . . . . . . . . . . . . . . . . . . . . . . . . . . . . . . . 39Installation and Operation Notes . . . . . . . . . . . . . . . . . . . . . . . . . . . . . . 39Production Notes . . . . . . . . . . . . . . . . . . . . . . . . . . . . . . . . . . . . . . . . . 39
Seapa™ . . . . . . . . . . . . . . . . . . . . . . . . . . . . . . . . . . . . . . . . . . . . . . . . . . . . 40Installation and Operation Notes . . . . . . . . . . . . . . . . . . . . . . . . . . . . . . 40Production Notes . . . . . . . . . . . . . . . . . . . . . . . . . . . . . . . . . . . . . . . . . 40
Caveats . . . . . . . . . . . . . . . . . . . . . . . . . . . . . . . . . . . . . . . . . . . . . . . . . . . . 40
6 OYSTER PRODUCTION EQUIPMENT COMPARISONS 2016–2018
Literature cited . . . . . . . . . . . . . . . . . . . . . . . . . . . . . . . . . . . . . . . . . . . . . . . . . . . . . . . . 41
Appendix I . . . . . . . . . . . . . . . . . . . . . . . . . . . . . . . . . . . . . . . . . . . . . . . . . . . . . . . . . . . . 43Equipment Types and Abbreviations . . . . . . . . . . . . . . . . . . . . . . . . . . . . . 43
Appendix II . . . . . . . . . . . . . . . . . . . . . . . . . . . . . . . . . . . . . . . . . . . . . . . . . . . . . . . . . . . 44Detailed Capital, Installation, and Production Costs for Horn Point Laboratory Demonstration Oyster Farm . . . . . . . . . . . . . . . . . 44

7LIST OF FIGURES
LIST OF FIGURES
Figure 1 . UMCES Horn Point Laboratory demonstration oyster farm at mid-tide. . . . . . . . 11
Figure 2 . Demonstration farm location at UMCES Horn Point Laboratory (HPL) along the Choptank River in Maryland.. . . . . . . . . . . . . . . . . . . . . . . . . . . . . . . . . . . . . . . 11
Figure 3 . Ambient salinity at the HPLDF site during the study period, 2016–2018. . . . . . . 13
Figure 4 . Ambient water temperature (in degrees Celsius) at the HPLDF site during the study period, 2016–2018. . . . . . . . . . . . . . . . . . . . . . . . . . . . . . . . . . . . . . . . . 13
Figure 5 . BST™ Crosshatch (BST#) undergoing weekly desiccation at the Horn Point Laboratory demonstration oyster farm in the Choptank River. . . . . . . . . . . . . . . . . . 14
Figure 6 . Proper configuration of clips on each end of BST™ Crosshatch baskets. . . . . . 14
Figure 7 . BST™ Crosshatch configuration . . . . . . . . . . . . . . . . . . . . . . . . . . . . . . . . . . . . 15
Figure 8 . BST™ Longline (BSTLL) basket with clips along the top that hang from a single floating line. . . . . . . . . . . . . . . . . . . . . . . . . . . . . . . . . . . . . . . . . . . . . . . . . . . . . . 15
Figure 9 . BST™ Longline configuration. . . . . . . . . . . . . . . . . . . . . . . . . . . . . . . . . . . . . . . 15
Figure 10 . OysterGro® unit on land. Two pontoons along the top of the cage provide flotation for the cage that houses Vexar® bags of oysters. . . . . . . . . . . . . . . . . . 16
Figure 11 . Vexar® bag can be filled with oysters. Numerous mesh sizes are available and the bags can be boxed (as seen here) or left in a “pillow” style. . . . . . . . . . 16
Figure 12 . Swordfish/longline clips to secure OysterGro® cages and guy-lines to anchored longline. . . . . . . . . . . . . . . . . . . . . . . . . . . . . . . . . . . . . . . . . . . . . . . . . . . . . 16
Figure 13 . OysterGro® configuration. . . . . . . . . . . . . . . . . . . . . . . . . . . . . . . . . . . . . . . . 16
Figure 14 . Rack and bag system (miniature version). Commercial racks house six bags and keep the bags approximately 10 inches off the seafloor. . . . . . . . . . . . . . . . 17
Figure 15 . Rack and bag configuration. . . . . . . . . . . . . . . . . . . . . . . . . . . . . . . . . . . . . . . 17
Figure 16 . Seapa™ unit on land, with clips along the top of the basket to secure the basket to a single, floating line. . . . . . . . . . . . . . . . . . . . . . . . . . . . . . . . . . . . . . . . . . 18
Figure 17 . Seapa™ configuration. . . . . . . . . . . . . . . . . . . . . . . . . . . . . . . . . . . . . . . . . . . 18
Figure 18 . Juvenile oyster seed being deployed to the HPL demonstration oyster farm in July 2016. . . . . . . . . . . . . . . . . . . . . . . . . . . . . . . . . . . . . . . . . . . . . . . . . . . . . . . . 19
Figure 19 . Example of winter low tide at HPL demonstration oyster farm site. . . . . . . . . . 19
Figure 20 . Oyster tumbler used at six-week intervals during processing. . . . . . . . . . . . . . 20
Figure 21 . Oyster height, length, and width measurements. From Galtsoff, 1964. . . . . . . 21
Figure 22 . Worms expelled from oysters after a 24-hour exposure to a 5% ethanol solution.. . . . . . . . . . . . . . . . . . . . . . . . . . . . . . . . . . . . . . . . . . . . . . . . . . . . . . . . 22
Figure 23 . Box and whisker plot depicting the change in shell height (in mm) of oysters grown in five equipment types in between July and November of 2016.. . . . . . 24
Figure 24 . Box and whisker plot depicting the total change in shell height (in mm), as of November 2017, of oysters grown in five equipment types since their July 2016 deployment. . . . . . . . . . . . . . . . . . . . . . . . . . . . . . . . . . . . . . . . . . . . . . . . 25

8 OYSTER PRODUCTION EQUIPMENT COMPARISONS 2016–2018
Figure 25 . Box and whisker plot depicting the total change in shell height (in mm), as of September 2018, of oysters grown in five equipment types since their July 2016 deployment. . . . . . . . . . . . . . . . . . . . . . . . . . . . . . . . . . . . . . . . . . . . . . . . . . . . 26
Figure 26 . Line plot depicting the growth (in mm) of oysters grown in five equipment types from 2016–2018. . . . . . . . . . . . . . . . . . . . . . . . . . . . . . . . . . . . . . . . . . . 27
Figure 27 . Random sample of oysters grown in the BST™ Crosshatch method as of September 2018. . . . . . . . . . . . . . . . . . . . . . . . . . . . . . . . . . . . . . . . . . . . . . . . . . . . 27
Figure 28 . Random sample of oysters grown in the BST™ Longline method as of September 2018. . . . . . . . . . . . . . . . . . . . . . . . . . . . . . . . . . . . . . . . . . . . . . . . . . . . 28
Figure 29 . Random sample of oysters grown in the OysterGro® system as of September 2018. . . . . . . . . . . . . . . . . . . . . . . . . . . . . . . . . . . . . . . . . . . . . . . . . . . . . . . . 28
Figure 30 . Random sample of oysters grown in the rack and bag system as of September 2018. . . . . . . . . . . . . . . . . . . . . . . . . . . . . . . . . . . . . . . . . . . . . . . . . . . . . . . . 29
Figure 31 . Random sample of oysters grown in the Seapa™ system as of September 2018. . . . . . . . . . . . . . . . . . . . . . . . . . . . . . . . . . . . . . . . . . . . . . . . . . . . . . . . 29
Figure 32 . Average net growth per year of oysters grown in five equipment types at the HPL Demonstration Farm. . . . . . . . . . . . . . . . . . . . . . . . . . . . . . . . . . . . . . . . . . . . 30
Figure 33 . Box and whisker plot depicting the Width Index of oysters grown in five equipment types.. . . . . . . . . . . . . . . . . . . . . . . . . . . . . . . . . . . . . . . . . . . . . . . . . . . . 31
Figure 34 . Box and whisker plot depicting the Galtsoff Index for oysters grown in five equipment types.. . . . . . . . . . . . . . . . . . . . . . . . . . . . . . . . . . . . . . . . . . . . . . . . . . 32
Figure 35 . Box and whisker plot depicting the deviation from idealized 3:2:1 shape ratio of oysters grown in equipment types.. . . . . . . . . . . . . . . . . . . . . . . . . . . . . . . 33
Figure 36 . Box and whisker plot depicting the condition index values of oysters grown in five equipment types. . . . . . . . . . . . . . . . . . . . . . . . . . . . . . . . . . . . . . . . . . . . . . 33
Figure 37 . Box and whisker plot noting the number of worms expelled from oysters grown in each of five equipment types. . . . . . . . . . . . . . . . . . . . . . . . . . . . . . . . . 34

9LIST OF TABLES
LIST OF TABLES
Table 1 . Total number of oysters deployed to each equipment treatment. . . . . . . . . . . . . 19
Table 2 . Cumulative oyster survival by equipment type during the period 2016–2018. . . . 23
Table 3 . Average change in shell height (in mm) per year for oysters grown in five equipment types 2016–2018. . . . . . . . . . . . . . . . . . . . . . . . . . . . . . . . . . . . . . . . . . . . 23
Table 4 . Net growth per year of oysters grown in five equipment types at the HPL demonstration oyster farm. . . . . . . . . . . . . . . . . . . . . . . . . . . . . . . . . . . . . . . . . . . . . 30
Table 5 . Capital costs associated with each equipment treatment. . . . . . . . . . . . . . . . . . 35
Table 6 . Estimated cost of production for oysters from each equipment treatment. . . . . . 35
Table 7 . Capital items purchased for HPL demonstration oyster farm use allocated equally across production systems. . . . . . . . . . . . . . . . . . . . . . . . . . . . . . . . . . 44
Table 8 . Capital, installation, and production cost for Seapa™ System. . . . . . . . . . . . . . 45
Table 9 . Capital, installation, and production cost for Rack and Bag System. . . . . . . . . . 46
Table 10 . Capital, installation, and production cost for OysterGro® System. . . . . . . . . . . 47
Table 11 . Capital, installation, and production cost for BST™ Longline System. . . . . . . . 48
Table 12 . Capital, installation, and production cost for BST™ Crosshatch System. . . . . . 49

10 OYSTER PRODUCTION EQUIPMENT COMPARISONS 2016–2018
11INTRODUCTION
INTRODUCTION
The revision of Maryland’s shellfish leasing laws in 2009 has spurred interest in private oyster aquaculture, using both water-column and bottom leases for production. Interest in water-column leases utilizing containerized production equipment resulted in a need for research-based information on different equipment types in order to provide growers with unbiased information on equipment costs and oyster growth performance. Many equipment options are available, and research has been conducted on multiple equipment types in the Chesapeake Bay and elsewhere (see Davis, 2013; Gamble, 2016; Thomas et al, 2019; Walton et al., 2012). Given site specificity, additional comparative research into gear performance is warranted to aid current and prospective aquaculture operations in making business decisions. A lack of information has often left current and prospective shellfish aquaculture operators feeling unprepared to purchase equipment best suited to their needs. Often growers will use an equipment type that they have seen someone else use.
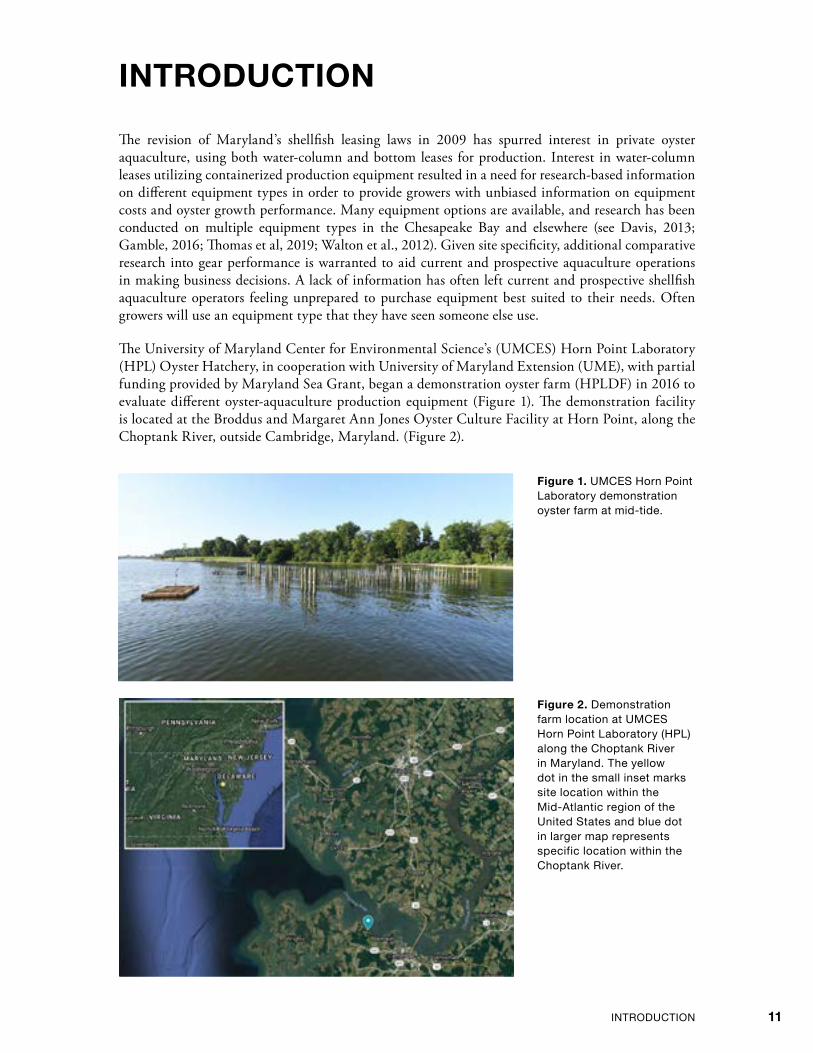
The University of Maryland Center for Environmental Science’s (UMCES) Horn Point Laboratory (HPL) Oyster Hatchery, in cooperation with University of Maryland Extension (UME), with partial funding provided by Maryland Sea Grant, began a demonstration oyster farm (HPLDF) in 2016 to evaluate different oyster-aquaculture production equipment (Figure 1). The demonstration facility is located at the Broddus and Margaret Ann Jones Oyster Culture Facility at Horn Point, along the Choptank River, outside Cambridge, Maryland. (Figure 2).
Figure 2 . Demonstration farm location at UMCES Horn Point Laboratory (HPL) along the Choptank River in Maryland. The yellow dot in the small inset marks site location within the Mid-Atlantic region of the United States and blue dot in larger map represents specific location within the Choptank River.
Figure 1 . UMCES Horn Point Laboratory demonstration oyster farm at mid-tide.

12 OYSTER PRODUCTION EQUIPMENT COMPARISONS 2016–2018
The goal of the project is to provide information to current and prospective aquaculture oyster operations about available equipment types. The project has deployed five equipment types (see Appendix I for descriptions) and collects data on oyster production, including growth, condition index, worm infestation, and shell morphology. In addition to these biotic and physical measurements, economic data are captured on the cost of the equipment, installation costs, as well as labor requirements to build and install equipment. Information from this project will allow farmers to make informed decisions regarding purchases, operation, and lease management. Results at the HPLDF cannot be expected to apply to other sites, due to varying conditions and are site-specific for the given research period and area.
The HPLDF is also a UME training site, which provides individuals with opportunities to learn about equipment types at scheduled workshops and individual consultations. These interactions allow growers to work directly with equipment types before deciding whether to incorporate one or more methods in their production.
In this study, we present the results of the 2016–2018 growing season. Equipment in the study was purchased by the project. The types of equipment used do not represent all equipment available, and were selected based on commercial interest, site applicability, and logistical constraints. Neither UMCES nor its partners endorse any product included in the project and results are provided for informational purposes only.
Methods Research was conducted on containerized equipment available for intensive oyster culture. After consulting with current oyster aquaculture operations and assessing feasibility, five equipment types were selected for the farm. These include off-bottom, mid-water, and floating culture equipment. BST™ (used in crosshatch and longline orientations), OysterGro®, rack and bag, and Seapa™ equipment were selected based on interest from the industry. Appendix I provides images and descriptions of all equipment types employed. While the Virginia-style bottom cage is a popular equipment type in the Chesapeake region, it was not selected for inclusion in this study due to the lack of appropriate HPLDF equipment to hoist the large cages from the water.
Site
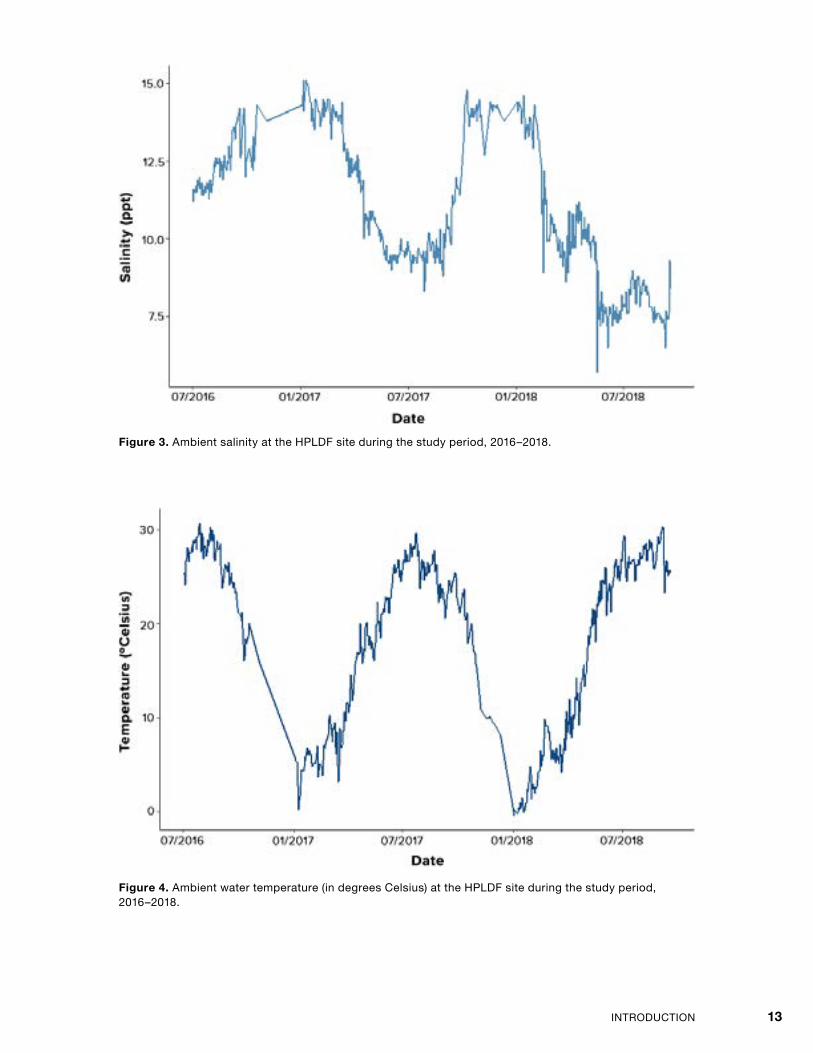
The HPLDF is a one acre plot and served as the site for all equipment investigations (Figure 2). This site is located in the Choptank River, a tributary of the Chesapeake Bay (Figure 2). Average surface salinities in this site range from 10.1 to 12.5 (Wei, 2019), although salinities ranging from 4 to 16 parts per thousand (ppt) have been documented at the site (HPL Oyster Hatchery, unpublished data). During the period of study (2016–2018), salinity ranged from 6.5 to 15.1 (Figure 3) and ambient water temperature ranged from -0.4 to 30.7 °C (Figure 4). Site depth ranges from 1 to 4 feet (mean high water depth, NOAA Nautical Chart #12266) and experiences daily tidal fluctuations of approximately 1.5 feet. The site is fully protected from the south, and semi-protected from the west-northwest by a pier. The site is fully exposed to the north-northeast. Results obtained at this particular site cannot be expected to transfer to other sites.
13INTRODUCTION
Figure 3 . Ambient salinity at the HPLDF site during the study period, 2016–2018.
Figure 4 . Ambient water temperature (in degrees Celsius) at the HPLDF site during the study period, 2016–2018.

14 OYSTER PRODUCTION EQUIPMENT COMPARISONS 2016–2018
Figure 5 . BST™ Crosshatch (BST#) undergoing weekly desiccation at the Horn Point Laboratory demonstration oyster farm in the Choptank River.
Figure 6 . Proper configuration of clips on each end of BST™ Crosshatch baskets.
TWO OPPOSING CLIPS ONE DOWNWARD FACING CLIP
Equipment
BST™ CrosshatchThe BST™ Crosshatch (BST#) unit (Figure 5) is a mid-water, adjustable longline system with baskets holding oysters suspended on each end from an adjustable longline, with lines running along both sides of the basket. Longlines are heavy monofilament threaded through a rubber tube to minimize chafing, and are secured to pilings on each end. Each line is 120 feet long and is tensioned, with 5% of the total length pulled out of the line. Clips secure baskets to the lines, with two opposing clips on one end of the basket, and one downward facing clip on the opposite end of the basket (Figure 6). The system orientation emulates rungs on a ladder, where baskets are the rungs and lines provide the stiles (Figure 5). Baskets are situated perpendicular to the current to facilitate maximum flow through each with available mesh sizes of 6 or 12 mm. Baskets sit just above mean-low water level to allow twice-daily exposure to air during low tide. PVC posts affixed with clips at two heights support each line and allow the whole unit to be raised for longer periods of desiccation. In this project, oysters were desiccated during each low tide and for 24 consecutive hours per week, with the exception of winter months.

15INTRODUCTION
8 ft
15 ft
120 ft
topview
sideview
75 ft
15 fttopview
sideview
Figure 7 . BST™ Crosshatch configuration
Figure 8 . BST™ Longline (BSTLL) basket with clips along the top that hang from a single floating line.
BST LonglineThe BST™ Longline (BST LL) system (Figure 8) is a mid-water equipment with baskets holding oysters suspended from a single line secured with two hooks on top of the units. Baskets are placed perpendicular to the current for maximum flow and available basket mesh sizes are 6 mm and 12 mm. Longlines securing the baskets are the same as the Crosshatch system. The system can be installed as a tensioned adjustable longline system allowing for desiccation. However, it was not set up in this manner due to the cost required for additional pilings, which make pilings unfeasible for many farms. For this project, baskets were floated at the surface using buoys between each unit and baskets remained subtidal.
8 ft
15 ft
120 ft
topview
sideview
75 ft
15 fttopview
sideview
Figure 9 . BST™ Longline configuration.

16 OYSTER PRODUCTION EQUIPMENT COMPARISONS 2016–2018
Figure 11 . Vexar® bag can be filled with oysters. Numerous mesh sizes are available and the bags can be boxed (as seen here) or left in a “pillow” style.
Figure 10 . OysterGro® unit on land. Two pontoons along the top of the cage provide flotation for the cage that houses Vexar® bags of oysters.
Figure 12 . Swordfish/longline clips to secure OysterGro® cages and guy-lines to anchored longline.
75 ft
15 ft
~4 ft
topview
sideview
Figure 13 . OysterGro® configuration.
OysterGroOysterGro® (OG) (Figure 10) is a floating cage that can hold up to six Vexar® bags (Figure 11). Two pontoons provide flotation to the cage. Cages are attached to nylon rope anchored by 54-inch double helix screw augers at each end. Units are attached to the nylon rope using guy-lines and swordfish/longline clips (Figure 12). Units can be inverted to allow the cage to sit on top of the pontoons for aerial desiccation. The inverted position can also be used during periods of strong storms or winter ice to sink the cages. The units can be flipped with end caps removed from the pontoons, allowing them to fill with water and sink. After the weather event, cages can be returned to the surface to resume flotation. In this project, the OysterGro® units were desiccated for 24 consecutive hours per week, with the exception of winter months.

17INTRODUCTION
Figure 14 . Rack and bag system (miniature version). Commercial racks house six bags and keep the bags approximately 10 inches off the seafloor.
~10 in
Figure 15 . Rack and bag configuration.
Rack and BagRack and bag (RB) (Figure 14) is an off-bottom system using Vexar® bags secured to reinforcing bar rack frames. The bags sit approximately 10 inches off the bottom while rubber tarp straps secure the corners of the bags to the rack. In regions with greater tidal flux, these can be intertidal systems, but in this project, the bags remained subtidal.

18 OYSTER PRODUCTION EQUIPMENT COMPARISONS 2016–2018
Figure 16 . Seapa™ unit on land, with clips along the top of the basket to secure the basket to a single, floating line.
75 ft
15 fttopview
sideview
Figure 17 . Seapa™ configuration.
SeapaSeapa™ (SE) (Figure 16) is a mid-water longline system consisting of baskets that hold oysters suspended from a single line. Baskets are suspended from the line by two hooks on top of each basket. Lines are oriented perpendicular to the current to allow maximum flow through each basket. Mesh sizes include 3 mm, 6 mm, 12 mm, and 24 mm sizes. As with the BST™ system, it has the ability to be installed as a tensioned longline to allow desiccation, however, they were not set up that way for this project. Baskets were floated from the surface using can buoys between each unit and baskets remained subtidal.

19INTRODUCTION
Oyster Production
Diploid hatchery reared oyster (Crassostrea virginica) seed of the same brood and set (source: Shoal Creek, set date: March 10, 2016, size at deployment 3–10 mm) (Figure 18) were deployed to each equipment treatment in July of 2016 (Table 1).
Oysters remained in their original equipment treatments throughout the analysis, except during winter months when they were labeled, containerized, and sunk in the deep portion of the farm for protection. The site experiences extremely low tides in winter that would have led to prolonged exposure to freezing temperatures potentially killing the oysters (Figure 19). Each spring, oysters were returned to their original culture units.
Figure 18 . Juvenile oyster seed being deployed to the HPL demonstration oyster farm in July 2016.
Equipment Type Total Oysters Stocked
Seapa™ 6,400
Rack and Bag 6,000
OysterGro® 36,000
BST™ Longline 6,400
BST™ Crosshatch 40,000
Table 1 . Total number of oysters deployed to each equipment treatment.
Figure 19 . Example of winter low tide at HPL demonstration oyster farm site.

20 OYSTER PRODUCTION EQUIPMENT COMPARISONS 2016–2018
Every six weeks from April through November, the oysters were removed from the water for processing. Processing consisted of tumbling oysters in a 48-inch tube (Figure 20), power-washing culture equipment, and re-stocking oysters in their respective equipment types.
Densities were maintained at ~33% of the interior volume of each equipment type. This resulted in an unequal number of oysters per unit, but ensured a consistent ratio of oysters to interior container volume between equipment types. This method is common in the industry to maintain stocking density. Fifteen liter Seapa™ and BST™ baskets were stocked at 5 liters per cage, and 37-liter Vexar® bags were stocked at 12 liters per bag.
Figure 20 . Oyster tumbler used at six-week intervals during processing.

21INTRODUCTION
Data Collection
Thirty randomly selected oysters were measured from each treatment every three weeks, excluding winter months. Shell height (hinge to bill) was recorded to the nearest millimeter. In 2017 and 2018, shell length (across the right valve of the oyster) and width (cup of the oyster), were measured in addition to height. Figure 21 depicts the measurement regime.
Shell height was measured to calculate total oyster growth since deployment and net growth per year for each equipment type. Shell length, width, and height were also measured to quantify shell morphology analysis (Width Index, Galtsoff Shape Index and 3:2:1 Ratio). The width index describes a ratio of oyster shell length to height and is calculated as:
The Galtsoff Shape Index Method (Ward et al., 2005) was calculated as:
A 3:2:1 ratio of shell height to length to width, respectively, has been suggested as optimum for oyster shape (Brake et al., 2003, Mizuta and Wikfors, 2018, Thomas et al., 2019). Oyster morphology was analyzed using a chi-squared deviation to determine how closely the oysters fit this 3:2:1 ratio of shell height to length to width. A “perfectly” shaped oyster would not deviate from this 3:2:1 fit.
Condition index was measured in September 2018 according to Hopkin’s Formula (Lawrence & Scott, 1982):
Whole oysters were removed from the water, scrubbed free of external biofouling organisms, and then allowed to dry in ambient laboratory air conditions for 60 minutes. The oysters were weighed (in grams), then shucked, and the weight of valves (in grams) was recorded. Cavity volumes were measured by subtracting the weight of valves from whole oyster weight. Density of the cavity contents has been previously measured as 1 g per cm3 (Lawrence & Scott, 1982). Dry meat weight of all oyster tissue (in grams) was recorded after being dried in an oven at 68°C for 48 hours.
Figure 21 . Oyster height, length, and width measurements. From Galtsoff, 1964.
Width Index =Shell Height
Shell Length
Galtso� Shape Index =Shell Length
Shell Height + Shell Width
Condition Index =Internal Cavity Volume (cm3)
Dry Meat Weight (g) x 100
Width Index =Shell Height
Shell Length
Galtso� Shape Index =Shell Length
Shell Height + Shell Width
Condition Index =Internal Cavity Volume (cm3)
Dry Meat Weight (g) x 100
Width Index =Shell Height
Shell Length
Galtso� Shape Index =Shell Length
Shell Height + Shell Width
Condition Index =Internal Cavity Volume (cm3)
Dry Meat Weight (g) x 100

22 OYSTER PRODUCTION EQUIPMENT COMPARISONS 2016–2018
Multiple species of worms are associated with oyster culture (Blake and Evans, 1973) and at least one, Polydora websteri, can affect the growth and the condition index of aquaculture oysters (Gryder, 2002; Read, 2010; Wargo et al., 1993). Due to the inability to quantify the number of worms per oyster via visual inspection, trials were conducted to identify the most effective method for the expulsion of burrowing worms. An effective solution to expel worms for quantification was identified as a 24-hour bath in a solution of 5% ethanol and 95% artificial seawater (13 ppt/psu) (Figure 22). Oysters from each equipment type were submerged in individual jars containing this solution, and the expelled worms were counted after the 24-hour immersion.1
Statistical Analysis
Statistical analyses were conducted in RStudio (version 3.4.1/2017-06-30) using either an Analysis of Variance (ANOVA) or a non-parametric Kruskal Wallis rank sum test. Normally distributed data were analyzed with an ANOVA to assess differences among equipment types, and significant findings (p < 0.05) were further investigated using Tukey’s Honest Significant Difference Test. Some data were not normally distributed, therefore the Kruskal Wallis rank sum test was used for these data sets (analysis of shell-height growth data, 3:2:1 ratio and condition index). Pairwise comparisons of non-normally distributed data were conducted using Dunn’s test for multiple comparisons (package FSA, version 0.8.22.9000) and multiple comparisons were corrected using the Holm method (package FSA, version 0.8.22.9000).
Box and whisker plots were used to graphically display data. These plots consist of a box, with the thick middle line representing the median value of the data, and the top and bottom of each box representing the 25% (lower) and 75% (upper) bounds of the interquartile range. Vertical lines extending above and below each plot indicate the distribution of the data to +/- (1.5 x the interquartile range). Any black dots included above or below the plot represent outliers that fall outside of +/- (1.5 x the interquartile range) (Wickham, 2016).
1 This solution is not approved or suggested for commercial use and may not be applied to oysters destined for human consumption
Figure 22 . Worms expelled from oysters after a 24-hour exposure to a 5% ethanol solution. Worms vacate their burrows in oyster shells and are visible for counting. This solution is not approved for commercial use on oysters destined for consumption and is conducted here for research purposes only.

23RESULTS
RESULTS
Oyster SurvivalOyster survival to the end of the study period varied among equipment types. The 2016 and 2017 growing seasons were characterized by typical salinity conditions for the Choptank River, but record rainfall led to decreased salinity in 2018. Such reduced salinity may have resulted in increased mortality during the 2018 season. In addition to removing oysters that died during the study period, oysters were also removed to maintain volumetric stocking densities as previously described. Market size (three inch) oysters were removed from the BST™ Crosshatch system before the end of the study period. These oysters were counted in the survival calculations.
Oyster Growth by Season2016: Shell Height Growth (hinge to bill)
The rack and bag system yielded the most growth (in shell height) during the 2016 season, followed closely by the BST™ Crosshatch and OysterGro®. The rack and bag, BST™ Crosshatch and OysterGro® systems each attained significantly greater shell height (p<0.05) than the BST™ Longline and the Seapa™ systems in 2016. (Figure 23, Table 3).
Table 3 . Average change in shell height (in mm) per year for oysters grown in five equipment types 2016–2018.
Equipment Type Mean change in shell height (mm) since deployment2016 2017 2018
BST Crosshatch 27.1 39.7 46.9BST Longline 19.4 45.7 51.7OysterGro® 24.9 35.7 41.4Rack and Bag 27.8 53.8 60.0Seapa™ 19.8 43.3 61.2
Table 2 . Cumulative oyster survival by equipment type during the period 2016–2018.
Equipment Type Oysters Deployed Oysters Harvested % Survival
Seapa™ 6,400 1,863 29%
Rack and Bag 6,000 3,840 64%
OysterGro® 36,000 14,476 40%
BST™ Longline 6,400 2,288 36%
BST™ Crosshatch 40,000 18,828 47%

24 OYSTER PRODUCTION EQUIPMENT COMPARISONS 2016–2018
Figure 23 . Box and whisker plot depicting the change in shell height (in mm) of oysters grown in five equipment types in between July and November of 2016. The thick line in the middle of each box represents the median (middle) value of the data. Letters represent significance groups; no significant differences were observed among treatments with letters in common.
Cha
nge
in S
hell
Hei
ght (
mm
)BST Crosshatch (BST#)
BST Longline (BSTLL)
OysterGro (OG)
Rack and Bag (RB)
Seapa (SE)
10
Equipment TypeBST# BSTLL OG RB SE
20
30
40
B A B
Equipment Type
B A

25RESULTS
2017: Total Growth Since Deployment
The rack and bag system yielded the most growth in shell height at the end of the 2017 season, followed by BST™ Longline and Seapa™. Oysters from the rack and bag and BST™ Longline attained significantly greater shell height during this period (p<0.05) than oysters from BST™ Crosshatch and OysterGro® units. Oysters grown in Seapa™ units reached significantly greater shell height than oysters in OysterGro® (p<0.05) (Figure 24, Table 3).
Figure 24 . Box and whisker plot depicting the total change in shell height (in mm), as of November 2017, of oysters grown in five equipment types since their July 2016 deployment. The thick line in the middle of each box represents the median (middle) value of the data. Letters represent significance groups; no significant differences were observed among treatments with letters in common.
Cha
nge
in S
hell
Hei
ght (
mm
)
BST Crosshatch (BST#)
BST Longline (BSTLL)
OysterGro (OG)
Rack and Bag (RB)
Seapa (SE)
Equipment Type
30
BST# BSTLL OG RB SE
40
50
60
B AC D
Equipment Type
C ABC
70
26 OYSTER PRODUCTION EQUIPMENT COMPARISONS 2016–2018
2018: Total Growth Since Deployment
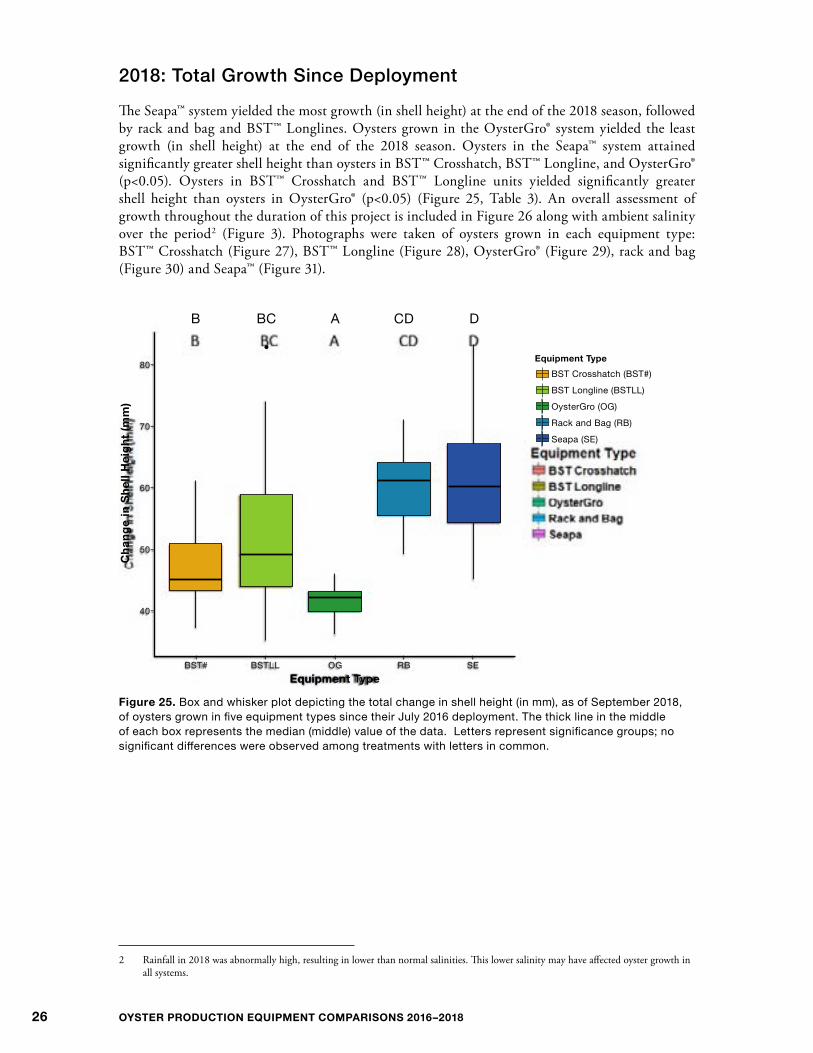
The Seapa™ system yielded the most growth (in shell height) at the end of the 2018 season, followed by rack and bag and BST™ Longlines. Oysters grown in the OysterGro® system yielded the least growth (in shell height) at the end of the 2018 season. Oysters in the Seapa™ system attained significantly greater shell height than oysters in BST™ Crosshatch, BST™ Longline, and OysterGro® (p<0.05). Oysters in BST™ Crosshatch and BST™ Longline units yielded significantly greater shell height than oysters in OysterGro® (p<0.05) (Figure 25, Table 3). An overall assessment of growth throughout the duration of this project is included in Figure 26 along with ambient salinity over the period2 (Figure 3). Photographs were taken of oysters grown in each equipment type: BST™ Crosshatch (Figure 27), BST™ Longline (Figure 28), OysterGro® (Figure 29), rack and bag (Figure 30) and Seapa™ (Figure 31).
2 Rainfall in 2018 was abnormally high, resulting in lower than normal salinities. This lower salinity may have affected oyster growth in all systems.
Figure 25 . Box and whisker plot depicting the total change in shell height (in mm), as of September 2018, of oysters grown in five equipment types since their July 2016 deployment. The thick line in the middle of each box represents the median (middle) value of the data. Letters represent significance groups; no significant differences were observed among treatments with letters in common.
Cha
nge
in S
hell
Hei
ght (
mm
)
Equipment Type
40
BST# BSTLL OG RB SE
50
60
70
B BC A CD D
80BST Crosshatch (BST#)
BST Longline (BSTLL)
OysterGro (OG)
Rack and Bag (RB)
Seapa (SE)
Equipment Type

27RESULTS
Tota
l Gro
wth
(mm
)
BST Crosshatch (BST#)BST Longline (BSTLL)OysterGro (OG)Rack and Bag (RB)Seapa (SE)
Date
0
Sep 16 Dec 16 Mar 17 Jun 17 Sep17 Dec 17 Mar 18 Jun 18 Sep 18
20
40
60
Equipment Type
80
Figure 26 . Line plot depicting the growth (in mm) of oysters grown in five equipment types from 2016–2018.
Figure 27 . Random sample of oysters grown in the BST™ Crosshatch method as of September 2018.

28 OYSTER PRODUCTION EQUIPMENT COMPARISONS 2016–2018
Figure 28 . Random sample of oysters grown in the BST™ Longline method as of September 2018.
Figure 29 . Random sample of oysters grown in the OysterGro® system as of September 2018.

29RESULTS
Figure 30 . Random sample of oysters grown in the rack and bag system as of September 2018.
Figure 31 . Random sample of oysters grown in the Seapa™ system as of September 2018.

30 OYSTER PRODUCTION EQUIPMENT COMPARISONS 2016–2018
Net Growth Per Year
Net growth per year was calculated as the change in shell height each year (Figure 32, Table 4). In 2016, rack and bag yielded the highest net growth. In 2017, BST™ Longline yielded the highest net growth. In 2018, Seapa™ yielded the highest net growth. The 2016 and 2017 growing seasons were characterized by typical salinity conditions for the Choptank River, but record rainfall led to decreased salinity in 2018 (Figure 3). Such reduced salinity may have resulted in reduced growth during the 2018 season.
Table 4 . Net growth per year of oysters grown in five equipment types at the HPL demonstration oyster farm.
Culture Method 2016 growth (mm) 2017 growth (mm) 2018 growth (mm)
BST™ Crosshatch 27.1 12.7 7.2
BST™ Longline 19.4 26.3 6.0
OysterGro® 24.9 10.8 5.7
Rack and Bag 27.8 25.9 6.3
Seapa™ 19.8 23.5 17.9
Net
gro
wth
per
yea
r (m
m)
0
Year
20
30
40
10
2016 2017 2018
BST Crosshatch (BST#)BST Longline(BSTLL)OysterGro(OG)Rack and Bag(RB)Seapa(SE)
Equipment Type
Figure 32 . Average net growth per year of oysters grown in five equipment types at the HPL Demonstration Farm. The thick line in the middle of each box represents the median (middle) value of the data.

31RESULTS
Wid
th In
dex
BST Crosshatch (BST#)BST Longline(BSTLL)OysterGro(OG)Rack and Bag(RB)Seapa(SE)
0.5
Equipment Type
0.6
0.7
0.8
0.9
1.0
BST# BSTLL OG RB SE
Equipment Type
Figure 33 . Box and whisker plot depicting the Width Index of oysters grown in five equipment types. Width index is calculated as the ratio of oyster length to oyster height. Width Indexes >0.63 indicate more favorably shaped oysters. The thick line in the middle of each box represents the median (middle) value of the data.
Shell MorphologyOyster height, length, and width (Figure 21) were measured for oysters grown in each culture method. Three analyses were used to quantify shell morphology.
Width Index
Width indices greater than 0.63 indicate more favorably shaped oysters (Brake et al., 2003). Oysters grown in OysterGro® were more favorably shaped than those grown in the Seapa™ system (p<0.05). Other significant relationships were not found among other methods, but all yielded favorably shaped oysters (Figure 33).

32 OYSTER PRODUCTION EQUIPMENT COMPARISONS 2016–2018
Galtsoff Shape Index
Ward et al., (2005) suggested scores less than three indicate good oyster shape; scores of three indicate average oyster shape, while scores greater than three indicate poor oyster shape. Oysters grown in each method yielded scores well below three, indicating that culture methods displayed good shape with no significant differences observed among equipment types (Figure 34).
3:2:1 Ratio
Shell morphology was assessed as the ratio of shell height:length:width. Oysters grown in all equipment types deviated from ideal fit but no significant differences were observed among equipment (Figure 35).
Condition Index
Condition Index for oysters in each of the five equipment types was calculated in November 2018. Significant differences among systems were observed, with the Seapa™ and BST™ Longline systems yielding improved condition index values compared to the rack and bag oysters (p<0.05) (Figure 36).
Gal
tsof
f Ind
ex
1.5
2.0
2.5
Equipment TypeBST# BSTLL OG RB SE
BST Crosshatch (BST#)BST Longline(BSTLL)OysterGro(OG)Rack and Bag(RB)Seapa(SE)
Equipment Type
Figure 34 . Box and whisker plot depicting the Galtsoff Index for oysters grown in five equipment types. A Galtsoff Index of less than three has been suggested to be indicative of a favorable shape. The thick line in the middle of each box represents the median (middle) value of the data.

33RESULTS
Dev
iatio
n
0
2
4
Equipment TypeBST# BSTLL OG RB SE
BST Crosshatch (BST#)BST Longline(BSTLL)OysterGro(OG)Rack and Bag(RB)Seapa(SE)
Equipment Type
Con
ditio
n In
dex
5
10
15
Equipment TypeBST# BSTLL OG RB SE
BST Crosshatch (BST#)BST Longline(BSTLL)OysterGro(OG)Rack and Bag(RB)Seapa(SE)
Equipment Type
Figure 36 . Box and whisker plot depicting the condition index values of oysters grown in five equipment types. The thick line in the middle of each box represents the median (middle) value of the data.
Figure 35 . Box and whisker plot depicting the deviation from idealized 3:2:1 shape ratio of oysters grown in equipment types. Deviation of zero indicates an ideally shaped oyster. The thick line in the middle of each box represents the median (middle) value of the data.
34 OYSTER PRODUCTION EQUIPMENT COMPARISONS 2016–2018
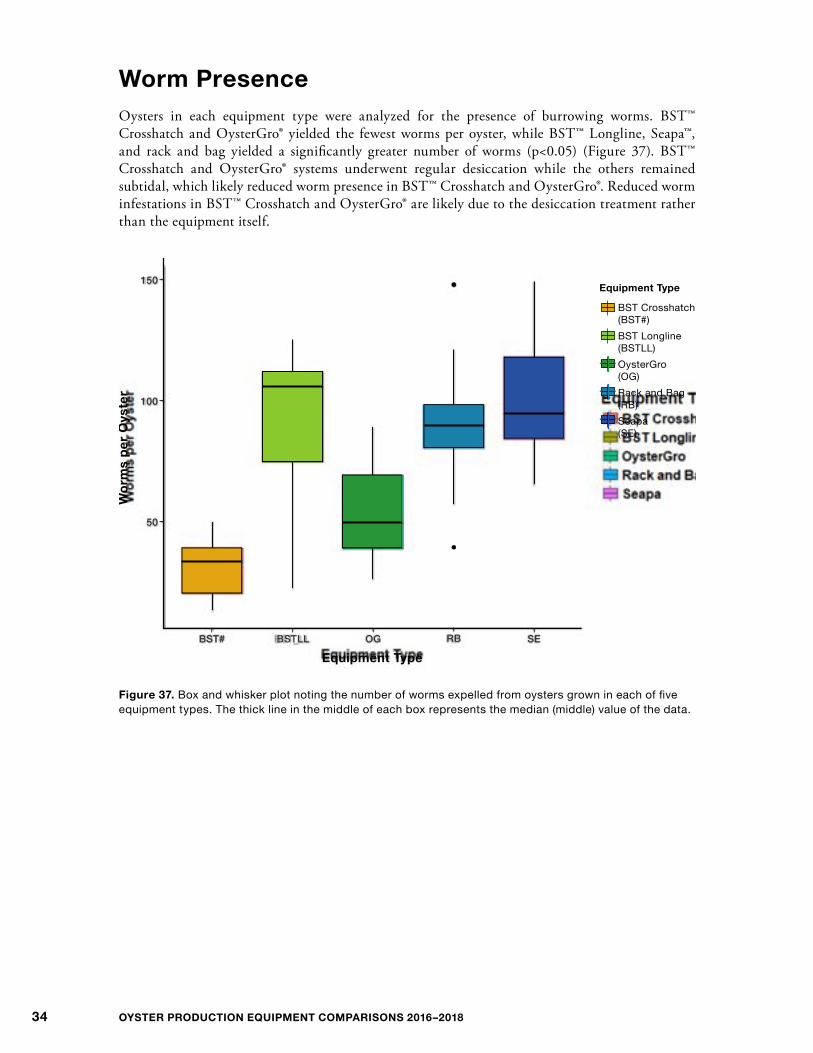
Worm PresenceOysters in each equipment type were analyzed for the presence of burrowing worms. BST™ Crosshatch and OysterGro® yielded the fewest worms per oyster, while BST™ Longline, Seapa™, and rack and bag yielded a significantly greater number of worms (p<0.05) (Figure 37). BST™ Crosshatch and OysterGro® systems underwent regular desiccation while the others remained subtidal, which likely reduced worm presence in BST™ Crosshatch and OysterGro®. Reduced worm infestations in BST™ Crosshatch and OysterGro® are likely due to the desiccation treatment rather than the equipment itself.
Wor
ms
per
Oys
ter
50
100
150
Equipment TypeBST# BSTLL OG RB SE
BST Crosshatch (BST#)BST Longline(BSTLL)OysterGro(OG)Rack and Bag(RB)Seapa(SE)
Equipment Type
Figure 37 . Box and whisker plot noting the number of worms expelled from oysters grown in each of five equipment types. The thick line in the middle of each box represents the median (middle) value of the data.
35RESULTS
Cost Estimates
Capital Costs and Installation
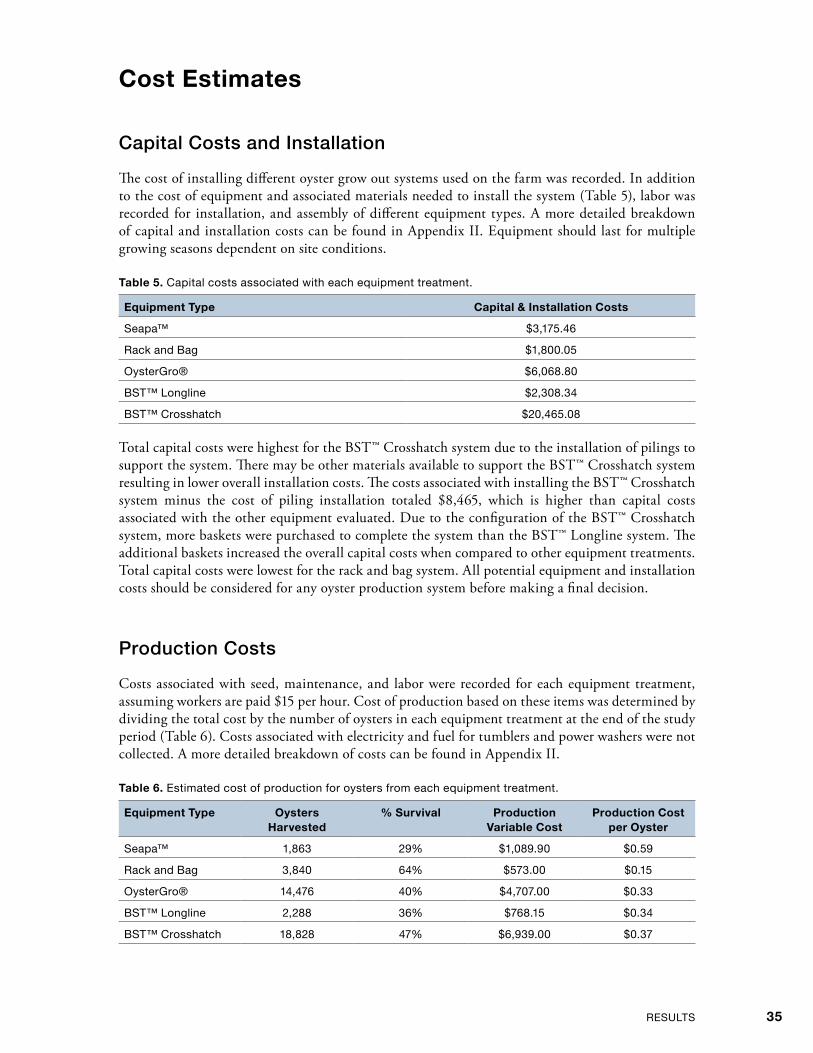
The cost of installing different oyster grow out systems used on the farm was recorded. In addition to the cost of equipment and associated materials needed to install the system (Table 5), labor was recorded for installation, and assembly of different equipment types. A more detailed breakdown of capital and installation costs can be found in Appendix II. Equipment should last for multiple growing seasons dependent on site conditions.
Table 5 . Capital costs associated with each equipment treatment.
Equipment Type Capital & Installation Costs
Seapa™ $3,175.46
Rack and Bag $1,800.05
OysterGro® $6,068.80
BST™ Longline $2,308.34
BST™ Crosshatch $20,465.08
Total capital costs were highest for the BST™ Crosshatch system due to the installation of pilings to support the system. There may be other materials available to support the BST™ Crosshatch system resulting in lower overall installation costs. The costs associated with installing the BST™ Crosshatch system minus the cost of piling installation totaled $8,465, which is higher than capital costs associated with the other equipment evaluated. Due to the configuration of the BST™ Crosshatch system, more baskets were purchased to complete the system than the BST™ Longline system. The additional baskets increased the overall capital costs when compared to other equipment treatments. Total capital costs were lowest for the rack and bag system. All potential equipment and installation costs should be considered for any oyster production system before making a final decision.
Production Costs
Costs associated with seed, maintenance, and labor were recorded for each equipment treatment, assuming workers are paid $15 per hour. Cost of production based on these items was determined by dividing the total cost by the number of oysters in each equipment treatment at the end of the study period (Table 6). Costs associated with electricity and fuel for tumblers and power washers were not collected. A more detailed breakdown of costs can be found in Appendix II.
Table 6 . Estimated cost of production for oysters from each equipment treatment.
Equipment Type Oysters Harvested
% Survival Production Variable Cost
Production Cost per Oyster
Seapa™ 1,863 29% $1,089.90 $0.59
Rack and Bag 3,840 64% $573.00 $0.15
OysterGro® 14,476 40% $4,707.00 $0.33
BST™ Longline 2,288 36% $768.15 $0.34
BST™ Crosshatch 18,828 47% $6,939.00 $0.37

36 OYSTER PRODUCTION EQUIPMENT COMPARISONS 2016–2018
Oysters produced in the Seapa™ system had the highest cost of production, while those produced in the rack and bag system had the lowest cost of production. Due to the experimental nature of this project, oysters were handled and processed more often than would be expected on a commercial farm. Each processing event likely took longer due to measuring individual oysters and restocking at consistent volumes. Caution should be exercised when using the production cost per oyster as all costs were not collected (i.e., electricity, equipment fuel, costs associated with labor beyond wages), which would alter these numbers in a commercial setting. However, the costs presented give a general idea of the production cost for each equipment type.

37DISCUSSION
DISCUSSION
Many factors should be considered when planning an oyster aquaculture operation. Growth, condition index, morphology, and worm presence are factors farmers should consider in managing their businesses. Inputs including supplies, labor, and equipment are critical in maintaining profitability. In addition, the demands of the intended markets are key factors to consider. This study has shown there are differences in morphology for oysters depending on the equipment used for grow out. In addition, there are differences in the capital and installation costs associated with each equipment type. As noted in Parker et al. (2020), labor is a significant cost when producing oysters in the water column in Maryland. Production costs varied among equipment types primarily based on labor associated with routine maintenance and desiccation of oysters in various systems.
BST™ Crosshatch
Installation and Operation Notes
Installation of the BST™ Crosshatch system required a large up-front capital investment, a permitting process, and the use of a contractor with specialized equipment to install the pilings. Following installation of the pilings, lines were installed using a come-along and Klein grip, which are readily available and do not require specialized training. Basket construction is made much easier when the baskets can warm in the sun prior to bending them into shape. This process was tedious at first but became much more streamlined after building the first few baskets. A consistent orientation of clips on each side of the baskets will expedite their attachment and removal from lines. Clips must be securely attached to lines or baskets will fall and hang from only one side. Over time, clips broke readily (both the clips on the baskets and the clips that secure lines to PVC support posts). Bringing an extra supply of clips along is recommended when working with this equipment type in order to save time. Based on the experience of the HPLDF, baskets should not be placed immediately adjacent to a PVC support post. A minimum of 10 inches should be left between the basket and support post to keep the basket from chaffing the PVC, and to allow space for a worker’s hand to grab the line in order to move it to a higher position for desiccation. Moving the lines to a higher position requires two able-bodied individuals, but everyday operation of the system (collecting and deploying baskets) can be undertaken by one person.
Production Notes
Oysters grown in the BST™ Crosshatch system were among the fastest growing in the 2016 season, but slowed over time. This may be due to the desiccation of the oysters, which reduced time spent in the water to feed. It is also possible that oysters in this system received additional jostling due to their position in the water column and weekly movement to a higher position, which may have chipped off new growth and resulted in reduced shell height. While growth in shell height was reduced over time, overall morphology of oysters grown in the BST™ Crosshatch system was generally favorable, according to the shape measurements used in this analysis. Worm infestation was significantly reduced in the BST™ Crosshatch system, with oysters grown in this system yielding the fewest worms of all systems employed.

38 OYSTER PRODUCTION EQUIPMENT COMPARISONS 2016–2018
BST™ Longline
Installation and Operation Notes
The BST™ Longline baskets attach to their line via two swivel clips along the top of the basket. Since these clips swivel into place (as opposed to fully latching with a closed hook), it is critical that the appropriate sized line is used with this system. Using a line that is too large or too small will result in baskets not attaching securely to the line, and coming loose from their lines. The monofilament/dripper tube line provided by BST is sized correctly for these baskets and should be utilized in their operation. The clips for this line appear to be sturdier than those used in the crosshatch orientation and did not break over time. This system can be operated by a single individual.
Production Notes
In their first year of growth, oysters in the BST™ Longline system grew more slowly than other systems employed, but growth increased in the 2017 season. Their morphology was generally favorable compared to other systems employed. The condition index of oysters grown in the BST™ Longline system was significantly higher than that of oysters grown in the rack and bag system, indicating that the oysters in the BST™ Longline system have a greater meat yield than the rack and bag. They had more worms per oyster than the desiccated systems, which we believe to be a product of their subtidal exposure. A desiccated BST™ Longline oyster may have reduced worm infestation, but this cannot be determined at this time.
OysterGro®
Installation and Operation Notes
OysterGro® cages should be securely clipped to a longline using strong guy-lines and swordfish/longline clips on either side (Figure 12). Surface waves lead to pulling on the clips and lines and a reduced quality line will soon be recognized via an untethered cage. Guy-lines should be long enough to allow the cage to be flipped, but not excessively long. Cages should be spaced to avoid cages bumping into one another; this can be achieved with the help of appropriately sized guy-lines. If ice is a possibility in the winter months, it is recommended that oysters not remain in the floating OysterGro® cages. If sinking cages over the winter to avoid ice, caps should be removed to allow the pontoons to fill with water, but caps should then be replaced to prevent the pontoons filling with sediment. Submerged OysterGro® cages may sink into soft or muddy bottom, leading to difficulty in springtime retrieval. Conversely, OysterGro® cages on a harder bottom may have a tendency to flip, leaving the cage of oysters on the bottom instead of the pontoons. It is recommended that sunken OysterGro® cages be checked regularly to ensure proper orientation and operation. A single individual can achieve daily operation (removing and replacing bags of oysters by wading in the water), but two able-bodied individuals are required in order to flip a cage for desiccation, or to hoist a cage to a position where bags can be accessed from a vessel.

39DISCUSSION
Production Notes
In the 2016 season, oysters grown in the OysterGro® system were among the fastest growing, but grew slower than other systems in subsequent years. This may be due to the desiccation of the oysters, which reduced time spent in the water to feed. It is also possible that oysters in this system received additional jostling due to their position in the water column and weekly movement to a higher position, which may have chipped off new growth and resulted in reduced shell height. While growth in shell height was reduced compared to other systems, the OysterGro® resulted in the only significant interaction in terms of morphology (width index), yielding the most favorably shaped oyster. Further, worm presence was reduced in the OysterGro® oysters, but not as much as the oysters in the BST™ Crosshatch system, which experienced more desiccation.
Rack and Bag
Installation and Operation Notes
Vexar® bags must be securely fastened to rebar racks using a marine-grade rubber tarp-strap and a fastener or hook designed for use in seawater. Small mesh bags (below 4 mm) are not recommended for use with the rack and bag system because they lack the rigidity required to stay in place on the racks. Appropriate tension must be applied to all four corners of each bag to ensure they remain in place and do not chafe along the racks. Racks should be examined periodically to ensure that welds are holding and that the racks have not become compromised. Water depth should be considered when placing a rack and bag system. Their operation requires the farmer to reach down and manually unhook the tarp straps in order to free the bags. If the water is too deep, the farmer may be required to dive, which can be unpleasant and inefficient at commercial scale. Intertidal or shallow areas are better suited to this system than deeper areas, but winter low tides and ice must be considered. This system can be operated by a single individual.
Production Notes
Oysters grown in the rack and bag system consistently yielded fast growth and ranked among systems with the most growth compared to other equipment types employed in this study. Shell shape was generally favorable according to the shape analyses conducted in this study. While growth was rapid for oysters in the rack and bag, their condition index was inferior to two other subtidal systems, the BST Longline, and the Seapa system. Additionally, oysters grown in this system had many worms per oyster, especially when compared with desiccated treatments. It is possible that in an area with greater tidal flux, oysters grown in the rack and bag system will experience enough daily desiccation to reduce worm infestation. However, that cannot be fully assessed at this time.

40 OYSTER PRODUCTION EQUIPMENT COMPARISONS 2016–2018
Seapa™
Installation and Operation Notes
Seapa™ baskets can be attached to a range of line sizes, including the manufacturer recommended monofilament/dripper tube as well as marine nylon lines. Clips along the top of each basket fully clasp onto the line, yielding a strong and secure tether to their line. It is important to utilize the retention clips recommended by Seapa in order to minimize chaffing on the line and on the top of the clip itself. The absence of the retention clips can lead to the top of the clips wearing down to a point where they may break free from the line. Basket construction is easier when the materials have been left in the sun to warm prior to shaping. Further, some found it simple to employ a piece of 2x4 wood to bend the baskets around to encourage them to take on a rounded shape. Preparation of the line requires threading the heavy monofilament line through the rubber dripper tube. The addition of WD-40 to the inside of the dripper tube prior to threading will ease the process.
Production Notes
Oysters grown in the Seapa™ system grew less than other systems in the 2016 season, then rapidly in subsequent years, ending the growing period as the largest oysters on the farm. Their morphology was generally favorable, but they were found to have a significantly reduced shape when compared with oysters grown in the OysterGro® (Width Index analysis only). The condition index of oysters grown in the Seapa™ system was significantly higher than that of those grown in the rack and bag system, indicating that oysters grown in the Seapa™ system have a higher meat yield. As with other subtidal systems, oysters in the Seapa™ system had high worm infestation, but this is likely due to a lack of desiccation. Desiccated Seapa™ baskets may yield oysters with reduced worm presence but that cannot be assessed at this time. A single individual can operate the Seapa™ system.
CaveatsWhile not explicitly addressed here, for all systems, secure anchoring mechanisms are critical and should be assessed based on local site conditions, including fetch, wind, and current. It must be noted that site conditions can vary among seasons, so a quiescent summer should not lead one to assume that other seasons will also be calm. Notes on directions of exposure and seasonal conditions should be recorded and will be useful in planning a successful operation.
Based on results of this analysis, there are positive and negative effects that accrue to each equipment type. Results are specific to this study site and in the years conducted. Other results may be found with spatial and temporal variation. Please contact the authors for additional discussion or with specific questions.

41LITERATURE CITED
LITERATURE CITED
Blake, J.A., Evans, J.W., 1973. Polydora and related genera as borers in mollusk shells and other calcareous substrates. The Veliger 15(3), 235–249.
Brake, J.; Evans, F.; Langdon, C. 2003. Is beauty in the eye of the beholder? Development of a simple method to describe desirable shell shape for the Pacific oyster industry. Journal of Shellfish Research 22(767–771).
Davis, J.E. 2013. Effects of basket arrangement and stocking density when using the adjustable long-line system for oyster grow-out. Masters thesis, Auburn University, Alabama.
Galtsoff, P.S. 1964. The American Oyster Crassostrea virginica Gmelin. Fishery Bulletin of the Fish and Wildlife Service. Vol 64.
Gamble, C.R. 2016. An evaluation of the floating cage system for Eastern oyster (Crassostea virginica) aquaculture production in the North-Central Gulf of Mexico. Masters thesis, University of Akureyri, Iceland.
Gryder, D.K., 2002. Control of mud blister formation in oysters. Final Report: Virginia Fishery Resource Grant Program. FRG-00-05
Lawrence, D.R.; Scott, G.I. 1982. The determination and use of condition index of oysters. Estuaries and Coasts 5, 23–27.
Mizuta, D.D.; Wikfors, G.H. 2018. Seeking the perfect oyster shell: a brief review of current knowledge. Reviews in Aquaculture.
Ogle, D.H., P. Wheeler, Dinno, A., 2018. FSA: Fisheries Stock Analysis. R package version 0.8.22.
Parker, M.; Lipton, D.; Harrell, R. , 2020.Impact financing and aquaculture: Maryland oyster aqua-culture profitability. Journal of the World Aquaculture Society, 1–22.
Read, G.B., 2010. Comparison and history of Polydora websteri and P. haswelli (Polychaeta: Spionidae) as mud-blister worms in New Zealand shellfish. New Zealand Journal of Marine and Freshwater Research 44(2), 83–100.
RStudio Team (2015). RStudio: Integrated Development for R. RStudio, Inc., Boston, MA URL www.rstudio.com. Version 3.4.1.
Thomas, L.L., Allen, S.K., Plough, L.V. 2019. The effect of aquaculture gear on the growth and shape of the oyster Crassostrea virginica during a “finishing” period in Chesapeake Bay, USA. Aquaculture. doi.org/10.1016/j.aquaculture.2019.03.061
Walton, W.C.; Davis, J.E.; Chaplin, G.I.; Rikard, F.S.; Hanson, T.R.; Swann, L. 2012. Off bottom oyster farming. Alabama Cooperative Extension, Fisheries & Aquaculture Series.

42 OYSTER PRODUCTION EQUIPMENT COMPARISONS 2016–2018
Ward, R.D.; Thompson, P.A.; Appleyard, S.A.; Swan, A.A.; Kube, P.D. 2005. Sustainable genetic improvement of Pacific oysters in Tasmania and South Australia. Final Report FDRC Project 2000/206. CSIRO Marine and Atmospheric Research, and Fisheries Research and Development Corporation, Australia. 193 p.
Wargo, R.N., Ford, S.E., 1993. The effect of shell infestation by Polydora sp. and infection by Haplosporidium nelsoni (MSX) on the tissue condition of oysters, Crassostrea virginica. Estuaries 16, 229–234.
Wei, A. 2019. Chesapeake Bay Mean Surface Salinity 1985–2018. Chesapeake Bay Program.
Wickham, H. ggplot2: Elegant Graphics for Data Analysis. Springer-Verlag New York, 2016.

43APPENDIX I
APPENDIX I
Equipment Types and Abbreviations
A . BST™ Crosshatch (BST#)A tensioned Australian longline system where baskets are attached to two lines, like rungs on a ladder.
B . BST™ Long Line (BSTLL)A floating Australian longline system.
C . OysterGro® (OG)A flippable floating cage system housing four, six, or nine bags per cage.
E . Seapa™ (SE)A floating Australian longline system.
D . Rack and Bag (RB)A subtidal method consisting of bags secured to rebar racks, held ~10 inches off the seafloor.

44 OYSTER PRODUCTION EQUIPMENT COMPARISONS 2016–2018
APPENDIX II
Detailed Capital, Installation, and Production Costs for Horn Point Laboratory Demonstration Oyster Farm
Table 7 . Capital items purchased for HPL demonstration oyster farm use allocated equally across production systems.
Item # Cost per unit* Total Cost*
Sledgehammer 1 $39.00 $39.00
Buoys 20 $5.00 $100.00
Dive skins 2 $30.00 $60.00
Rubber Mallet 2 $10.00 $20.00
Power Washer 1 $3,000.00 $3,000.00
Total $3,219 .00
Total shared cost allocated to each system $643 .80
*2016 US Dollars

45APPENDIX II
Table 8 . Capital, installation, and production cost for Seapa™ System.
Capital & Installation Costs
Item Unit # $ per Total Cost
Materials
Pods - 15L, 12 mm each 80 $7.30 $584
Pods - 15L, 6 mm each 12 $8.62 $103
Pods - 15L, 3 mm each 8 $12.79 $102
End caps - no door 12 mm - streamline 600
each 80 $2.15 $172
End caps - w/ door 12 mm - streamline 600
each 80 $2.98 $238
End caps - no door 6 mm - streamline 600
each 12 $2.30 $28
End caps - w/ door 6 mm - streamline 600
each 12 $3.15 $38
End caps - no door 3 mm - premium 600
each 8 $4.30 $34
Endcaps - w/ door 3 mm - premium 600
each 8 $5.20 $42
Flexi clip 20 mm each 160 $2.53 $405
Clamp Bearing 11 mm Assembly each 160 $2.08 $333
Buoys each 40 $5.00 $200
Augers each 4 $35.00 $140
Shared materials $644
Labor
Line Installation hour 7.5 $15.00 $113
Total Capital and Installation Costs $3,175
Production Costs
Item Unit # $ per Total Cost
Cost per oyster
harvested
Seed Cost
per 1000
6.4 $13.50 $86 $0.046
Labor
Seed Deployment hour 0.1 $15.00 $2 $0.001
Processing Hour 55.7 $15.00 $836 $0.448
Maintenance Hour 11.1 $15.00 $167 $0.089
Total Production Costs $1,090 $0 .59
46 OYSTER PRODUCTION EQUIPMENT COMPARISONS 2016–2018
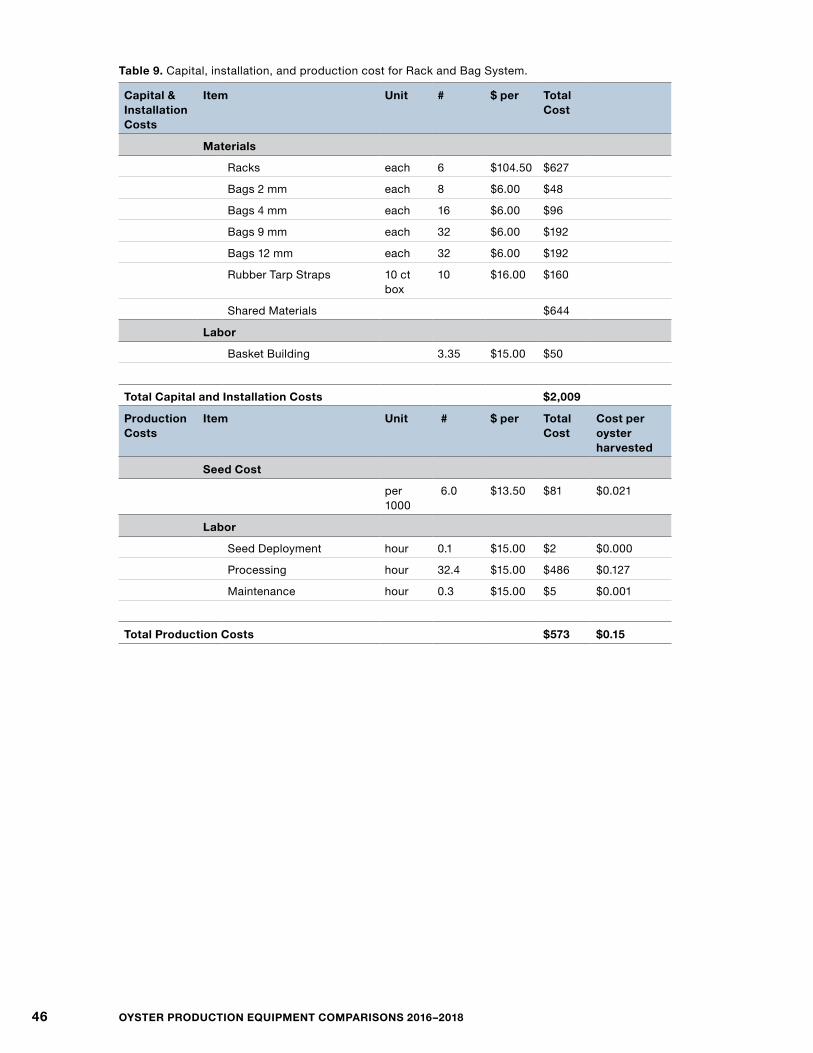
Table 9 . Capital, installation, and production cost for Rack and Bag System.
Capital & Installation Costs
Item Unit # $ per Total Cost
Materials
Racks each 6 $104.50 $627
Bags 2 mm each 8 $6.00 $48
Bags 4 mm each 16 $6.00 $96
Bags 9 mm each 32 $6.00 $192
Bags 12 mm each 32 $6.00 $192
Rubber Tarp Straps 10 ct box
10 $16.00 $160
Shared Materials $644
Labor
Basket Building 3.35 $15.00 $50
Total Capital and Installation Costs $2,009
Production Costs
Item Unit # $ per Total Cost
Cost per oyster harvested
Seed Cost
per 1000
6.0 $13.50 $81 $0.021
Labor
Seed Deployment hour 0.1 $15.00 $2 $0.000
Processing hour 32.4 $15.00 $486 $0.127
Maintenance hour 0.3 $15.00 $5 $0.001
Total Production Costs $573 $0 .15

47APPENDIX II
Table 10 . Capital, installation, and production cost for OysterGro® System.
Capital & Installation Costs
Item Unit # $ per Total Cost
Materials
Cage each 20 $150.00 $3,000
Bags each 214 $6.00 $1,284
Line 1200 ft roll
1 $113.50 $114
Longline Clips each 40 $1.10 $44
Heavy Nylon Ball each 1 $24.50 $25
Freight Delivery each 1 $150.00 $150
Shared Materials $644
Labor
Line Installation hour 42 $15.00 $630
Equipment Assembly 20 $15.00 $300
Total Capital and Installation Costs $6,190 $309 .49
Production Costs
Item Unit # $ per Total Cost
Cost per oyster harvested
Seed Cost
per 1000
36.0 $13.50 $486 $0.034
Labor
Seed Deployment hour 0.75 $15.00 $11 $0.001
Desiccation Labor hour 40.8 $15.00 $612 $0.042
Processing hour 233.75 $15.00 $3,506 $0.242
Maintenance hour 6.1 $15.00 $92 $0.006
Total Production Costs $4,707 $0 .33

48 OYSTER PRODUCTION EQUIPMENT COMPARISONS 2016–2018
Table 11 . Capital, installation, and production cost for BST™ Longline System.
Capital & Installation Costs
Item Unit # $ per Total Cost
Materials
12 mm baskets each 34 $13.41 $456
6 mm baskets each 10 $14.56 $146
Clips 3 per bag
100 $0.98 $98
Line ft 40 $1.72 $68
Riser Posts each 16 $5.78 $92
Riser Post Clips each 48 $0.69 $33
Buoys each 40 $5.00 $200
Augers each 4 $35.00 $140
Shared materials $644
Labor
Line & Pole Installation hour 27.75 $15.00 $416
Basket Building 1 $15.00 $15
Total Capital and Installation Costs $2,308
Production Costs
Item Unit # $ per Total Cost Cost per oyster
harvested
Seed Cost
per 1000 6.4 $13.50 $86 $0.038
Labor
Seed Deployment hour 0.1 $15.00 $2 $0.001
Processing hour 39.25 $15.00 $589 $0.257
Maintenance hour 6.1 $15.00 $92 $0.040
Total Production Costs $768 $0 .34

49APPENDIX II
Table 12 . Capital, installation, and production cost for BST™ Crosshatch System.
Capital & Installation Costs
Item Unit # $ per Total Cost
Materials
12 mm baskets each 250 $13.41 $3,353
6 mm baskets each 12 $14.56 $175
Clips 3 per bag
783 $0.69 $540
Pilings and Installation each 40 $300.00 $12,000
Line ft 293 $1.72 $503
Riser Posts each 96 $5.78 $555
Riser Post Clips each 288 $0.69 $199
Screws 100 ct box
10 $18.49 $185
Shared materials $644
Labor
Line & Pole Installation hour 136 $15.00 $2,040
Basket Building 17 $16.00 $272
Total Capital and Installation Costs $20,465
Production Costs
Item Unit # $ per Total Cost Cost per oyster
harvested
Seed Cost
per 1000
40 $13.50 $540 $0.029
Labor
Seed Deployment hour 0.75 $15.00 $11 $0.001
Desiccation Labor hour 117.75 $15.00 $1,766 $0.094
Processing hour 300.5 $15.00 $4,508 $0.239
Maintenance hour 7.6 $15.00 $114 $0.006
Total Production Costs $6,939 $0 .37


![[UMCES] CBL 11 043 Costs of Stormwater Management ...](https://static.fdocuments.us/doc/165x107/61a02188ad1292332e19e463/umces-cbl-11-043-costs-of-stormwater-management-.jpg)