Ulusoy Electriculusoyelektrik.com.tr/Uploads/Other/PageDocument/3q17-yatirimci... · November 2017...
27
Ulusoy Electric Q3’ 17 Results November 2017
Transcript of Ulusoy Electriculusoyelektrik.com.tr/Uploads/Other/PageDocument/3q17-yatirimci... · November 2017...

Ulusoy ElectricQ3’ 17 Results
November 2017

Enis UlusoyVice Chairman

Table of
Contents
Q3’17 Highligts
Sector and Ulusoy Elektrik
Financials
5
8
18

Q3’17 Highlights

November 2017 Q3’17 Results
Q3’17 Highlights
5
• All time highest revenue since establishment, (excluding strongest last quarter)
• Increase in margins continuing , 26,3 % EBITDA
• Higher domestic demand leading boost in prices ( appx. 10% increase)
• Capacity increase with system improvements, additional shifts, machine and mould investments (< 1M USD)
• Diversified Exports, Indonesia & Algeria homologation files completed, new countries in the radar; Egypt, Azerbaijan & Saudi Arabia
• Strong Order Book for the upcoming quarters
• Free float increased to 21,6%

Sector and Ulusoy Elektrik

November 2017 Q3’17 Results
Sector (Domestic)
7
ELECTRICITY DISTRIBUTION COMPANIES
Investment Implementation PeriodInvestmentBudget (TL)
2006-2010 (before privatization) 550 M
2011-2015 3,69 B
2016-2020 18,4 B2016 (official investment result) 3,7 B
Q3’16 Dist.Co. Sales Q3’17 Dist.Co. Sales
24.1 M TL 47.0 M TL % 95
*2017 expectation + 4 Billion
Q2 31,1 MTL

November 2017 Q3’17 Results
Sector (Domestic)
8
RETAILERS
Q3’16 Retailers Sales Q3’17 Retailers Sales
8.5 M TL 29.3 M TL % 245
• Positive Economic Environment• Residential & Industrial Investments• New Distributors
Q2 20,9 MTL

November 2017 Q3’17 Results
Sector (Domestic)
9
DIRECT SALES
Q3’16 Direct Sales Q3’17 Direct Sales
13.9 M TL 33,9 M TL % 144
• Solar & Wind Electricity Generation Projects • 500 MW Wind Project in the coming 5 years (already been awarded)• 1000MW YEKA tender (generation & turbine production)
Q2 31,8 MTL

November 2017 Q3’17 Results
Sector (Domestic)
10
DOMESTIC REVENUE BREAKDOWN BY CUSTOMER SEGMENTS
52%18%
30%
Q3’16
Dist.Co. Retailers
Direct Sales
110.2 M TL 46.5 M TL
% 139
43%
27%
30%
Q3’17
Dist. Co. Retailers
Direct Sales

November 2017 Q3’17 Results
Sector (Export)
11
• Diversified and Sustainable Export• Transformer as a driving force for export markets• Indonesia & Algeria local Certifications Completed• New markets; KSA, Egypt & Azerbaijan• Strong order intake and 2018 expectations
Q3’17
41%
9%7%5%4%
4%
4%
4%
4%19%
JORDAN IRAQMOROCCO AFGHANISTANUKRAINE IRANETHIOPIA SENEGALFINLAND GEORGIAOTHER 17 COUNTRIES
47%
13%
7%
6%
4%
4%
3% 15%
SUDAN TURKMENISTAN
LITHUANIA TUNISIA
PALESTINE MOROCCO
GEORGIA OTHER 11 COUNTRIES
Q3’16

November 2017 Q3’17 Results
Sector (Export)
12
EXPORT REVENUES
Q3’ 17Q2’ 17
17.2 M 12.9 M-%25
9M’16 9M’17
28.6 M 48.8 M% 71

November 2017 Q3’17 Results
Revenue Breakdown
13
TL mn Q3'16 Q3'17 change
Cable Accessories 1,5 2,0 33%Concrete Compact Substations 6,6 13,7 108%
Distribution Transformers 2,5 10,2 313%
Metal Clad 1,3 3,9 192%
Metal Enclosed 25,1 64,0 155%
Other Sales(Trade Goods, Auxilary Materials) 10,1 13,4 30%Railway Overhead Line Equipments 0,3 1,6 427%
RMU 7,0 12,8 85%
Metal Compact Substations 0,1 - n.a.
Total 54,1 121,7 123%

November 2017 Q3’17 Results
TRANSFORMER FACTORY
14
*Varies on ratings and types
TRANSFORMER PRODUCTION UNITS
TRANSFORMER REVENUES (M TL)
48%52%domestic
export
AVG. UNIT PRICE*
20.527 TL5.800 USD
REVENUE BREAKDOWN
FY 2016 Q1’17 Q2’17 Q3’17 9M'17
863 173 699 641 1.513
FY 2016 Q1’17 Q2’17 Q3’17 9M'17
13 4,2 13,7 10,2 28,1

November 2017 Q3’17 Results
Strong Orderbook
15
2017 ORDER INTAKE
DOMESTIC EXPORT
72 M TL
Q1’17 Q2‘17 Q1’17 Q2’17
21.5 M TL19 M TL107.5 M TL
Q3’17 Q3’17
18.2 M TL132,7 M TL

Financials

November 2017 Q3’17 Results
Financial Review
17
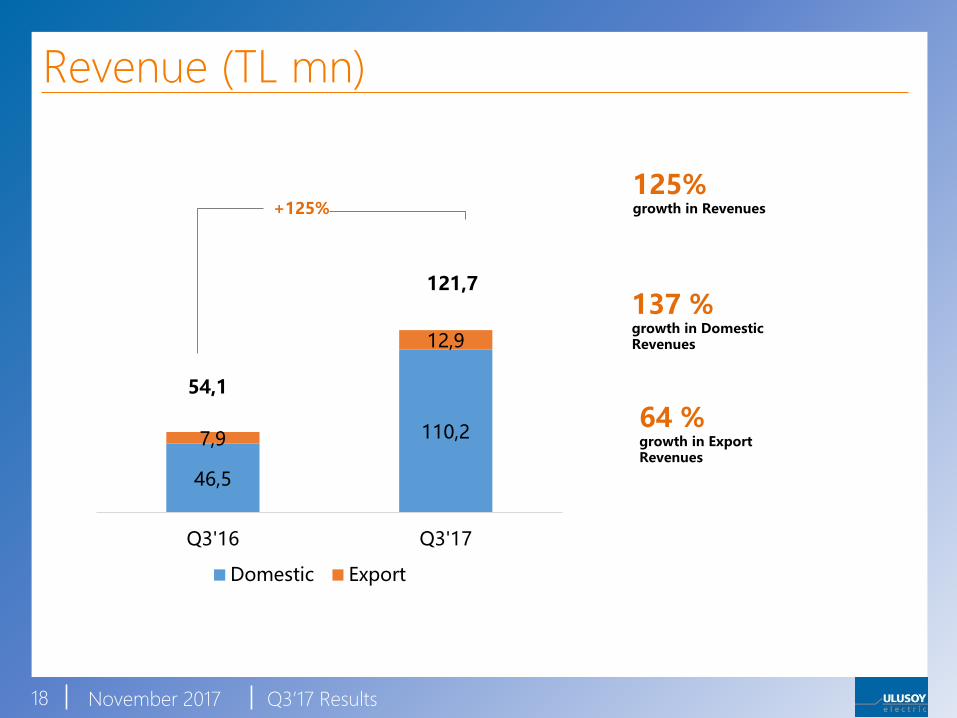
TL mn Q3'16 Q3'17 changeRevenues 54,1 121,7 125%Domestic 46,5 110,2 137%Export 7,9 12,9 64%Gross Profit 11,0 36,4 232%EBITDA 7,8 32,0 310%Net Income 5,5 25,3 356%
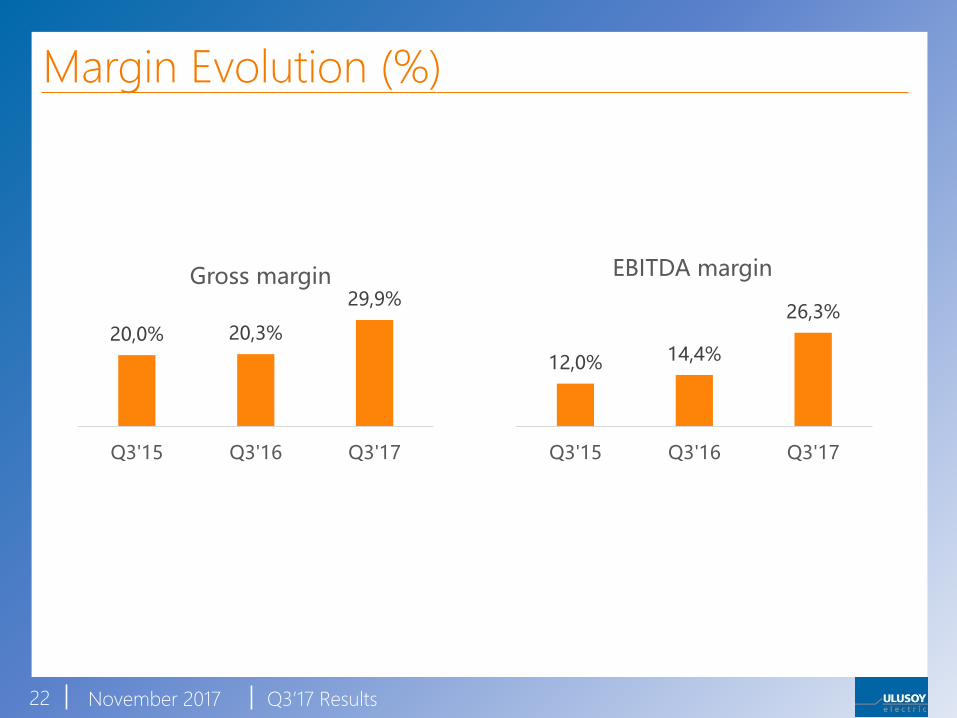
Gross Margin 20,3% 29,9% 47%EBITDA Margin 14,4% 26,3% 82%Net Margin 10,2% 20,8% 103%ROE 17,1% 44,6% 160%
Depreciation&Amortization 1,2 1,3 10%Net Debt Position -11,3 -15,0 33%CAPEX 0,6 1,4 119%
Current Ratio 1,8 2,6 41%Current Assets/Total Assets 0,6 0,7 21%Current Liabilities/Total Liabilities 1,0 1,0 n.a.Total Liabilities/Total Assets 0,33 0,29 -14%
November 2017 Q3’17 Results
46,5
110,27,9
12,9
0
50
100
150
Q3'16 Q3'17
Domestic Export
Revenue (TL mn)
18
121,7
54,1
+125%125% growth in Revenues
137 % growth in Domestic Revenues
64 % growth in Export Revenues

November 2017 Q3’17 Results
Revenue (TL mn) price vs volume
19
34,5
62,2
+7
+21
0,0
10,0
20,0
30,0
40,0
50,0
60,0
70,0
80,0
90,0
1Q16 Revenues Volume change Price change 1Q17 Revenues
TLm
n

November 2017 Q3’17 Results
Revenue (TL mn) price vsvolume
20
50,5
102,0
+10
+41
0,0
20,0
40,0
60,0
80,0
100,0
120,0
140,0
160,0
Q2'16 Revenues Volume change Price change Q2'17 Revenues
TLm
n

November 2017 Q3’17 Results
Revenue (TL mn) price vsvolume
21
54,6
121,5
+34
+33
0,0
20,0
40,0
60,0
80,0
100,0
120,0
140,0
160,0
180,0
Q3'16 Revenues Volume change Price change Q3'17 Revenues
TLm
n
November 2017 Q3’17 Results
Margin Evolution (%)
22
20,0% 20,3%
29,9%
Q3'15 Q3'16 Q3'17
Gross margin
12,0% 14,4%
26,3%
Q3'15 Q3'16 Q3'17
EBITDA margin

November 2017 Q3’17 Results
Quarterly Revenues Breakdown since 2012
23
1Q is the weakest while 4Q is the strongest quarters
25,631,7
26,9
47,843,3
65,570,4 74,2
55,1
43,6
30,7
47,6
24,232,1
42,645,6
35,1
50,254,1
88,4
67,1
99,5
121,7
0
20
40
60
80
100
120
140
1Q 2Q 3Q 4Q
Quarterly Revenues (TLmn)
2012 2013 2014 2015 2016 2017
• Since 2012, 1Q revenues constituted 19.9% of total sales during the year.
• Since 2012, 4Q revenues constituted 32.8% of total sales during the year.
November 2017 Q3’17 Results
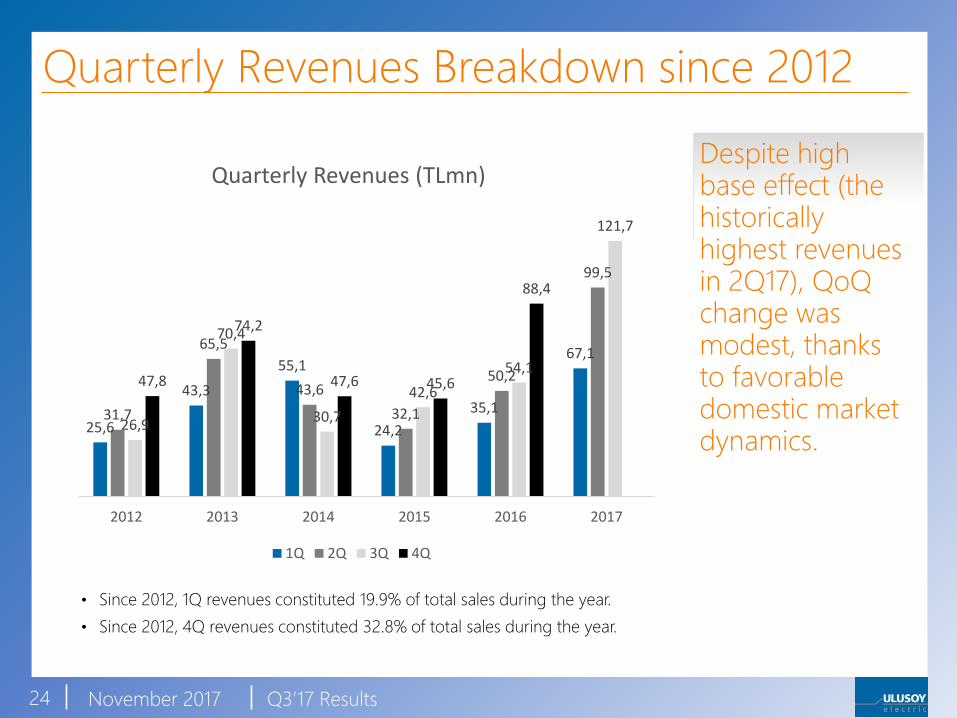
Quarterly Revenues Breakdown since 2012
24
Despite high base effect (thehistorically highest revenues in 2Q17), QoQchange was modest, thanks to favorable domestic market dynamics.
25,6
43,3
55,1
24,2
35,1
67,1
31,7
65,5
43,6
32,1
50,2
99,5
26,9
70,4
30,7
42,6
54,1
121,7
47,8
74,2
47,6 45,6
88,4
0
20
40
60
80
100
120
140
2012 2013 2014 2015 2016 2017
Quarterly Revenues (TLmn)
1Q 2Q 3Q 4Q
• Since 2012, 1Q revenues constituted 19.9% of total sales during the year.
• Since 2012, 4Q revenues constituted 32.8% of total sales during the year.

November 2017 Q3’17 Results
Quarterly Revenues Changes since 2013
25
-9%
-26%
-49%
-23%-24%
51%
-21%
33%43%
98,00%
7%
-30%
33%
8%
22,00%
5%
55%
7%
63%
-60%
-40%
-20%
0%
20%
40%
60%
80%
100%
120%
2013 2014 2015 2016 2017
Revenues change (Quarterly)
1Q 2Q 3Q 4Q
• On average, 2Q revenues declined by 27% QoQ since 2013.
• On average, 4Q revenues increased by 35% QoQ since 2013.

November 2017 Q3’17 Results
Shareholder Structure
Pre IPO Post IPO Current
26
70,0%
30,0%
Family Free Float
78,4%
21,6%
Family Free Float
53,0%
18,4%
14,3%
14,3%
Sait UlusoyAkgül UlusoyKubilay Hakkı UlusoyEnis Ulusoy

Thank YouFor further information please e-mail
or call Ulusoy Electric Investor Relations
at (+90 312 267 0712)