Ultrasound guidance and monitoring of laser-based fat removal
8
Lasers in Surgery and Medicine 40:680–687 (2008) Ultrasound Guidance and Monitoring of Laser-Based Fat Removal Jignesh Shah, MS, 1 Sharon Thomsen, MD, 1,2 Thomas E. Milner, PhD, 1 and Stanislav Y. Emelianov, PhD 1 * 1 Department of Biomedical Engineering, University of Texas at Austin, Austin, Texas 78712 2 Pathology for Physicists and Engineers, Sequim, Washington 98382 Background and Objectives: We report on a study to investigate feasibility of utilizing ultrasound imaging to guide laser removal of subcutaneous fat. Ultrasound imaging can be used to identify the tissue composition and to monitor the temperature increase in response to laser irradiation. Study Design/Materials and Methods: Laser heating was performed on ex vivo porcine subcutaneous fat through the overlying skin using a continuous wave laser operating at 1,210 nm optical wavelength. Ultrasound images were recorded using a 10 MHz linear array-based ultrasound imaging system. Results: Ultrasound imaging was utilized to differentiate between water-based and lipid-based regions within the porcine tissue and to identify the dermis-fat junction. Temperature maps during the laser exposure in the skin and fatty tissue layers were computed. Conclusions: Results of our study demonstrate the potential of using ultrasound imaging to guide laser fat removal. Lasers Surg. Med. 40:680–687, 2008. ß 2008 Wiley-Liss, Inc. Key words: laser therapy; ultrasound imaging; thermal imaging; treatment monitoring; fat removal; body reshaping INTRODUCTION Liposuction, also known as lipoplasty, is an invasive procedure for subcutaneous fat removal and body reshap- ing usually performed under local anesthesia [1]. Recent innovations in liposuction, including ultrasound and laser- assisted liposuction where fat is emulsified before applying suction [1–4], have lead to shorter treatment times and reduced scarring. Despite these advances, several dis- advantages associated with liposuction are recognized such as scarring, skin sagging, and risk of mortality [1,5,6]. Laser-based treatment for body sculpting or fat removal is a recently proposed non-invasive alternative to liposuction [7]. Selective laser heating can be achieved by utilizing an optical wavelength where the absorption by the target tissue is greater than the surrounding region [8]. Specifi- cally for fat treatments, the absorption of lipids at vibration bands near 915, 1,210, and 1,720 nm exceeds that of water [7]. Using 1,210 nm optical wavelength, temperature increases of > 208C were obtained and fat damage has been demonstrated through the overlying skin [7]. Prior to initiating laser therapy, knowledge of the laser dosimetry required to heat and remove the adipose tissue is required. However, the dermal-fat boundary can vary in depth from 0.5 to 4 mm while subcutaneous fat can have a thickness of a few centimeters [9]. Knowledge of the tissue composition and depth of the dermis-fat interface is useful information in selecting laser dosimetry (incident fluence, irradiation wavelength, pulse duration, and exposure time). The rupture of adipocytes has been observed in response to laser irradiation [2,3]. The mechanism leading to fat breakdown is dependent on both the heating time and the temperature increase [10,11]. During laser heating, non- specific thermal damage to the surrounding tissue is possible and may lead to scarring. For efficacious laser treatment, protecting surrounding tissue structures is essential while ensuring damage to target tissues. A need is recognized for a diagnostic imaging technique to identify the tissue composition before laser therapy and monitor the depth-resolved temperature increase during therapy. Ultrasound is a real-time, non-invasive imaging modal- ity that is typically employed in the diagnosis of tissue abnormalities and identification of pathological tissue [12,13]. Ultrasound imaging has also been utilized for tissue characterization based on temperature dependent changes of the speed of sound in tissue [14,15]. In addition, ultrasound imaging has been recently proposed to monitor the temperature increase in response to laser irradiation [16–18]. We report on experiments to test the feasibility of using ultrasound imaging to guide laser fat removal. A laboratory setup consisting of an ultrasound imaging system inter- faced with a continuous wave laser was assembled. Experi- ments were performed on ex vivo porcine subcutaneous fat through the overlying epidermis and dermis. Results of the experiments provide data to test the feasibility of using ultrasound imaging both to identify the dermis-fat junction and to monitor the temperature increase during therapy. Contract grant sponsor: National Institutes of Health; Contract grant numbers: EB008101, EB004963. *Correspondence to: Stanislav Y. Emelianov, PhD, Department of Biomedical Engineering, University of Texas at Austin, Austin, TX 78712. E-mail: [email protected] Accepted 15 October 2008 Published online in Wiley InterScience (www.interscience.wiley.com). DOI 10.1002/lsm.20726 ß 2008 Wiley-Liss, Inc.
-
Upload
jignesh-shah -
Category
Documents
-
view
214 -
download
0
Transcript of Ultrasound guidance and monitoring of laser-based fat removal

Lasers in Surgery and Medicine 40:680–687 (2008)
Ultrasound Guidance and Monitoring of Laser-BasedFat Removal
Jignesh Shah, MS,1 Sharon Thomsen, MD,1,2 Thomas E. Milner, PhD,1 and Stanislav Y. Emelianov, PhD1*
1Department of Biomedical Engineering, University of Texas at Austin, Austin, Texas 787122Pathology for Physicists and Engineers, Sequim, Washington 98382
Background and Objectives: We report on a studyto investigate feasibility of utilizing ultrasound imagingto guide laser removal of subcutaneous fat. Ultrasoundimaging can be used to identify the tissue composition andto monitor the temperature increase in response to laserirradiation.Study Design/Materials and Methods: Laser heatingwas performed on ex vivo porcine subcutaneous fat throughthe overlying skin using a continuous wave laser operatingat 1,210 nm optical wavelength. Ultrasound images wererecorded using a 10 MHz linear array-based ultrasoundimaging system.Results: Ultrasound imaging was utilized to differentiatebetween water-based and lipid-based regions within theporcine tissue and to identify the dermis-fat junction.Temperature maps during the laser exposure in the skinand fatty tissue layers were computed.Conclusions: Results of our study demonstrate thepotential of using ultrasound imaging to guide laser fatremoval. Lasers Surg. Med. 40:680–687, 2008.� 2008 Wiley-Liss, Inc.
Key words: laser therapy; ultrasound imaging; thermalimaging; treatment monitoring; fat removal; body reshaping
INTRODUCTION
Liposuction, also known as lipoplasty, is an invasiveprocedure for subcutaneous fat removal and body reshap-ing usually performed under local anesthesia [1]. Recentinnovations in liposuction, including ultrasound and laser-assisted liposuction where fat is emulsified before applyingsuction [1–4], have lead to shorter treatment times andreduced scarring. Despite these advances, several dis-advantages associated with liposuction are recognizedsuch as scarring, skin sagging, and risk of mortality[1,5,6]. Laser-based treatment for body sculpting or fatremoval is a recently proposed non-invasive alternative toliposuction [7].
Selective laser heating can be achieved by utilizing anoptical wavelength where the absorption by the targettissue is greater than the surrounding region [8]. Specifi-cally for fat treatments, the absorption of lipids at vibrationbands near 915, 1,210, and 1,720 nm exceeds that ofwater [7]. Using 1,210 nm optical wavelength, temperatureincreases of > 208C were obtained and fat damage has beendemonstrated through the overlying skin [7].
Prior to initiating laser therapy, knowledge of the laserdosimetry required to heat and remove the adipose tissue isrequired. However, the dermal-fat boundary can vary indepth from 0.5 to 4 mm while subcutaneous fat can have athickness of a few centimeters [9]. Knowledge of the tissuecomposition and depth of the dermis-fat interface is usefulinformation in selecting laser dosimetry (incident fluence,irradiation wavelength, pulse duration, and exposuretime).
The rupture of adipocytes has been observed in responseto laser irradiation [2,3]. The mechanism leading to fatbreakdown is dependent on both the heating time and thetemperature increase [10,11]. During laser heating, non-specific thermal damage to the surrounding tissue ispossible and may lead to scarring. For efficacious lasertreatment, protecting surrounding tissue structures isessential while ensuring damage to target tissues. A needis recognized for a diagnostic imaging technique to identifythe tissue composition before laser therapy and monitor thedepth-resolved temperature increase during therapy.
Ultrasound is a real-time, non-invasive imaging modal-ity that is typically employed in the diagnosis of tissueabnormalities and identification of pathological tissue[12,13]. Ultrasound imaging has also been utilized fortissue characterization based on temperature dependentchanges of the speed of sound in tissue [14,15]. In addition,ultrasound imaging has been recently proposed to monitorthe temperature increase in response to laser irradiation[16–18].
We report on experiments to test the feasibility of usingultrasound imaging to guide laser fat removal. A laboratorysetup consisting of an ultrasound imaging system inter-faced with a continuous wave laser was assembled. Experi-ments were performed on ex vivo porcine subcutaneous fatthrough the overlying epidermis and dermis. Results of theexperiments provide data to test the feasibility of usingultrasound imaging both to identify the dermis-fat junctionand to monitor the temperature increase during therapy.
Contract grant sponsor: National Institutes of Health; Contractgrant numbers: EB008101, EB004963.
*Correspondence to: Stanislav Y. Emelianov, PhD, Departmentof Biomedical Engineering, University of Texas at Austin, Austin,TX 78712. E-mail: [email protected]
Accepted 15 October 2008Published online in Wiley InterScience(www.interscience.wiley.com).DOI 10.1002/lsm.20726
� 2008 Wiley-Liss, Inc.
THEORY
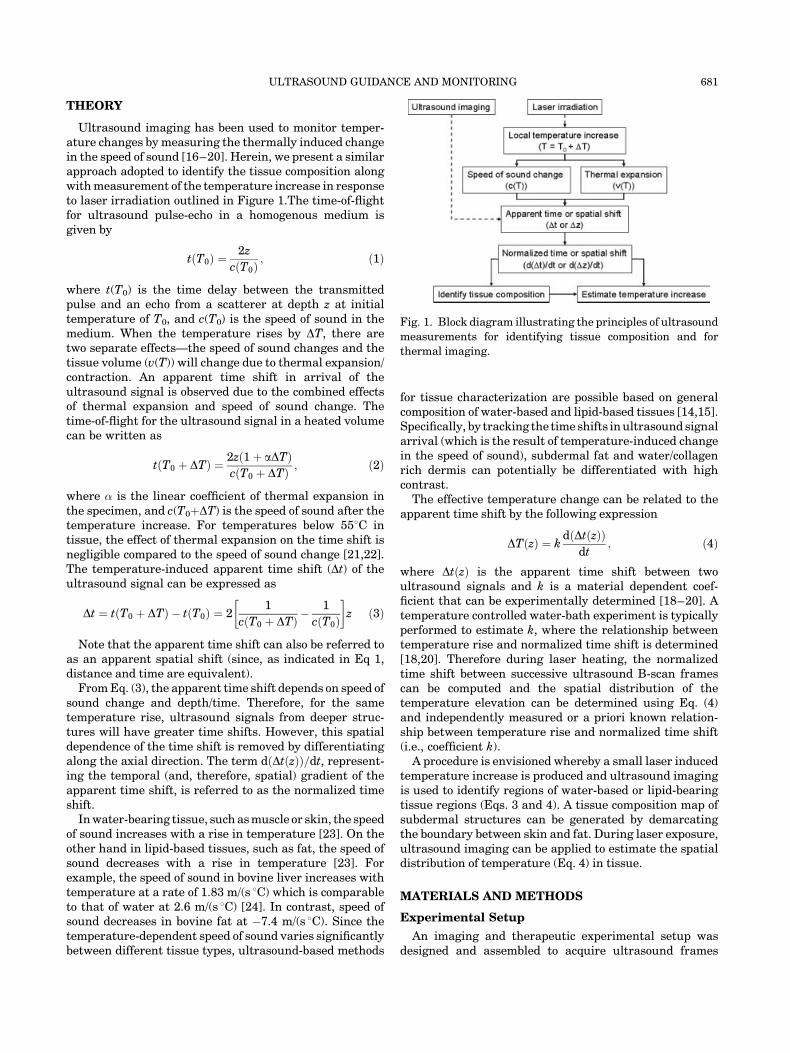
Ultrasound imaging has been used to monitor temper-ature changes by measuring the thermally induced changein the speed of sound [16–20]. Herein, we present a similarapproach adopted to identify the tissue composition alongwith measurement of the temperature increase in responseto laser irradiation outlined in Figure 1.The time-of-flightfor ultrasound pulse-echo in a homogenous medium isgiven by
tðT0Þ ¼2z
cðT0Þ; ð1Þ
where t(T0) is the time delay between the transmittedpulse and an echo from a scatterer at depth z at initialtemperature of T0, and c(T0) is the speed of sound in themedium. When the temperature rises by DT, there aretwo separate effects—the speed of sound changes and thetissue volume (v(T)) will change due to thermal expansion/contraction. An apparent time shift in arrival of theultrasound signal is observed due to the combined effectsof thermal expansion and speed of sound change. Thetime-of-flight for the ultrasound signal in a heated volumecan be written as
tðT0 þ DTÞ ¼ 2zð1 þ aDTÞcðT0 þ DTÞ ; ð2Þ
where � is the linear coefficient of thermal expansion inthe specimen, and c(T0þDT) is the speed of sound after thetemperature increase. For temperatures below 558C intissue, the effect of thermal expansion on the time shift isnegligible compared to the speed of sound change [21,22].The temperature-induced apparent time shift (Dt) of theultrasound signal can be expressed as
Dt ¼ tðT0 þ DTÞ � tðT0Þ ¼ 21
cðT0 þ DTÞ �1
cðT0Þ
� �z ð3Þ
Note that the apparent time shift can also be referred toas an apparent spatial shift (since, as indicated in Eq 1,distance and time are equivalent).
From Eq. (3), the apparent time shift depends on speed ofsound change and depth/time. Therefore, for the sametemperature rise, ultrasound signals from deeper struc-tures will have greater time shifts. However, this spatialdependence of the time shift is removed by differentiatingalong the axial direction. The term dðDtðzÞÞ=dt, represent-ing the temporal (and, therefore, spatial) gradient of theapparent time shift, is referred to as the normalized timeshift.
In water-bearing tissue, such as muscle or skin, the speedof sound increases with a rise in temperature [23]. On theother hand in lipid-based tissues, such as fat, the speed ofsound decreases with a rise in temperature [23]. Forexample, the speed of sound in bovine liver increases withtemperature at a rate of 1.83 m/(s 8C) which is comparableto that of water at 2.6 m/(s 8C) [24]. In contrast, speed ofsound decreases in bovine fat at �7.4 m/(s 8C). Since thetemperature-dependent speed of sound varies significantlybetween different tissue types, ultrasound-based methods
for tissue characterization are possible based on generalcomposition of water-based and lipid-based tissues [14,15].Specifically, by tracking the time shifts in ultrasound signalarrival (which is the result of temperature-induced changein the speed of sound), subdermal fat and water/collagenrich dermis can potentially be differentiated with highcontrast.
The effective temperature change can be related to theapparent time shift by the following expression
DTðzÞ ¼ kdðDtðzÞÞ
dt; ð4Þ
where DtðzÞ is the apparent time shift between twoultrasound signals and k is a material dependent coef-ficient that can be experimentally determined [18–20]. Atemperature controlled water-bath experiment is typicallyperformed to estimate k, where the relationship betweentemperature rise and normalized time shift is determined[18,20]. Therefore during laser heating, the normalizedtime shift between successive ultrasound B-scan framescan be computed and the spatial distribution of thetemperature elevation can be determined using Eq. (4)and independently measured or a priori known relation-ship between temperature rise and normalized time shift(i.e., coefficient k).
A procedure is envisioned whereby a small laser inducedtemperature increase is produced and ultrasound imagingis used to identify regions of water-based or lipid-bearingtissue regions (Eqs. 3 and 4). A tissue composition map ofsubdermal structures can be generated by demarcatingthe boundary between skin and fat. During laser exposure,ultrasound imaging can be applied to estimate the spatialdistribution of temperature (Eq. 4) in tissue.
MATERIALS AND METHODS
Experimental Setup
An imaging and therapeutic experimental setup wasdesigned and assembled to acquire ultrasound frames
Fig. 1. Block diagram illustrating the principles of ultrasound
measurements for identifying tissue composition and for
thermal imaging.
ULTRASOUND GUIDANCE AND MONITORING 681
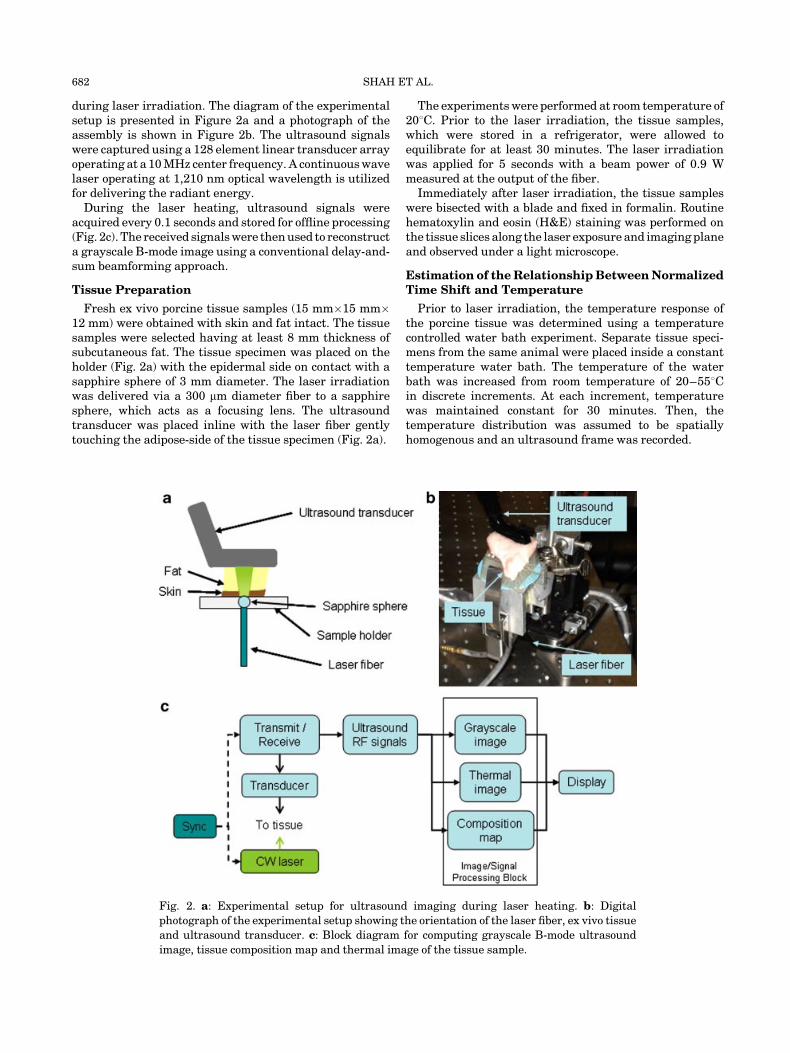
during laser irradiation. The diagram of the experimentalsetup is presented in Figure 2a and a photograph of theassembly is shown in Figure 2b. The ultrasound signalswere captured using a 128 element linear transducer arrayoperating at a 10 MHz center frequency. A continuous wavelaser operating at 1,210 nm optical wavelength is utilizedfor delivering the radiant energy.
During the laser heating, ultrasound signals wereacquired every 0.1 seconds and stored for offline processing(Fig. 2c). The received signals were then used to reconstructa grayscale B-mode image using a conventional delay-and-sum beamforming approach.
Tissue Preparation
Fresh ex vivo porcine tissue samples (15 mm�15 mm�12 mm) were obtained with skin and fat intact. The tissuesamples were selected having at least 8 mm thickness ofsubcutaneous fat. The tissue specimen was placed on theholder (Fig. 2a) with the epidermal side on contact with asapphire sphere of 3 mm diameter. The laser irradiationwas delivered via a 300 mm diameter fiber to a sapphiresphere, which acts as a focusing lens. The ultrasoundtransducer was placed inline with the laser fiber gentlytouching the adipose-side of the tissue specimen (Fig. 2a).
The experiments were performed at room temperature of208C. Prior to the laser irradiation, the tissue samples,which were stored in a refrigerator, were allowed toequilibrate for at least 30 minutes. The laser irradiationwas applied for 5 seconds with a beam power of 0.9 Wmeasured at the output of the fiber.
Immediately after laser irradiation, the tissue sampleswere bisected with a blade and fixed in formalin. Routinehematoxylin and eosin (H&E) staining was performed onthe tissue slices along the laser exposure and imaging planeand observed under a light microscope.
Estimation of the Relationship Between NormalizedTime Shift and Temperature
Prior to laser irradiation, the temperature response ofthe porcine tissue was determined using a temperaturecontrolled water bath experiment. Separate tissue speci-mens from the same animal were placed inside a constanttemperature water bath. The temperature of the waterbath was increased from room temperature of 20–558Cin discrete increments. At each increment, temperaturewas maintained constant for 30 minutes. Then, thetemperature distribution was assumed to be spatiallyhomogenous and an ultrasound frame was recorded.
Fig. 2. a: Experimental setup for ultrasound imaging during laser heating. b: Digital
photograph of the experimental setup showing the orientation of the laser fiber, ex vivo tissue
and ultrasound transducer. c: Block diagram for computing grayscale B-mode ultrasound
image, tissue composition map and thermal image of the tissue sample.
682 SHAH ET AL.

Normalized time shifts were computed between succes-sive ultrasound frames from two distinct regions in thesample—fatty tissue and skin. Therefore, the relationshipbetween normalized time shift and temperature for theporcine fat and skin was measured and approximated usinga second-order polynomial fit to determine the coefficient kin Eq. (4) needed for direct estimation of temperature. Thenormalized time shift decreases for fatty tissue (Fig. 3a)and increases for non-fatty tissue (Fig. 3b) with temper-ature. Furthermore, the normalized time shift changes by agreater amount for fat (�8%) compared to skin (�3%) forthe same temperature range. These results are consistentwith literature data where the speed of sound for fat
decreases while the speed of sound in water-based tissueincreases with temperature [23,24].
Data Analysis
While performing laser heating, apparent time shiftsbetween successive ultrasound frames were estimated byemploying a correlation-based block matching algorithm[25]. Then the apparent time shifts (Eq. 3) were differ-entiated along the axial direction to estimate thenormalized time shifts (Eq. 4). The tissue compositionmap was then generated by identifying the sign of thenormalized time shift—negative sign indicating fat andpositive sign signifying dermis. Once the tissue compositionwas computed and the dermal-fat junction was determined,the temperature increase was estimated by applying thecoefficients of the polynomial fit (Fig. 3a,b) to the measurednormalized time shift.
RESULTS
Tissue Boundary Map
The ultrasound image of the ex vivo porcine tissuesample is presented in Figure 4a representing a 10 mm�15 mm field of view. Note bottom of the ultrasound image is
Fig. 3. Temperature calibration for (a) porcine fat and (b)
porcine skin. Note, the negative temperature gradient of the
normalized time shift for fatty tissue and positive temperature
gradient for water-based tissue.
Fig. 4. a: Ultrasound image of the porcine tissue. Image covers
a 10 mm (depth) by 15 mm (width) region. b: Normalized time
shift between the arrows in Figure 3a after 1, 3, and 5 seconds
of laser heating. The zero crossing indicates the dermis-fat
junction.
ULTRASOUND GUIDANCE AND MONITORING 683

masked to remove reverberations of ultrasound pulse fromthe tissue holder.
Maps of the normalized time shift were generated fromsuccessive ultrasound frames during a 5-second laserexposure. Figure 4b plots the normalized time shift alongthe region indicated by the arrows in Figure 4a andrepresents an axial line from a depth of 3–7 mm from thetop of the ultrasound image. The normalized time shiftshave two distinct regions. At the 5–7 mm depth, thenormalized time shift is increasing with the laser irradi-ation time while the normalized time shift is decreasingotherwise. Since the normalized time shift for porcine skinhas positive temperature gradient while fat has a negativetemperature gradient (Fig. 3), the region exhibiting apositive normalized time shift is classified as skin while theregion having negative normalized time shift is classified asfat. Furthermore, the zero crossing between the positiveand negative normalized time shift represents positionof the dermis-fat junction. Note that location of thezero-crossing does not change regardless of the laserexposure time, that is, the increasing magnitude of thenormalized time shift does not affect position of the zero-crossing (Fig. 4b).
The map of normalized time shift after the 5 seconds oflaser irradiation is shown in Figure 5a. Two distinct regionsare visible on the normalized time shift image above the
laser irradiation spot (shown by the arrow)—a brighterregion having a positive normalized time shift and darkerregion having a negative normalized time shift correspond-ing to positive and negative temperature gradients ofthe normalized time shift. About 5 mm to the left from thelaser irradiation spot there is a region with a negativenormalized time shift—this area had an imaging artifactproduced by the tissue holder and, therefore, was excludedfrom a subsequent analysis.
The zero-crossing of the normalized time shift, computedover the region corresponding to laser irradiation, isoverlaid on the ultrasound image (Fig. 5b). Overall, thezero-crossing delineates two regions, the upper region isclassified as fat and the brighter region located below isclassified as skin. In this way, the zero-crossing of thenormalized time shift may be used to identify the dermis-fatjunction.
Tissue Temperature Map
The temperature map immediately after 5 seconds laserirradiation is shown in Figure 6a. The tissue compositionwas first identified using the dermis-fat junction fromFigure 5b. The normalized time shifts were converted totemperature by using the respective relationships estab-lished for porcine fat (Fig. 3a) and dermis (Fig. 3b). Theoverlaid map (Fig. 6b) indicates that temperature increasesby more than 258C in both skin and fatty tissue regions.
In addition, the spatial-temporal temperature rise wasexamined in four 0.5 mm�0.5 mm regions. The regions arecentered along the laser irradiation direction at depths of7 mm, 5 mm, 4 mm, and 3 mm from the top of the combinedultrasound-thermal image illustrated in Figure 6b. Meantemperature increases monotonically with time in all fourtissue regions. A temperature elevation of close to 258Cafter 5 seconds of laser irradiation is observed in region 1located below the dermal-fat junction (i.e., in skin). Noexternal cooling techniques were employed on the porcinetissue specimen. The temperature increases more than308C in region 2—located above the dermal-fat junction andconsisting primarily of fat. At deeper depths in fatty tissue(regions 3 and 4), progressively lower temperature increaseis observed.
In a separate specimen, the laser heating performedproduced a significantly lower temperature rise (Fig. 7a)compared to Figure 6a. The overlaid temperature map(Fig. 7b) indicates that the temperature increased by lessthan 158C at the end of laser irradiation, in both the dermaland fatty tissue regions.
Thermal Damage Assessment
Histological assessment performed on the specimenshown in Figure 6 illustrated defects in the subcutaneousadipose tissue marked with various degrees of compression,disruption and fragmentation (Fig. 8a). Distinctive thermaldamage with hyalinization, swelling and loss of birefrin-gence in the dermal collagen in a wedge-shaped region atthe surface was observed. The epithelial cells of the deeplyplaced glandular ducts are shrunken and hyperchromatic
Fig. 5. a: Map of the normalized time shift after 5 seconds of
laser irradiation with clear demarcation between positive and
negative normalized time shift under laser irradiation region.
b: Ultrasound image of the porcine tissue with the zero-
crossing of normalized time shift superposed to represent the
dermis-fat junction. All images represent a 10 mm by 15 mm
region.
684 SHAH ET AL.

while the surrounding fibroadipose tissue was torn andfragmented (Fig. 6b). Histological assessment was alsoperformed on the specimen shown in Figure 7. This sampleshowed negligible thermal damage to the adipose tissuelayer (Fig. 8c) possibly due to lower temperature riseachieved after laser irradiation.
DISCUSSION
Subcutaneous fat can be targeted for laser therapyby selecting a wavelength where the absorption of fatexceeds that of water [7]. However prior to performing lasertherapy for fat reduction, identifying the laser dosimetry isimportant. Our results indicate that ultrasound imagingin combination with laser irradiation may be utilized toidentify the dermis-fat junction and thereby differentiatebetween water-based and lipid-based tissues (Figs. 4and 5).
To identify the tissue composition, a small temperatureincrease in response to laser irradiation is needed. Since asingle fiber was used to deliver the radiant energy (Fig. 2),the dermis-fat junction was identified in a relatively small(<5 mm) region. Using a multi-fiber delivery system orperforming sequential scanning with sub-therapeutic laserdose, the entire region of interest can be safely interrogatedand a complete tissue composition map generated.
To ensure irreversible thermal damage, the temperaturein the therapeutic zone has to be maintained greaterthan 438C for an extended period of time [10,11]. Thetemperature increase in the subcutaneous fat due to laserirradiation depends on several factors including tissueoptical properties and dermis thickness. For example,for the same irradiation parameters, tissue samples fromseparate animals had varying temperature profiles at theend of laser heating (Figs. 6 and 7) leading to differentthermal damage outcomes (Fig. 8). Therefore, it is neces-sary to monitor the temperature increase during the lasertreatment. Ultrasound-based thermal images (Figs. 6and 7) indicate the feasibility of performing spatial andtemporal mapping of temperature increase during laserirradiation.
In the preliminary experiments performed in this study,a significant temperature increase was obtained in thedermal region (Fig. 6c). Temperature increase in the
Fig. 6. a: Thermal image showing the temperature elevation reached due to laser exposure.
b: Ultrasound image overlaid with the temperature maps, showing the temperature elevation
in the dermal and fatty regions. c: Temporal temperature rise at four regions directly along the
laser irradiation plane. The regions are shown as boxes in (b).
Fig. 7. a: Thermal image showing the temperature elevation
reached due to laser exposure. b: Ultrasound image overlaid
with the temperature maps, showing the temperature
elevation in the dermal and fatty regions.
ULTRASOUND GUIDANCE AND MONITORING 685

dermal region was lower than the fat region, possibly due tolipid having higher optical absorption coefficient ascompared to water at 1,210 nm laser irradiation wave-length. In a clinical application, periodic surface cryogenspray cooling can be employed to protect the dermis fromthermal damage [26]. In addition, ultrasound thermalimaging may also be utilized to monitor the temperaturein dermis and sub-dermal regions in response to laserirradiation and possibly trigger the periodic bursts ofcooling spray.
Histological evaluation of the samples showed thermaldamage at the epidermal and subjacent dermal layers inone specimen (Fig. 8a–b). Another specimen containedsubcutaneous defects that could be formed by thermaldesiccation or various other mechanisms (Fig. 8c). Sub-cutaneous tears could be due to thermal damage and tissuedesiccation possibly complicated by incomplete fixation,paraffin penetration and/or sectioning artifacts. However,distinguishing between the two mechanisms is difficultsince they produce similar defects [27]. Further studies areneeded to identify the laser dosimetry required to ensurethermal damage.
In experiments reported here, laser irradiation and theultrasound transducer were on the opposite sides of thetissue sample (Fig. 2a). This geometery led to reverber-ations on the bottom of the ultrasound image (Fig. 3a),introducing artifacts making tissue identification from theholder more difficult. For in vivo studies light delivery andultrasound transducer must be on the same side. Opticalfibers placed alongside the transducer can be used fordelivering the radiant energy to the tissue, these setupshave been assembled for photoacoustic imaging [28,29].Another alternative is to integrate the ultrasonic trans-ducer and the optical probe into one assembly similar toconfocally arranged transducers used during high intensityfocused ultrasound treatments [30].
Physiological motion such as cardiac or respiratorymovement could lead to artifacts in the ultrasoundmeasurements if it produces normalized time shiftin ultrasound images. For example, periodic heart beatcauses tissue motion which could appear as time shiftsin the ultrasound signals leading to errors in tissuecomposition and temperature maps. To avoid the impactof cardiac-induced motion, it may be necessary to utilize an
Fig. 8. a: Porcine skin overview showing defects in the
subcutaneous adipose tissue (thick arrows). Wedge shaped
surface lesion (thin arrows) visible showing signs of thermal
denaturation of cellular structural proteins [H&E stains. Orig.
Mag. 16�]. b: The glandular ducts show compression and are
hyper chromatic. The adipose tissue (arrows) is torn and
fragmented associated with subcutaneous defects. c: Normal
glandular ducts surrounded by compressed fat cells (arrows) in
a specimen with lower temperature increase (less than 158C)
[H&E stains. Orig. Mag. 200�].
686 SHAH ET AL.

electrocardiogram (ECG) to trigger the data capture.Ultrasound frames will then be collected at the same pointin the cardiac cycle and potentially minimizing tissue-motion artifacts [31].
For remote temperature assessment, a water-bath experi-ment was first performed to establish the relationshipbetween normalized time shift and temperature (Fig. 3) forthe porcine tissue sample. In ultrasound imaging temper-ature measurement is possible using a generalized andknownapriori tissuespecific calibration [20]. Identifyingthetissue composition will potentially allow the calculation oftemperature fromultrasound time shiftsdirectly, accuratelyand in real time without a calibration procedure.
SUMMARY
The results of our study outline the ability of ultrasoundimaging to guide and monitor laser therapy of fat. Ultra-sound imaging was used to identity the dermis-fatboundary in porcine tissue with high contrast and tocompute the temperature elevations during laser heating.Application of the ultrasound technique reported here maybe relevant to clinical laser procedures to reduce fat.
ACKNOWLEDGMENTS
Support in part by the National Institutes of Healthunder grants EB008101 and EB004963 is gratefullyacknowledged. The authors also would like to thank Mrs.Suhyun Park and Mr. Jared Mendeloff of the UltrasoundImaging and Therapeutics Research Laboratory at theUniversity of Texas at Austin for their help with thedata capture, the ultrasound beamforming and imagereconstruction.
REFERENCES
1. Heymans O, Castus P, Grandjean FX, Van Zele D. Lip-osuction: Review of the techniques, innovations and applica-tions. Acta Chir Belg 2006;106(6):647–653.
2. Neira R, Arroyave J, Ramirez H, Ortiz CL, Solarte E,Sequeda F, Gutierrez MI. Fat liquefaction: Effect of low-levellaser energy on adipose tissue. Plast Reconstr Surg 2002;110(3):912–922, discussion 923–915.
3. Alberto G. Submental Nd:Yag laser-assisted liposuction.Lasers Surg Med 2006;38(3):181–184.
4. Katz B, McBean J. The new laser liposuction for men.Dermatol Ther 2008;20(6):448–451.
5. Toledo LS, Mauad R. Complications of body sculpture:Prevention and treatment. Clin Plast Surg 2006;33(1):1–11, v.
6. Lehnhardt M, Homann HH, Daigeler A, Hauser J, Palka P,Steinau HU. Major and lethal complications of liposuction: Areview of 72 cases in Germany between 1998 and 2002. PlastReconstr Surg 2008;121(6):396e–403e.
7. Anderson RR, Farinelli W, Laubach H, Manstein D, Yar-oslavsky AN, Gubeli JG III, Jordan K, Neil GR, Shinn M,Chandler W, Williams GP, Benson SV, Douglas DR, DyllaHF. Selective photothermolysis of lipid-rich tissues: A freeelectron laser study. Lasers Surg Med 2006;38(10):913–919.
8. Altshuler GB, Anderson RR, Manstein D, Zenzie HH,Smirnov MZ. Extended theory of selective photothermolysis.Lasers Surg Med 2001;29(5):416–432.
9. Illouz YG. Study of subcutaneous fat. Aesthetic Plast Surg1990;14(1):165–177.
10. Thomsen S. Pathologic analysis of photothermal and photo-mechanical effects of laser-tissue interactions. PhotochemPhotobiol 1991;53(6):825–835.
11. Badin AZED, Gondek LBE, Garcia MJ, Valle LCD, Flizi-kowski FBZ, Noronha LD. Analysis of laser lipolysis effectson human tissue samples obtained from liposuction AestheticPlastic Surgery. 2005;29(4):281–286.
12. Karlan BY, Platt LD. Ovarian cancer screening. The role ofultrasound in early detection. Cancer 1995;76:2011–2015.
13. Teh W, Wilson ARM. The role of ultrasound in breast cancerscreening. A consensus statement by the European Group forbreast cancer screening. Eur J Cancer 1998;34(4):449–450.
14. Pereira FR, Machado JC, Foster FS. Ultrasound character-ization of coronary artery wall in vitro using temperature-dependent wave speed. Ultrasonics, Ferroelectrics andFrequency Control. IEEE Transactions on 2003; 50(11):1474–1485.
15. Shi Y, Witte RS, Milas SM, Neiss JH, Chen XC, Cain CA,O’Donnell M. Ultrasonic thermal imaging of microwaveabsorption. Proceeding of the 2003 IEEE Ultrasonics Sympo-sium 2003; 1: 224–227.
16. Shah J, Aglyamov SR, Sokolov K, Milner TE, Emelianov SY.Ultrasound-based thermal and elasticity imaging to assistphotothermal cancer therapy—Preliminary study. Proceed-ing of the 2006 IEEE Ultrasonics Symposium 2006; 1029–1032.
17. Shah J, Park S, Aglyamov S, Larson T, Ma L, Sokolov K,Johnston K, Milner T, Emelianov S. Photoacoustic andultrasound imaging to guide photothermal therapy: Ex-vivostudy. Proc SPIE 2008;6856:68560U.
18. Shah J, Aglyamov SR, Sokolov K, Milner TE, Emelianov SY.Ultrasound imaging to monitor photothermal therapy—Feasibility study. Opt Express 2008;16(6):3776–3785.
19. Seip R, Ebbini ES. Non-invasive monitoring of ultrasoundphased array hyperthermia and surgery treatments. Pro-ceedings of IEEE 17th Annual conference on Engineering inMedicine and Biology Society, 1995; 661:663–664.
20. Varghese T, Zagzebski JA, Chen Q, Techavipoo U, Frank G,Johnson C, Wright A, Lee FT Jr. Ultrasound monitoring oftemperature change during radiofrequency ablation: Pre-liminary in-vivo results. Ultrasound Med Biol 2002;28(3):321–329.
21. Maass-Moreno R, Damianou CA. Noninvasive temperatureestimation in tissue via ultrasound echo-shifts. Part I.Analytical model. J Acoust Soc Am 1996;100(4 Pt 1):2514–2521.
22. Maass-Moreno R, Damianou CA, Sanghvi NT. Noninvasivetemperature estimation in tissue via ultrasound echo-shifts.Part II. In vitro study. J Acoust Soc Am 1996;100(4 Pt 1):2522–2530.
23. Duck FA. Physical properties of tissue. New York: Academic;1990.
24. Bamber JC, Hill CR. Ultrasonic attenuation and propagationspeed in mammalian tissues as a function of temperature.Ultrasound Med Biol 1979;5:149–157.
25. Lubinski MA, Emelianov SY, O’Donnell M. Speckle trackingmethods for ultrasonic elasticity imaging using short-timecorrelation. Ultrasonics, Ferroelectrics and Frequency Con-trol. IEEE Transactions on 1999; 46(1): 82–96.
26. Anvari B, Tanenbaum BS, Milner TE, Tang K, Liaw L-H,Kalafus K, Kimel S, Nelson JS. Spatially selective photo-coagulation of biological tissues: Feasibility study utilizingcryogen spray cooling. Appl Opt 1996;35(19):3314–3320.
27. Thomsen SL. Practical pathology for engineers: How to do thejob right the first time. Proc SPIE 2003;4954(1):476635.
28. Zemp RJ, Bitton R, Li M-L, Shung KK, Stoica G, Wang LV.Photoacoustic imaging of the microvasculature with a high-frequency ultrasound array transducer. J Biomed Opt 2007;12(1):010501.
29. Park S, Mallidi S, Karpiouk AB, Aglyamov S, Emelianov SY.Photoacoustic imaging using array transducer. Proc SPIE2007;6437:643714.
30. Seip R, Ebbini ES. Noninvasive estimation of tissue temper-ature response to heating fields using diagnostic ultrasound.Biomed Eng IEEE Trans 1995;42(8):828–839.
31. Simon C, VanBaren PD, Ebbini ES. Motion compensationalgorithm for noninvasive two-dimensional temperatureestimation using diagnostic pulse-echo ultrasound. SPIESurg Appl Energy 1998;3249:182–192.
ULTRASOUND GUIDANCE AND MONITORING 687