Ultrasonic ride height control for self-leveling air … RIDE HEIGHT CONTROL FOR SELF-LEVELING AIR...
44
ULTRASONIC RIDE HEIGHT CONTROL FOR SELF-LEVELING AIR SUSPENSION SYSTEMS Capstone Design Project John Kodera Project Supervisor – Walter Dixon III Electrical & Computer Engineering Union College – Schenectady, NY
Transcript of Ultrasonic ride height control for self-leveling air … RIDE HEIGHT CONTROL FOR SELF-LEVELING AIR...
ULTRASONIC RIDE HEIGHT CONTROL FOR SELF-LEVELING
AIR SUSPENSION SYSTEMS Capstone Design Project
John Kodera Project Supervisor – Walter Dixon III
Electrical & Computer Engineering Union College – Schenectady, NY
ECE 499 Capstone Design Project Winter 2017
1
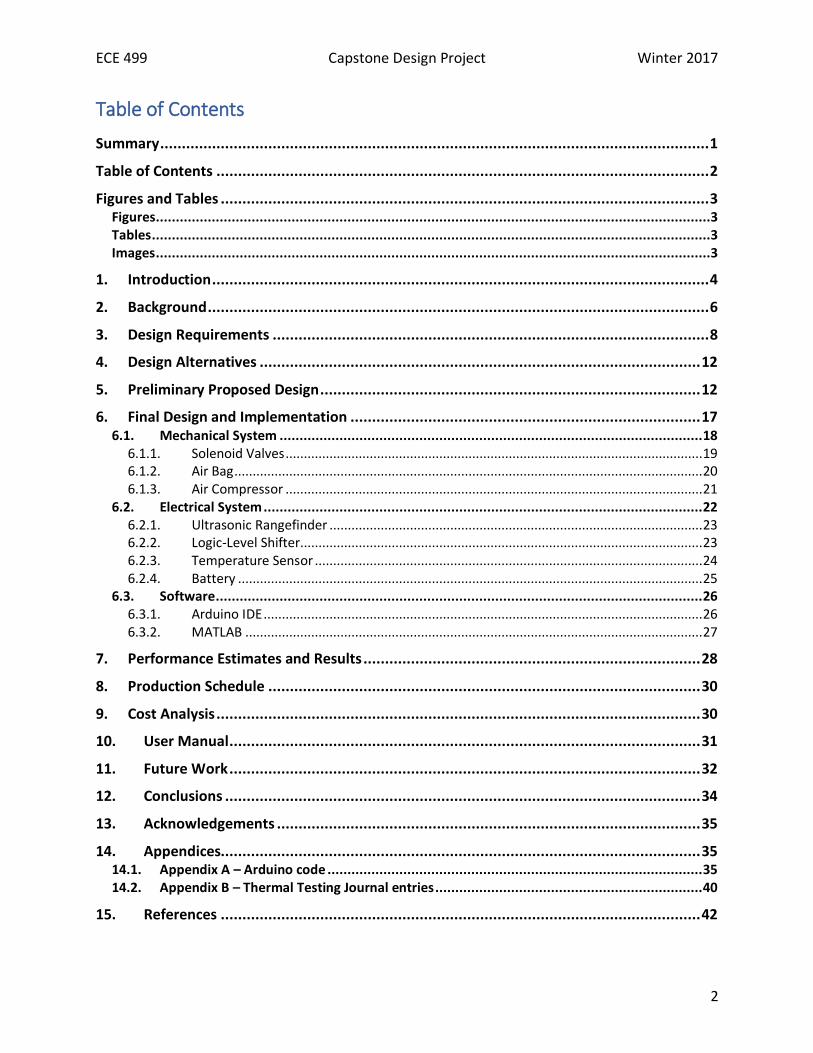
Summary
Many of the components in modern air suspension systems have improved since the
technology’s inception in the 1950s. One component that has not improved since the
introduction of height-based management is the ride height sensor; a single-jointed
potentiometer that frequently breaks. To solve this issue, how height-based air suspensions
operate had to be reimagined, replacing the fragile single-jointed potentiometer with an
ultrasonic distance sensor. This ultrasonic rangefinder would work in tandem with a
microprocessor and high-pressure pneumatic system to control the shape of the air bag,
subsequently determining the ride height of a vehicle. When tested, this system fully deflated
and inflated from a steady state in under 40 seconds. This time landed within a sweet spot of
system performance, fast enough to effectively change vehicle ride from ‘low’ to ‘high,’ but
gradual enough to avoid harming any vehicle occupants. This project investigates if an
ultrasonic distance sensor is a viable alternative to current methods of ride height
measurement.
ECE 499 Capstone Design Project Winter 2017
2
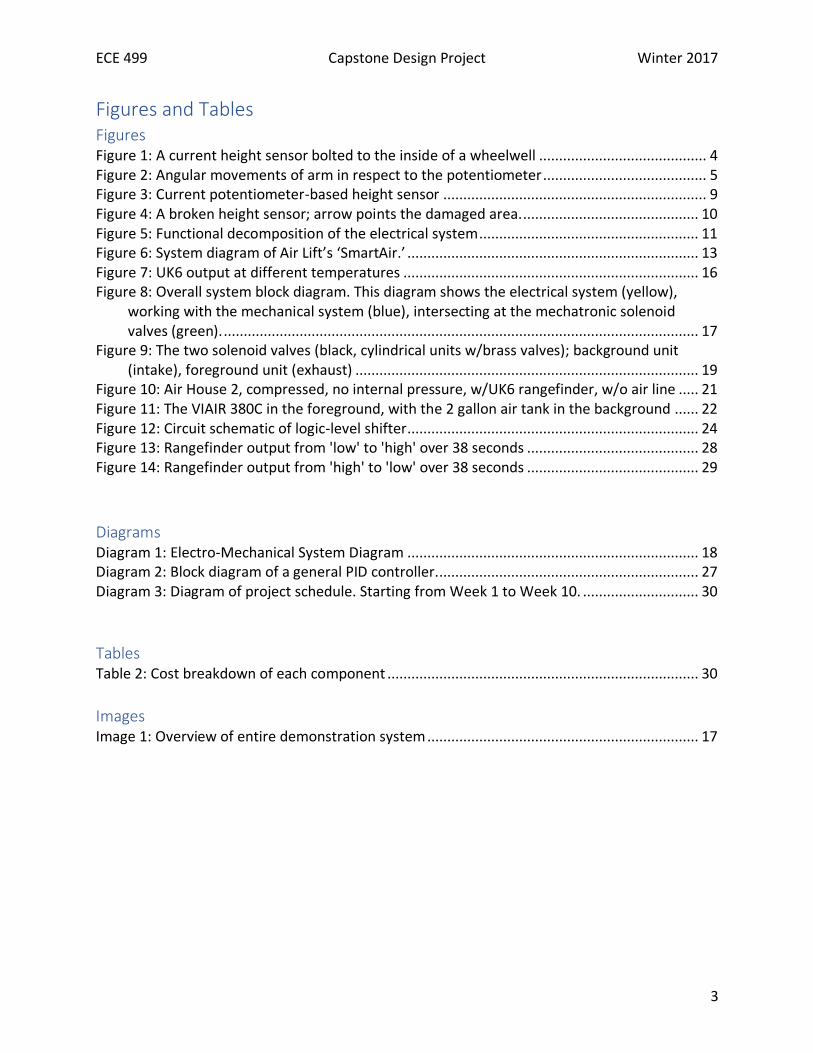
Table of Contents
Summary ............................................................................................................................... 1
Table of Contents .................................................................................................................. 2
Figures and Tables ................................................................................................................. 3 Figures ...........................................................................................................................................3 Tables ............................................................................................................................................3 Images ...........................................................................................................................................3
1. Introduction ................................................................................................................... 4
2. Background .................................................................................................................... 6
3. Design Requirements ..................................................................................................... 8
4. Design Alternatives ...................................................................................................... 12
5. Preliminary Proposed Design ........................................................................................ 12
6. Final Design and Implementation ................................................................................. 17 6.1. Mechanical System .......................................................................................................... 18
6.1.1. Solenoid Valves .................................................................................................................. 19 6.1.2. Air Bag ................................................................................................................................ 20 6.1.3. Air Compressor .................................................................................................................. 21
6.2. Electrical System .............................................................................................................. 22 6.2.1. Ultrasonic Rangefinder ...................................................................................................... 23 6.2.2. Logic-Level Shifter.............................................................................................................. 23 6.2.3. Temperature Sensor .......................................................................................................... 24 6.2.4. Battery ............................................................................................................................... 25
6.3. Software .......................................................................................................................... 26 6.3.1. Arduino IDE ........................................................................................................................ 26 6.3.2. MATLAB ............................................................................................................................. 27
7. Performance Estimates and Results .............................................................................. 28
8. Production Schedule .................................................................................................... 30
9. Cost Analysis ................................................................................................................ 30
10. User Manual ............................................................................................................. 31
11. Future Work ............................................................................................................. 32
12. Conclusions .............................................................................................................. 34
13. Acknowledgements .................................................................................................. 35
14. Appendices............................................................................................................... 35 14.1. Appendix A – Arduino code .............................................................................................. 35 14.2. Appendix B – Thermal Testing Journal entries ................................................................... 40
15. References ............................................................................................................... 42
ECE 499 Capstone Design Project Winter 2017
3
Figures and Tables Figures Figure 1: A current height sensor bolted to the inside of a wheelwell .......................................... 4 Figure 2: Angular movements of arm in respect to the potentiometer ......................................... 5 Figure 3: Current potentiometer-based height sensor .................................................................. 9 Figure 4: A broken height sensor; arrow points the damaged area. ............................................ 10 Figure 5: Functional decomposition of the electrical system ....................................................... 11 Figure 6: System diagram of Air Lift’s ‘SmartAir.’ ......................................................................... 13 Figure 7: UK6 output at different temperatures .......................................................................... 16 Figure 8: Overall system block diagram. This diagram shows the electrical system (yellow),
working with the mechanical system (blue), intersecting at the mechatronic solenoid valves (green). ....................................................................................................................... 17
Figure 9: The two solenoid valves (black, cylindrical units w/brass valves); background unit (intake), foreground unit (exhaust) ...................................................................................... 19
Figure 10: Air House 2, compressed, no internal pressure, w/UK6 rangefinder, w/o air line ..... 21 Figure 11: The VIAIR 380C in the foreground, with the 2 gallon air tank in the background ...... 22 Figure 12: Circuit schematic of logic-level shifter ......................................................................... 24 Figure 13: Rangefinder output from 'low' to 'high' over 38 seconds ........................................... 28 Figure 14: Rangefinder output from 'high' to 'low' over 38 seconds ........................................... 29
Diagrams Diagram 1: Electro-Mechanical System Diagram ......................................................................... 18 Diagram 2: Block diagram of a general PID controller.................................................................. 27 Diagram 3: Diagram of project schedule. Starting from Week 1 to Week 10. ............................. 30
Tables Table 2: Cost breakdown of each component .............................................................................. 30
Images Image 1: Overview of entire demonstration system .................................................................... 17
ECE 499 Capstone Design Project Winter 2017
4
1. Introduction
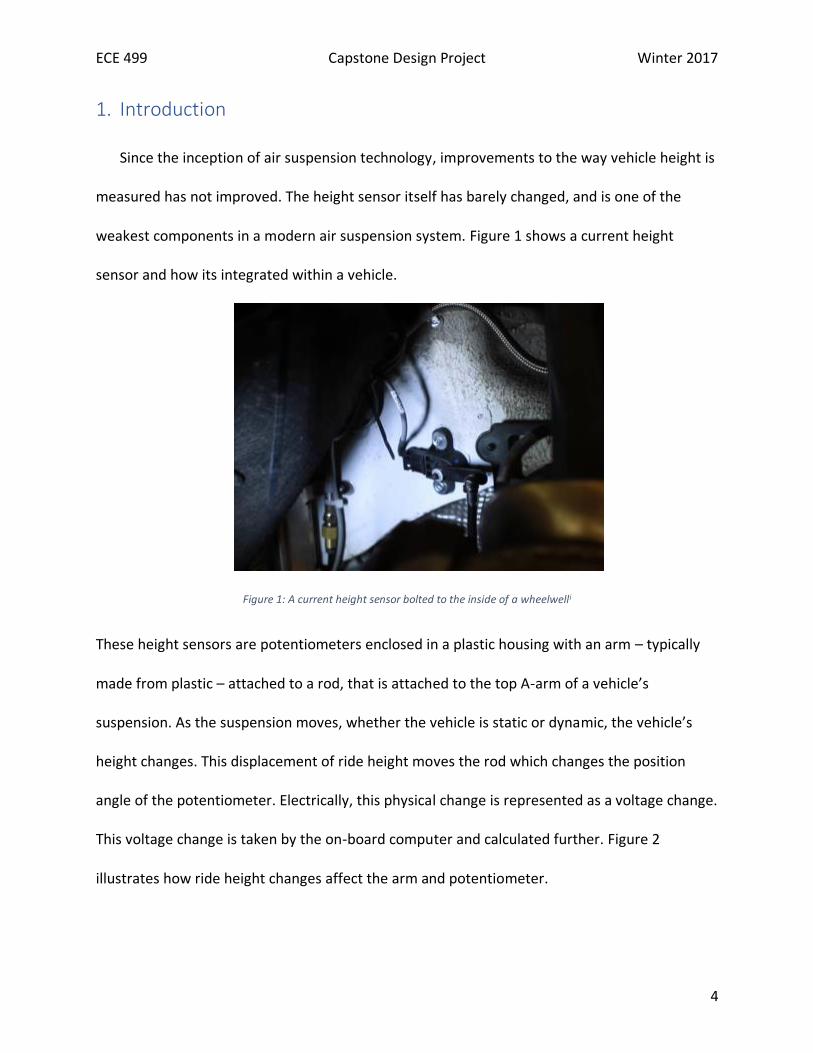
Since the inception of air suspension technology, improvements to the way vehicle height is
measured has not improved. The height sensor itself has barely changed, and is one of the
weakest components in a modern air suspension system. Figure 1 shows a current height
sensor and how its integrated within a vehicle.
Figure 1: A current height sensor bolted to the inside of a wheelwelli
These height sensors are potentiometers enclosed in a plastic housing with an arm – typically
made from plastic – attached to a rod, that is attached to the top A-arm of a vehicle’s
suspension. As the suspension moves, whether the vehicle is static or dynamic, the vehicle’s
height changes. This displacement of ride height moves the rod which changes the position
angle of the potentiometer. Electrically, this physical change is represented as a voltage change.
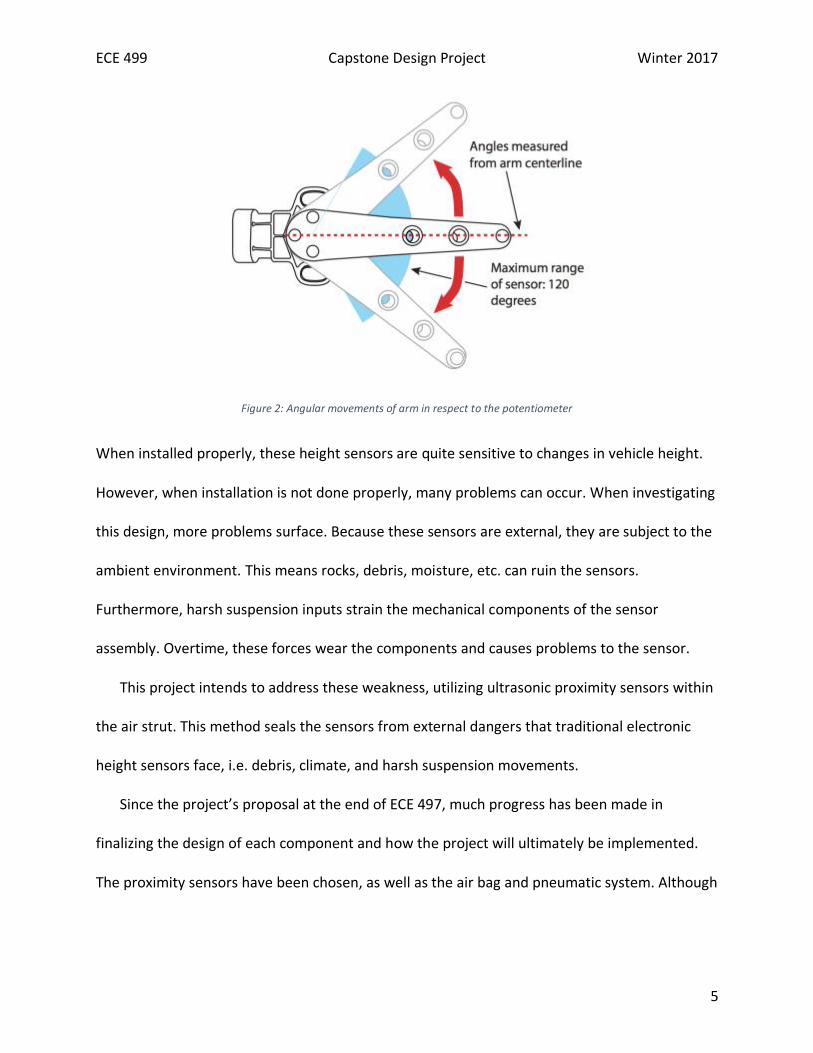
This voltage change is taken by the on-board computer and calculated further. Figure 2
illustrates how ride height changes affect the arm and potentiometer.
ECE 499 Capstone Design Project Winter 2017
5
Figure 2: Angular movements of arm in respect to the potentiometer
When installed properly, these height sensors are quite sensitive to changes in vehicle height.
However, when installation is not done properly, many problems can occur. When investigating
this design, more problems surface. Because these sensors are external, they are subject to the
ambient environment. This means rocks, debris, moisture, etc. can ruin the sensors.
Furthermore, harsh suspension inputs strain the mechanical components of the sensor
assembly. Overtime, these forces wear the components and causes problems to the sensor.
This project intends to address these weakness, utilizing ultrasonic proximity sensors within
the air strut. This method seals the sensors from external dangers that traditional electronic
height sensors face, i.e. debris, climate, and harsh suspension movements.
Since the project’s proposal at the end of ECE 497, much progress has been made in
finalizing the design of each component and how the project will ultimately be implemented.
The proximity sensors have been chosen, as well as the air bag and pneumatic system. Although
ECE 499 Capstone Design Project Winter 2017
6
photo-reflective laser sensors and inductive methods were considered, ultrasonic sensors were
ultimately chosen because of its more suitable characteristics in this application.
Since this application is the first recorded instance of ultrasonic distance measurement,
there are many parameters that must be monitored during the testing process. Like how the
ultrasonic sensor will operate in the environment of an air bag? How will thermal gradients
affect the piezo-electronics? Will the ultrasonic sensor be able to accurately detect when a bag
is fully expanded and compressed? Is such a system feasible at a reasonable cost?
2. Background
In 1955, the French company Citroën released the first self-leveling, four-corner, suspension
system fitted to a production car.ii This breakthrough technology was a hydropneumatic system
that could set and maintain a vehicle’s height based upon a user’s preference. These first
systems were exclusively hydraulically-based; but as further development ensued, electronic-
based height sensors were used so that the vehicle’s height could be set when the engine was
off.
As humanity proceeds into the 21st century, demand for better transportation continues to
increase, particularly in developing countriesiii. Better in what a vehicle can do, how safe it is,
how far it can go, how efficient it is, etc. It is this continuous hunger for better technology that
engineering feeds. Putting other forms of transportation to the side for this project and
focusing on the automobile, ideally, a consumer would like a vehicle that is multi-talented.
Economical yet comfortable, safe but also fuel efficient, all-road capable but useable every day.
ECE 499 Capstone Design Project Winter 2017
7
Currently these demands are limited by compromises in both cost and feasibility. Most vehicles
must compromise one characteristic for the other, or be unreasonably expensive. There are,
however, signs that such compromises many not have to exist in the near-future. As technology
continues to improve, and the cost of electronics decreases due to greater manufacturing and
the concept of Economies-of-Scale, technologies that once seems unreachable will one-day
trickle into more attainable vehicles.
There have been many entries into the self-levelling air suspension industry, both in OEM
(original equipment manufacturer) and aftermarket world. As mentioned in the Introduction
section (page 3), in 1955, Citroën was the first OEM to release a production self-levelling
suspension system; the Citroën DS. Although the method was different (hydropnuematic vs.
air), the purpose was the same. The technology was ahead of its time and offered customers
vehicle abilities that were never possible. But like many technologies ahead of their time, the
complexity and unreliability of the system proved too troublesome to keep it in production.
Problems with seals and hydraulic fluid meant Citroën DS customers frequently saw a puddle of
suspension fluid underneath their pride and joy.1 Despite improvements to the hydraulic
suspension method, the high-costs could not justify the product. Furthermore, hydraulic fluid
was environmentally harmfully as LHM (in French, Liquide Hydraulique Minéral), is a lightly
treated mineral oil that the World Health Organization classifieds as a Group 1 carcinogeniv. A
characteristic that air suspensions do not have since most systems use ambient air.
With the advent of lost-cost electronics, Citroën’s fully-hydraulic system faced tougher,
more modern competition in the form of air suspension. In 1960, the German company
ECE 499 Capstone Design Project Winter 2017
8
‘Borgward’ introduced the first self-levelling air suspension. Although commercially
unsuccessful, Borgward’s efforts did prove the dawn of air suspension systems from
automotive manufacturers. Jump ahead a few decades to the modern air suspension system, all
current height-based air suspension systems use the same method of height measurement;
that is a single-potentiometer that converts voltage to swing-arm angle, to suspension
displacement, to ride height. Although conceptually this method of measurement works, there
are many weaknesses to this method; this report will delve into later.
The differences between a current air suspension system and this project are few. The
primary difference lies in the method of measurement (ultrasonic sensor) and management.
Many of the expensive components, i.e. air strut, air tank, compressor, are only slightly if not at
all changed.
3. Design Requirements
An internally contained sensor has many benefits over an external sensor. First is the ability
to seal the sensor from environmental elements; such as, rocks, leaves, moisture, debris, etc.
Secondly, integrating sensors into the air struts means there is no need to weld and/or bolt
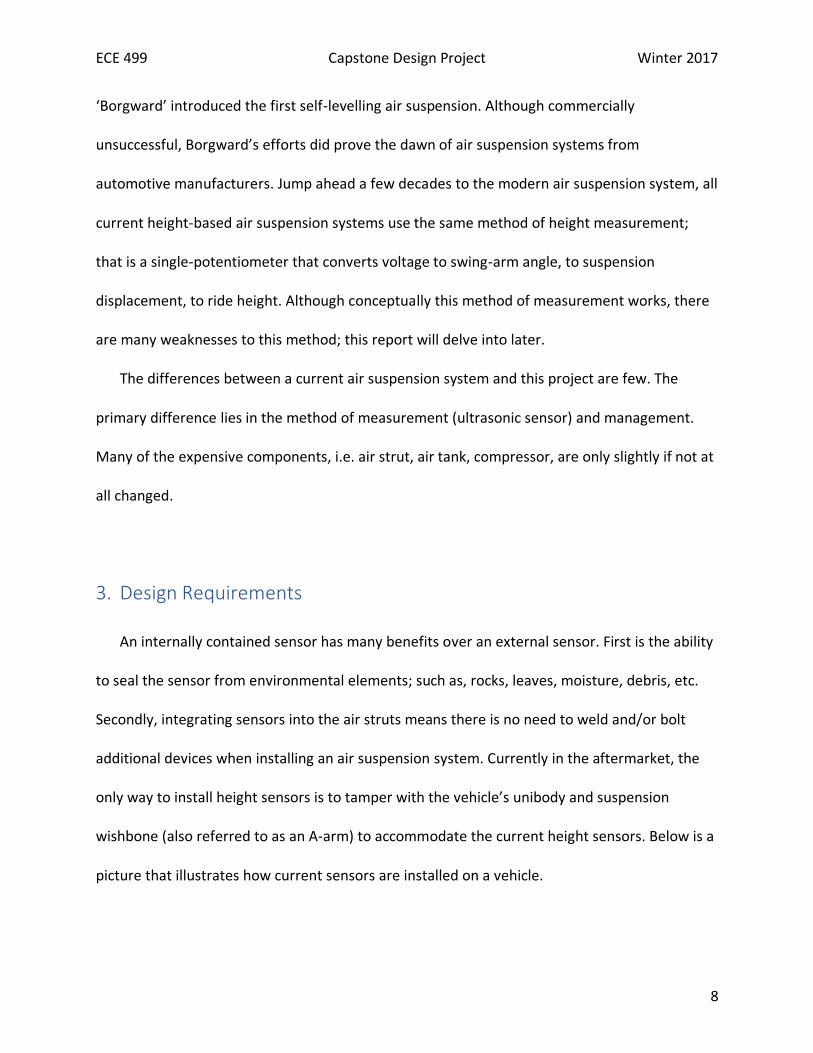
additional devices when installing an air suspension system. Currently in the aftermarket, the
only way to install height sensors is to tamper with the vehicle’s unibody and suspension
wishbone (also referred to as an A-arm) to accommodate the current height sensors. Below is a
picture that illustrates how current sensors are installed on a vehicle.
ECE 499 Capstone Design Project Winter 2017
9
Figure 3: Current potentiometer-based height sensor
As shown in the image above, there is clear evidence that the vehicle had to be tampered
with to install such height sensors. The sensor is bolted to the unibody (grinded metal area),
with an arm attached to the swing-arm of the vehicle (Volkswagen Golf GTI). To cause further
issues, the installation itself can lead to problems.
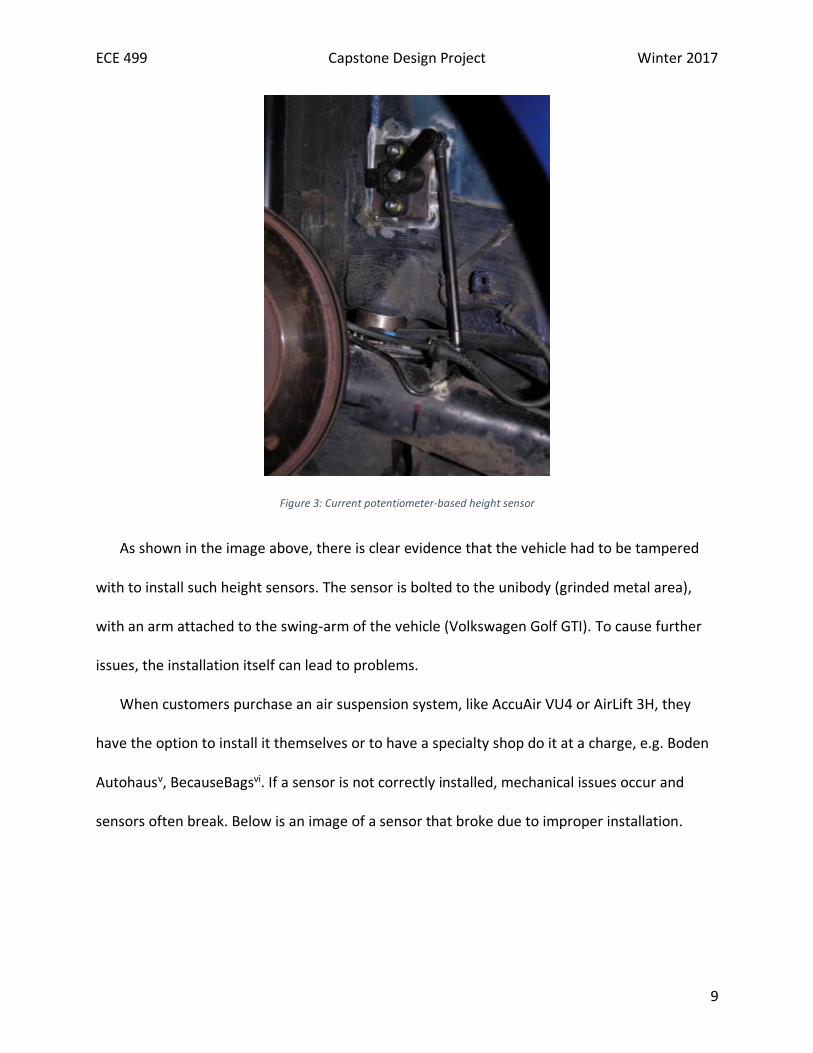
When customers purchase an air suspension system, like AccuAir VU4 or AirLift 3H, they
have the option to install it themselves or to have a specialty shop do it at a charge, e.g. Boden
Autohausv, BecauseBagsvi. If a sensor is not correctly installed, mechanical issues occur and
sensors often break. Below is an image of a sensor that broke due to improper installation.
ECE 499 Capstone Design Project Winter 2017
10
Figure 4: A broken height sensor; arrow points the damaged area.
If a customer decides to install the height sensor him/herself, installation can be tricky as
precise measurement of suspension travel and geometry is requiredvii. The do-it-yourself
method is the more economical option, but can be tricky. The installation process should be as
straightforward as possible, with as few factors to go wrong as possible. Utilizing an internally
contained measurement system that does not require additional installation is the best
method. The proximity sensor in question is the ultrasonic distance sensor (UK6).
There are strict requirements that an internally contained measurement system must
pertain to. First is whether the 18mm diameter sensor will fit within the housing of the air bag.
Second is whether the sensor has the sensing range to detect the bag’s full range of motion.
Third is whether the sensor can sustain the physical abuse of weather conditions and a
ECE 499 Capstone Design Project Winter 2017
11
suspension system. Fourth is whether the sensor has the electrical characteristics to be used in
an automotive application; can a 12 V car battery sufficiently power the sensor and will the
sensor work in conjunction with the controller.
To compute total power consumption, multiple components must be measured. For the
sensor, the UK6 data sheet specifies that the load current of the UK6A is 100 mA. Combined
with an operating voltage of 15 V means the ultrasonic consumes 1.5 W of power. This rating is
acceptable as a car battery can output up to 45A at 12V; a power rating of 540W.
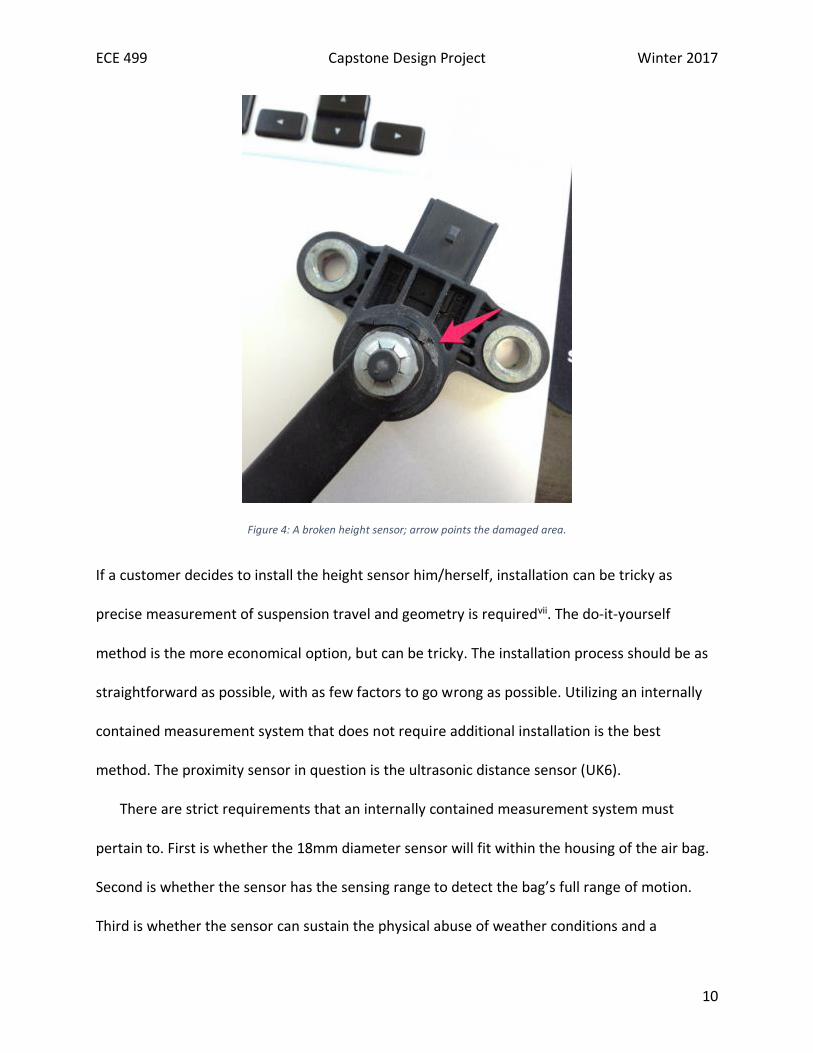
The intention for the final system is to be as simple and easy-to-use as possible to use. This
requires an intuitive interface that is clear yet elegant. However, for the display setup for
Capstone, the final interface will not be fully-developed. Considering the number of days in a
term and the possible number of hours working on the project, the ideal interface cannot come
into full fruition. Instead, the display model will be interfaced through the Arduino software on
a personal computer.
Figure 5: Functional decomposition of the electrical system
ECE 499 Capstone Design Project Winter 2017
12
4. Design Alternatives
There are many components to this project, both electrically and mechanically. In terms of
the electrical system, there are other methods for the control system. The Arduino is not the
only digital device that can control the various sensors and solenoids. Although there are many
other devices that can do the same tasks, few are as specialized and cost-efficient. The only
other device that comes close is the Raspberry Pi. The Raspberry Pi is a small single-board
computer that runs a Debian-based Linux distribution. Although the Raspberry Pi is a more
powerful device than the Arduino UNO R3, in terms of costs, the Raspberry Pi is more than
what is needed for this project and is an unnecessary extra cost.
To increase operating DC voltage for the ultrasonic sensor, there are not many options
when the supply voltage is set to +12 V.
5. Preliminary Proposed Design
There are multiple systems that comprise this project. There is a main electrical system as
well as a mechanical and pneumatic system. The electrical system is comprised of three primary
components: Arduino, distance sensor, and solenoid valves. In addition to the user’s inputs, the
readings from the distance sensor is the basis to which the Arduino will respond to. The
solenoid valves will either let increase or decrease bag pressure depending on the height of the
bag.
For the mechanical system, there are also three primary components. There will be: an air
bag, compressor, and solenoid valves, with DOT air lines to connect them all. One may notice
ECE 499 Capstone Design Project Winter 2017
13
that solenoid valves are in both electrical and mechanical systems. This is because solenoid-
operated valves are how the electrical system affects the mechanical system’s state. Arguably
the distance sensor is only analyzing the state of the air bag without a changing mechanical
interaction. The only physical interaction the distance sensor has with the mechanical system is
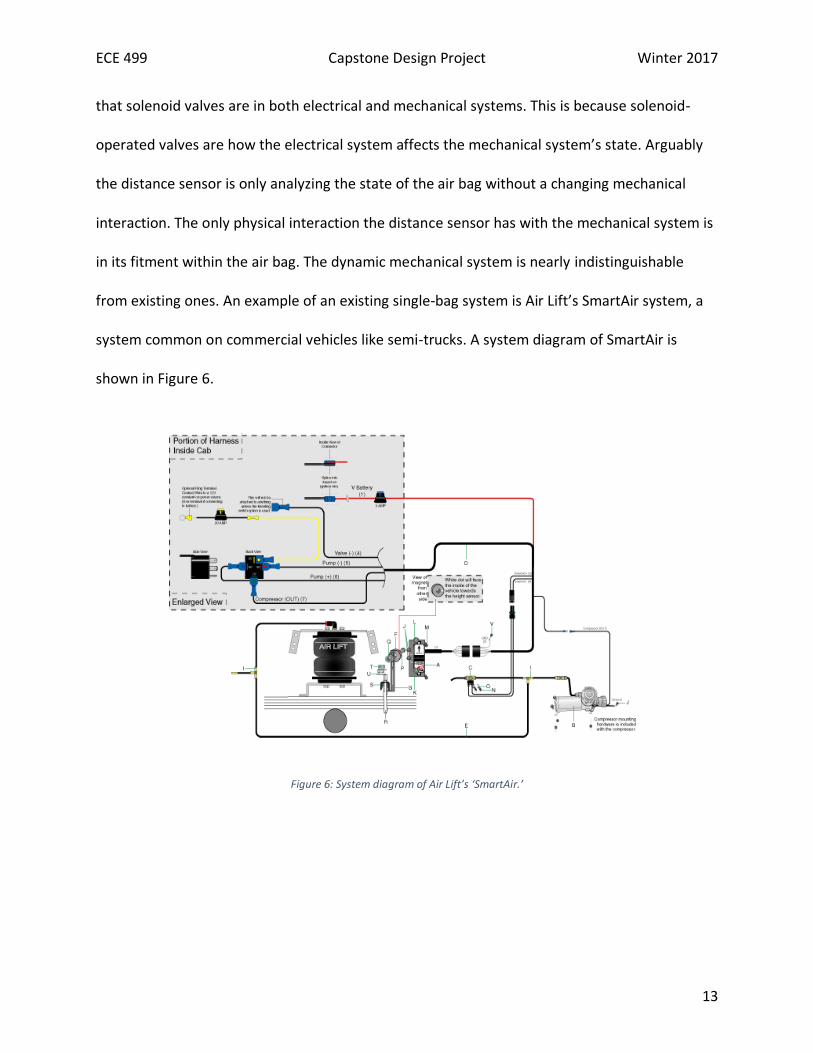
in its fitment within the air bag. The dynamic mechanical system is nearly indistinguishable
from existing ones. An example of an existing single-bag system is Air Lift’s SmartAir system, a
system common on commercial vehicles like semi-trucks. A system diagram of SmartAir is
shown in Figure 6.
Figure 6: System diagram of Air Lift’s ‘SmartAir.’
ECE 499 Capstone Design Project Winter 2017
14
Not shown in this diagram is an air reservoir, also called an ‘air tank.’ An air tank is used to
provide on-demand high pressure for the mechanical system. This reservoir frees up the
compressor from having to work whenever higher pressure is needed within the air bag.
Instead, compressed air is pushed into the air reservoir prior to any commands from the
controller. This allows for quicker response times between when an input is set, and when the
bag reaches the desired height. The reason the response time is quicker with an air reservoir is
because if the air compressor was the sole source of high-pressure air, there would be a latency
period where the compressor would have to turn on and spool up to create compressed air.
This latency time can take critical seconds out of response time. Using an air reservoir, it is
possible to make a closed-loop air system that stores the unwanted air pressure from the bag
(when the user wants a lower ride height) to be stored back into air reservoir for later use. This
could cut down power consumption from the air compressor as it would not have to activated
as frequently to replenish the pneumatic system with air. However, this design could negatively
affect the response time as the system could reach an equilibrium between the air bag and air
reservoir, at a pressure that is not desired by the user.
The Arduino will serve as the system controller. As for design requirements, the
controller must be able to accept analog inputs as the ultrasonic sensor’s output is a 0-10 VDC
signal. Because an Arduino’s analog input can only take voltages between 0 and 5 VDC, a voltage
divider must be used to step the maximum voltage down from 10 to 5 VDC. This means using the
voltage divider equation (R1/R1+R2) to equal 0.5, and have the output voltage split the two.
The Arduino will map the voltage spread into integer values between 0 and 1023. This yields a
resolution of 4.9 mV per unit. If testing requires a different input range and resolution, the
ECE 499 Capstone Design Project Winter 2017
15
Arduino function (analogReference( )) can be used to modify such parameters. The
microcontroller takes measurements every 100 microseconds (0.0001s) which is a frequency of
10 kHz. This frequency, combined with this resolution, should be adequate measurements for
this application.
The ultrasonic sensor is a UK6A and falls under the 18mm category for diameter. There
are a variety of ultrasonic sensors under this categorization, with different models representing
different distance ranges and characteristics. The UK6A for this project has a manufacturer
stated distance rating from 40mm (1.97 in) to 300mm (11.8 in). Most bags have a fully
compressed to fully extend range of about 2 inches to 9 inches, respectivelyviii. Although the
sensor has the range to detect all distances of the bag, there is a concern as to how accurate
the sensor readings will be as it is rarely recommended to work to a component to its maximum
abilities; there should be headroom in the sensor’s total range.
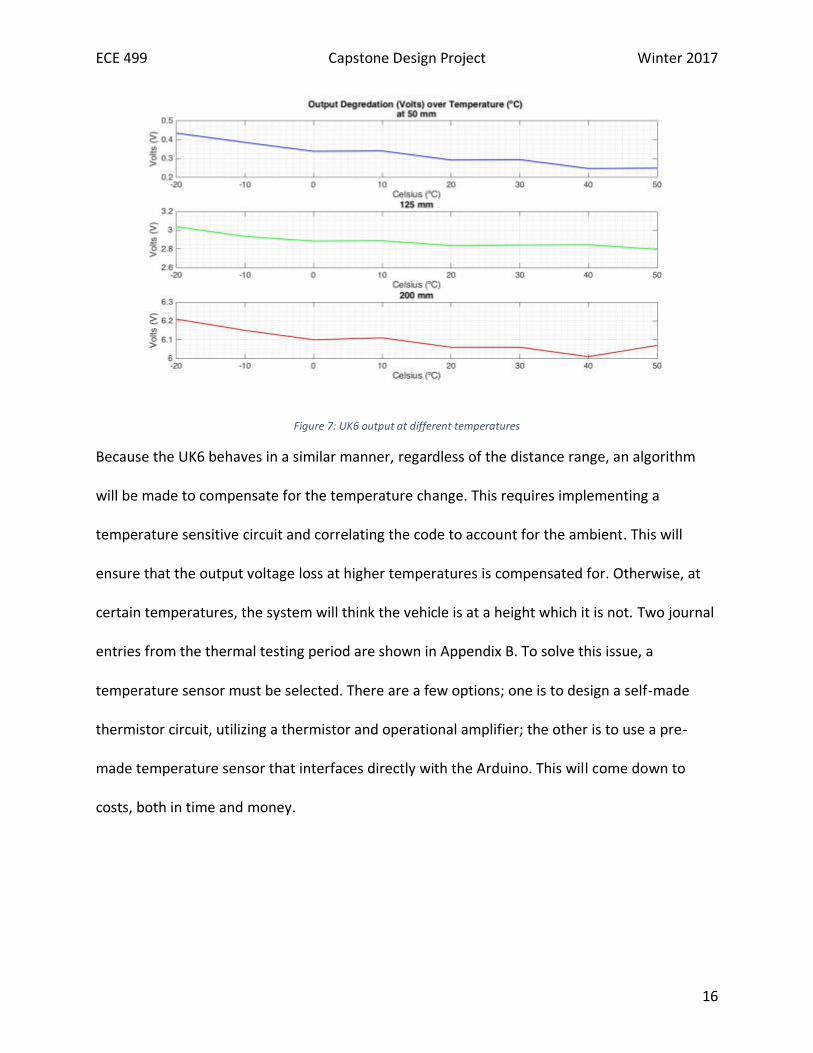
The UK6’s data sheet specified the sensor was able to safely operate from -20ºC to
+60ºC. To test the UK6’s real-world thermal performance, the sensor was tested in a thermal
chamber at GE’s Global Research Center under the supervision of Walt Dixon. To conduct
thermal testing, the sensor was connected to a DC power supply (set between +15V and +24V)
and a portable multimeter; the multimeter was used to read the sensor’s output voltage. The
sensor was tested from -20ºC to 50ºC at intervals of 10ºC. As shown in Figure 7, the sensor had
a similar output voltage degradation at various distances as temperature increases from -20ºC
to 50ºC.
ECE 499 Capstone Design Project Winter 2017
16
Figure 7: UK6 output at different temperatures
Because the UK6 behaves in a similar manner, regardless of the distance range, an algorithm
will be made to compensate for the temperature change. This requires implementing a
temperature sensitive circuit and correlating the code to account for the ambient. This will
ensure that the output voltage loss at higher temperatures is compensated for. Otherwise, at
certain temperatures, the system will think the vehicle is at a height which it is not. Two journal
entries from the thermal testing period are shown in Appendix B. To solve this issue, a
temperature sensor must be selected. There are a few options; one is to design a self-made
thermistor circuit, utilizing a thermistor and operational amplifier; the other is to use a pre-
made temperature sensor that interfaces directly with the Arduino. This will come down to
costs, both in time and money.
ECE 499 Capstone Design Project Winter 2017
17
6. Final Design and Implementation
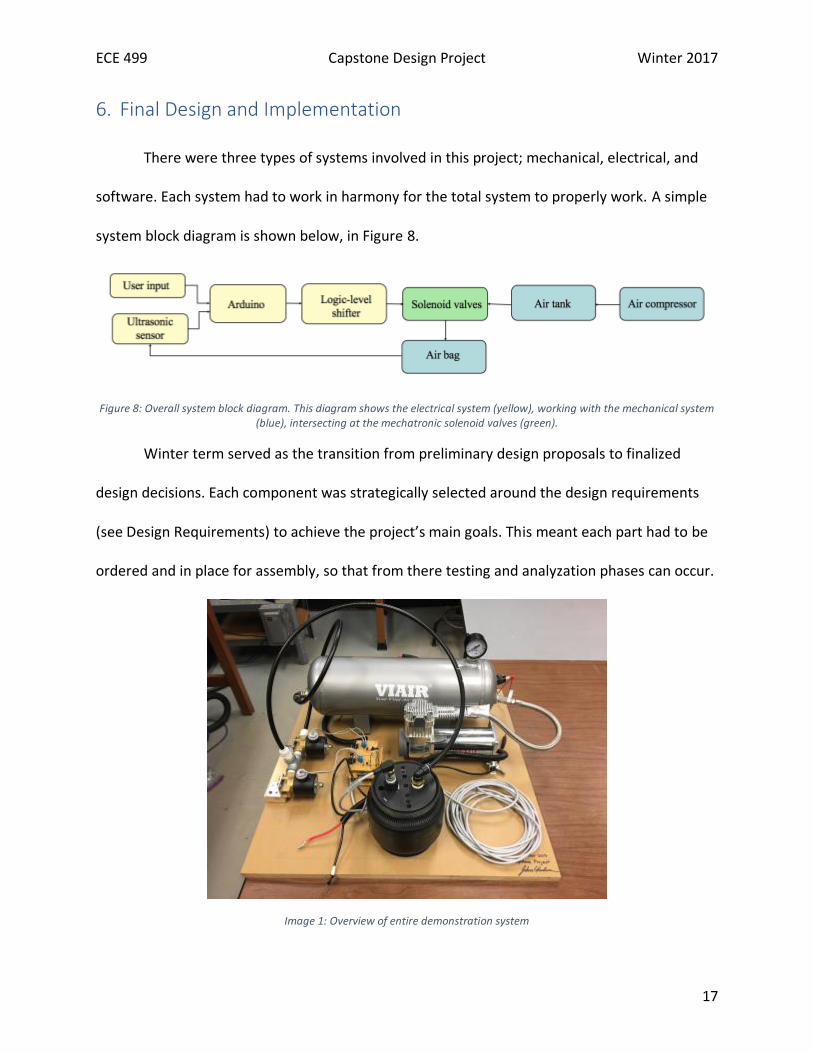
There were three types of systems involved in this project; mechanical, electrical, and
software. Each system had to work in harmony for the total system to properly work. A simple
system block diagram is shown below, in Figure 8.
Figure 8: Overall system block diagram. This diagram shows the electrical system (yellow), working with the mechanical system (blue), intersecting at the mechatronic solenoid valves (green).
Winter term served as the transition from preliminary design proposals to finalized
design decisions. Each component was strategically selected around the design requirements
(see Design Requirements) to achieve the project’s main goals. This meant each part had to be
ordered and in place for assembly, so that from there testing and analyzation phases can occur.
Image 1: Overview of entire demonstration system
ECE 499 Capstone Design Project Winter 2017
18
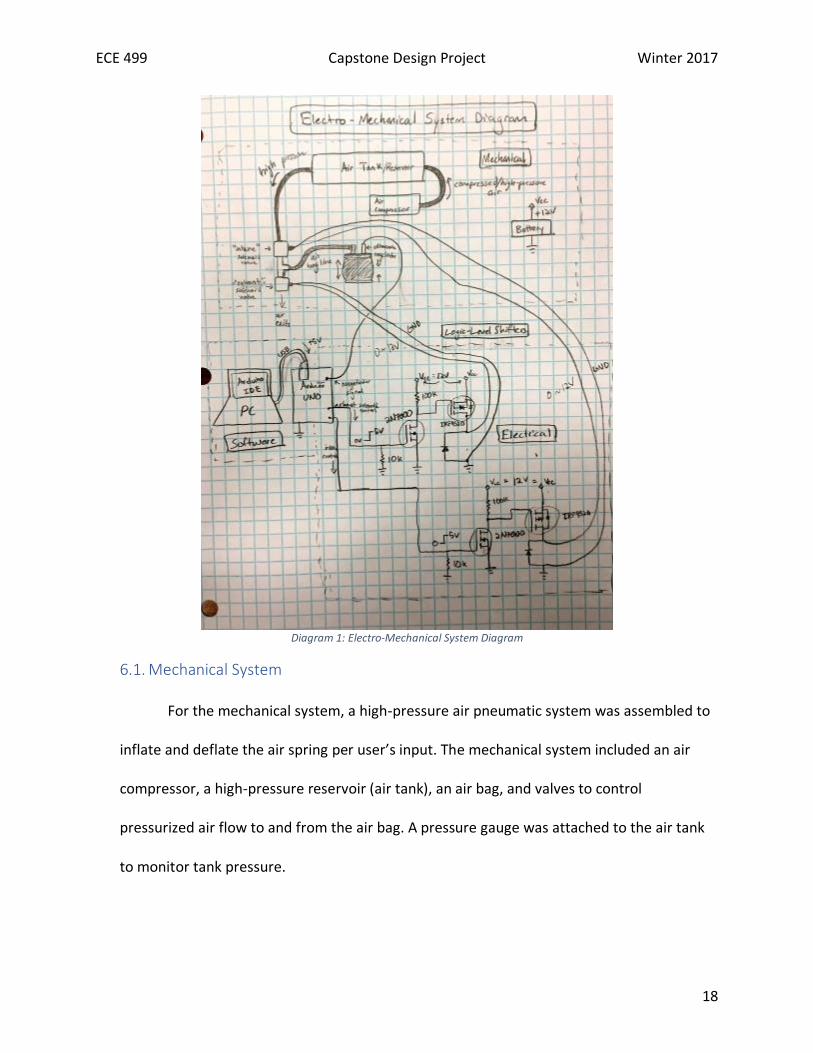
Diagram 1: Electro-Mechanical System Diagram
6.1. Mechanical System
For the mechanical system, a high-pressure air pneumatic system was assembled to
inflate and deflate the air spring per user’s input. The mechanical system included an air
compressor, a high-pressure reservoir (air tank), an air bag, and valves to control
pressurized air flow to and from the air bag. A pressure gauge was attached to the air tank
to monitor tank pressure.
ECE 499 Capstone Design Project Winter 2017
19
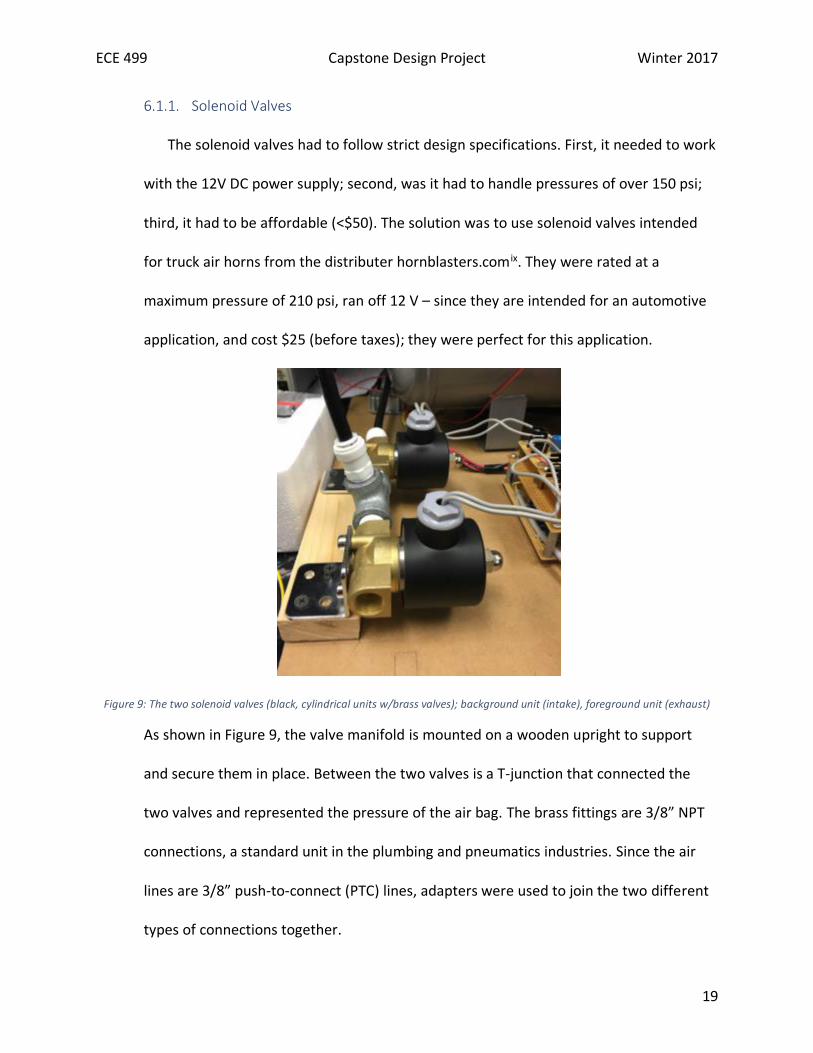
6.1.1. Solenoid Valves
The solenoid valves had to follow strict design specifications. First, it needed to work
with the 12V DC power supply; second, was it had to handle pressures of over 150 psi;
third, it had to be affordable (<$50). The solution was to use solenoid valves intended
for truck air horns from the distributer hornblasters.com ix. They were rated at a
maximum pressure of 210 psi, ran off 12 V – since they are intended for an automotive
application, and cost $25 (before taxes); they were perfect for this application.
Figure 9: The two solenoid valves (black, cylindrical units w/brass valves); background unit (intake), foreground unit (exhaust)
As shown in Figure 9, the valve manifold is mounted on a wooden upright to support
and secure them in place. Between the two valves is a T-junction that connected the
two valves and represented the pressure of the air bag. The brass fittings are 3/8” NPT
connections, a standard unit in the plumbing and pneumatics industries. Since the air
lines are 3/8” push-to-connect (PTC) lines, adapters were used to join the two different
types of connections together.
ECE 499 Capstone Design Project Winter 2017
20
Since the solenoids were rated at a maximum pressure of 210 psi, the unit was
noticeably hefty and required a sizeable amount of power. The solenoid required 12W
(1 A @ 12V) to activate the valve. Since the Arduino UNO can only output a max of 5V at
40mA, a logic-level shifter had to be designed to power the solenoids (see 6.2.2).
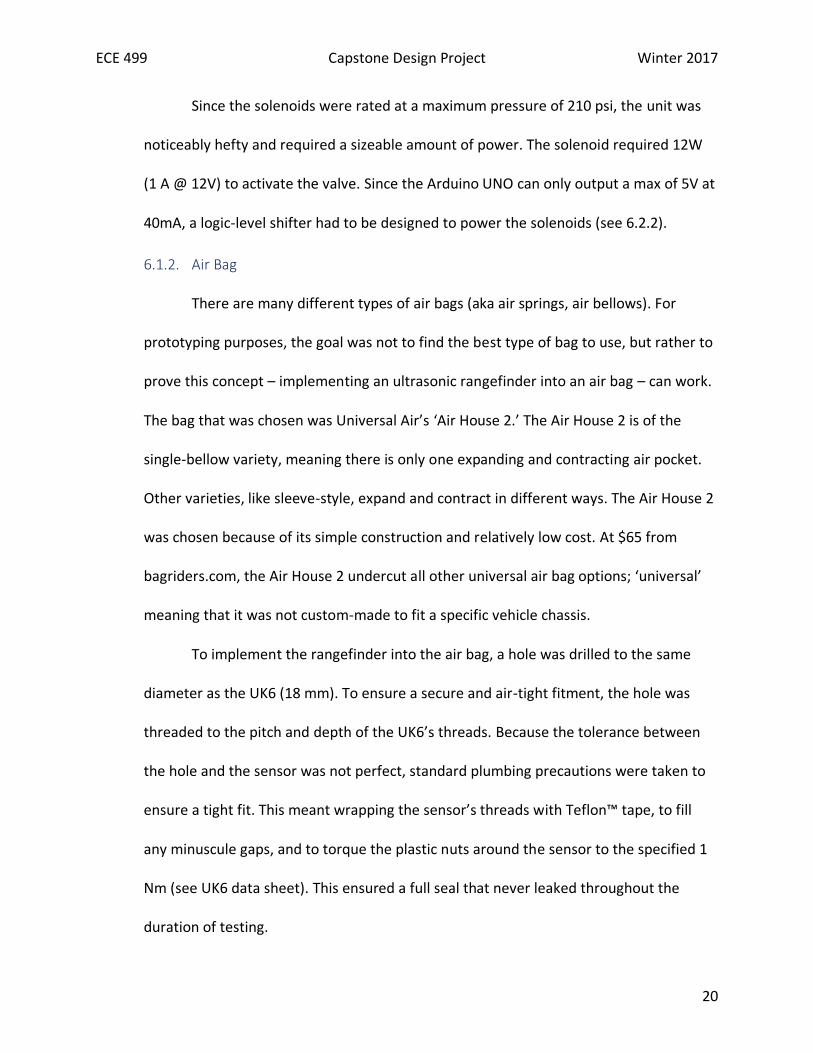
6.1.2. Air Bag
There are many different types of air bags (aka air springs, air bellows). For
prototyping purposes, the goal was not to find the best type of bag to use, but rather to
prove this concept – implementing an ultrasonic rangefinder into an air bag – can work.
The bag that was chosen was Universal Air’s ‘Air House 2.’ The Air House 2 is of the
single-bellow variety, meaning there is only one expanding and contracting air pocket.
Other varieties, like sleeve-style, expand and contract in different ways. The Air House 2
was chosen because of its simple construction and relatively low cost. At $65 from
bagriders.com, the Air House 2 undercut all other universal air bag options; ‘universal’
meaning that it was not custom-made to fit a specific vehicle chassis.
To implement the rangefinder into the air bag, a hole was drilled to the same
diameter as the UK6 (18 mm). To ensure a secure and air-tight fitment, the hole was
threaded to the pitch and depth of the UK6’s threads. Because the tolerance between
the hole and the sensor was not perfect, standard plumbing precautions were taken to
ensure a tight fit. This meant wrapping the sensor’s threads with Teflon™ tape, to fill
any minuscule gaps, and to torque the plastic nuts around the sensor to the specified 1
Nm (see UK6 data sheet). This ensured a full seal that never leaked throughout the
duration of testing.
ECE 499 Capstone Design Project Winter 2017
21
Figure 10: Air House 2, compressed, no internal pressure, w/UK6 rangefinder, w/o air line
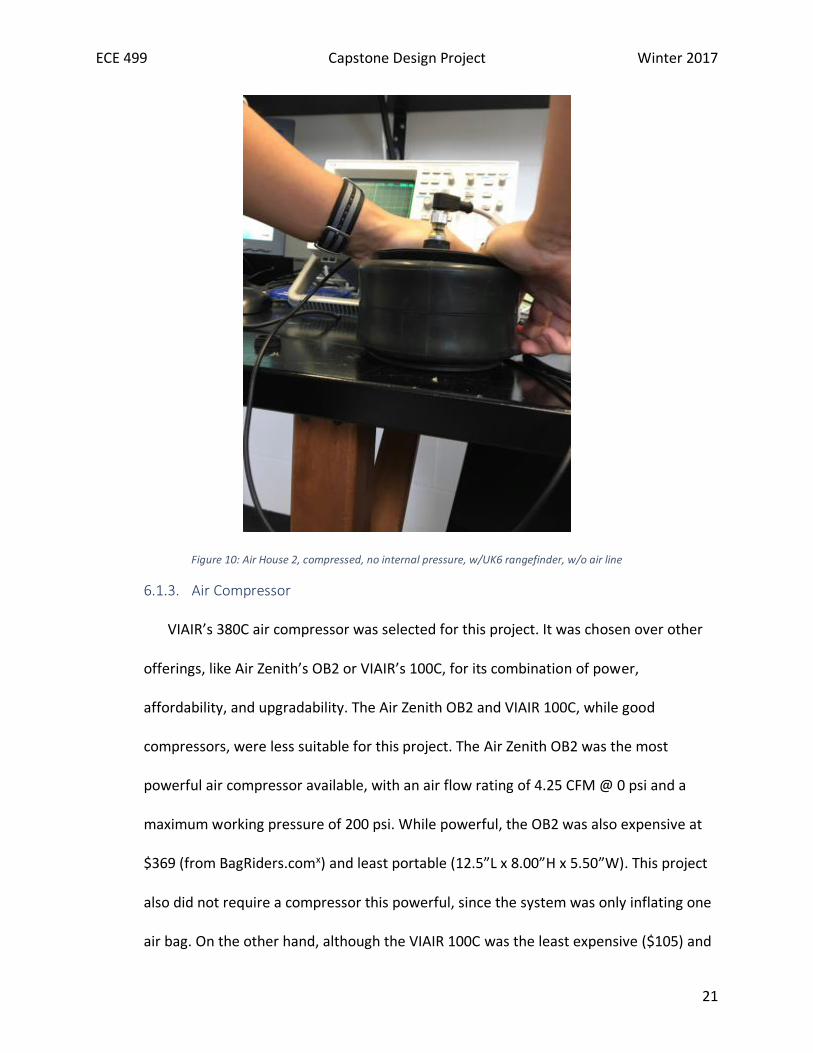
6.1.3. Air Compressor
VIAIR’s 380C air compressor was selected for this project. It was chosen over other
offerings, like Air Zenith’s OB2 or VIAIR’s 100C, for its combination of power,
affordability, and upgradability. The Air Zenith OB2 and VIAIR 100C, while good
compressors, were less suitable for this project. The Air Zenith OB2 was the most
powerful air compressor available, with an air flow rating of 4.25 CFM @ 0 psi and a
maximum working pressure of 200 psi. While powerful, the OB2 was also expensive at
$369 (from BagRiders.comx) and least portable (12.5”L x 8.00”H x 5.50”W). This project
also did not require a compressor this powerful, since the system was only inflating one
air bag. On the other hand, although the VIAIR 100C was the least expensive ($105) and
ECE 499 Capstone Design Project Winter 2017
22
most compact (6.35”L x 3.30” W x 4.90”H), it was also the least powerful of the three
compressors with an air flow rating of 1.27 CFM @ 0 psi and a maximum pressure rating
of 130psi. The VIAIR 380C served as the happy-medium amongst the group, with a flow
rate of 1.34 CFM @ 0 psi and a maximum pressure rating of 200 psi at $193. While the
flow rate of the 380C was not a significant improvement from the 100C, the maximum
pressure rating of 200 psi.
Figure 11: The VIAIR 380C in the foreground, with the 2 gallon air tank in the background
6.2. Electrical System
The electrical system was the most design-intensive aspect of this project. The major
components of the electrical system were the UK6 ultrasonic rangefinder, the logic-level shifter,
the MCP9808 temperature sensor, and the Arduino UNO R3. Each component played an
important role in as either a method of obtaining data (e.g. MCP9808 or UK6), or processing
data/signals (e.g. level shifter, Arduino UNO).
ECE 499 Capstone Design Project Winter 2017
23
6.2.1. Ultrasonic Rangefinder
The UK6-D1-0E ultrasonic sensor was chosen as the rangefinder early in the
engineering design process (see 5.0.0 Preliminary Proposed Design), due to its range
limits and electrical characteristics. The UK6’s operating voltage can be anywhere
between 15-30V. Because the minimum 15V is less than that of the required 12V
source, a DC-to-DC ‘buck’ converter was needed to power the sensor. The reason the
UK6 requires such a high voltage is because of the ultrasonic’s piezoelectric circuitry.
Piezoelectric circuits require a high voltage to vibrate the sound-producing element. A
$20 buck 12V to 24V converter solved this issue.
The UK6-D1-0E differs from other UK6 variants in that it has an analog output
signal and a removable connection, a M12 ‘quick-disconnect’.
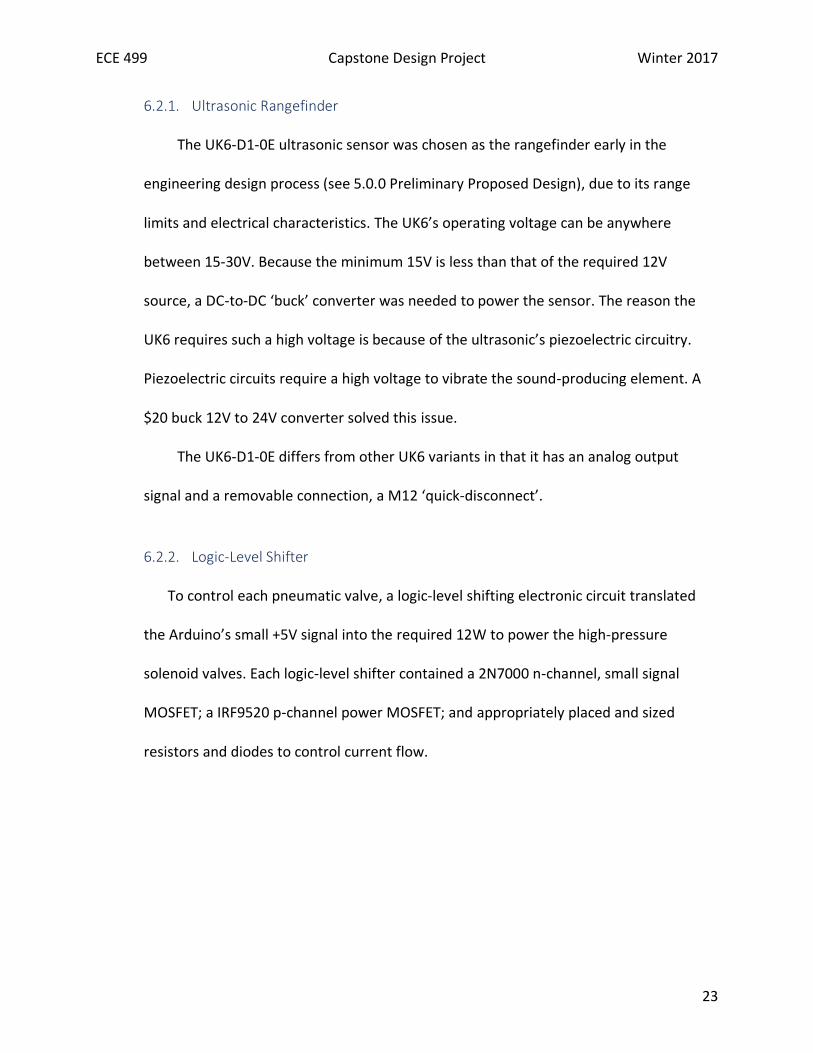
6.2.2. Logic-Level Shifter
To control each pneumatic valve, a logic-level shifting electronic circuit translated
the Arduino’s small +5V signal into the required 12W to power the high-pressure
solenoid valves. Each logic-level shifter contained a 2N7000 n-channel, small signal
MOSFET; a IRF9520 p-channel power MOSFET; and appropriately placed and sized
resistors and diodes to control current flow.
ECE 499 Capstone Design Project Winter 2017
24
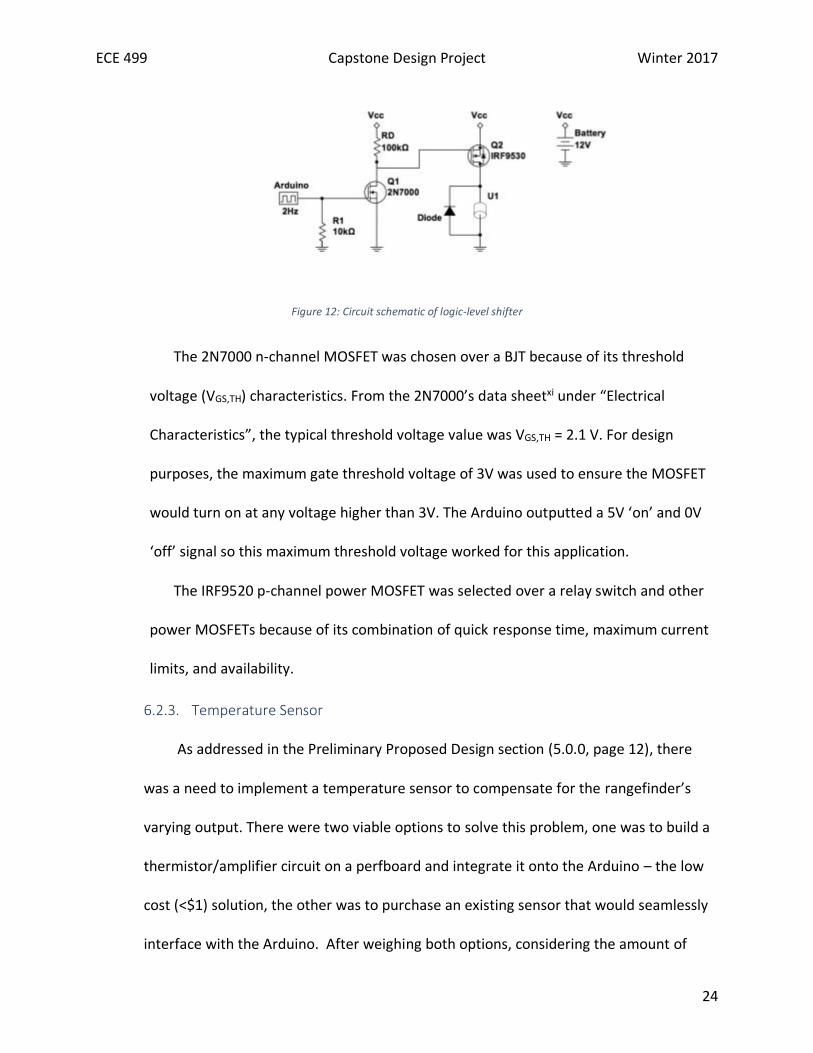
Figure 12: Circuit schematic of logic-level shifter
The 2N7000 n-channel MOSFET was chosen over a BJT because of its threshold
voltage (VGS,TH) characteristics. From the 2N7000’s data sheetxi under “Electrical
Characteristics”, the typical threshold voltage value was VGS,TH = 2.1 V. For design
purposes, the maximum gate threshold voltage of 3V was used to ensure the MOSFET
would turn on at any voltage higher than 3V. The Arduino outputted a 5V ‘on’ and 0V
‘off’ signal so this maximum threshold voltage worked for this application.
The IRF9520 p-channel power MOSFET was selected over a relay switch and other
power MOSFETs because of its combination of quick response time, maximum current
limits, and availability.
6.2.3. Temperature Sensor
As addressed in the Preliminary Proposed Design section (5.0.0, page 12), there
was a need to implement a temperature sensor to compensate for the rangefinder’s
varying output. There were two viable options to solve this problem, one was to build a
thermistor/amplifier circuit on a perfboard and integrate it onto the Arduino – the low
cost (<$1) solution, the other was to purchase an existing sensor that would seamlessly
interface with the Arduino. After weighing both options, considering the amount of
ECE 499 Capstone Design Project Winter 2017
25
time and budget available, the existing sensor solution was selected – the MCP9808.
This would maximize the amount of time that could be spent on other aspects of the
project, and at only $4.95, the difference in price between the two methods was not
enough to justify the time that would be lost in designing, building, implementing,
designing a proprietary sensor. Furthermore, the selected MCP9808 temperature sensor
interfaced directly with the Arduino as it ran the I2C protocol. Not only did this decision
save time, but also simplified the circuit and code; a frequently sought-after trait as it
minimizes the number of parameters that could go wrong.
The MCP9808 was purchased from adafruit.comxii. To implement the sensor into
the circuit, the sensor’s power (Vdd) and ground (Gnd) were connected to the Arduino
UNO. The sensor’s ‘SCL’ and ‘SDA’ pins were connected to the Arduino’s respective pins,
that represent I2C’s clock and data lines, respectively. In the code, the sensor was
defined as an I2C device using the phrase “#include <Wire.h> #include
“Adafruit_MCP9808.h”’. To incorporate the temperature values within the set
parameters, the real-time temperature sensor readout was compared to that of 10ºC
increments, set as an array, as measured during the thermal testing session. The closest
reference temperature to the temperature readout was represented as a constant
‘correction factor’ to multiply the rangefinder’s output by.
6.2.4. Battery
The electrical system was designed around a 12V battery as that is the standard
used in automobiles. To best simulate a system used in a car, the best option was to use
a car battery with a capacity of 35amp/hours or more. However, due to cost and
ECE 499 Capstone Design Project Winter 2017
26
packaging restraints of a display setup, a battery of this size could not be used. Instead,
a smaller battery of only 7amp/hours was used. This was more than enough to power
the ultrasonic sensors and the solenoids, but not enough to fully power the air
compressor. Because of this, the compressor could only pressurize the air tank to ~60psi
at full battery charge. For demonstration purposes, a secondary DC power supply was
on hand to power the compressor.
6.3. Software
6.3.1. Arduino IDE
The entire automation process was controlled through the Arduino, running of
code written in the Arduino IDE program; to see code, go to Appendix A. The basis of
the code was to take the analog voltage readout of the rangefinder, convert it to digital
data using the Arduino’s built-in analog-to-digital converter (ADC), then process the data
in conjunction with the temperature sensor and the user’s input. Each of these
components was listed as an input variable. The data was processed to determine three
possibilities: one, the high-pressure valve opens to inflate the air bag; two, the exhaust
valves opens to deflate the bag; or three, keep both valves shut and keep the bag at its
current state. The second determination was for how long would one of these processes
be done for?
To determine this, a proportional-integral-derivative (PID) controller was designed
to address the error – the difference between the current bag height and the user’s
desired height. For background, a PID controller is a control loop feedback mechanism
used to calculate error. A block diagram of this system is shown below in Diagram 2.
ECE 499 Capstone Design Project Winter 2017
27
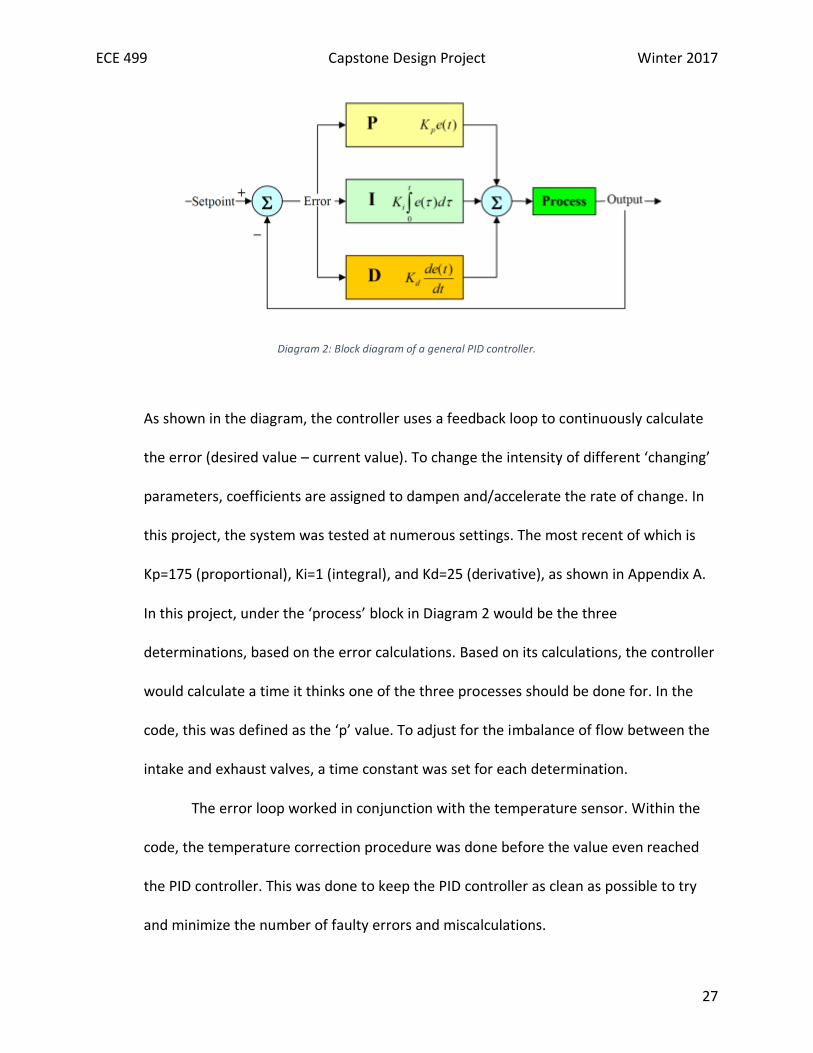
Diagram 2: Block diagram of a general PID controller.
As shown in the diagram, the controller uses a feedback loop to continuously calculate
the error (desired value – current value). To change the intensity of different ‘changing’
parameters, coefficients are assigned to dampen and/accelerate the rate of change. In
this project, the system was tested at numerous settings. The most recent of which is
Kp=175 (proportional), Ki=1 (integral), and Kd=25 (derivative), as shown in Appendix A.
In this project, under the ‘process’ block in Diagram 2 would be the three
determinations, based on the error calculations. Based on its calculations, the controller
would calculate a time it thinks one of the three processes should be done for. In the
code, this was defined as the ‘p’ value. To adjust for the imbalance of flow between the
intake and exhaust valves, a time constant was set for each determination.
The error loop worked in conjunction with the temperature sensor. Within the
code, the temperature correction procedure was done before the value even reached
the PID controller. This was done to keep the PID controller as clean as possible to try
and minimize the number of faulty errors and miscalculations.
ECE 499 Capstone Design Project Winter 2017
28
7. Performance Estimates and Results
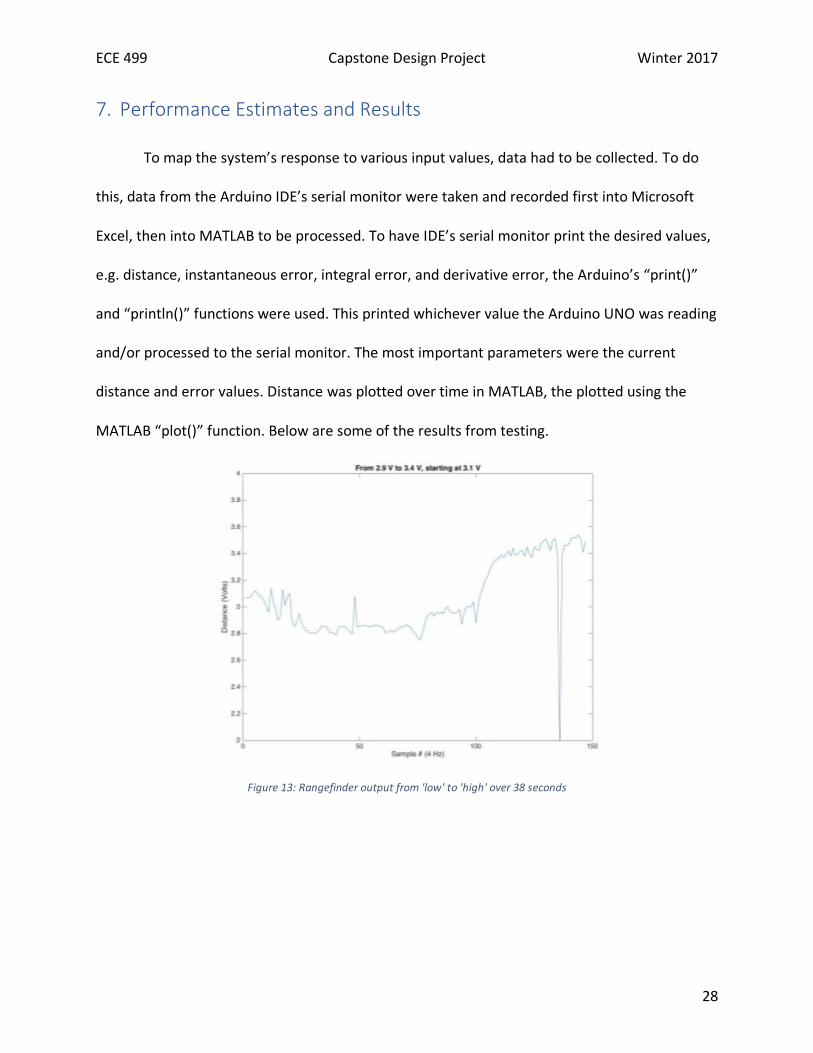
To map the system’s response to various input values, data had to be collected. To do
this, data from the Arduino IDE’s serial monitor were taken and recorded first into Microsoft
Excel, then into MATLAB to be processed. To have IDE’s serial monitor print the desired values,
e.g. distance, instantaneous error, integral error, and derivative error, the Arduino’s “print()”
and “println()” functions were used. This printed whichever value the Arduino UNO was reading
and/or processed to the serial monitor. The most important parameters were the current
distance and error values. Distance was plotted over time in MATLAB, the plotted using the
MATLAB “plot()” function. Below are some of the results from testing.
Figure 13: Rangefinder output from 'low' to 'high' over 38 seconds
ECE 499 Capstone Design Project Winter 2017
29
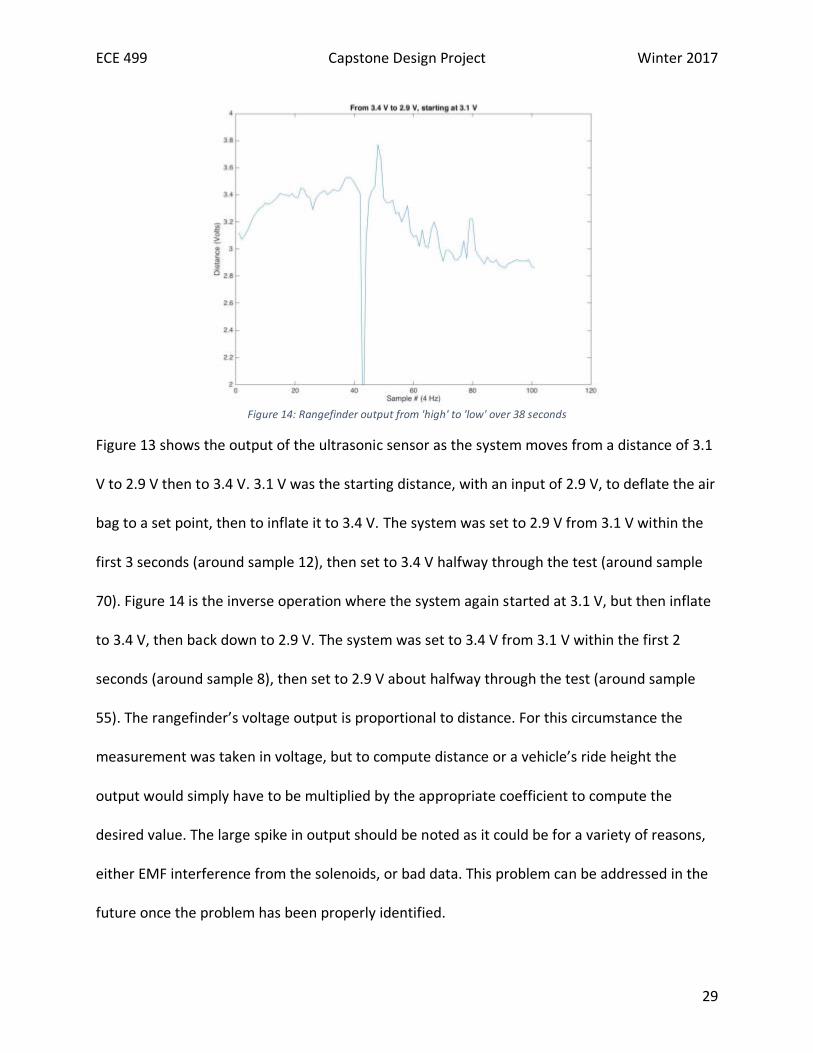
Figure 14: Rangefinder output from 'high' to 'low' over 38 seconds
Figure 13 shows the output of the ultrasonic sensor as the system moves from a distance of 3.1
V to 2.9 V then to 3.4 V. 3.1 V was the starting distance, with an input of 2.9 V, to deflate the air
bag to a set point, then to inflate it to 3.4 V. The system was set to 2.9 V from 3.1 V within the
first 3 seconds (around sample 12), then set to 3.4 V halfway through the test (around sample
70). Figure 14 is the inverse operation where the system again started at 3.1 V, but then inflate
to 3.4 V, then back down to 2.9 V. The system was set to 3.4 V from 3.1 V within the first 2
seconds (around sample 8), then set to 2.9 V about halfway through the test (around sample
55). The rangefinder’s voltage output is proportional to distance. For this circumstance the
measurement was taken in voltage, but to compute distance or a vehicle’s ride height the
output would simply have to be multiplied by the appropriate coefficient to compute the
desired value. The large spike in output should be noted as it could be for a variety of reasons,
either EMF interference from the solenoids, or bad data. This problem can be addressed in the
future once the problem has been properly identified.
ECE 499 Capstone Design Project Winter 2017
30
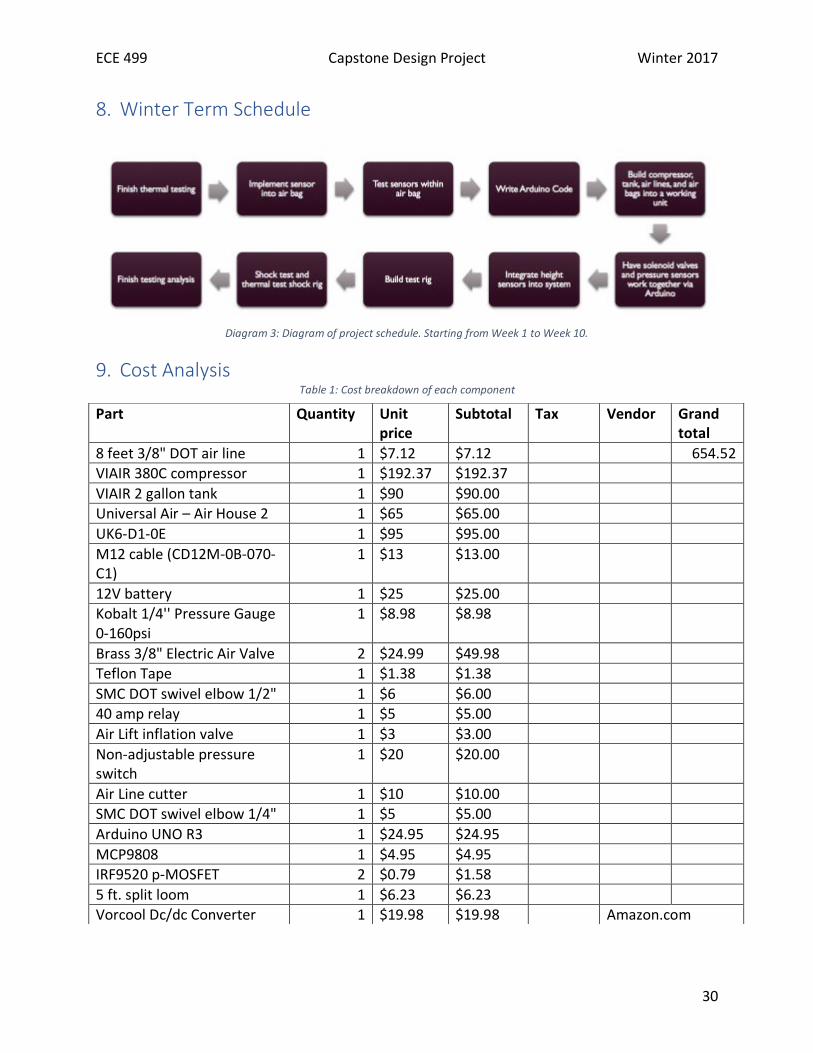
8. Winter Term Schedule
Diagram 3: Diagram of project schedule. Starting from Week 1 to Week 10.
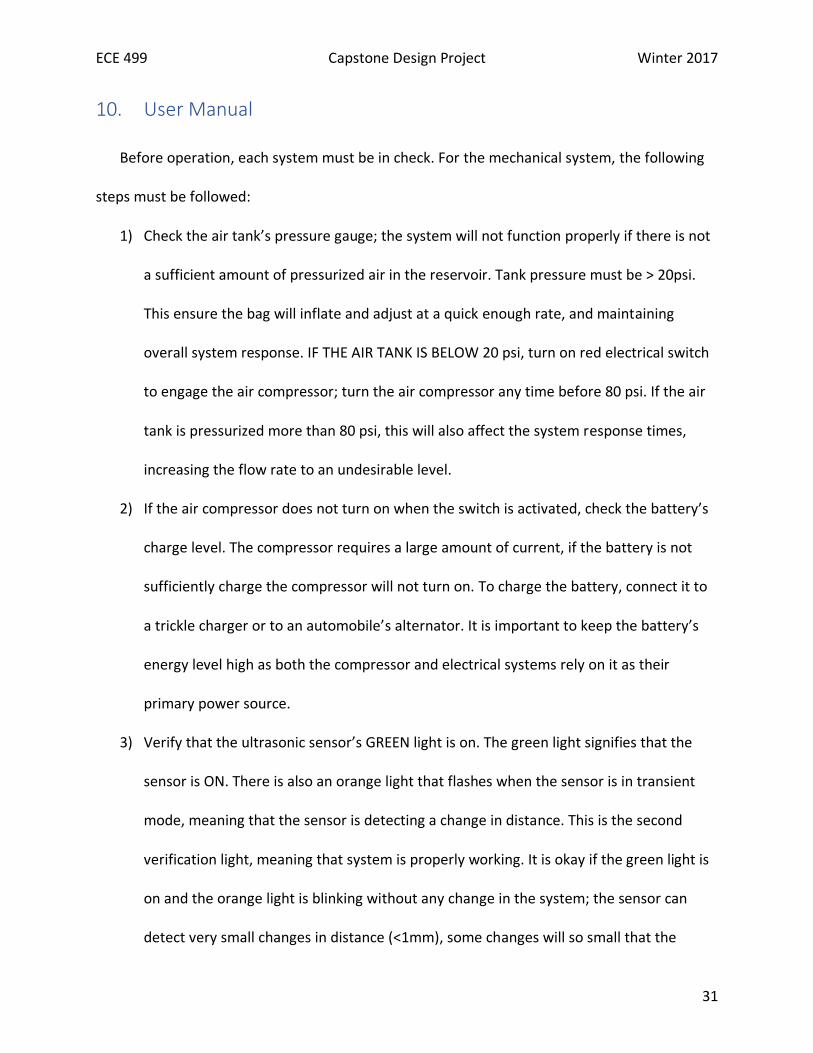
9. Cost Analysis Table 1: Cost breakdown of each component
Part Quantity Unit price
Subtotal Tax Vendor Grand total
8 feet 3/8" DOT air line 1 $7.12 $7.12
654.52
VIAIR 380C compressor 1 $192.37 $192.37
VIAIR 2 gallon tank 1 $90 $90.00
Universal Air – Air House 2 1 $65 $65.00
UK6-D1-0E 1 $95 $95.00
M12 cable (CD12M-0B-070-C1)
1 $13 $13.00
12V battery 1 $25 $25.00
Kobalt 1/4'' Pressure Gauge 0-160psi
1 $8.98 $8.98
Brass 3/8" Electric Air Valve 2 $24.99 $49.98
Teflon Tape 1 $1.38 $1.38
SMC DOT swivel elbow 1/2" 1 $6 $6.00
40 amp relay 1 $5 $5.00
Air Lift inflation valve 1 $3 $3.00
Non-adjustable pressure switch
1 $20 $20.00
Air Line cutter 1 $10 $10.00
SMC DOT swivel elbow 1/4" 1 $5 $5.00
Arduino UNO R3 1 $24.95 $24.95
MCP9808 1 $4.95 $4.95
IRF9520 p-MOSFET 2 $0.79 $1.58
5 ft. split loom 1 $6.23 $6.23
Vorcool Dc/dc Converter 1 $19.98 $19.98
Amazon.com
ECE 499 Capstone Design Project Winter 2017
31
10. User Manual
Before operation, each system must be in check. For the mechanical system, the following
steps must be followed:
1) Check the air tank’s pressure gauge; the system will not function properly if there is not
a sufficient amount of pressurized air in the reservoir. Tank pressure must be > 20psi.
This ensure the bag will inflate and adjust at a quick enough rate, and maintaining
overall system response. IF THE AIR TANK IS BELOW 20 psi, turn on red electrical switch
to engage the air compressor; turn the air compressor any time before 80 psi. If the air
tank is pressurized more than 80 psi, this will also affect the system response times,
increasing the flow rate to an undesirable level.
2) If the air compressor does not turn on when the switch is activated, check the battery’s
charge level. The compressor requires a large amount of current, if the battery is not
sufficiently charge the compressor will not turn on. To charge the battery, connect it to
a trickle charger or to an automobile’s alternator. It is important to keep the battery’s
energy level high as both the compressor and electrical systems rely on it as their
primary power source.
3) Verify that the ultrasonic sensor’s GREEN light is on. The green light signifies that the
sensor is ON. There is also an orange light that flashes when the sensor is in transient
mode, meaning that the sensor is detecting a change in distance. This is the second
verification light, meaning that system is properly working. It is okay if the green light is
on and the orange light is blinking without any change in the system; the sensor can
detect very small changes in distance (<1mm), some changes will so small that the
ECE 499 Capstone Design Project Winter 2017
32
system will not be able to account for the minute changes in distances, especially at a
steady-state.
4) Once the previous steps are completed, connect the Arduino UNO to a computer with
Arduino IDE. While the system is on, upload the code onto the Arduino board and open
the ‘Serial Monitor’ function within Arduino IDE. In the dialogue entry, the user can
enter a desired distance (in volts).
11. Future Work
This project was completed within the allotted time of ECE-499, however the project has
more potential. There are [three] key improvements that need to be achieved to take this
project to the next level. First is a more controlled design of the mechanical system, specifically
within the valve manifold. Since this project was time limited, a proper manifold could not be
designed in tandem with the rest of the project. Flow rates were not precisely calculated and
preexisting components were used merely to showcase the ability of the technology. To
improve the mechanical system, a manifold design that is more carefully designed will be
needed to more precisely control air flow to and from the air bag. Possible solutions are to use
a smaller solenoid setup that utilizes two valves that operate at different pressures, controlling
air flow. Furthermore, digital pressure sensors can work in tandem with the height sensor to as
another measurement parameter. Measuring more parameters will give better data to the
control loop, which in turn will better control the system’s transient and steady-state errors.
Since the air pressure within the tank is not always constant, pressure should be monitored and
ECE 499 Capstone Design Project Winter 2017
33
calculated to account for the changes in air flow. This would also help the system’s inconsistent
transient and steady-state behavior at different air tank pressures.
Although the ultrasonic sensor’s output degradation due to temperature was accounted for,
the placement of the sensor was not in an ideal location. To get the most accurate readings,
minimizing the most unwanted and external factors that may impede the signal, the
temperature sensor should be implemented into the bag, measuring its internal temperature.
For the sake of even more accurate data, the sensor should measure more than the bag
environment’s temperature, it should also measure humidity as both temperature and
humidity affect acoustic characteristics. To further increase sensor accuracy, the increments of
temperature reference array can be more detailed. At the moment, the temperature reference
array is incremented at 10ºC, but this should more detailed in the future. This required more
thermal testing that this project could not accommodate, but is an important aspect that
should be addressed in the future.
Measuring humidity has additional benefits. All current air suspension systems do not
account for humidity which can cause issues within the pneumatic system, especially during the
winter as water vapor within the system can freeze and cause damage. To avoid these
problems, current systems utilize a water trap to captured unwanted moisture from within the
system. This method can be unnecessarily laborious as the water trap must be manually
serviced. With a humidity sensor, this process can be automated, which reduces the number of
variables a user must worry about.
To diagnose the observed measurement noise, numerous steps can be taken. To detect
whether the problem exists within the sensor or Arduino, both must be tested individually. In
ECE 499 Capstone Design Project Winter 2017
34
the case of the rangefinder, testing in isolation means no solenoids or Arduino to interfere with
the sensor. Purely take voltage measurements at various distances then start to build the rest
of the system around it to diagnose the problem; this is only one method. To test the Arduino, a
reference voltage can be sent to the Arduino’s input while the solenoids operate to detect if
there’s an EMI (electromagnetic interference) disturbing the Arduino’s circuitry. If diagnosing
the problem leads to a dead end, other components should be considered, like the air
compressor.
12. Conclusions
This project covered many of the skills, lessons, and resources accumulated over the
curriculum of Electrical Engineering at Union College. The most helpful courses were ECE-363 (a
circuit design and electronics course), ECE/BNG-386 (a biomedical instrumentation course), and
ECE-366 (a control systems course).
Readdressing the goals set at the beginning of the project, many of them were met.
Suffice to say the project was successful. However, comparing the project’s current state to the
first conceptualization of the project, there are noticeable differences. For example, the size of
some components was not what was expected; scale can be difficult to visualize without any
preexisting model. Furthermore, some of the obstacles encountered during the process were
not expected; although the possibility for unexpected problems should always be expected.
Arguably the most important lessons learned were those unrelated to engineering.
Issues with backorders and shipping errors taught many of these lessons. Working in synergy
with the machine shop, Walt, and electrical shop to get the project up and working took a level
ECE 499 Capstone Design Project Winter 2017
35
of organization and communication that would be difficult to teach in class. However, in doing
so, helped strength the connections offered from Union College.
13. Acknowledgements • Walt Dixon, Project Advisor, ECE Department • Prof. James Hedrick, ECE faculty • Prof. Takashi Buma, Academic Advisor, ECE faculty • Prof. Andy Huisman, Chemistry Department • Paul Tompkins, Union College Machine Shop • Gene Davison, ECE Lab manager
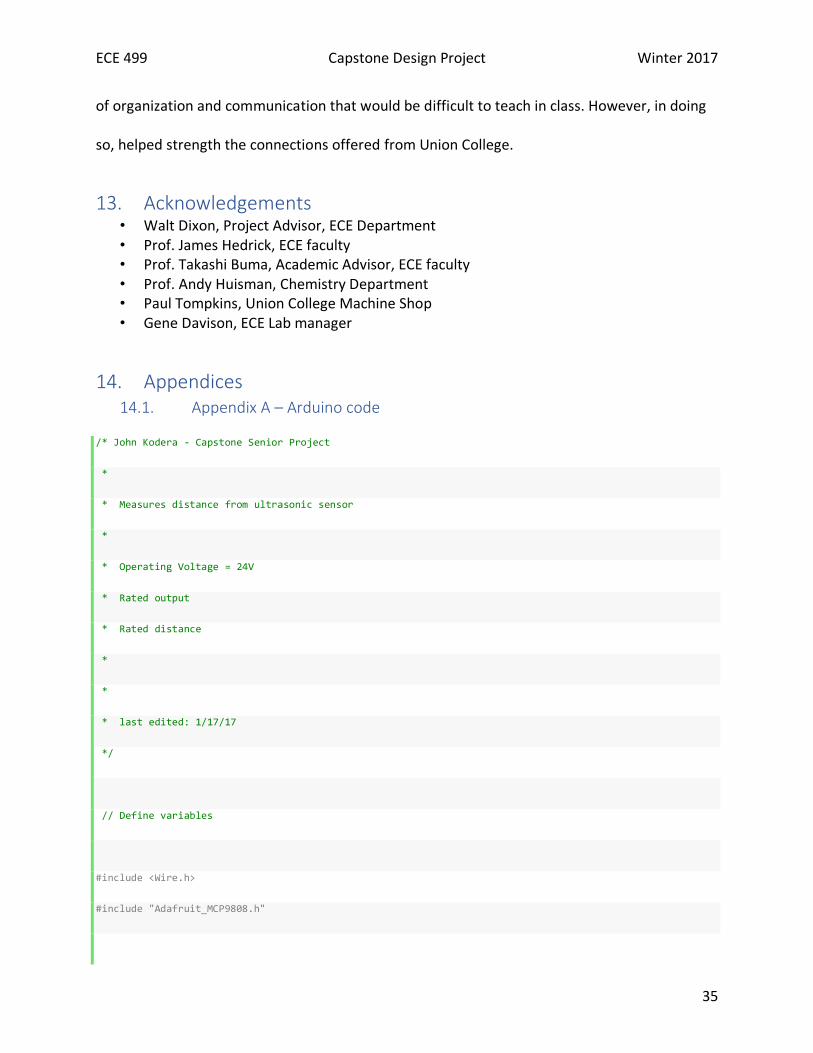
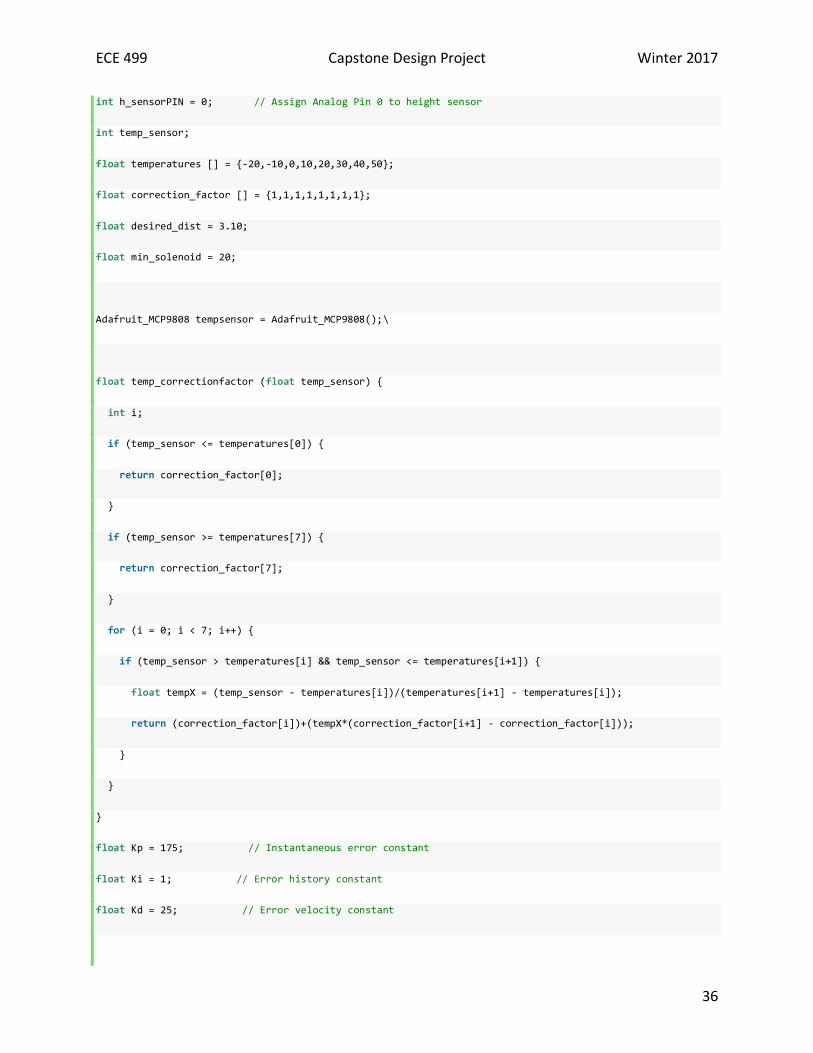
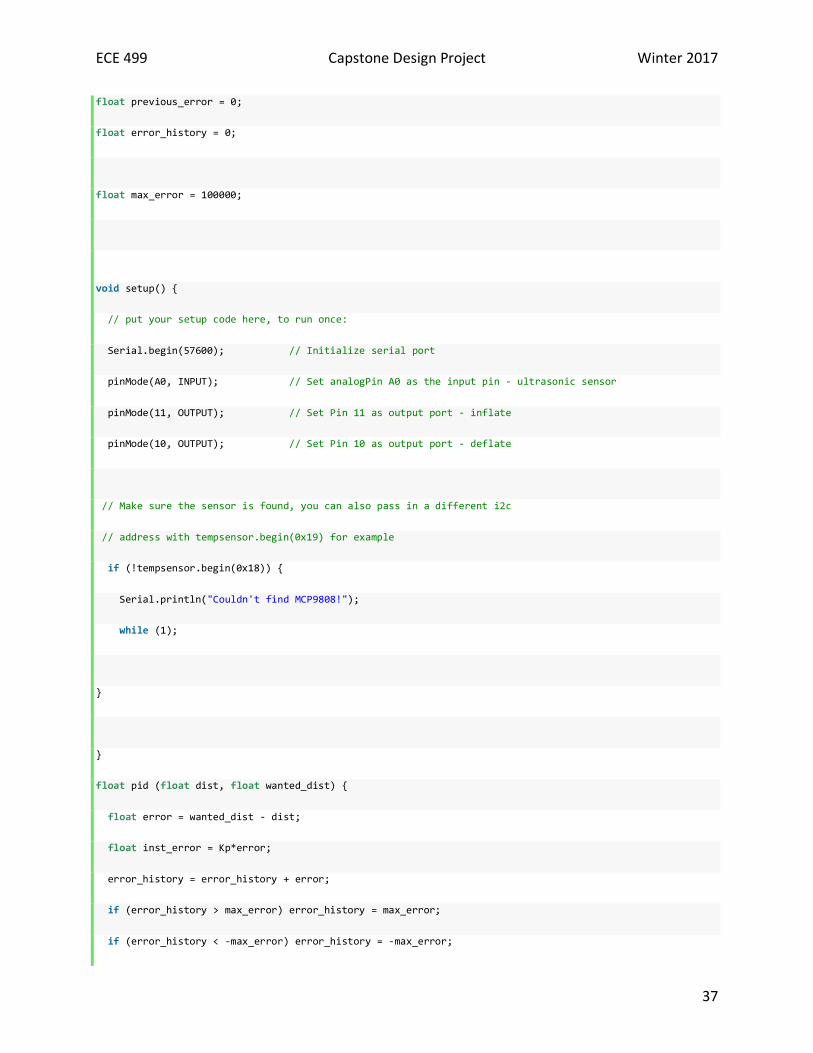
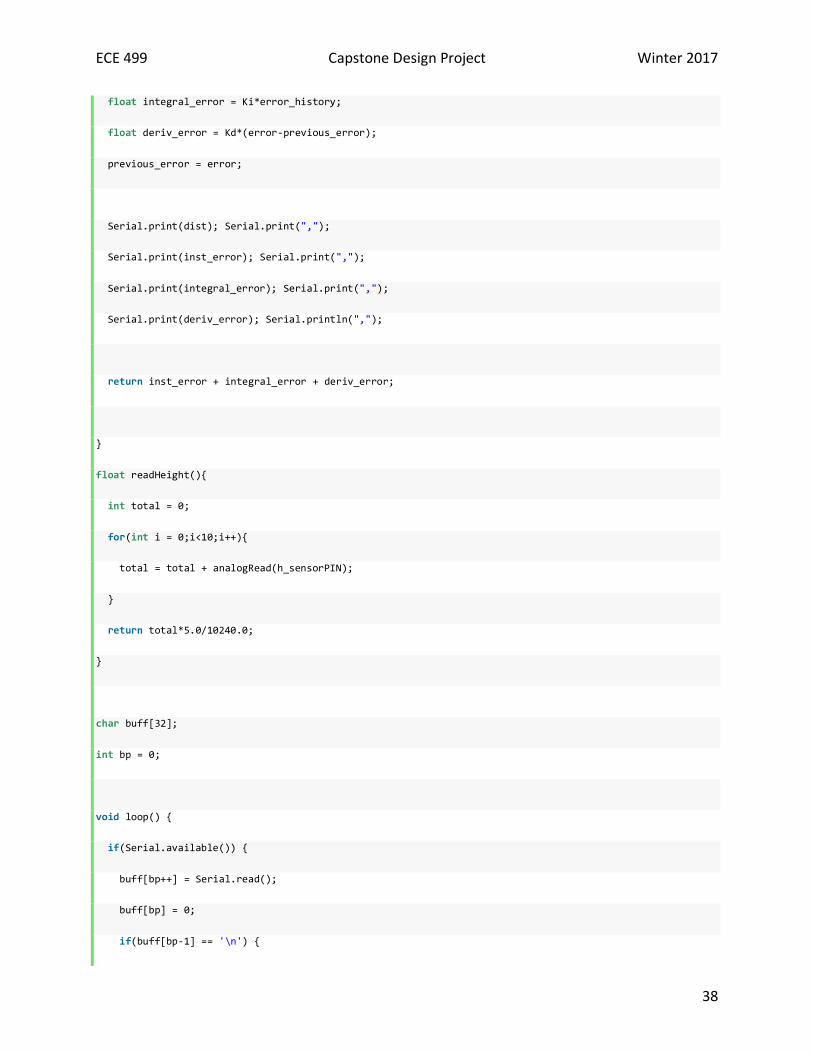
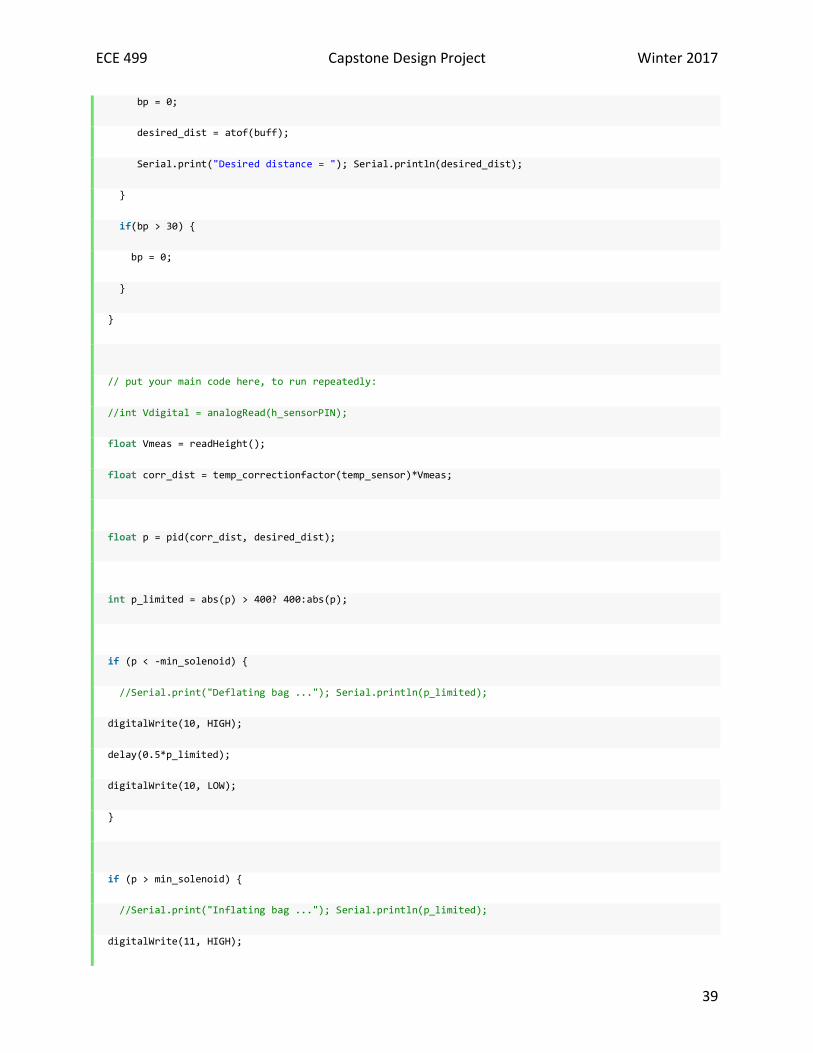
14. Appendices 14.1. Appendix A – Arduino code
/* John Kodera - Capstone Senior Project
*
* Measures distance from ultrasonic sensor
*
* Operating Voltage = 24V
* Rated output
* Rated distance
*
*
* last edited: 1/17/17
*/
// Define variables
#include <Wire.h>
#include "Adafruit_MCP9808.h"
ECE 499 Capstone Design Project Winter 2017
36
int h_sensorPIN = 0; // Assign Analog Pin 0 to height sensor
int temp_sensor;
float temperatures [] = {-20,-10,0,10,20,30,40,50};
float correction_factor [] = {1,1,1,1,1,1,1,1};
float desired_dist = 3.10;
float min_solenoid = 20;
Adafruit_MCP9808 tempsensor = Adafruit_MCP9808();\
float temp_correctionfactor (float temp_sensor) {
int i;
if (temp_sensor <= temperatures[0]) {
return correction_factor[0];
}
if (temp_sensor >= temperatures[7]) {
return correction_factor[7];
}
for (i = 0; i < 7; i++) {
if (temp_sensor > temperatures[i] && temp_sensor <= temperatures[i+1]) {
float tempX = (temp_sensor - temperatures[i])/(temperatures[i+1] - temperatures[i]);
return (correction_factor[i])+(tempX*(correction_factor[i+1] - correction_factor[i]));
}
}
}
float Kp = 175; // Instantaneous error constant
float Ki = 1; // Error history constant
float Kd = 25; // Error velocity constant
ECE 499 Capstone Design Project Winter 2017
37
float previous_error = 0;
float error_history = 0;
float max_error = 100000;
void setup() {
// put your setup code here, to run once:
Serial.begin(57600); // Initialize serial port
pinMode(A0, INPUT); // Set analogPin A0 as the input pin - ultrasonic sensor
pinMode(11, OUTPUT); // Set Pin 11 as output port - inflate
pinMode(10, OUTPUT); // Set Pin 10 as output port - deflate
// Make sure the sensor is found, you can also pass in a different i2c
// address with tempsensor.begin(0x19) for example
if (!tempsensor.begin(0x18)) {
Serial.println("Couldn't find MCP9808!");
while (1);
}
}
float pid (float dist, float wanted_dist) {
float error = wanted_dist - dist;
float inst_error = Kp*error;
error_history = error_history + error;
if (error_history > max_error) error_history = max_error;
if (error_history < -max_error) error_history = -max_error;
ECE 499 Capstone Design Project Winter 2017
38
float integral_error = Ki*error_history;
float deriv_error = Kd*(error-previous_error);
previous_error = error;
Serial.print(dist); Serial.print(",");
Serial.print(inst_error); Serial.print(",");
Serial.print(integral_error); Serial.print(",");
Serial.print(deriv_error); Serial.println(",");
return inst_error + integral_error + deriv_error;
}
float readHeight(){
int total = 0;
for(int i = 0;i<10;i++){
total = total + analogRead(h_sensorPIN);
}
return total*5.0/10240.0;
}
char buff[32];
int bp = 0;
void loop() {
if(Serial.available()) {
buff[bp++] = Serial.read();
buff[bp] = 0;
if(buff[bp-1] == '\n') {
ECE 499 Capstone Design Project Winter 2017
39
bp = 0;
desired_dist = atof(buff);
Serial.print("Desired distance = "); Serial.println(desired_dist);
}
if(bp > 30) {
bp = 0;
}
}
// put your main code here, to run repeatedly:
//int Vdigital = analogRead(h_sensorPIN);
float Vmeas = readHeight();
float corr_dist = temp_correctionfactor(temp_sensor)*Vmeas;
float p = pid(corr_dist, desired_dist);
int p_limited = abs(p) > 400? 400:abs(p);
if (p < -min_solenoid) {
//Serial.print("Deflating bag ..."); Serial.println(p_limited);
digitalWrite(10, HIGH);
delay(0.5*p_limited);
digitalWrite(10, LOW);
}
if (p > min_solenoid) {
//Serial.print("Inflating bag ..."); Serial.println(p_limited);
digitalWrite(11, HIGH);
ECE 499 Capstone Design Project Winter 2017
40
delay(0.4*p_limited);
digitalWrite(11, LOW);
}
// Read and print out the temperature, then convert to *F
float c = tempsensor.readTempC();
float f = c * 9.0 / 5.0 + 32;
//Serial.print("Temp: "); Serial.print(c); Serial.print("*C\t");
//Serial.print(f); Serial.println("*F");
delay(250);
}
14.2. Appendix B – Thermal Testing Journal entries
October 20, 2016
Today I headed to GE Global Research Center to do thermal testing on my ultrasonic
sensors at one of their labs. Utilizing a thermal chamber (Cincinnati Sub-Zero), testing is
conducted by placing the ultrasonic sensor in a bracket, suspended by a small vice, and pointed
towards one of the chamber’s steel walls. Distance between the sensor and the wall was
measured using an HDX tape measurer and a Mitutoyo caliper.
Although the chamber itself can heat or cool within minutes, thermal mass must be
considered. This factor means it takes much longer for the sensor to get to its desired
temperature. The first temperature measurement (-20ºC), at ~50 mm, took more than 20
ECE 499 Capstone Design Project Winter 2017
41
minutes to get to temperature. At cold temperatures like -20ºC, the chamber temperature
drastically changed when the chamber door was opened to make an adjustment. To be as time
efficient possible, the chamber door was left closed and the sensor at the same distance while
cycling through different temperatures. For example, the sensor was left at 50 mm while the
temperature ranged from -20ºC to 30ºC, by increments of 10ºC.
An interesting observation was that during the transitionary stages of thermal change, the
output voltage of the sensor fluctuated; sometimes by only 5mV, sometimes by 30mV. The
changes could be for a number of reasons. One of them was that when the thermal chamber
was changing to a new desired temperature, that there was a thermal gradient within the
chamber which may cause the circuitry to experience various temperatures simultaneously. My
hypothesis is that there may be onboard circuitry within the sensor to compensate for
temperature differences. I will contact the manufacturer soon to try and get confirmation as to
whether this theory is true.
The trend with the sensor is that there is a significant voltage spike at lower temperatures
(see thermal testing data sheet).
At 50mm and 40ºC, there was a noticeable saturation in the sensors output. There was
little to no fluctuation in sensor’s output, which is likely because of the high temperature
environment. It is something to keep an eye on as testing continues, knowing where the
sensor’s distance limits are at various temperatures and compensating for them accordingly.
Only a distance of 50mm at various temperatures were taken today.
October 21, 2016
ECE 499 Capstone Design Project Winter 2017
42
Day 2 of testing.
Thermal testing is continued today. Started at 200mm and 40ºC. At first observation,
there seems to be a noticeable output difference between 40ºC and 30ºC at the same distance
(200mm). A modification was made to the test rig, I used a paper towel core to surround the
ultrasonic sensor to try and avoid radical temperature gradients which could be affecting the
circuitry of the sensor. As of now, the modification has done little to mitigate the output
fluctuation possibly due to thermal gradation.
After three more tests at the same distance and different temperatures, there is a
noticeable fluctuation in output voltage while in the transitionary stages of thermal change.
Staying at a steady ~6V when the temperature is stable, the output has been seen to spike
positive by up to 300mV.
Before coming into testing and after yesterday’s observations, clearly the ultrasonic
sensor is reactive to temperature differences. Because of this I started thinking about other
methods of distance measurement; for this application, lasers came into mind.
After altering the measuring distance to 125mm while retaining the thermal shield,
there seems to be less fluctuation in sensor output.
15. References
i Audi Allroad on Air - Behind the Scenes. Perf. RPI Equipped, Accuair. RPI Equipped, 10 Dec. 2012. Web. ii Marsh, Julian. "Citroen Hydraulic System." Citroen Hydropneumatic Suspension - Overview. Citroenet, 2011. Web.
18 Nov. 2016.
ECE 499 Capstone Design Project Winter 2017
43
iii Akshay Singh, Evan Hirsh, John Jullens, Reid Wilk. "2016 Auto Industry Trends." Strategy& - the Global Strategy
Consulting Team at PwC. N.p., n.d. Web. 26 Nov. 2016. iv Centers for Disease Control and Prevention. Centers for Disease Control and Prevention, 21 Jan. 2015. Web. 25
Nov. 2016. v Boden Autohaus, http://www.bodenautohaus.com/ vi BecauseBags, https://becausebags.myshopify.com/ vii Air Lift Performance 3H Height Upgrade Kit 27705, Installation Guide, Air Lift Company, pp. 14 viii "Universal Air Bags." Bag Riders Air Suspension. N.p., n.d. Web. 26 Nov. 2016. ix https://www.hornblasters.com/ x https://www.bagriders.com/air-zenith-ob2-compressor.html xi Semiconductor, On. 2N7000/2N7002/NDS7002A N-Channel Enhancement Mode Field Effect Transistor (n.d.): n. pag. Web. xii https://learn.adafruit.com/adafruit-mcp9808-precision-i2c-temperature-sensor-guide/pinouts?view=all