Ultrasonic backscatter coefficients for weakly … · consisted of agar spheres of various...
6
Ultrasonic backscatter coefficients for weakly scattering, agar spheres in agar phantoms Michael R. King Bioacoustics Research Laboratory, Department of Electrical and Computer Engineering, University of Illinois at Urbana–Champaign, 405 North Mathews, Urbana, Illinois 61801 Janelle J. Anderson and Maria-Teresa Herd Ultrasound Research Group, Department of Medical Physics, University of Wisconsin-Madison, 1111 Highland Avenue, Madison, Wisconsin 53705 Darryl Ma, Alexander Haak, and Lauren A. Wirtzfeld Bioacoustics Research Laboratory, Department of Electrical and Computer Engineering, University of Illinois at Urbana–Champaign, 405 North Mathews, Urbana, Illinois 61801 Ernest L. Madsen and James A. Zagzebski Ultrasound Research Group, Department of Medical Physics, University of Wisconsin-Madison, 1111 Highland Avenue, Madison, Wisconsin 53705 Michael L. Oelze Bioacoustics Research Laboratory, Department of Electrical and Computer Engineering, University of Illinois at Urbana–Champaign, 405 North Mathews, Urbana, Illinois 61801 Timothy J. Hall Ultrasound Research Group, Department of Medical Physics, University of Wisconsin-Madison, 1111 Highland Avenue, Madison, Wisconsin 53705 William D. O’Brien, Jr. a Bioacoustics Research Laboratory, Department of Electrical and Computer Engineering, University of Illinois at Urbana–Champaign, 405 North Mathews, Urbana, Illinois 61801 Received 9 November 2009; revised 9 June 2010; accepted 14 June 2010 Applicability of ultrasound phantoms to biological tissue has been limited because most phantoms have generally used strong scatterers. The objective was to develop very weakly scattering phantoms, whose acoustic scattering properties are likely closer to those of tissues and then compare theoretical simulations and experimental backscatter coefficient BSC results. The phantoms consisted of agar spheres of various diameters nominally between 90 and 212 m, containing ultrafiltered milk, suspended in an agar background. BSC estimates were performed at two institutions over the frequency range 1–13 MHz, and compared to three models. Excellent agreement was shown between the two laboratory results as well as with the three models. © 2010 Acoustical Society of America. DOI: 10.1121/1.3460109 PACS numbers: 43.80.Cs, 43.80.Qf, 43.80.Vj CCC Pages: 903–908 I. INTRODUCTION This work investigates ultrasonic scattering from ho- mogenous media containing very weak scatterers. Such weak ultrasonic scatterers are typical of biological materials Wear et al., 1995, but with biological materials, there is always sample-to-sample variation. This sample-to-sample variation does not allow for a fundamental comparison of measure- ments with theory. Physical phantoms are stable spatially and temporally and if well characterized allow for a fundamental comparison of measurements with theory. Such comparisons with weakly scattering physical phantoms that are well char- acterized thus are needed to assure the scientific and clinical communities that quantitative ultrasonic backscattered esti- mates have validity. Previous work has demonstrated that estimates of back- scatter coefficients BSCs from media containing a suspen- sion of glass spheres Madsen et al., 1984; Hall et al., 1989; Insana et al., 1990 show good agreement with the theoreti- cal scattering from spheres predicted by the theory of Faran 1951. These early studies establish a firm relationship be- tween backscatter measurement results and underlying physical properties of the medium. However, the glass or nylon bead scatterers used in early studies do not verify our ability to characterize submillimeter sized, weak ultrasonic scatterers, such as those that are believed to contribute to scattering from tissues. Various “biological” phantoms have been explored by researchers, including Sephadex spheres Campbell and Waag, 1984; Chen and Zagzebski, 1996 and a Author to whom correspondence should be addressed. Electronic mail: [email protected] J. Acoust. Soc. Am. 128 2, August 2010 © 2010 Acoustical Society of America 903 0001-4966/2010/1282/903/6/$25.00
Transcript of Ultrasonic backscatter coefficients for weakly … · consisted of agar spheres of various...
Ultrasonic backscatter coefficients for weakly scattering, agarspheres in agar phantoms
Michael R. KingBioacoustics Research Laboratory, Department of Electrical and Computer Engineering, University ofIllinois at Urbana–Champaign, 405 North Mathews, Urbana, Illinois 61801
Janelle J. Anderson and Maria-Teresa HerdUltrasound Research Group, Department of Medical Physics, University of Wisconsin-Madison,1111 Highland Avenue, Madison, Wisconsin 53705
Darryl Ma, Alexander Haak, and Lauren A. WirtzfeldBioacoustics Research Laboratory, Department of Electrical and Computer Engineering, University ofIllinois at Urbana–Champaign, 405 North Mathews, Urbana, Illinois 61801
Ernest L. Madsen and James A. ZagzebskiUltrasound Research Group, Department of Medical Physics, University of Wisconsin-Madison,1111 Highland Avenue, Madison, Wisconsin 53705
Michael L. OelzeBioacoustics Research Laboratory, Department of Electrical and Computer Engineering, University ofIllinois at Urbana–Champaign, 405 North Mathews, Urbana, Illinois 61801
Timothy J. HallUltrasound Research Group, Department of Medical Physics, University of Wisconsin-Madison,1111 Highland Avenue, Madison, Wisconsin 53705
William D. O’Brien, Jr.a�
Bioacoustics Research Laboratory, Department of Electrical and Computer Engineering, University ofIllinois at Urbana–Champaign, 405 North Mathews, Urbana, Illinois 61801
�Received 9 November 2009; revised 9 June 2010; accepted 14 June 2010�
Applicability of ultrasound phantoms to biological tissue has been limited because most phantomshave generally used strong scatterers. The objective was to develop very weakly scatteringphantoms, whose acoustic scattering properties are likely closer to those of tissues and then comparetheoretical simulations and experimental backscatter coefficient �BSC� results. The phantomsconsisted of agar spheres of various diameters �nominally between 90 and 212 �m�, containingultrafiltered milk, suspended in an agar background. BSC estimates were performed at twoinstitutions over the frequency range 1–13 MHz, and compared to three models. Excellentagreement was shown between the two laboratory results as well as with the three models.© 2010 Acoustical Society of America. �DOI: 10.1121/1.3460109�
PACS number�s�: 43.80.Cs, 43.80.Qf, 43.80.Vj �CCC� Pages: 903–908
I. INTRODUCTION
This work investigates ultrasonic scattering from ho-mogenous media containing very weak scatterers. Such weakultrasonic scatterers are typical of biological materials �Wearet al., 1995�, but with biological materials, there is alwayssample-to-sample variation. This sample-to-sample variationdoes not allow for a fundamental comparison of measure-ments with theory. Physical phantoms are stable spatially andtemporally and if well characterized allow for a fundamentalcomparison of measurements with theory. Such comparisonswith weakly scattering physical phantoms that are well char-
a�Author to whom correspondence should be addressed. Electronic mail:[email protected]
J. Acoust. Soc. Am. 128 �2�, August 2010 0001-4966/2010/128�
acterized thus are needed to assure the scientific and clinicalcommunities that quantitative ultrasonic backscattered esti-mates have validity.
Previous work has demonstrated that estimates of back-scatter coefficients �BSCs� from media containing a suspen-sion of glass spheres �Madsen et al., 1984; Hall et al., 1989;Insana et al., 1990� show good agreement with the theoreti-cal scattering from spheres predicted by the theory of Faran�1951�. These early studies establish a firm relationship be-tween backscatter measurement results and underlyingphysical properties of the medium. However, the glass ornylon bead scatterers used in early studies do not verify ourability to characterize submillimeter sized, weak ultrasonicscatterers, such as those that are believed to contribute toscattering from tissues. Various “biological” phantoms havebeen explored by researchers, including Sephadex spheres�Campbell and Waag, 1984; Chen and Zagzebski, 1996� and
© 2010 Acoustical Society of America 9032�/903/6/$25.00

TABLE I. Compositions of spheres and background material.
fish eggs �Lizzi and Elbaum, 1979�. A drawback of thesephantoms is the limited acoustic impedance distributions andsize ranges that are available.This work focuses on estimates of BSC from phantomscontaining weakly scattering spheres of known and con-trolled size distributions. The target spheres are manufac-tured from concentrated milk and agar, sieved, and then dis-tributed randomly in an agar background. The measuredBSCs were compared to a simple scattering model based onthe fluid sphere form factor �Insana et al., 1990� and to anexact solution to scattering from fluid spheres �Anderson,1950�. BSCs were measured for the same three weakly scat-tering phantoms at both the University of Illinois at Urbana-Champaign �UIUC� and the University of Wisconsin-Madison �UW�. Different methods were used at eachinstitution to demonstrate that the measurements are notequipment or technique dependent. The measurements fromeach laboratory were compared to each other and to themodel BSCs.
II. METHODS AND MATERIALS
A. Phantom description and construction
Spheres composed of anechoic material were producedfrom a mixture of agarose solution plus whole milk, the latterhaving been concentrated from whole bovine milk by ultra-filtration through a 10,000 Dalton system. The agarose solu-tion consisted of agarose �Cat. no 820723, MP Biomedicals,Solon, Ohio, USA�, deionized water and Liquid Germall®
Plus, a preservative �ISP Technologies, Inc., Wayne, NewJersey, USA�. The milk was concentrated by a factor of 3 inan ultrafiltration unit �Model UFP-10-C-55, A/G TechnologyCorporation, Needham, Massachusetts, USA�, and thenpassed through a nylon mesh filter with 12 �m�12 �mopenings. The agarose solution and concentrated milk weremixed when each was at 60 °C and Liquid Germall® Pluswas added at 50 °C. The net mixture was cooled to 50 °Cand sprayed from a needle-bearing hypodermic syringe withvigorous agitation into a column of vegetable oil where theupper part was at 50 °C and the lower part was at roomtemperature or lower; this procedure was a variation of amethod for mass-producing spheres described previously�Chin et al., 1990�. The spheres were subsequently trans-ferred from the oil into an aqueous solution containing 1.4%by weight Liquid Germall® Plus, and the spheres were sievedusing the same solution and WS Tyler sieves �Mentor, Ohio,USA�.
Each total tissue-mimicking material is a macroscopi-cally uniform �i.e., randomly distributed� suspension of a di-ameter fraction of the spheres described above in a back-ground material. The background material is composed ofdeionized water, agarose and Liquid Germall® Plus. Eachdiameter fraction is obtained by sieving with sieves with thedesired mesh. The compositions of the sphere material andsuspending material are given in Table I.
Test cylinders of the pure background and pure spheremedia were made to measure the density, sound speed, at-tenuation and backscatter from the component media. Theresults were then used to estimate the acoustic impedances of
904 J. Acoust. Soc. Am., Vol. 128, No. 2, August 2010
these media for estimating the magnitude of scattering basedon the model form factor function, as described below. In thecase of the exact scattering solution from fluid spheres�Anderson, 1950�, the densities and sound speeds of the me-dia were used to calculate the BSC.
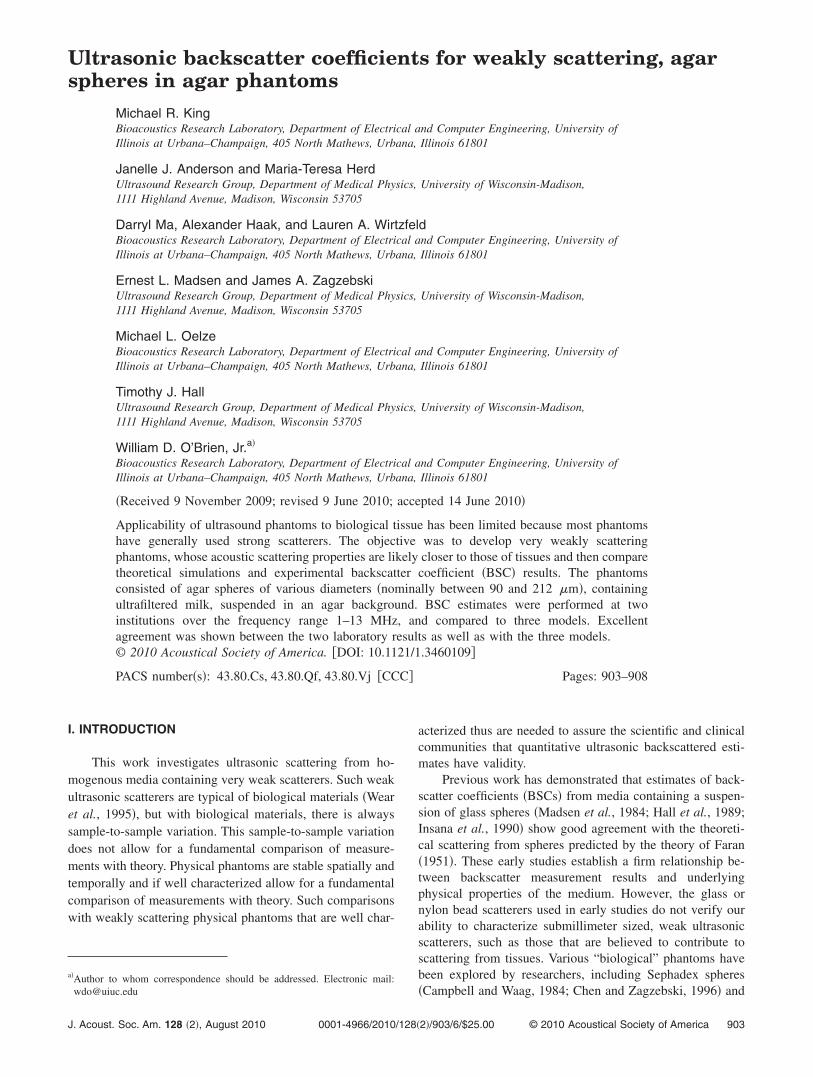
Three phantoms were constructed, each with a differentscatterer size distribution. The three diameter distributionswere nominally 90–125 �m, 125–150 �m and180–212 �m with estimated sphere volume fractions of0.0033, 0.0040 and 0.0080, respectively. When each phan-tom was made, syringes filled with each phantom’s materialswere also created. These were used to make measurements ofthe sphere diameter distribution within each phantom. AtUW, several 1 mm slices were taken from each syringe andexamined under a light microscope �Olympus BH-2�. About100 spheres were manually measured for each phantom us-ing a calibrated video caliper system �Cue Micro-100 VideoCaliper, Mercer Scientific International�. At UIUC, an auto-mated procedure was developed to measure the diameter ofseveral hundred agar spheres from each sample. Small slicesfrom the phantom materials in the syringes were removedusing a razor blade and images of the phantom spheres wereacquired under a fluorescent microscope �Zeiss Axiovert200M Microscope, Oberkochen, Germany�. These sampleimages were magnified and exposed to a bright field. Imageswere acquired with a camera �512�512 pixel array�, con-verted to a JPEG file, and transferred to a computer for pro-cessing with the circle detection program. A 2D mask �cir-cular� was convolved over the entire image space, peaking invalue wherever there was a circular structure surrounded bya black ring in the image. By setting a threshold based on themethod of Otsu �1979� on the convolved image and equatingall pixels within the convolved image with values above thethreshold to one and the remaining pixels to zero, the con-volved image essentially becomes a binary image that marksthe position of all the circular structures in the image file.The area of all of the circular structures in the thresholdimage was then tabulated, the diameter estimated based onthe size of each pixel, and a histogram of diameters con-structed. The entire procedure was calibrated against latexspheres of known diameter. The results of the measured sizedistributions are listed in Table II, and the combined normal-ized histograms are shown in Fig. 1.
B. UIUC phantom scanning and BSC estimation
The phantoms were ultrasonically scanned using sixsingle-element transducers �Table III�. The transducers weredriven using a Panametrics 5800 pulser/receiver �Panamet-
Phantom material
Weight percent of component material
Spheres Background
Deionized water 63.6 96.7Agarose �dry weight� 1.9 1.93� concentrated milk 33.1 0Liquid Germall® Plus 1.4 1.4
King et al.: Scattering from agar-agar phantoms
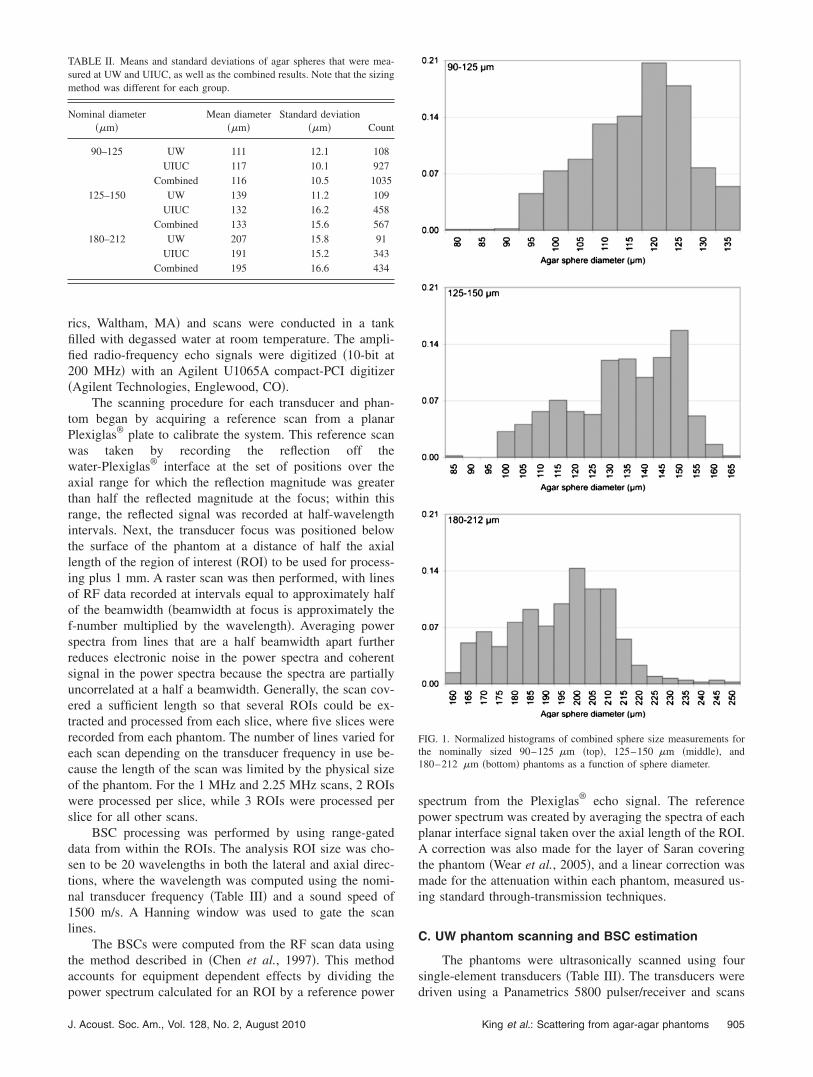
TABLE II. Means and standard deviations of agar spheres that were mea-
rics, Waltham, MA� and scans were conducted in a tankfilled with degassed water at room temperature. The ampli-fied radio-frequency echo signals were digitized �10-bit at200 MHz� with an Agilent U1065A compact-PCI digitizer�Agilent Technologies, Englewood, CO�.
The scanning procedure for each transducer and phan-tom began by acquiring a reference scan from a planarPlexiglas® plate to calibrate the system. This reference scanwas taken by recording the reflection off thewater-Plexiglas® interface at the set of positions over theaxial range for which the reflection magnitude was greaterthan half the reflected magnitude at the focus; within thisrange, the reflected signal was recorded at half-wavelengthintervals. Next, the transducer focus was positioned belowthe surface of the phantom at a distance of half the axiallength of the region of interest �ROI� to be used for process-ing plus 1 mm. A raster scan was then performed, with linesof RF data recorded at intervals equal to approximately halfof the beamwidth �beamwidth at focus is approximately thef-number multiplied by the wavelength�. Averaging powerspectra from lines that are a half beamwidth apart furtherreduces electronic noise in the power spectra and coherentsignal in the power spectra because the spectra are partiallyuncorrelated at a half a beamwidth. Generally, the scan cov-ered a sufficient length so that several ROIs could be ex-tracted and processed from each slice, where five slices wererecorded from each phantom. The number of lines varied foreach scan depending on the transducer frequency in use be-cause the length of the scan was limited by the physical sizeof the phantom. For the 1 MHz and 2.25 MHz scans, 2 ROIswere processed per slice, while 3 ROIs were processed perslice for all other scans.
BSC processing was performed by using range-gateddata from within the ROIs. The analysis ROI size was cho-sen to be 20 wavelengths in both the lateral and axial direc-tions, where the wavelength was computed using the nomi-nal transducer frequency �Table III� and a sound speed of1500 m/s. A Hanning window was used to gate the scanlines.
The BSCs were computed from the RF scan data usingthe method described in �Chen et al., 1997�. This methodaccounts for equipment dependent effects by dividing thepower spectrum calculated for an ROI by a reference power
sured at UW and UIUC, as well as the combined results. Note that the sizingmethod was different for each group.
Nominal diameter��m�
Mean diameter��m�
Standard deviation��m� Count
90–125 UW 111 12.1 108UIUC 117 10.1 927
Combined 116 10.5 1035125–150 UW 139 11.2 109
UIUC 132 16.2 458Combined 133 15.6 567
180–212 UW 207 15.8 91UIUC 191 15.2 343
Combined 195 16.6 434
J. Acoust. Soc. Am., Vol. 128, No. 2, August 2010
spectrum from the Plexiglas® echo signal. The referencepower spectrum was created by averaging the spectra of eachplanar interface signal taken over the axial length of the ROI.A correction was also made for the layer of Saran coveringthe phantom �Wear et al., 2005�, and a linear correction wasmade for the attenuation within each phantom, measured us-ing standard through-transmission techniques.
C. UW phantom scanning and BSC estimation
The phantoms were ultrasonically scanned using foursingle-element transducers �Table III�. The transducers weredriven using a Panametrics 5800 pulser/receiver and scans
FIG. 1. Normalized histograms of combined sphere size measurements forthe nominally sized 90–125 �m �top�, 125–150 �m �middle�, and180–212 �m �bottom� phantoms as a function of sphere diameter.
King et al.: Scattering from agar-agar phantoms 905

TABLE III. Transducer information for UIUC and UW BSC measurements.
were conducted in a tank filled with degassed water. Theamplified RF echo signals were digitized to 8-bit precision ina LeCroy �Chestnut Ridge, NY� LT342 digital oscilloscope.The scope’s “autoscale” feature was enabled, which opti-mized the A/D precision for the echo signal amplitudes.
The phantoms were placed at the focal distance for thetransducers and moved vertically and horizontally to ensurethat the phantoms’ interface was normal to the acousticbeam. For the 90–125 �m and 125–150 �m phantoms, a20 mm�20 mm area was scanned using a 1 mm step sizein both directions; for the 180–212 �m phantom, a40 mm�40 mm area was scanned using a 2 mm step sizein both directions. A gate length of 10 �s and a delay of7 �s relative to the phantom’s surface were used to acquirewaveforms from each of the phantoms. A reference echosignal from a quartz optical flat placed at the focus of thetransducer was also recorded after adding an additional 40dB of electronic attenuation at the input to the pulser-receiver so that the signal stayed within the dynamic range ofthe Panametrics 5800. A Hamming window was applied tothe data and BSCs were computed using the method de-scribed by Madsen et al. �1984� and Chen et al. �1998�. Acorrection was also made for the layer of Saran covering thephantom �Wear et al., 2005�, and a polynomial fit correctionwas made for the attenuation within each phantom, measuredusing standard through-transmission techniques.
D. Scattering models
Three models were used to study the scattering from theagar-in-agar phantoms, namely, the Anderson �1950� model,the Faran �1951� model and the form factor model for fluid-filled spheres is given by �Insana et al., 1990�
F�k,a� = �3
2
j1�2ka�ka
�2
, �1�
where k is the wave number, a is the radius of the scatterer,and j1 is the spherical Bessel function of the first kind. Thefluid filled sphere form factor is a simple scattering modelwhich is applied under the assumptions of plane wave inci-dence, no multiple scattering, and the validity of the Bornapproximation. Over the 1–13 MHz frequency range of in-terest, the results of this simple model were observed to
Institution
Nominal centerfrequency
�MHz�
Analysisbandwidth
�MHz� f-numberFocal length
�mm�
UIUC 1 0.9–1.3 3 57UIUC 2.25 1.5–3.2 2.67 51UIUC 3.5 1.2–5.0 3 57UIUC 5 3.5–6.4 3 57UIUC 7.5 4.1–10 4 76UIUC 10 6.5–14 4 51UW 3.5 2.4–4.9 4.8 95UW 5 3.0–8.0 2.9 54UW 7.5 4.5–9.0 5.0 94UW 10 4.9–13 2.7 51
906 J. Acoust. Soc. Am., Vol. 128, No. 2, August 2010
agree very well with results computed using the theory ofAnderson �1950� for sound scattering by a fluid sphere.
For a collection of randomly positioned spherical scat-terers with a known size distribution, the theoretical BSC �̄b
can be computed by combining Eqs. �4� and �11� of Insanaand Hall �1990�, so that
�̄b = Cf4�02 1
nT�
0
�
n�D�D6F�f,D�dD, �2�
where n�D� is the distribution of the number density of scat-terers versus size. C is equal to �1 /36��� /c�4, c is the speedof sound in the background medium, f is frequency, �0 is therelative scattering strength, F�f,D� is the form factor, and nT
is the total number of scatterers; that is,
nT = �0
�
n�D�dD. �3�
However, because there are a finite number of spheres andthe distribution of sphere sizes was determined �Fig. 1�, adiscrete distribution of spheres was used to estimate thebackscatter coefficient,
�̄b = Cf4�02 1
nT�i=1
�
ni2Di
6F�f,Di� , �4�
where ni is the number of scatterers with a diameter betweenDi and Di+�D.
The Faran �1951� model was developed to predict scat-tering from solids spheres and therefore includes the effectsof shear waves in the boundary conditions. To model the agarsphere, a Poisson ratio of 0.499 was assumed �thus includingshear waves�. The differential scattering cross section at 180°was computed for each sphere size using the Faran code andthen scaled by the number density corresponding to spheresizes. The first twenty-five terms of the Faran model werecalculated.
The Anderson model assumes fluid scatterers in a fluidbackground �thus not including shear waves� and was calcu-lated based on the equations provided in Anderson’s paper�1950�. The distribution of sphere sizes was accounted for inthe same manner as the other models. The first twenty-fiveterms of the Anderson model were calculated. It should benoted that the Faran model converges to the Anderson modelas the Poisson ratio approaches 0.5, making these modelsvery similar in this work.
III. RESULTS
The attenuation-compensated �Fig. 2� results of the BSCestimates from both UIUC and UW measurements are shownin Fig. 3 for each of the three phantoms. Also shown in Fig.3 are the three theoretical model BSCs, namely, Anderson,Faran and FF sphere. The model curves were generated fromthe combined UIUC and UW sphere size distribution mea-surements using Eq. �2�.
Number density values of 3.6 scatterers /mm3,2.3 scatterers /mm3, and 1.8 scatterers /mm3 were used tocompute the model curves for the 90–125 �m,125–150 �m, and 180–212 �m phantoms, respectively.
King et al.: Scattering from agar-agar phantoms
The scattering strength was computed from the density andspeed of sound of the sphere material and the backgroundmaterial as 4��z /z�2 �Insana and Hall, 1990�, where z is theacoustic impedance of the background material and �z is the
FIG. 2. �Color online� Attenuation coefficient results for the 90–125, 125–150, and 180–212 �m phantoms. The attenuation coefficients measure-ments were conducted at each laboratory using standard insertion loss tech-niques �Anderson et al., 2010� wherein at UIUC a broadband technique wasused and at UW a narrow band technique was used.
FIG. 3. �Color online� BSC results for the 90–125 �m �top�, 125–150 �m�middle�, and 180–212 �m �bottom� phantoms. The BSC theory curvesused the measured combined sphere diameter distributions with the threeBSC theories.
J. Acoust. Soc. Am., Vol. 128, No. 2, August 2010
difference in acoustic impedance between the sphere mate-rial and the background material. Acoustic impedance wascomputed as the product of the material’s density and soundspeed. The density of the sphere material was measured as1.03 g/mL and the density of the background material wasmeasured as 1.005 g/mL. Likewise, the speed of sound of thesphere material was measured as 1492 m/s and the speed ofsound of the background material was measured as 1491m/s. These density and speed values yield the acoustic im-pedance of the sphere material to be 1.537 Mrayl and theacoustic impedance of the background material to be 1.498Mrayl. Deviation in these sound speed values primarily af-fects the magnitude, not the frequency dependence, of theresults.
Figure 3 presents three different charts, one for eachsphere size distribution. The theoretical calculations for eachdistribution exhibit BSC maxima and minima over the fre-quency range tested. The number and positions of the BSCminima and maxima depend on the agar sphere sizes, withfewer inflection points over the 1–13 MHz range for smallerspheres. The curves using all three models are barely distin-guishable from one another, with the largest rms differenceof 8.5�10−7 �cm-Sr�−1 between the fluid-filled sphere andthe Anderson models for the 180–212 �m sphere diameters.
Experimental results agree qualitatively and show rea-sonable agreement quantitatively with the predicted BSC vsfrequency behavior independently calculated using measuredphysical properties of the phantoms. Each separate UIUCand UW curve �Fig. 3� is a result of applying a differentultrasonic transducer, each only applicable to a part of thefrequency over which measurements are made. For the90–125 �m sphere diameters, the rms difference betweenmeasured and theoretical backscatter results over the rangeof frequencies tested is 6.6�10−6 �cm-Sr�−1 for the UW re-sults and 15�10−6 �cm-Sr�−1 for the UIUC results. For the125–150 �m spheres these results are 1.9�10−6 �cm-Sr�−1 for the UW and 8.5�10−6 �cm-Sr�−1 forthe UIUC, while for the 180–212 �m spheres the meandeviations are 7.5�10−6 �cm-Sr�−1 for the UW and 8.8�10−6 �cm-Sr�−1 for the UIUC.
Agreement between the theoretical and experimentallycalculated backscatter coefficients decreased as the size ofthe scatterers increased. Specifically, the frequency depen-dent behavior was consistent between experiment and theory,i.e., the peaks and dips appeared to correlate well. Severalsources of error may have contributed to the differences be-tween theory and experiment. Inaccuracies in the sphere sizedistributions would affect the theoretical curves, and themethod of sampling the agar sphere in agar media may havemissed some representative sphere targets. Also, errors inestimating the number density of scatterers would affect theoverall magnitude of the theoretical curves.
IV. DISCUSSION
The BSC estimates from measurements made from thesame three very weakly scattering phantoms presented hereshow reasonable agreement between two laboratories. Addi-tionally, BSC estimates show reasonable agreement with the
King et al.: Scattering from agar-agar phantoms 907
Anderson, J. J., Herd, M.-T., King, M. R., Haak, A. Hafez, Z. T., Song, J.,
theoretical model BSCs, namely, Anderson, Faran and fluid-filled sphere, for small density and sound speed variations.Previous measurement comparisons were performed whenthe BSC was 2 to 3 orders of magnitude higher �better elec-tronic SNR� �Wear et al., 2005�, namely, 10−2 to10−3 �cm-Sr�−1 vs. 10−5 to 10−6 �cm-Sr�−1. Also, the previ-ous BSC estimates were typically over the 2–8 MHz fre-quency range whereas those reported herein are over the1–13 MHz frequency range.Given the nature of these acoustical measurements andthe slight although noteworthy uncertainties in specifying theproperties of the materials for insertion into the theoreticalcalculations, from the figures it can be observed that themeasurement results of the BSC from each laboratory �Fig.3� are in reasonable agreement with one another. In addition,the measurement results are in excellent agreement withtheory. Therefore, such novelty of the very weakly scatteringBSC estimates over an extended frequency range reportedherein suggest the ability to obtain good agreement in bio-logical media that might also be weakly scattering.
V. CONCLUSION
These results demonstrate the ability of two separatelaboratories to make BSC estimates from very weakly scat-tering phantoms, using different estimation techniques,which show reasonable agreement among each other andwith theoretical BSC curves. This provides a valuable foun-dation in the investigation of scattering from weakly scatter-ing biological media for the purpose of tissue characteriza-tion. Future studies should carefully examine the methods forcharacterizing phantoms for theoretical calculations of back-scatter coefficients. In addition, the use of weakly scatteringphantoms as reference materials for backscatter coefficientestimation could also be explored. The advantage of usingthe weakly scattering phantoms as reference phantoms is thatthe scattering is on the order of scattering expected from softtissues. Therefore, signal strength from tissues can be maxi-mized without concern for saturating signals from the refer-ence.
ACKNOWLEDGMENTS
This work is supported by NIH Grant CA111289, a BRPbetween the University of Illinois at Urbana-Champaign andUniversity of Wisconsin-Madison.
908 J. Acoust. Soc. Am., Vol. 128, No. 2, August 2010
Oelze, M. L., Madsen, E. L.., Zagzebski, J. A., O’Brien, W. D., Jr., andHall, T. J. �2010�. “Inter-laboratory comparison of backscatter coefficientestimates for tissue-mimicking phantoms,” Ultrason. Imaging, 32, 48–64.
Anderson, V. C. �1950�. “Sound scattering from a fluid sphere,” J. Acoust.Soc. Am. 22, 426–431.
Campbell, J. A., and Waag, R. C. �1984�. “Ultrasonic scattering propertiesof three random media with implication for tissue characterization,” J.Acoust. Soc. Am. 75, 1879–1886.
Chen, J., Zagzebski, J. A., Dong, F., and Madsen, E. L. �1998�. “Estimatingthe spatial autocorrelation function for ultrasound scatterers in isotropicmedia,” Med. Phys. 25, 648–655.
Chen, J. F., and Zagzebski, J. A. �1996�. “Frequency dependence of back-scatter coefficient versus scatterer volume fraction,” IEEE Trans. Ultrason.Ferroelectr. Freq. Control 43, 345–353.
Chen, X., Phillips, D., Schwarz, K. Q., Mottley, J. G., and Parker, K. J.�1997�. “The measurement of backscatter coefficient from a broadbandpulse-echo system: A new formulation,” IEEE Trans. Ultrason. Ferroelectr.Freq. Control 44, 515–525.
Chin, R. B., Madsen, E. L., Zagzebski, J. A., Hossein, J., Wu, X.-K., andFrank, G. R. �1990�. “A reusable perfusion supporting tissue-mimickingmaterial for ultrasound hyperthermia phantoms,” Med. Phys. 17, 380–390.
Faran, J. J. �1951�. “Sound scattering by solid cylinders and spheres,” J.Acoust. Soc. Am. 23, 405–418.
Hall, T. J., Madsen, E. L., Zagzebski, J. A., and Boote, E. J. �1989�. “Ac-curate depth-independent determination of acoustic backscatter coeffi-cients with focused transducers,” J. Acoust. Soc. Am. 85, 2410–2416.
Insana, M. F., Wagner, R. F., Brown, D. G., and Hall, T. J. �1990�. “Describ-ing small-scale structure in random media using pulse-echo ultrasound,” J.Acoust. Soc. Am. 87, 179–192.
Insana, M. R., and Hall, T. J. �1990�. “Parametric ultrasound imaging frombackscatter coefficient measurements: Image formation and interpreta-tion,” Ultrason. Imaging 12, 245–267.
Lizzi, F. L., and Elbaum, M. E. �1979�. “Clinical spectral analysis tech-niques for tissue characterization,” in Ultrasonic Tissue Characterization,Natl. Bur. Stand. �U.S.� Spec. Publ. No. 525, edited by M. Linzer �U.S.GPO, Washington, D.C.�, Vol. 2.
Madsen, E. L., Insana, M. F., and Zagzebski, J. A. �1984�. “Method of datareduction for accurate determination of acoustic backscatter coefficients,”J. Acoust. Soc. Am. 76, 913–923.
Otsu, N. �1979�. “A threshold selection method from gray-level histograms,”IEEE Trans. Syst. Man Cybern. 9, 62–66.
Wear, K. A., Garra, B. S., and Hall, T. J. �1995�. “Measurements of ultra-sonic backscatter coefficients in human liver and kidney in vivo,” J.Acoust. Soc. Am. 98, 1852–1857.
Wear, K. A., Stiles, T. A., Frank, G. R., Madsen, E. L., Cheng, F., Feleppa,E. J., Hall, C. S., Kim, B. S., Lee, P., O’Brien, W. D., Jr., Oelze, M. L.,Raju, B. I., Shung, K. K., Wilson, T. A., and Yuan, J. R. �2005�. “Inter-laboratory comparison of ultrasonic backscatter coefficient measurementsfrom 2 to 9 MHz,” J. Ultrasound Med. 24, 1235–1250.
King et al.: Scattering from agar-agar phantoms