UltraLightClient Load Test Experiment - Canoo - Delivering End
16
UltraLightClient Load Test Experiment
Transcript of UltraLightClient Load Test Experiment - Canoo - Delivering End

UltraLightClient
Load Test Experiment

Table of Contents
1 Summary ........................................................................................................................ 2 2 Test Environment ........................................................................................................... 2
2.1 Test Application ...................................................................................................... 2 2.2 System Configuration Details ................................................................................. 4
3 Test Scenario ................................................................................................................. 7 3.1 Scenario Description............................................................................................... 7 3.2 Test Script............................................................................................................... 8
4 Experiment Structure ...................................................................................................... 9 5 Results............................................................................................................................ 9
5.1 Introduction ............................................................................................................. 9 5.2 Response Time....................................................................................................... 9 5.3 Throughput ........................................................................................................... 11 5.4 Server-side Memory Consumption ....................................................................... 13
6 Conclusion .................................................................................................................... 14 7 Further Information ....................................................................................................... 15
1

1 Summary This report presents a scalability experiment for Canoo’s UltraLightClient Java library (ULC).
The experiment relies on a realistic server-based ULC application that offers a rich GUI to access an online shop. The application is called the ULC Online Shop. It is available as a free source code example that comes with the ULC release. Using the ULC Online Shop, you can browse through product categories and products, search for products, and add selected products to a shopping cart.
ULC Load is a load test tool that emulates simultaneous users in order to test the scalability and performance of server-based ULC applications. The experiment described in this report applies ULC Load under specified conditions in order to determine response time and throughput of a server hosting the Online Shop. Moreover, the experiment determines the average amount of Java heap memory for a server-side representation of a ULC user ses- sion (a user session captures the server side state of a user running the Online Shop).
In summary, the result of the experiment is as follows:
• a low-cost, two processor Intel server will run over 1300 concurrent users with re-
sponse times below 1 second.
• server-side memory consumption for 1300 user sessions is 520 MB, which corre- sponds to 400 KB per user.
These numbers and the setup of the experiment described here prove that using ULC will help substantially in avoiding performance issues. In essence, ULC will ensure for typical business applications that client/server interaction and the presentation layer will never be a performance bottleneck, thereby eliminating a “hot spot” that has resulted in the failure of thousands of projects.
2 Test Environment
2.1 Test Application
The ULC Online Shop demonstrates the advantages of using ULC to display large amounts of data. The user can browse through a hierarchy of more than 9'000 products, navigate through the product categories, search for products and add selected products to the shop- ping cart. Lazy loading, asynchronous communication, partial “screen” updates, client-side caching, message compression, server-side data sharing and other optimizations showcase the industrial strength scalability and performance of ULC based applications.
Table 1 describes the usage of the application and lists the corresponding ULC features.
Functionality Procedure ULC Widgets / FeaturesBrowse through the product category hierar- chy
Explore the product category hierarchy by col- lapsing and expanding the nodes in the left-hand tree browser using the node handles (plus and minus icons).
Tree with Lazy Loading
2

Browse through the list of prod- ucts
Select a product category or multiple categories to display all associated products in the product list pane in the upper part of the right pane. The 'browse' tab is presented if it is not yet visible. by default, all products in the selected categories and all their subcategories are displayed. To limit the products to the ones in the selected catego- ries, uncheck the 'Show Products in all Subcate- gories' checkbox.
Tree, Table / Table Model, Checkbox, TabbedPane
Display the product details
Select a product in the product list table. The product details are shown in the product details pane in the lower part of the right pane. Use the split pane divider to adjust the size of the productdetail pane.
HtmlPane, SplitPane
Sort the product table
In the 'browse' tab, click the column header of the product list table to sort the products listed according to the corresponding attribute. Click again to reverse the sort order.
Table Data Sorting
Reorder columns In the 'browse' tab, move a column to the desired position by Drag & Drop.
Table Column Reordering
Show products for the same category
Right-click a product in the product list table. In the popup menu, choose 'Show Products for the same Category'. This displays all products that are in the same category as the selected prod- uct. In addition, the corresponding category is selected in the category tree.
Popup Menu
Highlight catego- ries for displayed products
When displaying a list of products from different categories (e.g. after performing a search), right-click over the product list table choose 'Highlight Categories for displayed Products' from the popup menu. This synchronizes the categories tree with the product list table, and so, highlights all categories in the categories tree that contain one or multiple products currently displayed in the product table.
Popup Menu
Search for a product
Click the 'Search' tab. In the 'Search Criteria' text field, enter your search word. Choose whether tosearch in all categories or only in the categories selected by setting the radio buttons 'in all cate- gories' or 'in selected categories'. Select the product attributes searched by marking the check boxes 'in Reference No.', 'in Name' and 'inDescription'. To start the search, click the 'Search' button. The 'Search' button is only en- abled when 'Search Criteria' have been defined. The products matching the search criteria are listed in the 'Search Results' table.
Text Field, Enablers, Ra- dio Buttons, Check Boxes
3

Add product to the shopping cart
Select a product in the product list table. The product details are shown in the product details pane in the lower part of the right pane. Verify if the product details meet your needs. Then, click the 'Add Product to Shopping Cart' button right above the product details. The 'Add Product to Shopping Cart' button is only enabled if a prod- uct is selected in the product list table. The se- lected product is added to the shopping cart that is shown in the lower part of the left pane. The quantity is set to 1, by default. Alternatively, a product can also be added to the shopping cart using Drag & Drop. For this, select the product in the product list pane, click and drag the selection and drop it onto the shopping cart table.
Button, Drag & Drop, En- abler
Change product quantity
Click the 'Quantity' cell for the corresponding product in the shopping cart table and enter the quantity requested.
Cell Editor, Data Type
Remove a prod- uct from the shopping cart
Select one or multiple product(s) in the shopping cart table. Then, click the 'Remove selected Product(s) from Shopping Cart' button right above the shopping cart table. The 'Remove se- lected Product(s) from Shopping Cart' button is only enabled if a product is selected in the shop- ping cart table.
Button, Enabler
Place order Click the 'Place Order ...' button right above the shopping cart table. The 'Place Order ...' button is only enabled if the shopping cart is not empty. Verify that your order contains the requested products via the confirmation dialog. You may either abort the order process by clicking the 'Cancel' button or place the order by clicking the 'OK' button. This empties the shopping cart.
Dialog, Button, Enabler
Table 1: Features of the Online Shop
2.2 System Configuration Details
System Architecture
The test system consists of four client machines and one server machine. The client ma- chines are needed to create requests for emulated simultaneous users accessing (virtual) GUI instances of the Online Shop. ULC Load performs the corresponding emulation task. ULC Load does not emulate user behavior on the GUI level but instead, it replays the HTTP requests that a respective GUI user would trigger. This way, a typical client machine can handle up to 300 emulated users.
The server machine has 2 physical CPUs and hosts either one or 2 Tomcat application servers:
4

• We ran the experiment with a single Tomcat application server on the server ma- chine because it is a common deployment scenario for Web applications. In the fol- lowing we call this configuration “Single Application Server Configuration”. For this configuration the application server was assigned only one of the 2 CPUs, which were available at the server machine. Note that in essence this approach reduced by half the relevant server-side hardware capacity, which was available for experi- ment.
• The configuration with 2 Tomcat application servers on the server machine intends to
demonstrate that ULC does not interfere with clustering solutions for application servers. In the following we call this configuration “Clustered Application Server Con- figuration”. For this configuration each of the 2 application servers was assigned its own CPU at the server machine.
Tomcat manages ULC user sessions of the Online Shop via Java Servlet sessions. This setup is typical and also recommended for deploying and hosting ULC applications.
The clients and the server communicate via HTTP requests, whereby an HTTP request contains one or more ULC messages. ULC has its own message protocol to synchronize GUI activities with server-side ULC user sessions. HTTP acts as the carrier protocol for ULC messages. (Note that other carrier protocols are also available for ULC.) Figure 1 illus- trates the described system architecture.
When using the Clustered Application Server Configuration, every Tomcat application server runs in a separate Java Virtual Machine (VM). As mentioned above, a corresponding VM is assigned a specific CPU on the server machine. (The server machine has got 2 CPUs.) An Apache HTTP server also runs on the server machine. It acts as an HTTP re- quest proxy for clients and forwards HTTP requests to one of the 2 application servers. A respective Tomcat server is chosen randomly per ULC user session and at the beginning of that session. Thus, in essence, the Apache HTTP server performs session-based load bal- ancing regarding ULC user sessions.
The goal of the experiment is to measure server-side system scalability and performance when using ULC. Therefore, we ensured that neither client-side system resources nor net- work bandwidth represent a potential system bottleneck for the experiment. This was done by observing and if necessary adjusting related system resources.
During the experiments, it turned out that with respect to the Clustered Application Server Configuration, ULC scales so well that the 4 client PCs did not create enough load to satu- rate the server. The reason for this is that the given client PCs tend to become the system bottleneck when they emulate more than 300 concurrent users. Therefore, we only obtained results for load ranges of 100 to 1300 users (because in this range the server is guaranteed to be the only potential system bottleneck).
5

HTTP Requests containing ULC Messages
Local Network
Client PCs hosting ULC Load to emulate
Online Shop users
HTTP responses containing ULC messages
Server machine host- ing Tomcat appl. server(s) with the ULC Online Shop
Figure 1: System Architecture Server Hardware and Operation System
Product Dell PowerEdge 1750 CPUs 2 x Intel® Xeon™ CPU 2.40GHz RAM 4 GB OS Linux Fedora Core release 3 Java Runtime Environment JDK 1.4.2_07-b05
6

Single Application Server Configuration
Application Server Apache Tomcat, version 5.0.28 Deployment No clustering; 1 Tomcat instance / 1 Java Virtual Machine
(VM); the VM was started with the “-server” option Memory Maximum VM heap memory size: 1024 Mbyte
Clustered Application Server Configuration
Load Balancer Apache HTTP server acts as an HTTP proxy server and a
session based load balancer Application Server Apache Tomcat, version 5.0.28 Deployment 2 Tomcat instances with separate Java Virtual Machines
(VMs); every VM is assigned 1 specific server CPU; the VMs were started with the “-server” option
Memory Maximum VM heap memory size: 1024 Mbyte Implementation of the Online Shop
The server-side implementation of the Online Shop uses an in-memory database to man- age category and product data.
After deployment of the application on the server, the in-memory database reads data only once from an XML file. User sessions share the in-memory data and access it in order to process requests from remote GUI clients. This type of data sharing among different user sessions reduces the average memory size of a user session. It enables an economical us- age of server-side heap memory, which results in increased performance and scalability. ULC facilitates such optimizations because it allows for a convenient separation of pure GUI-related server objects and business data objects.
In real-world ULC deployments, business data typically resides in a (relational) database management system. For the purpose of this experiment, we have chosen an in-memory database because we wanted to evaluate the scalability and performance of ULC and not a database management system. We knew from real-world deployments that ULC was never the bottleneck when performance problems occurred: it was always the back-end services and often the database management system. By using the in-memory database we made the back-end so light-weight that the load test (primarily) relates to ULC and not to other system components.
3 Test Scenario
3.1 Scenario Description
The scenario is given by a sequence of user actions such as mouse clicks, mouse drags and keyboard actions relating to the Online Shop GUI. Using ULC Load the scenario was recorded for the load test experiment.
User activities captured by the scenario are typical for a consumer-based E-commerce sys- tem. Moreover, they cover the essential functionality of the Online Shop application.
7

The scenario emulates users who are highly active. On average, every user triggers an ac- tion about every ten seconds, which is a challenging usage profile. The performance figures are, therefore, rather conservative.
Note that the startup of a user session is a relatively costly operation because the server must perform some GUI-related initialization tasks and send a special HTTP message to the GUI client. (The HTTP message contains all the necessary information to initialize the GUI)
Since the scenario takes only five minutes to complete, we repeat it three times after the startup operation. This way, a user session lasts fifteen minutes. After the scenario ends for an emulated user, a new one is immediately started for the same user.
Fifteen minutes is still a short time for a client application to live. Real-world applications typically run much longer, which results in fewer costly startup operations. Therefore, the experiment tests the scalability of ULC under very hard load conditions.
3.2 Test Script
Table 2 states the recording actions of the test script along with event times. All actions de- scribed in Table 2 can be tracked using the demo of the Online Shop.
Table 2 references nodes of the category tree displayed in the GUI with numbers starting from zero. E.g., the expression “[3]” in Step 2 of Table 2 means that the user expands the node named “Digital Printing Solutions” in the GUI’s category tree.
Step Time Action 1 00:00 Start application 2 00:20 Expand node [3] 3 00:30 Expand node [3:2] 4 00:40 Select node [3:2] 5 00:50 Deselect "Show Products in all Subcategories" checkbox 6 01:00 Select "Show Products in all Subcategories" checkbox 7 01:10 Click on table header "Name" (sort by name) 8 01:25 Click on table header "Name" (reverse sort by name) 9 01:35 Scroll down 3 pages in table (3 clicks into scrollbar) 10 01:45 Select row 0 (in visible range) 11 01:55 Scroll to bottom in "Product Details" 12 02:05 Select row 1 (in visible range) 13 02:15 Scroll to top in "Product Details" 14 02:25 Select row 0 (in visible range) 15 02:35 Click on "Add Product to Shopping Cart" button 16 03:00 Collapse node [3] 17 03:10 Select "Search" Tab 18 03:20 Type "projector" in "Search Criteria" text field 19 03:30 Deselect "in 'Reference No' " 20 03:35 Deselect "in 'Description' " 21 03:40 Click "Search" 22 04:00 Scroll to bottom in table 24 04:10 Select row 4 (in visible range) 25 04:20 Click on "Add Product to Shopping Cart" button
8

26 04:35 Click on "Place order ..." button in the "Shopping Cart" panel 27 04:55 Click OK 28 05:00 Close application
Table 2: Test Script Specification
4 Experiment Structure
The experiment consists of a collection of separate load tests. Each load test emulates a fixed number of simultaneous users who perform the actions of the test script described in Section 3.2. A load test lasts for 30 minutes and produces results for a data point of the ex- periment. For the collection of load tests the number of emulated users is u = 100, 200, 300, … .
Every load test consists of a ramp up phase lasting 15 minutes and a main phase also last- ing 15 minutes. During the ramp up phase all of the emulated users start user sessions ac- cording to the test script described in Section 3.2. The start time of a specific user is chosen randomly within the first 15 minutes, using a uniform distribution. At the end of the ramp up interval, all of the u emulated users are guaranteed to be executing the test script at some (random) step.
Whenever an emulated user reaches the end of the test script, it restarts the execution of the test script. This happens regardless of whether the load test is in its ramp up phase or in its main phase. After 30 minutes, all data concerning client-side requests is collected and prepared for presentation. This process leads to the results discussed in the next section.
5 Results
5.1 Introduction
This section presents important results of the experiment by means of line charts. The line charts are X/Y-diagrams. The X-axis presents the range of users u for which 30 minutes load tests have been executed. The Y-axis shows test results for a given number of emu- lated users u.
The charts capture information on average response times for requests, request throughput, and server-side memory consumption. The Y-values for response times and request throughput are average values relating to all requests performed during a specific 30 min- utes load test. The Y-values on server-side memory consumption will be discussed in Sec- tion 5.4.
For response times and request throughput, we present results relating to both the Single Application Server Configuration and the Clustered Application Server Configuration.
5.2 Response Time
Figure 2 presents the average response time per HTTP request for a given number of emu- lated users. The time is measured from when an emulated GUI client sends the request un- til it receives the complete response from the server.
To interpret a respective data point, consider the following example: At a load of 1000 si- multaneous users (1000 clients on the X-axis of Figure 2), the respective response time is on average about 3 seconds for the Single Application Server Configuration. This means
9

that if a corresponding (emulated) user performs a GUI operation that requires server ac- cess, the user will have to wait for about 3 seconds until (the operation is completed and) the GUI visually reacts to it. Under the same load but using the Clustered Application Server Configuration, a user will only have to wait about 0.5 seconds.
In practice, both results typically provide a comfortable user experience. Even a response time of 5 seconds (which corresponds to about 1100 concurrent users under the Single Ap- plication Server Configuration in Figure 2) may still feel comfortable, because not every GUI operation triggers an HTTP request: ULC actively caches data on the client side. Moreover, ULC is capable of bundling ULC messages relating to one ore more GUI operations in a single HTTP request. This improves user experience, frees up server resources and lowers the average response time for ULC messages.
With respect to the experiment, an HTTP request contains on average about 7.5 ULC mes- sages. This number counts the ULC messages contained in both the send and the receive part of an HTTP request. In this context, Figure 3 illustrates the average response times for a ULC message.
Note that for the Single Application Server case, the response times increase moderately beyond 800 users and grow almost linearly with the load of emulated users.
Figure 2: Response Time for HTTP Requests (An HTTP request includes the send and the receive operation.)
10

Figure 3: Response Time for ULC Messages (A ULC message might be contained in the send or the receive part of corresponding
HTTP request.) 5.3 Throughput
Figure 4 depicts the throughput of HTTP requests for a given number of emulated users. As shown, throughput initially increases linearly with the number of users. In the Single Appli- cation Server Configuration, the server CPU becomes completely busy at a load of about 800 simultaneous users (this was verified with system management tools). Beyond that, there is delay in serving incoming requests, because requests are queued up. Note that 800 users are also the point where the response times in Figure 2 begin to increase for the Sin- gle Application Server Configuration.
In the Single Application Server Configuration the test system scales well, even when the load is beyond 800 emulated users. Throughput flattens and reaches its maximum at about 3900 HTTP requests per minute. Server functionality remains fully intact under overload and requests can still be served. This is strong evidence for good system stability.
In the Clustered Application Server Configuration the system scales linearly within the pre- sented range of the concurrent users. As mentioned in Section 2.2 ULC scales so well that 4 PC client machines were not able to saturate the server with 1300 concurrent users. Therefore, Figure 3 does not depict the related saturation point where the graph flattens.
Analogous to Figure 3 on response times, Figure 5 presents the throughput of ULC mes- sages instead of HTTP requests. As mentioned before, there are on average about 7.5 ULC messages per HTTP request.
11
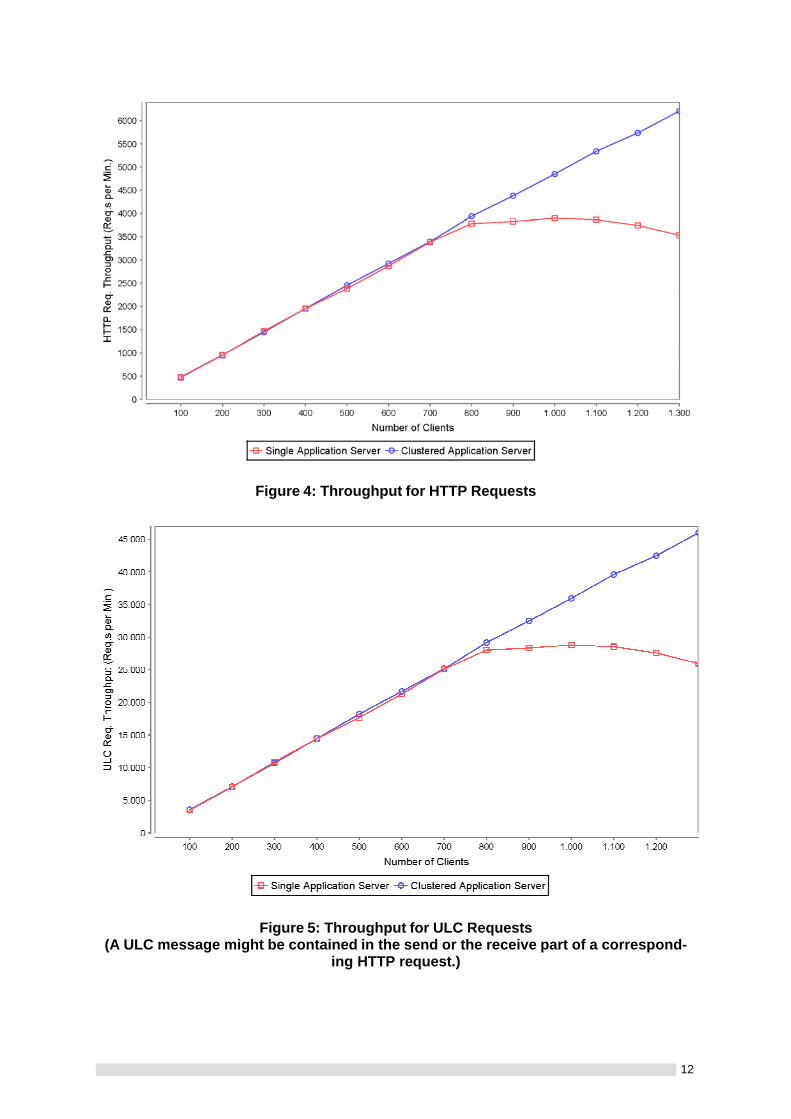
Figure 4: Throughput for HTTP Requests
Figure 5: Throughput for ULC Requests (A ULC message might be contained in the send or the receive part of a correspond-
ing HTTP request.)
12

5.4 Server-side Memory Consumption Server-side memory consumption was measured in the Single Application Server Configu- ration. The Java Virtual Machine’s heap memory used was measured after the ramp up phase of a load test. This ensured that all of the u clients of a load test were indeed active.
Moreover, we ensured that a full garbage collection was performed on the server side right before measuring memory. The reason for this is that Java applications typically allocate heap memory continuously and release it soon afterwards, but the released memory is still considered as “used” until the Java Virtual Machine performs the next full garbage collec- tion. Therefore, measuring memory consumption without a prior full garbage collection would lead to inaccurate results.
Figure 6 shows the results. The graph grows about linearly with the number of users. This means that every ULC user session uses on average the same amount of heap memory (even across different data points for load tests).
We applied linear regression analysis to the results in Figure 6. Linear regression analysis computes a linear function that matches “best” for a given set of data points. With respect to Figure 6, the regression analysis computes the average amount of heap memory used for a ULC user session across all data points presented.
The regression analysis shows that a ULC user session requires on average 404 Kbytes (0.4 Mbytes) unreleased heap memory.1 The application server Tomcat requires about 121 Mbytes of heap memory when no user sessions are running.
Considering the complexity of the ULC Online Shop and the amount of data that a user works with under the test scenario, the 404 Kbytes are an excellent value. Note that with 800 concurrent user sessions, the Online Shop requires only about 450 Mbytes of heap memory. This is not even close to the maximum of 1024 Mbytes of heap memory that the Java Virtual Machine was configured to work with. Therefore, it is unlikely that ULC causes a shortage of server-side heap memory in real-world deployments.
1 Note that 404 Kbytes of memory are also released at termination of a ULC user session, which means that ULC does not cause memory leaks on the server.
13

Figure 6: Used Heap Memory at the Server Side (Measured after the ramp up phase of a single load test and after a full garbage col-
lection.) 6 Conclusion
This report has presented a scalability experiment for Canoo’s UltraLightClient Java library (ULC). It uses a realistic Internet application, the ULC Online Shop, to demonstrate that the ULC library enables the deployment of highly scalable, mission-critical applications.
The experiment uses a single server machine with a typical 2-processor hardware configu- ration. To perform the experiment we used 2 software configurations:
• A “Single Application Server Configuration” where one application server instance
ran on only one of the machine’s CPUs. In essence, this approach reduced the rele- vant hardware capacity available at the server by half.
• A “Clustered Application Server Configuration” where two application server in-
stances ran on the two CPUs of the machine, each server running on one of the CPUs.
Emulated users perform a set of operations in a fairly fast-paced sequence. The test script covers the complete functionality of the Online Shop, including browsing of categories and product data, accessing detail information, searching for products, putting products in a vir- tual shopping cart, and buying products.
Given these conditions, the results show that under the Single Application Server Configu- ration, the server can easily handle a load of 800 highly active, simultaneous users. At this load, the server responds to ULC-related HTTP requests on average in about half a second. This is a very low response time, which provides a highly comfortable user experience for real-world users.
14

In the Single Application Server Configuration, the system scales well even if the load is be- yond 800 emulated users. As the results of Section 5.5 document, system throughput re- mains stable and the server functionality remains fully intact. Moreover, the increase of re- sponse times remains moderate and grows linearly with the user load. E.g., at a load of 1100 simultaneous users, the average response time is less than 5 seconds, which still al- lows a real-world user to work with the application. One reason for this is that only a fraction of the GUI operations actually causes server requests since ULC actively caches data on the client.
In the Clustered Application Server Configuration, system throughput increases linearly up to a load of 1300 concurrent users. With the given set of client machines we could not pro- duce loads beyond 1300 users. Therefore, we could not saturate the server for this configu- ration. The cause for this is that ULC scales so well that it requires a lot of client-side com- puting power to really stress a server.
The results of the Clustered Application Server Configuration offer strong evidence that there are no dependencies between a clustering approach and the functioning of ULC. This means that ULC has no (negative) impact on a clustering architecture. A two-node cluster will result in two-fold throughput, a three-fold cluster in three-fold throughput, and so on. Moreover, response time will remain the same as for single-server deployment.
For all tests of the experiment, a ULC user session required a modest and stable amount of Java heap memory on the server. By measuring this resource in an appropriate way, we showed that on average, a user session allocates only 404 Kbytes for the Online Shop sce- nario. The memory allocated is released when the session terminates and does not lead to memory leaks on the server. Given these modest memory requirements, it is highly unlikely that ULC will cause a shortage of server-side heap memory in real-world applications.
7 Further Information For more information on ULC see http://www.canoo.com/.
Canoo Engineering AG Kirschgartenstr. 7 4051 Basel Switzerland Tel +41 61 228 94 44 Fax +41 61 228 94 49 http://www.canoo.com/ [email protected] Copyright © 2000 - 2010 Canoo Engineering AG
15