Ultra-sensitive mid-infrared emission spectrometer with ...
10
Ultra-sensitive mid-infrared emission spectrometer with sub-ns temporal resolution LI CHEN, 1,3 DIRK SCHWARZER, 1 JASCHA A. LAU, 1 VARUN B. VERMA, 2 MARTIN J. STEVENS, 2 FRANCESCO MARSILI, 2 RICHARD P. MIRIN, 2 SAE WOO NAM, 2 AND ALEC M. WODTKE 1,4 1 Department of Dynamics at Surfaces, Max Planck Institute for Biophysical Chemistry Göttingen, Germany 2 National Institute of Standards and Technology, Boulder, Colorado, USA 3 [email protected] 4 [email protected] Abstract: We evaluate the performance of a mid-infrared emission spectrometer operating at wavelengths between 1.5 and 6 μm based on an amorphous tungsten silicide (a-WSi) superconducting nanowire single-photon detector (SNSPD). We performed laser induced fluorescence spectroscopy of surface adsorbates with sub-monolayer sensitivity and sub- nanosecond temporal resolution. We discuss possible future improvements of the SNSPD- based infrared emission spectrometer and its potential applications in molecular science. © 2018 Optical Society of America under the terms of the OSA Open Access Publishing Agreement OCIS codes: (040.3060) Infrared; (120.6200) Spectrometers and spectroscopic instrumentation; (300.2530) Fluorescence, laser-induced; (300.6340) Spectroscopy, infrared; (300.6500) Spectroscopy, time-resolved. References and links 1. O. Gravrand, J. Rothman, P. Castelein, C. Cervera, N. Baier, C. Lobre, E. De Borniol, J. P. Zanatta, O. Boulade, V. Moreau, B. Fieque, and P. Chorier, “Latest achievements on MCT IR detectors for space and science imaging,” in Infrared Technology and Applications Xlii, B. F. Andresen, G. F. Fulop, C. M. Hanson, and P. R. Norton, eds. (2016). 2. J. S. Dam, P. Tidemand-Lichtenberg, and C. Pedersen, “Room-temperature mid-infrared single-photon spectral imaging,” Nat. Photonics 6(11), 788–793 (2012). 3. M. D. Eisaman, J. Fan, A. Migdall, and S. V. Polyakov, “Invited Review Article: Single-photon sources and detectors,” Rev. Sci. Instrum. 82(7), 071101 (2011). 4. G. N. Gol’tsman, O. Okunev, G. Chulkova, A. Lipatov, A. Semenov, K. Smirnov, B. Voronov, A. Dzardanov, C. Williams, and R. Sobolewski, “Picosecond superconducting single-photon optical detector,” Appl. Phys. Lett. 79(6), 705–707 (2001). 5. C. M. Natarajan, M. G. Tanner, and R. H. Hadfield, “Superconducting nanowire single-photon detectors: physics and applications,” Supercond Sci Tech 25 (2012). 6. F. Marsili, V. B. Verma, J. A. Stern, S. Harrington, A. E. Lita, T. Gerrits, B. Vayshenker, B. Baek, M. D. Shaw, R. P. Mirin, and S. W. Nam, “Detecting single infrared photons with 93% system efficiency,” Nat. Photonics 7(3), 210–214 (2013). 7. W. J. Zhang, L. X. You, H. Li, J. Huang, C. L. Lv, L. Zhang, X. Y. Liu, J. J. Wu, Z. Wang, and X. M. Xie, “NbN superconducting nanowire single photon detector with efficiency over 90% at 1550 nm wavelength operational at compact cryocooler temperature,” Sci China Phys Mech 60 (2017). 8. K. Smirnov, A. Divochiy, Y. Vakhtomin, P. Morozov, P. Zolotov, A. Antipov, and V. Seleznev, “NbN single- photon detectors with saturated dependence of quantum efficiency,” Supercond Sci Tech 31 (2018). 9. I. E. Zadeh, J. W. N. Los, R. B. M. Gourgues, V. Steinmetz, G. Bulgarini, S. M. Dobrovolskiy, V. Zwiller, and S. N. Dorenbos, “Single-photon detectors combining high efficiency, high detection rates, and ultra-high timing resolution,” Apl Photonics 2 (2017). 10. V. Shcheslavskiy, P. Morozov, A. Divochiy, Y. Vakhtomin, K. Smirnov, and W. Becker, “Ultrafast time measurements by time-correlated single photon counting coupled with superconducting single photon detector,” Rev. Sci. Instrum. 87, 053117 (2016). 11. J. Wu, L. You, S. Chen, H. Li, Y. He, C. Lv, Z. Wang, and X. Xie, “Improving the timing jitter of a superconducting nanowire single-photon detection system,” Appl. Opt. 56(8), 2195–2200 (2017). 12. B. S. Robinson, A. J. Kerman, E. A. Dauler, R. J. Barron, D. O. Caplan, M. L. Stevens, J. J. Carney, S. A. Hamilton, J. K. W. Yang, and K. K. Berggren, “781 Mbit/s photon-counting optical communications using a superconducting nanowire detector,” Opt. Lett. 31(4), 444–446 (2006). Vol. 26, No. 12 | 11 Jun 2018 | OPTICS EXPRESS 14859 #321017 https://doi.org/10.1364/OE.26.014859 Journal © 2018 Received 30 Jan 2018; revised 25 Apr 2018; accepted 28 Apr 2018; published 29 May 2018
Transcript of Ultra-sensitive mid-infrared emission spectrometer with ...

Ultra-sensitive mid-infrared emission spectrometer with sub-ns temporal resolution
LI CHEN,1,3 DIRK SCHWARZER,1 JASCHA A. LAU,1 VARUN B. VERMA,2
MARTIN J. STEVENS,2 FRANCESCO MARSILI,2 RICHARD P. MIRIN,2 SAE WOO NAM,2 AND ALEC M. WODTKE
1,4 1Department of Dynamics at Surfaces, Max Planck Institute for Biophysical Chemistry Göttingen, Germany 2National Institute of Standards and Technology, Boulder, Colorado, USA [email protected] [email protected]
Abstract: We evaluate the performance of a mid-infrared emission spectrometer operating at wavelengths between 1.5 and 6 μm based on an amorphous tungsten silicide (a-WSi) superconducting nanowire single-photon detector (SNSPD). We performed laser induced fluorescence spectroscopy of surface adsorbates with sub-monolayer sensitivity and sub-nanosecond temporal resolution. We discuss possible future improvements of the SNSPD-based infrared emission spectrometer and its potential applications in molecular science. © 2018 Optical Society of America under the terms of the OSA Open Access Publishing Agreement
OCIS codes: (040.3060) Infrared; (120.6200) Spectrometers and spectroscopic instrumentation; (300.2530) Fluorescence, laser-induced; (300.6340) Spectroscopy, infrared; (300.6500) Spectroscopy, time-resolved.
References and links
1. O. Gravrand, J. Rothman, P. Castelein, C. Cervera, N. Baier, C. Lobre, E. De Borniol, J. P. Zanatta, O. Boulade, V. Moreau, B. Fieque, and P. Chorier, “Latest achievements on MCT IR detectors for space and science imaging,” in Infrared Technology and Applications Xlii, B. F. Andresen, G. F. Fulop, C. M. Hanson, and P. R. Norton, eds. (2016).
2. J. S. Dam, P. Tidemand-Lichtenberg, and C. Pedersen, “Room-temperature mid-infrared single-photon spectral imaging,” Nat. Photonics 6(11), 788–793 (2012).
3. M. D. Eisaman, J. Fan, A. Migdall, and S. V. Polyakov, “Invited Review Article: Single-photon sources and detectors,” Rev. Sci. Instrum. 82(7), 071101 (2011).
4. G. N. Gol’tsman, O. Okunev, G. Chulkova, A. Lipatov, A. Semenov, K. Smirnov, B. Voronov, A. Dzardanov, C. Williams, and R. Sobolewski, “Picosecond superconducting single-photon optical detector,” Appl. Phys. Lett. 79(6), 705–707 (2001).
5. C. M. Natarajan, M. G. Tanner, and R. H. Hadfield, “Superconducting nanowire single-photon detectors: physics and applications,” Supercond Sci Tech 25 (2012).
6. F. Marsili, V. B. Verma, J. A. Stern, S. Harrington, A. E. Lita, T. Gerrits, B. Vayshenker, B. Baek, M. D. Shaw, R. P. Mirin, and S. W. Nam, “Detecting single infrared photons with 93% system efficiency,” Nat. Photonics 7(3), 210–214 (2013).
7. W. J. Zhang, L. X. You, H. Li, J. Huang, C. L. Lv, L. Zhang, X. Y. Liu, J. J. Wu, Z. Wang, and X. M. Xie, “NbN superconducting nanowire single photon detector with efficiency over 90% at 1550 nm wavelength operational at compact cryocooler temperature,” Sci China Phys Mech 60 (2017).
8. K. Smirnov, A. Divochiy, Y. Vakhtomin, P. Morozov, P. Zolotov, A. Antipov, and V. Seleznev, “NbN single-photon detectors with saturated dependence of quantum efficiency,” Supercond Sci Tech 31 (2018).
9. I. E. Zadeh, J. W. N. Los, R. B. M. Gourgues, V. Steinmetz, G. Bulgarini, S. M. Dobrovolskiy, V. Zwiller, and S. N. Dorenbos, “Single-photon detectors combining high efficiency, high detection rates, and ultra-high timing resolution,” Apl Photonics 2 (2017).
10. V. Shcheslavskiy, P. Morozov, A. Divochiy, Y. Vakhtomin, K. Smirnov, and W. Becker, “Ultrafast time measurements by time-correlated single photon counting coupled with superconducting single photon detector,” Rev. Sci. Instrum. 87, 053117 (2016).
11. J. Wu, L. You, S. Chen, H. Li, Y. He, C. Lv, Z. Wang, and X. Xie, “Improving the timing jitter of a superconducting nanowire single-photon detection system,” Appl. Opt. 56(8), 2195–2200 (2017).
12. B. S. Robinson, A. J. Kerman, E. A. Dauler, R. J. Barron, D. O. Caplan, M. L. Stevens, J. J. Carney, S. A. Hamilton, J. K. W. Yang, and K. K. Berggren, “781 Mbit/s photon-counting optical communications using a superconducting nanowire detector,” Opt. Lett. 31(4), 444–446 (2006).
Vol. 26, No. 12 | 11 Jun 2018 | OPTICS EXPRESS 14859
#321017 https://doi.org/10.1364/OE.26.014859 Journal © 2018 Received 30 Jan 2018; revised 25 Apr 2018; accepted 28 Apr 2018; published 29 May 2018
13. A. J. Kerman, E. A. Dauler, W. E. Keicher, J. K. W. Yang, K. K. Berggren, G. Gol’tsman, and B. Voronov, “Kinetic-inductance-limited reset time of superconducting nanowire photon counters,” Appl. Phys. Lett. 88(11), 111116 (2006).
14. B. Baek, A. E. Lita, V. Verma, and S. W. Nam, “Superconducting a-WxSi1-x nanowire single-photon detector with saturated internal quantum efficiency from visible to 1850 nm,” Appl. Phys. Lett. 98(25), 251101 (2011).
15. L. X. You, “Miniaturizing superconducting nanowire single-photon detection systems,” Supercond Sci Tech 31 (2018).
16. N. R. Gemmell, M. Hills, T. Bradshaw, T. Rawlings, B. Green, R. M. Heath, K. Tsimvrakidis, S. Dobrovolskiy, V. Zwiller, S. N. Dorenbos, M. Crook, and R. H. Hadfield, “A miniaturized 4K platform for superconducting infrared photon counting detectors,” Supercond Sci Tech 30 (2017).
17. V. Kotsubo, R. Radebaugh, P. Hendershott, M. Bonczyski, B. Wilson, S. W. Nam, and J. N. Ullom, “Compact 2.2 K Cooling System for Superconducting Nanowire Single Photon Detectors,” IEEE Trans. Appl. Supercond. 27(4), 1–5 (2017).
18. L. K. Shalm, E. Meyer-Scott, B. G. Christensen, P. Bierhorst, M. A. Wayne, M. J. Stevens, T. Gerrits, S. Glancy, D. R. Hamel, M. S. Allman, K. J. Coakley, S. D. Dyer, C. Hodge, A. E. Lita, V. B. Verma, C. Lambrocco, E. Tortorici, A. L. Migdall, Y. Zhang, D. R. Kumor, W. H. Farr, F. Marsili, M. D. Shaw, J. A. Stern, C. Abellán, W. Amaya, V. Pruneri, T. Jennewein, M. W. Mitchell, P. G. Kwiat, J. C. Bienfang, R. P. Mirin, E. Knill, and S. W. Nam, “Strong Loophole-Free Test of Local Realism,” Phys. Rev. Lett. 115(25), 250402 (2015).
19. H. Takesue, S. W. Nam, Q. Zhang, R. H. Hadfield, T. Honjo, K. Tamaki, and Y. Yamamoto, “Quantum key distribution over a 40-dB channel loss using superconducting single-photon detectors,” Nat. Photonics 1(6), 343–348 (2007).
20. M. E. Grein, A. J. Kerman, E. A. Dauler, M. M. Willis, B. Romkey, R. J. Molnar, B. S. Robinson, D. V. Murphy, and D. M. Boroson, “An optical receiver for the Lunar Laser Communication Demonstration based on photon-counting superconducting nanowires,” Advanced Photon Counting Techniques Ix 9492 (2015).
21. A. McCarthy, N. J. Krichel, N. R. Gemmell, X. Ren, M. G. Tanner, S. N. Dorenbos, V. Zwiller, R. H. Hadfield, and G. S. Buller, “Kilometer-range, high resolution depth imaging via 1560 nm wavelength single-photon detection,” Opt. Express 21(7), 8904–8915 (2013).
22. N. R. Gemmell, A. McCarthy, B. Liu, M. G. Tanner, S. D. Dorenbos, V. Zwiller, M. S. Patterson, G. S. Buller, B. C. Wilson, and R. H. Hadfield, “Singlet oxygen luminescence detection with a fiber-coupled superconducting nanowire single-photon detector,” Opt. Express 21(4), 5005–5013 (2013).
23. F. Marsili, F. Najafi, E. Dauler, F. Bellei, X. Hu, M. Csete, R. J. Molnar, and K. K. Berggren, “Single-Photon Detectors Based on Ultranarrow Superconducting Nanowires,” Nano Lett. 11(5), 2048–2053 (2011).
24. F. Marsili, F. Bellei, F. Najafi, A. E. Dane, E. A. Dauler, R. J. Molnar, and K. K. Berggren, “Efficient Single Photon Detection from 500 nm to 5 μm Wavelength,” Nano Lett. 12(9), 4799–4804 (2012).
25. F. Marsili, V. B. Verma, M. J. Stevens, J. A. Stern, M. D. Shaw, A. J. Miller, D. Schwarzer, A. Wodtke, R. P. Mirin, and S. W. Nam, “Mid-Infrared Single-Photon Detection with Tungsten Silicide Superconducting Nanowires,” Conf Laser Electr (2013).
26. L. Chen, D. Schwarzer, V. B. Verma, M. J. Stevens, F. Marsili, R. P. Mirin, S. W. Nam, and A. M. Wodtke, “Mid-infrared Laser-Induced Fluorescence with Nanosecond Time Resolution Using a Superconducting Nanowire Single-Photon Detector: New Technology for Molecular Science,” Acc. Chem. Res. 50(6), 1400–1409 (2017).
27. “The use of trade names is intended to allow the measurements to be appropriately interpreted, and does not imply endorsement by the US government, nor does it imply these are necessarily the best available for the purpose used here.”
28. “University of Michigan, A MATLAB based Rigorous coupled Wave Analysis tool (RicWaA), http://www-personal.umich.edu/~zlei/index.html”, retrieved.
29. A. Korneev, V. Matvienko, O. Minaeva, I. Milostnaya, I. Rubtsova, G. Chulkova, K. Smirnov, V. Voronov, G. Gol’tsman, W. Slysz, A. Pearlman, A. Verevkin, and R. Sobolewski, “Quantum efficiency and noise equivalent power of nanostructured, NbN, single-photon detectors in the wavelength range from visible to infrared,” IEEE Trans. Appl. Supercond. 15(2), 571–574 (2005).
30. D. N. B. Hall, R. S. Aikens, R. Joyce, and T. W. McCurnin, “Johnson noise limited operation of photovoltaic INSB detectors,” Appl. Opt. 14(2), 450–453 (1975).
31. H. C. Chang and G. E. Ewing, “Infrared Fluorescence from a Monolayer of CO on NaCl(100),” Phys. Rev. Lett. 65(17), 2125–2128 (1990).
32. M. S. Allman, V. B. Verma, M. Stevens, T. Gerrits, R. D. Horansky, A. E. Lita, F. Marsili, A. Beyer, M. D. Shaw, D. Kumor, R. Mirin, and S. W. Nam, “A near-infrared 64-pixel superconducting nanowire single photon detector array with integrated multiplexed readout,” Appl. Phys. Lett. 106(19), 192601 (2015).
33. R. G. Tobin, S. Chiang, P. A. Thiel, and P. L. Richards, “The C=O Stretching Vibration of Co on Ni(100) by Infrared-Emission Spectroscopy,” Surf. Sci. 140(2), 393–399 (1984).
34. S. Chiang, R. G. Tobin, P. L. Richards, and P. A. Thiel, “Molecule-Substrate Vibration of Co on Ni(100) Studied by Infrared-Emission Spectroscopy,” Phys. Rev. Lett. 52(8), 648–651 (1984).
35. S. Chiang, R. G. Tobin, and P. L. Richards, “Vibrational Spectroscopy of Chemisorbed Molecules by Infrared-Emission,” J. Vac. Sci. Technol. A 2(2), 1069–1074 (1984).
36. W. A. Brown, R. K. Sharma, P. Gardner, D. A. King, and D. H. Martin, “The Design of a Super-Sensitive Infrared-Emission Spectrometer for Studies of Adsorbate Dynamics,” Surf. Sci. 331, 1323–1328 (1995).
Vol. 26, No. 12 | 11 Jun 2018 | OPTICS EXPRESS 14860

37. F. H. Scholes, A. Locatelli, H. Kleine, V. P. Ostanin, and D. A. King, “Low frequency infrared emission spectroscopy of molecules at single crystal surfaces,” Surf. Sci. 502, 249–253 (2002).
38. Y. C. Hou, S. J. Jenkins, and D. A. King, “Surface infra-red emission during alkaki-metal incorporation at an oxide surface,” Surf. Sci. 550(1-3), L27–L32 (2004).
39. W. E. Moerner and D. P. Fromm, “Methods of single-molecule fluorescence spectroscopy and microscopy,” Rev. Sci. Instrum. 74(8), 3597–3619 (2003).
1. Introduction
Technologies for infrared single-photon detectors have emerged during the last few decades. These include HgCdTe avalanche photodiodes [1], single-photon up-conversion [2], transition edge sensors [3] and superconducting nanowires [4, 5]. The superconducting nanowire single-photon detectors (SNSPDs), for example, have demonstrated high efficiency (> 90% at 1.55 μm wavelength) [6–9], low timing jitter (< 20 ps) [10, 11], high count rates (> 10 MHz) [12, 13], and low intrinsic dark count rates (< 1 Hz) [6, 14]. Although SNSPDs operate at low temperatures (typically 4K or below), miniaturized and low-maintenance cryogen-free systems are now developed and commercially available [15–17], making them a key enabling technology for various near-infrared applications, including fundamental test of quantum optics [18], quantum key distribution [19], space-to-ground optical communication [20], light detection and ranging (LIDAR) [21], and singlet oxygen luminescence detection [22]. Extension of such performance into the mid-IR opens a path to a wide range of applications where extremely high sensitivity and excellent temporal resolution is required for molecular spectroscopy.
One approach employed fabrication of ultra-narrow (< 50 nm) nanowires with superconducting materials such as NbN [23, 24]; however, the requirement of narrow widths significantly reduces the yield for large-area detectors due to fabrication imperfections. Another approach exploits new superconducting nanowire materials - e.g. amorphous tungsten silicide (a-WSi) alloy. This allows efficient detection for mid-infrared photons with standard nanowire width (on the order of 100 nm) owing to its smaller superconducting gap energy and structural homogeneity [14]. SNSPD devices based on WSi developed by Nam et. al. have demonstrated saturated internal quantum efficiency from 2.1 to 5.5 μm wavelength [25]
Using a WSi SNSPD, we have recently published a preliminary report [26] demonstrating nanosecond time-resolved laser-induced infrared fluorescence (LIIF) spectroscopy of a sample of 1400 layers of CO molecules adsorbed to the surface of a cooled NaCl crystal. Upon laser excitation of the CO vibrational overtone transition (0→2) at 2.47 µm, vibrational energy pooling leads to controlled amounts of light emission at wavelengths between 2 and 7 µm. The aim of that paper was to describe to the physical chemistry community the possible applications of SNSPD technology in molecular spectroscopy. It describes what is needed to implement SNSPDs in a spectrometer-geometry typical for a community that is largely unaware of this technology. Since that time, we have extended our studies in an effort to fully characterize the properties of WSi SNSPDs in the mid-IR. This paper reports two key findings. First, we have made quantitative measurements of detection limits of the WSi SNSPD in the mid-IR. We show that strong LIIF signals can be obtained from samples of CO on NaCl(100) with monolayer and sub-monolayer coverage levels, sample quantities less than 1/1000th of that used in [26]. In addition, for the first time we combine a ps-laser with this spectrometer to probe its ultimate time response. We demonstrate temporal resolution below 1 ns, about 5000 × faster than a commonly used infrared InSb semiconductor detector.
2. Experimental methods
Figure 1(a) depicts the a-WSi SNSPD-based mid-infrared emission spectrometer used in this work. Either laser-induced infrared fluorescence from surface adsorbates or blackbody radiation from a thermal light source (~1350 K globar) is collected and sent through a grating monochromator. Dispersed fluorescence photons exiting the monochromator pass through
Vol. 26, No. 12 | 11 Jun 2018 | OPTICS EXPRESS 14861
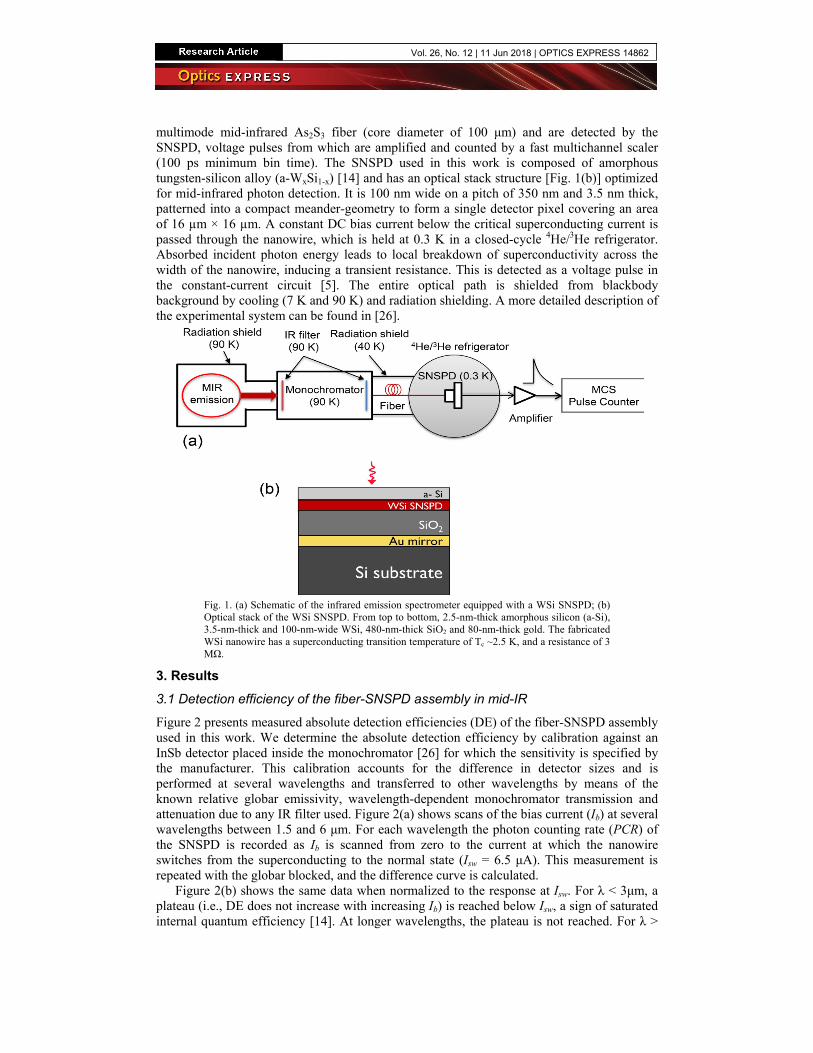
multimode mid-infrared As2S3 fiber (core diameter of 100 μm) and are detected by the SNSPD, voltage pulses from which are amplified and counted by a fast multichannel scaler (100 ps minimum bin time). The SNSPD used in this work is composed of amorphous tungsten-silicon alloy (a-WxSi1-x) [14] and has an optical stack structure [Fig. 1(b)] optimized for mid-infrared photon detection. It is 100 nm wide on a pitch of 350 nm and 3.5 nm thick, patterned into a compact meander-geometry to form a single detector pixel covering an area of 16 µm × 16 µm. A constant DC bias current below the critical superconducting current is passed through the nanowire, which is held at 0.3 K in a closed-cycle 4He/3He refrigerator. Absorbed incident photon energy leads to local breakdown of superconductivity across the width of the nanowire, inducing a transient resistance. This is detected as a voltage pulse in the constant-current circuit [5]. The entire optical path is shielded from blackbody background by cooling (7 K and 90 K) and radiation shielding. A more detailed description of the experimental system can be found in [26].
Fig. 1. (a) Schematic of the infrared emission spectrometer equipped with a WSi SNSPD; (b) Optical stack of the WSi SNSPD. From top to bottom, 2.5-nm-thick amorphous silicon (a-Si), 3.5-nm-thick and 100-nm-wide WSi, 480-nm-thick SiO2 and 80-nm-thick gold. The fabricated WSi nanowire has a superconducting transition temperature of Tc ~2.5 K, and a resistance of 3 MΩ.
3. Results
3.1 Detection efficiency of the fiber-SNSPD assembly in mid-IR
Figure 2 presents measured absolute detection efficiencies (DE) of the fiber-SNSPD assembly used in this work. We determine the absolute detection efficiency by calibration against an InSb detector placed inside the monochromator [26] for which the sensitivity is specified by the manufacturer. This calibration accounts for the difference in detector sizes and is performed at several wavelengths and transferred to other wavelengths by means of the known relative globar emissivity, wavelength-dependent monochromator transmission and attenuation due to any IR filter used. Figure 2(a) shows scans of the bias current (Ib) at several wavelengths between 1.5 and 6 μm. For each wavelength the photon counting rate (PCR) of the SNSPD is recorded as Ib is scanned from zero to the current at which the nanowire switches from the superconducting to the normal state (Isw = 6.5 μA). This measurement is repeated with the globar blocked, and the difference curve is calculated.
Figure 2(b) shows the same data when normalized to the response at Isw. For λ < 3μm, a plateau (i.e., DE does not increase with increasing Ib) is reached below Isw, a sign of saturated internal quantum efficiency [14]. At longer wavelengths, the plateau is not reached. For λ >
Vol. 26, No. 12 | 11 Jun 2018 | OPTICS EXPRESS 14862

2μm, DE drops exponentially with λ - the rate of exponential fall-off is strongly dependent on Ib [Fig. 2(c)]. At the highest Ib ( = 6.5 μA) possible with this detector, DE drops by one order of magnitude between 2 and 6 μm. For λ = 1.5 μm, DE is reduced by the optical stack- see Fig. 2(d). The maximum DE at λ = 2 μm is 0.5% and reflects the mismatch in sizes between the fiber (100 μm core diameter) and the SNSPD (16 μm × 16 μm). When correcting for this spatial overlap loss, the maximum DE may be as high as 15% at λ = 2 μm.
Fig. 2. Detection efficiency (DE) of the fiber-SNSPD assembly. (a) Wavelength-dependent bias current (Ib) scans of DE at λ = 1.5 −6 μm; the switch current is Isw = 6.5 μA; (b) Normalized spectrum response of the WSi SNSPD plotted on a linear scale to illustrate the plateau in DE. At each wavelength, the measured Ib scan curve is normalized to the photon counting rate (PCR) at Isw. The 1.5 μm curve is noisy because of the low photon flux and the low system detection efficiency; (c) Wavelength-dependent DE obtained from data in Fig. 2(a) at several fixed Ib. The error bars are only shown for Ib = 5.5 μA data for clarity. The relative errors are in the range of 30%-50%, estimated based on uncertainties of the relative globar light intensity, the grating efficiency, and the SNSPD PCR measurements. The right-y axis shows the QE value when the size is matched between the SNSPD and the fiber, which results in 30 times higher fiber-coupling efficiency; (d) Wavelength-dependent optical absorption of the WSi SNSPD simulated based on parameters of the optical stack described in Fig. 1(b). The black absorption curve is the average of the TE mode (red curve) and TM mode (blue curve) absorption curves.
3.2 Spectrometer sensitivity and temporal response: LIIF spectroscopy of CO on NaCl(100)
Previously we showed that the SNSPD-based emission spectrometer can be used to observe mid-infrared emission in the range of 1.9-7.1 µm, originating from a multilayer (~1400 layers) CO sample on NaCl (100) [26]. Here, we exploit the detection limit of the spectrometer by performing LIIF measurements with reduced CO coverage at the NaCl(100) surface. Figure 3 shows a comparison of FTIR absorption [Fig. 3(a)] and LIIF excitation spectra [Fig. 3(b)] from a single monolayer (ML) and from a sub-monolayer (0.3 ML) sample of CO on NaCl (100). The sub-monolayer spectral feature is much broader (~4 cm−1) than that of the monolayer (FWHM < 0.2 cm−1) indicating heterogeneous broadening in the 0.3 ML sample. This is likely due to CO forming in different sized islands on the NaCl surface. This also reduces both the peak IR absorbance and the peak LIIF fluorescence intensity of the 0.3 ML spectrum compared to that of the ML sample.
Vol. 26, No. 12 | 11 Jun 2018 | OPTICS EXPRESS 14863

Fig. 3. Infrared spectroscopy of a monolayer and a sub-monolayer (~0.3 monolayer) sample of 13C18O on NaCl (100) at Ts = 7 K. (a) FTIR absorption spectra in the fundamental transition (v = 0→1) region; (b) LIIF excitation spectra (red circle points). Here, the total first overtone fluorescence was measured with the monochromator grating replaced by a gold mirror. The red solid lines are a Gaussian peak fit for the monolayer spectrum and an empirical multiple-Gaussian peak fit for the submonolayer spectrum. For the submonolayer and monolayer spectra data 1000 laser shots (ca. 1.7 minutes) and 100 laser shots (10 seconds) were averaged, respectively. The signal integration time window was 0.05-1.05 ms and the SNSPD bias current was 4 μA. The same FTIR spectra shown in (a) are overlapped for comparison.
We characterise the time response of the spectrometer using short mid-IR laser pulses - see Fig. 4. Here, the temporal profile of a few-nanosecond long pulse from a 10 Hz Q-switched Nd:YAG pumped optical parametric amplifier is easily resolved (measured FWHM = 4.7 ± 0.2 ns), while the temporal profile of a 30-ps laser pulse (EKSPLA [27], model PL2231, 50 Hz, FWHM ≈30 ps) is limited (FWHM = 0.6 ± 0.2 ns) by the SNSPD detection system. When the nanosecond laser pulse is measured with a commercial liquid nitrogen cooled InSb semiconductor detector (Judson Technologies J10D-M204-R02M-60), the detector response time is shown to be about 3 µs.
Fig. 4. Temporal profiles obtained with the WSi SNSPD illuminated by scattered light pulses from a nanosecond (empty squares) and a picosecond laser (filled squares). Both lasers emit at λ = 4.9 μm. The laser intensities were heavily attenuated so that much less than one photon per pulse was detected. The measured laser profiles (100 ps/point) are fitted with Gaussians (black solid lines) to yield the FWHM values. The picosecond laser pulse has a specified FWHM ≈30 ps. The inset graph shows the response time of the InSb detector to the scattered nanosecond laser pulse.
Vol. 26, No. 12 | 11 Jun 2018 | OPTICS EXPRESS 14864

4. Discussion
The WSi SNSPD used here shows saturated internal quantum efficiency at λ = 1.5 μm, 2.0 μm and 2.5 μm [Fig. 2(b)], consistent with previous reports [6, 14, 25]. The detection efficiency of the fiber-SNSPD assembly can be decomposed as
fiber couple absorb QEDE η η η η= (1)
where ηfiber is the fiber transmission, ηcouple is the geometric coupling efficiency, ηabsorb is the absorption efficiency and
QEη is the internal quantum efficiency. The fiber transmission
includes transmission into and out of the fiber end facets and through the fiber itself. Ignoring propagation loss in the short (~1 m) fiber, the high refractive index (n = 2.4) of the chalcogenide fiber leads to reflection loss induced ηfiber ≈ 0.69. The geometric coupling efficiency describes how well the optical mode exiting the fiber spatially overlaps the active area of the detector. Assuming light is uniformly distributed across the 100 μm-diameter fiber core, ηcouple ≈ 0.033 to the 16 × 16 μm2 detector active area. ηabsorb is the probability that a photon incident on the detector’s active area is absorbed in the detector. The internal quantum efficiency is the probability that a photon coupled to and absorbed in the detector leads to an output voltage pulse. Previously, in the near-IR, it has been shown that a saturated DE -which does not increase with increasing bias current -is an indication that ηQE ≈ 1 [6, 25].
Figure 2(d) shows simulations of absorption efficiency in the nanowire; these were performed using the rigorously coupled wave analysis (RCWA [28]) method with code designed to optimize the optical absorption in the detector at a given wavelength. Optical constants of the materials, including the WSi thin film, were extracted from measurements of the film thickness combined with measurements of the reflection and transmission over a wavelength range of 1 to 7 μm. Light polarized along the length of the nanowires (TE mode) is expected to be much more strongly absorbed than the orthogonal polarization (TM mode). At λ = 2 μm, the simulation predicts ηabsorb = 0.2 when averaged over all polarizations. Using the values ηfiber ≈ 0.69, ηcouple ≈ 0.033, ηabsorb = 0.2 and ηQE = 1, we predit an overall efficiency of 0.46%, very close to the measured value of 0.5%. At λ = 3 μm, the predicted ηabsorb ≈0.39, yielding an expected DE ≈0.9%, roughly a factor of five larger than the measured value; a small part of this discrepancy can be attributed to the DE not quite reaching saturation at this wavelength (ηQE < 1), but other factors, such as imperfect simulations or wavelength-dependent losses from other optical elements, must also contribute to this discrepancy. At wavelengths longer than 2.5 μm, the internal quantum efficiency drops at a fixed bias current, because disrupting superconductivity across the entire width of the nanowire becomes less probable with decreasing photon energy.
We next calculate the noise equivalent power (NEP) of the SNSPD-based spectrometer using measured values of the absolute detection efficiency DE [Fig. 2(c)] and the system background count rate Rb in the range of 2-36 kHz with Ib = 6.5 μA [26]. For this we use the relation below [29]:
1
2 b
hcNEP R
DEλ= (2)
Figure 5 shows wavelength dependent NEP of the fiber-SNSPD assembly (solid circles) compared to that of a commercial InSb detector (solid line). The InSb detector NEP is 100-1000 times higher over this mid-IR range. While the NEP of the InSb detector is limited by its intrinsic dark current, the NEP of the SNSPD-based spectrometer still has a large room for improvement. For example, by using a larger detector or detector array to match the fiber-SNSPD size, the DE can be increased 30-fold. Also, with more careful black body radiation shielding and more efficient monochromator cooling, it will be possible to reduce the background count rate towards the intrinsic dark count rate < 1 Hz [14] of the SNSPD. With
Vol. 26, No. 12 | 11 Jun 2018 | OPTICS EXPRESS 14865

such ideas successfully implemented, it will be possible to obtain a NEP level of ~10−18
/W Hz at wavelengths as long as 6 μm. To emphasize this, Table 1 shows a side-by-side mid-IR performance comparison between the WSi SNSPD and the InSb detector.
Fig. 5. Calculated NEP (filled circles) of the fiber-coupled SNSPD detection system (see text) with Ib = 6.5 μA at wavelengths between 2 and 6 μm. The solid curve is the typical NEP level of a commercial liquid-nitrogen-cooled InSb detector (Teledyne Judson [27]) with an active detector size of dia. 1mm.
Table 1. Mid-IR performance comparison between the WSi SNSPD and the InSb detector
Detector Response time (ns)
aNEP (pW/Hz1/2) Wavelength range (µm)
Temperature (K)
Detector size (µm)
WSi SNSPD < 1 0.005 2-7 b 0.3 16 × 16 InSb > 1000 0.7 1-5.5 c 77 dia. 1000 a compared at 5 µm wavelength, see Fig. 5. b the 7 μm cutoff is limited by the fiber optics [26]; can be extended to longer wavelengths using free-space coupling, and the detection efficiency vs. wavelength curve can be engineered by optical stack designing and optimization; c the 5.5 μm cutoff is limited by the band-gap energy of the InSb semiconductor material.
By comparison, it has proven possible to improve the NEP of an InSb detector to ~10-
15 /W Hz ; however, this slowed the detector time-response to ~0.1 s [30]. By contrast, the temporal response of SNSPDs has been previously shown to be better than 20 ps [10, 11], which is a key advantage for all studies requiring high time-resolution. Recently, we showed how an ultrafast SNSPD was necessary to reveal vibrational energy pooling in a CO crystal occurring on the nanosecond time-scale. In that work, the time resolution was limited by the duration of the nanosecond laser pulses [26]. In Fig. 4 of this paper we have demonstrated a temporal resolution of 600 ± 200 ps. The observed system time response is believed to be dominated by the electrical noise of the readout circuit of the SNSPD device [6] and/or the temporal dispersion of the multimode mid-IR fiber. A fiber-free setup is presently being implemented in our laboratory and electrical noise will be further minimized by using a cryogenically cooled readout circuit. These improvements are expected to further improve the temporal response.
Sensitivity may also be dramatically improved. The SNSPD device used in this work has an active area 1000 × smaller than a typical InSb detector. Despite this, we were able to measure dispersed infrared fluorescence from a sub-monolayer of CO on NaCl (100), which is not possible with an InSb detector [31]. A 64-pixel a-WSi SNSPD array has recently been demonstrated [32] with an area of ~0.5 mm × 0.5 mm and 25% fill factor. Thus, there is much room to improve detector sensitivity. We also point out that the LIIF measurements on CO adsorbates on NaCl were performed with lasers operating at a repetition rate of 10 Hz – this was important as the fluorescence lifetimes are on the order of 10−3 s. For studies where fluorescence lifetimes are shorter, high repetition rate lasers can be used. Modern fiber lasers
Vol. 26, No. 12 | 11 Jun 2018 | OPTICS EXPRESS 14866

operate at repetition rates higher than 100 MHz. Using similar data acquisition times as those used in the current work, we could anticipate successful studies on systems with much smaller fluorescence quantum yields and accordingly shorter fluorescence lifetimes.
The SNSPD-based detection system described here is potentially an extremely sensitive infrared emission spectrometer for surface adsorbates. Using a liquid-helium-cooled grating monochromator equipped with a Si:Sb photoconductive infrared detector, Richards and associates [33–35] have detected infrared emission originating from vibrational modes of CO (C-Ni stretching vibration at ~470 cm−1 and C꞊O stretching vibration at ~2000 cm−1) adsorbed on a Ni(100) surface at room temperature. King and associates [36–38] designed a liquid-helium-cooled FTIR spectrometer with a 0.3 K Cd-doped Ge bolometric detector for ultra-sensitive detection of thermal emission from surface-adsorbates. The bolometer detectors used in the experiments mentioned above have exhibited extremely low NEP (< 8 × 10⁻¹⁶
/W Hz ) in the detector-noise-limited regime, which is comparable to our current fiber-coupled SNSPD system (see Fig. 5). They also have a flat sensitivity response over a wide spectral range into the far-IR region, albeit with a very slow response time on the order of milliseconds. With careful shielding of blackbody background and efficient detector coupling, an infrared emission spectrometer equipped with SNSPDs is expected to be able to provide more information on adsorbate vibrational dynamics, due to its high sensitivity and excellent temporal response. We also note that the use of WSi SNSPDs at wavelengths beyond the cut-off wavelength of InSb is extremely promising.
Finally, the superior mid-infrared performance of the WSi SNSPD demonstrated here may also prove useful for single-molecule infrared fluorescence spectroscopy and microscopy. Typical values of system detection efficiency for modern single-molecule fluorescence microscopy (SFM) systems at visible wavelengths are in the range of 1%-8% [39]. The system detection efficiency, SDE = Fcoll × Fopt × DE, is a product of the fluorescence collection factor Fcoll, the optical transmission factor Fopt including optical loss and IR filter transmission, and the detector efficiency DE. The value of SDE for the current SNSPD detector system described here is as low as 4 × 10⁻⁶ at λ = 4 μm, with Fcoll = 0.005 (primarily limited by the acceptance angle (16°) of the monochromator), Fopt = 0.8 and DE ≈0.1% (limited by the fiber coupling loss). With a similar fluorescence collection optical configuration as those used for visible SFM systems [39] and using free-space coupled SNSPDs or larger detector arrays, it is feasible to obtain a value of 10% for Fcoll and 10% for DE, leading to a ~1% system detection efficiency in the mid-IR. Therefore, mid-IR SNSPDs can potentially be used to extend the SFM technique from visible to the mid-IR region.
5. Summary
We have demonstrated a ultra-high sensitivity and sub-nanosecond temporal response from a WSi SNSPD based emission spectrometer employing LIIF spectroscopy of CO molecules at a NaCl (100) surface. We determine the noise equivalent power (NEP) of the current SNSPD
detector system from 2 μm (4 × 10⁻¹⁶ /W Hz ) to 6 μm (5 × 10⁻¹⁵ /W Hz ) - these results are not yet limited by detector noise but rather by background radiation, which is largest near
4 μm (1 × 10-14 /W Hz ). This sensitivity is more than 100 × better than that of a semiconductor-based InSb detector from 2 to 6 µm. There remains significant room for improvement of the current system detection efficiency. The internal quantum efficiency of the a-WSi nanowire is determined to be close to unity at 1.5-2.5 µm wavelengths and remains above 10% extending to longer wavelengths up to 6 µm. The high detection sensitivity in the mid-IR combined with the ultrafast temporal response of the WSi SNSPDs is expected to be useful in a broad range of applications in molecular science.
Vol. 26, No. 12 | 11 Jun 2018 | OPTICS EXPRESS 14867

Disclaimer
“Certain commercial equipment, instruments, or materials (or suppliers, or software ...) are identified in this paper to foster understanding. Such identification does not imply recommendation or endorsement by the National Institute of Standards and Technology, nor does it imply that the materials or equipment identified are necessarily the best available for the purpose.”
Funding
Alexander von Humboldt Foundation; Max Planck Society for the Advancement of Science; NIST Quantum Information Program
Vol. 26, No. 12 | 11 Jun 2018 | OPTICS EXPRESS 14868
![FOURIER -TRANSFORM INFRARED SPECTROMETER [FTIR]](https://static.fdocuments.us/doc/165x107/587539961a28abe7728b6867/fourier-transform-infrared-spectrometer-ftir.jpg)