Waterless Car Wash - Pearl Eco Tire Shine, Trim Dressing & Ultra UV Protectant

LLNL-TR-491160
Ultra-scale Visualization ClimateData Analysis Tools (UV-CDAT)
D. N. Williams
July 20, 2011

Disclaimer
This document was prepared as an account of work sponsored by an agency of the United States government. Neither the United States government nor Lawrence Livermore National Security, LLC, nor any of their employees makes any warranty, expressed or implied, or assumes any legal liability or responsibility for the accuracy, completeness, or usefulness of any information, apparatus, product, or process disclosed, or represents that its use would not infringe privately owned rights. Reference herein to any specific commercial product, process, or service by trade name, trademark, manufacturer, or otherwise does not necessarily constitute or imply its endorsement, recommendation, or favoring by the United States government or Lawrence Livermore National Security, LLC. The views and opinions of authors expressed herein do not necessarily state or reflect those of the United States government or Lawrence Livermore National Security, LLC, and shall not be used for advertising or product endorsement purposes.
This work performed under the auspices of the U.S. Department of Energy by Lawrence Livermore National Laboratory under Contract DE-AC52-07NA27344.
Lawrence Livermore National Laboratory LLNL-AR-######
Ultra-scale Visualization Climate Data Analysis Tools
(UV-CDAT)
Semi-Annual Progress Report January 1, 2011 through June 30, 2011

UV-CDAT Semi-Annual Progress Report January 1, 2011 through June 30, 2011 LLNL-AR-######
2
BER’s Ultra-scale Visualization Climate Data Analysis Tools Semi-Annual Progress Report for the Period
January 1, 2011 through June 30, 2011
Principal Investigators: Dean N. Williams3, David Bader5, and Phil Jones2
The Ultra-scale Visualization Climate Data Analysis Tools Team: Andy Bauer1, Berk Geveci1, Dave Partka1
Jim Ahrens2, John Patchett2, Johnathan Woodring2 Timo Bremer3, Charles Doutriaux3, Robert Drach3
Thomas Maxwell4 Ross Miller5, Galen Shipman5, Raju Ranga Vatsavai5, Feiyi Wang5, Zhe Zhang5
Cameron Christensen6, David Koop6, Valerio Pascucci6, Emanuele Santos6, Claudio Silva6, Huy Vo6
1 Kitware, Inc.
2 Los Alamos National Laboratory 3 Lawrence Livermore National Laboratory 4 National Aeronautics and Space Administration 5 Oak Ridge National Laboratory 6 University of Utah
UV-CDAT Semi-Annual Progress Report January 1, 2011 through June 30, 2011 LLNL-AR-######
iii
Table of Contents
BER’s Ultra-scale Visualization Climate Data Analysis Tools .................................................2
1 Executive Summary.................................................................................................................5
2 Reporting Period Highlights from Kitware, LANL, LLNL, NASA, ORNL, and the University of Utah....................................................................................................................6
2.1 Kitware and LANL Project Highlights:..............................................................................6
2.2 LLNL Project Highlights....................................................................................................7
2.3 NASA Project Highlights ...................................................................................................7
2.4 ORNL Project Highlights ...................................................................................................8
3 Component Progress ...............................................................................................................8
3.1 VTK NetCDF POP Reader.................................................................................................9
3.2 Parallel Input and Output (I/O)...........................................................................................9
Figure 2: VTK reader time as a functional number of temporal regions and compute resources .......................................................................................................10
Figure 3: Read timings as a function of compute nodes (12 processes per node) for the NetCDF, Parallel NetCDF, and our new FastNetCDF reader........11
3.3 Spatiotemporal Parallelism Design ..................................................................................11
Figure 4: Overall visualization time as a function of concurrent temporal regions and computational resources ......................................................................................12
3.4 Workflow..........................................................................................................................12
Figure 5: Analysis workflow........................................................................................13
Figure 6: NASA ParaView Client Qt desktop application that controls data access, processing, analysis, and visualization .......................................................13
3.5 UV-CDAT Graphical User Interface (GUI) .....................................................................14
3.6 UV-CDAT Build Process .................................................................................................15
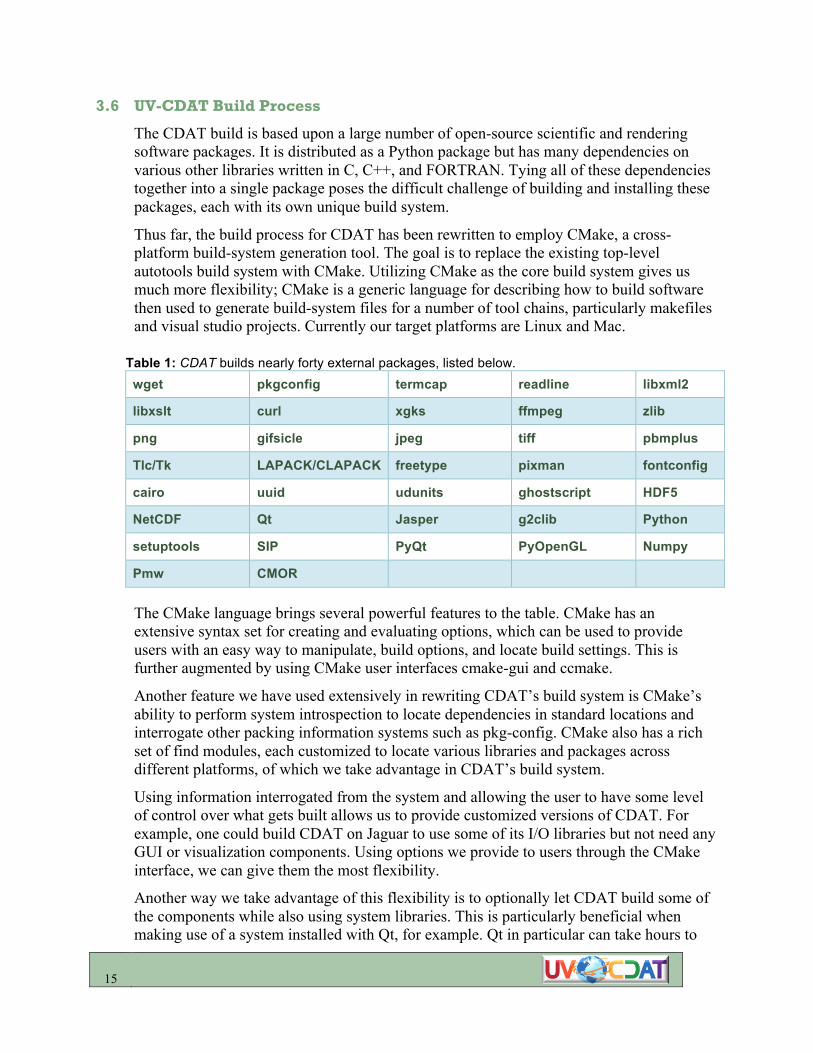
Table 1: CDAT builds nearly forty external packages, listed below. ....................15
4 UV-CDAT Group Meetings..................................................................................................16
5 Collaborations........................................................................................................................16
6 Outreach, Papers, Presentations, and Posters ....................................................................17
6.1 Papers................................................................................................................................17
6.1.1 Visualization and Analysis of Eddies in a Global Ocean Simulation .......................17
6.1.2 Adaptive Extraction and Quantification of Discrete Vortices...................................17
UV-CDAT Semi-Annual Progress Report June 1, 2010 through December 31, 2010 LLNL-AR-466371
iv
6.1.3 Separating Signal and Noise in Atmospheric Temperature Changes: The Importance of Timescale .............................................................................................................18
6.1.4 Calculating synthetic microwave sounder brightness temperatures from discrete level data...................................................................................................................19

UV-CDAT Semi-Annual Progress Report January 1, 2011 through June 30, 2011 LLNL-AR-######
5
1 Executive Summary
This report summarizes work carried out by the Ultra-scale Visualization Climate Data Analysis Tools (UV-CDAT) Team for the period of January 1, 2011 through June 30, 2011. It discusses highlights, overall progress, period goals, and collaborations and lists papers and presentations. To learn more about our project, please visit our UV-CDAT website (URL: http://uv-cdat.org). This report will be forwarded to the program manager for the Department of Energy (DOE) Office of Biological and Environmental Research (BER), national and international collaborators and stakeholders, and to researchers working on a wide range of other climate model, reanalysis, and observation evaluation activities.
The UV-CDAT executive committee consists of Dean N. Williams of Lawrence Livermore National Laboratory (LLNL); Dave Bader and Galen Shipman of Oak Ridge National Laboratory (ORNL); Phil Jones and James Ahrens of Los Alamos National Laboratory (LANL), Claudio Silva of Polytechnic Institute of New York University (NYU-Poly); and Berk Geveci of Kitware, Inc. The UV-CDAT team consists of researchers and scientists with diverse domain knowledge whose home institutions also include the National Aeronautics and Space Administration (NASA) and the University of Utah. All work is accomplished under DOE open-source guidelines and in close collaboration with the project’s stakeholders, domain researchers, and scientists.
Working directly with BER climate science analysis projects, this consortium will develop and deploy data and computational resources useful to a wide variety of stakeholders, including scientists, policymakers, and the general public. Members of this consortium already collaborate with other institutions and universities in researching data discovery, management, visualization, workflow analysis, and provenance. The UV-CDAT team will address the following high-level visualization requirements:
• Alternative parallel streaming statistics and analysis pipelines o Data parallelism o Task parallelism o Visualization parallelism
• Optimized parallel input/output (I/O) • Remote interactive execution • Advanced intercomparison visualization • Data provenance processing and capture • Interfaces for scientists
o Workflow data analysis and visualization construction tools o Visualization interfaces

6
2 Reporting Period Highlights from Kitware, LANL, LLNL, NASA, ORNL, and the University of Utah
This section describes the team’s accomplishments during the reporting period, in which the overall goal was to advance the project to accomplish its mission of providing useful tools and product services within the UV-CDAT framework. The UV-CDAT is intended to serve customers who span a broad spectrum of sophistication. Detailed use cases, architecture design, and software challenges can be found on our UV-CDAT website: http://uv-cdat.org. For the next reporting period, the team will be working towards overall system integration.
2.1 Kitware and LANL Project Highlights:
• Updated the Visualization Tookit’s (VTK’s) NetCDFPOP reader for improved performance
• Implemented spatiotemporal parallelism Use Case 1 in ParaView (see Figure 1)
• Implemented spatiotemporal parallelism Use Case 2 prototype in VTK
• Collaborated with ORNL on parallel I/O in support of ultra-scale visualization.
o Weekly meetings Monday at 4 pm Eastern.
• Participated in investigating parallel visualization and analysis.
• Participated in providing analysis for BER data sets.
• Published two papers with joint visualization and climate scientist authorship
• Led the development of server-side analysis for ultra-scale requirements
o Spatiotemporal operators min, max, mean, stddev implemented
• Added NetCDF Model for Prediction Across Scales (MPAS) and NetCDF Community Atmospheric Model (CAM) Convention Readers to VTK
o The CAM reader supports only the unstructured grid format.
Figure 1: Use Case 1 test image generated using ParaView’s Python interface. A subset of
processors operated in a data-parallel way to read, contour, render, composite, and write this image, while other processor groups simultaneously operated other time steps.
7
2.2 LLNL Project Highlights
• Released the first alpha release of the UV-CDAT software stack to the UV-CDAT developers and to the Program for Climate Model Diagnosis and Intercomparison (PCMDI) group
• Led development of the UV-CDAT graphical user interface
• Assisted Kitware with the complex CMake build script of the UV-CDAT disparate software system. This includes maintaining the software repository.
• Taught Python and UV-CDAT course at the 2011 AMS conference:
o American Meteorological Society Short Course on Using Python in Climate and Meteorology (January 22–23, 2011), in Seattle, WA. With the exception of files described in the acknowledgments, all files were developed by Charles Doutriaux, Johnny Lin, Alex Pletzer, and Dean Williams. The AMS Short Course on Using Python in Climate and Meteorology and UV-CDAT was held on January 22–23, 2011 at the 91st AMS Annual Meeting in Seattle, WA.
o The course was divided into four parts: 1) the Python programming language; 2) introduction to the most advanced Python-based set of tools available to the community: CDAT; 3) how to use Python to access one of the most extensive data resources available, the Earth System Grid; 4) case study of integrative atmospheric science modeling and analysis using Python. The short course outline follows:
An introduction to the syntax and structure of Python (geared towards scientific use).
Climate-data analysis using the Ultrascale Visualization Climate Data Analysis Tools (UV-CDAT).
The Earth System Grid-Center for Enabling Technology (ESG-CET): Accessing and using the CMIP5 model output via UV-CDAT.
Case studies of integrative atmospheric science modeling and analysis using Python.
2.3 NASA Project Highlights
• Initiated the integration of 3D Climate Data Visualization (vtDV3D) into UVCDAT / Vistrails / ParaView / ESGF
• Performed remote analysis and visualization of climate data on Dail NASA computer system
• Prepared clients (hyperwall, desktop preparation) for Supercomputing 2011
• Performed in situ analysis and real-time visualization of GEOS-5 runs
• Performed 3D stereo visualization of climate data
8
• UV-CDAT Parallel Use Cases:
o Hurricane tracking with high resolution GEOS-5 data
o Seeking more scientific use cases
2.4 ORNL Project Highlights
• Led development of parallel I/O in support of ultra-scale visualization
o Stand-alone parallel I/O reader supporting temporal and spatial decomposition has been completed and evaluated on Jaguar XT5
o Integration of parallel VTK reader supporting temporal and spatial decomposition has is near completion
• Integrated and evaluated spatiotemporal parallelism Use Case 1 on Jaguar XT5 at the OLCF using ParaView
• Integrated and evaluated spatiotemporal parallelism Use Case 2 on Jaguar XT5 at the OLCF using VTK
• Collaborated with Kitware/LANL on Use Case 1 and Use Case 2 implementation
• Participated in investigating parallel visualization and analysis.
• Participated in providing analysis and visualization for BER data sets
• Initiated collaboration with BER-funded Land Model team at ORNL to support their analysis and visualization requirements of ensemble members generated on Jaguar XT5
o Support their model diagnostics and comparative visualization/ analysis needs
• Led evaluation of NetCDF MPAS and NetCDF CAM Convention Readers added to VTK on Jaguar XT5
• Continued to provide access to Jaguar XT5 and other ORNL systems for collaborative development through a Director’s discretionary allocation (PI: Galen Shipman). The UV-CDAT continues to use the computational and storage resources at the Oak Ridge Leadership Computing Facility to support our efforts
3 Component Progress
During this reporting period, progress was made in the key areas that are necessary to meet UV-CDAT goals and objectives.
We do have Use Case 1 implemented and functioning in ParaView and VTK. The implementation can currently do the following:
• Read time steps and assign them to subgroups of processors (time compartments) for data parallel processing.

9
• Write out imagery
• Round-robin assignment if there are more time steps than time compartments.
• Works for batch case
Further development includes
• Integration into ParaView
• Interactive case
• Live demo
• Publication avenue
We are on track for having a Use Case 2 demo/proof of concept for the batch case of Use Case 2 by the end of July.
The first instantiation will read 1 file/node all 365 simultaneously and calculate the average. Based on our testing, we think we will be able to time average the 365-time step maltrud data set in about 25 seconds, which will double the speed.
A 20-second period to read + binary swap composite pattern means each node sends and receives two times their data size (3GB). At a low ball 500 MB/sec, that should be three seconds, which is a significant speed up.
3.1 VTK NetCDF POP Reader
VTK readers for the NetCDF MPAS and CAM conventions were added to VTK and ParaView in support of Use Cases 1 and 2. Both readers currently support temporal parallelism with some limitations in scalability. The MPAS reader was originally developed by Christine Ahrens from LANL. The CAM reader was developed in collaboration with Mark Taylor from Sandia. Both readers have been integrated within VTK and evaluated on the Jaguar XT5 system at ORNL. Currently the CAM reader supports only the unstructured grid format. Both readers currently have scalability limitations on Leadership-class computing environments. To address this the team is completing development of a high-performance parallel reader that optimizes file system access based on data and temporal decomposition within VTK as described in section 3.2 below.
3.2 Parallel Input and Output (I/O)
Our scalability studies of the new temporal parallelism feature on Jaguar have confirmed that the primary performance limitation at larger scale is directly attributable to poor scalability of current VTK readers. Our studies indicate that concurrent, independent reader access results in poor scalability as illustrated in Figure 2.

10
Figure 2: VTK reader time as a functional number of temporal regions and compute resources
Having identified the root-cause of this poor scalability, we have evaluated a number of design alternatives to improve parallel I/O performance and implemented a new parallel I/O component, which we have dubbed “FastNetCDF.” The FastNetCDF component optimizes file-system access based on the temporal and spatial decomposition of the analysis task. Initial results show dramatic improvements in performance scalability when compared to the current NetCDF and Parallel NetCDF (PNetCDF) VTK readers, as illustrated in Figure 3.

11
Figure 3: Read timings as a function of compute nodes (12 processes per node) for the NetCDF,
Parallel NetCDF, and our new FastNetCDF reader
Integration of FastNetCDF within VTK in support of parallel spatial and temporal analysis is nearing completion (currently in the debug stage). Once complete, we anticipate significant speedups in analysis tasks at the Ultra-Scale as we remove the primary bottleneck to scalability of these workloads.
3.3 Spatiotemporal Parallelism Design
Spatiotemporal parallelism, in which data sets can be intelligently divided on computational resources based on both time and space for data analysis, was a major focus of development in the last half of this reporting period. We designed a Python interface to use ParaView for spatiotemporal parallelism. This was done to enable ParaView as a server side for the loosely coupled UV-CDAT integration and for the non-interactive parallel Use Cases.
ParaView has successfully demonstrated the use of data parallelism to achieve scalability for up to 365 time steps of one tenth degree POP ocean model, and it now supports some rudimentary time parallelism as illustrated in. We have validated that both time-dependent and time-independent parallelism is applicable to the ParaView demand-driven streaming pipeline. Non-time dependent spatiotemporal parallelism has been implemented and tested in ParaView using jaguarpf reading 365, tenth degree, NetCDF POP ocean files in batch mode. The next step for this capability will be to expose it to end users for the interactive visualization case. This work has moved the production time of a movie for a simulated year (365 time steps) from hours to a couple of minutes. We are working with the data-set owners to ensure they can use this capability.
We have demonstrated the time-dependent spatiotemporal parallelism design for Use Case 2 in C++ and VTK. A filter was written to take advantage of the spatiotemporal data partitioning implemented for Use Case 1. Initial results indicate substantial improvements

12
in time to solution, as illustrated in Figure 4, with further improvements to come as the parallel I/O component for this use-case is integrated within VTK.
Figure 4: Overall visualization time as a function of concurrent temporal regions and computational
resources
The current quantities computed are the minimum, maximum, and average values at each grid point. A single pass standard deviation algorithm was tested with temporal statistics, but it exhibited poor numerical stability. The filter provides grid and field information on only the processes assigned to the first-time compartment. The next step will be to implement this capability for ParaView batch processing and then to the interactive case.
3.4 Workflow
vtDV3D is a package of high-level modules for UV-CDAT, the ESG analysis framework, providing user-friendly workflow interfaces (as shown in figure 5) for advanced visualization and analysis of IPCC climate data at a level appropriate for scientists. This project is motivated by the observation that climate scientists can greatly benefit from advanced visualization methods, but they rarely use these tools because the existing interfaces are too complex. vtDV3D’s simple GUI interface (shown in figure 6) is designed for busy scientists, who have little time to invest in learning complex new frameworks, to use easily. The application builds on VTK, an open-source, object-oriented library, for visualization and analysis. VTK currently has over a million lines of code and is a de facto standard for the academic, industry, and research visualization communities. The special features of these widgets include these abilities:

13
• Drag slice planes along coordinate axes by default
• Resize and rotate slice planes using key + mouse
• Adjust the scaling of color maps using key + mouse drag
• Get coordinate and variable values using mouse picks
• Adjust the volume render transfer function using key plus mouse drag
• Access custom VisTrails module Graphical User Interfaces (GUIs) for choosing color map, etc
• Significantly simplified workflows (with regards to VTK)
Figure 5: Analysis workflow
Figure 6: NASA ParaView Client Qt desktop application that controls data access, processing,
analysis, and visualization
14
3.5 UV-CDAT Graphical User Interface (GUI)
User interface components have been developed for the key functional areas listed below. Significant progress has been achieved in each component area, and the listed components are included in the first alpha release of the UV-CDAT application. We expect to refine the appearance and behavior of each component as the broader community uses the system. The design goals of the UV-CDAT user interface include exposing the base ESGF system functionality, providing a consistent and intuitive user experience, and supporting a flexible and maintainable framework for future enhancements and revisions. The UV-CDAT GUI includes the following:
• Better integration with VisTrails, UV-CDAT GUI and ParaView
o Improved checking of dependencies
o Improved communication of GUI events between VisTrails and UV-CDAT
• Added support in UV-CDAT for custom plots built using VisTrails workflows only
• CMake build script
• Rest application programmer’s interface (API)
• Grib2 format support and mosaic grid support for CMIP5 use
• Beginnings of ESGF browse/search support for CMIP5 and other project data sets
• Tools to monitor CDAT’s use and install have been implemented; this will give the developers a better idea of exactly how people actively use UV-CDAT
• In progress: actively plugging UV-CDAT into the back-end ESGF product server, called the Live Access Server (LAS); this will give ESGF users the ability to do UV-CDAT analysis and visualization on the sever side where the data is collocated
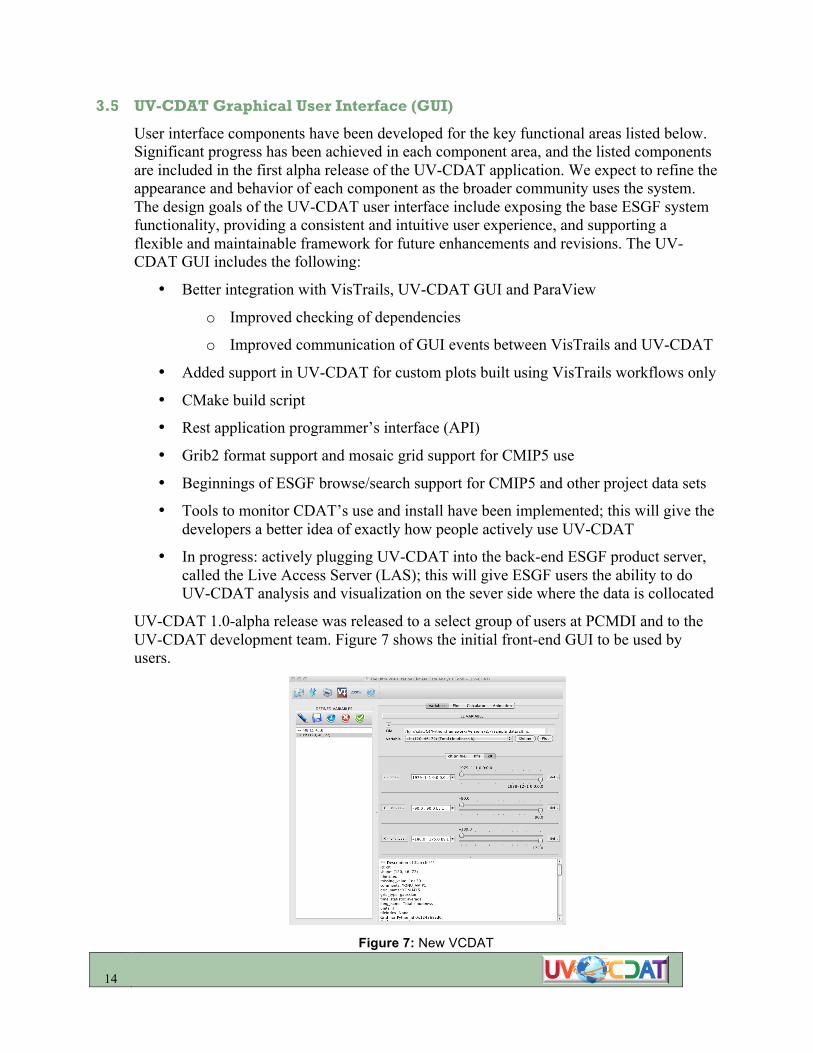
UV-CDAT 1.0-alpha release was released to a select group of users at PCMDI and to the UV-CDAT development team. Figure 7 shows the initial front-end GUI to be used by users.
Figure 7: New VCDAT
15
3.6 UV-CDAT Build Process
The CDAT build is based upon a large number of open-source scientific and rendering software packages. It is distributed as a Python package but has many dependencies on various other libraries written in C, C++, and FORTRAN. Tying all of these dependencies together into a single package poses the difficult challenge of building and installing these packages, each with its own unique build system.
Thus far, the build process for CDAT has been rewritten to employ CMake, a cross- platform build-system generation tool. The goal is to replace the existing top-level autotools build system with CMake. Utilizing CMake as the core build system gives us much more flexibility; CMake is a generic language for describing how to build software then used to generate build-system files for a number of tool chains, particularly makefiles and visual studio projects. Currently our target platforms are Linux and Mac.
Table 1: CDAT builds nearly forty external packages, listed below. wget pkgconfig termcap readline libxml2
libxslt curl xgks ffmpeg zlib
png gifsicle jpeg tiff pbmplus
Tlc/Tk LAPACK/CLAPACK freetype pixman fontconfig
cairo uuid udunits ghostscript HDF5
NetCDF Qt Jasper g2clib Python
setuptools SIP PyQt PyOpenGL Numpy
Pmw CMOR
The CMake language brings several powerful features to the table. CMake has an extensive syntax set for creating and evaluating options, which can be used to provide users with an easy way to manipulate, build options, and locate build settings. This is further augmented by using CMake user interfaces cmake-gui and ccmake.
Another feature we have used extensively in rewriting CDAT’s build system is CMake’s ability to perform system introspection to locate dependencies in standard locations and interrogate other packing information systems such as pkg-config. CMake also has a rich set of find modules, each customized to locate various libraries and packages across different platforms, of which we take advantage in CDAT’s build system.
Using information interrogated from the system and allowing the user to have some level of control over what gets built allows us to provide customized versions of CDAT. For example, one could build CDAT on Jaguar to use some of its I/O libraries but not need any GUI or visualization components. Using options we provide to users through the CMake interface, we can give them the most flexibility.
Another way we take advantage of this flexibility is to optionally let CDAT build some of the components while also using system libraries. This is particularly beneficial when making use of a system installed with Qt, for example. Qt in particular can take hours to

16
build, so it is definitely of great benefit to be able to use system versions of libraries when possible.
On the flipside, we also provide a single option to have CDAT build all of its dependencies and use nothing from the system. This is particularly advantageous when troubleshooting conflicts that arise from mixing system and CDAT built libraries.
The build system has been implemented and is currently undergoing extensive testing by several members of the CDAT on various computers with different configurations.
4 UV-CDAT Group Meetings
The UV-CDAT executive committee holds occasional conference calls each month. These meetings discuss priorities and issues that make up the agendas for project meetings held via teleconference every other Tuesday at 10:00 a.m. Pacific. At the project meetings, the entire team discusses project goals, design and development issues, technology, timelines, and milestones.
Given the need for more in-depth conversations and examination of work requirements, a face-to-face meeting will be held during the next reporting period. This UV-CDAT all-hands meeting will be scheduled sometime in the fall. The project meeting will be a three-day gathering focused on the needs of BER and the work to be accomplished to meet our milestones. It will be held at LLNL, NYU-Poly, University of Utah, or ORNL. From the meeting, we will form necessary collaboration subgroups, user requirements, and project management plans. The meeting will also cover architecture design and set new project timelines and milestones for specified use cases.
In addition to our standing project meeting, other subgroups meet regularly. For example, the Parallel I/O team (ORNL, LANL, Kitware) has established weekly meetings to discuss parallel I/O performance enhancements and other general enhancements to the ParaView/ VTK systems. These meetings are held each Monday at 4 p.m. Eastern.
Besides the UV-CDAT website (http://www.uv-cdat.org), a mailing list has also been established ([email protected]), broadcasting announcements and meetings relevant to the entire project.
5 Collaborations
To effectively build an infrastructure that can accommodate ultra-scale visualization and analysis, we established connections with other BER-funded projects and programs at various meetings and workshops, such as the SciDAC 2011 Conference held in Denver, Colorado. More specifically, UV-CDAT coordination and outreach consists of these activities:
• Managing the international execution of the UV-CDAT activity

17
• Building consensus among modeling groups and arbitrating among various interested groups to maximize scientific value of analysis and visualization
• Providing support services for BER needs and its research and facilitating communication with the modeling groups
• Communicating, interacting with, and responding to scientific groups, government agencies, and a broad range of user groups seeking information about BER analysis and visualization
6 Outreach, Papers, Presentations, and Posters
This section describes the outreach activities for this reporting period in the form of papers published and talks and posters presented.
6.1 Papers
6.1.1 Visualization and Analysis of Eddies in a Global Ocean Simulation
S. Williams, M. Hecht, M. Petersen, R. Strelitz, M. Maltrud, J. Ahrens, M. Hlawitschka, and B. Hamann, 2011. “Visualization and Analysis of Eddies in a Global Ocean Simulation.” Accepted by EuroVis 2011, published in the Computer Graphics Forum, volume 30, number 3.
• Our scientific interest is coherent vortical features in the ocean called mesoscale eddies. We first extract high-vorticity features using a metric from the oceanography community called the Okubo-Weiss parameter. We then use a new circularity criterion to differentiate eddies from other non-eddy features like meanders in strong background currents. From these data, we generate visualizations showing the three-dimensional structure and distribution of ocean eddies.
6.1.2 Adaptive Extraction and Quantification of Discrete Vortices
S Williams, M Petersen, PT Bremer, M Hecht, V Pascucci, J Ahrens, M Hlawitschka, B Hamann, 2011. “Adaptive Extraction and Quantification of Discrete Vortices.” (Conditionally) Accepted by IEEE Vis 2011
• We consider the problem of extracting discrete axis-aligned vortices from a turbulent flow. In our approach, we use a reference model describing the expected physics and geometry of an idealized vortex. The model allows us to derive a novel correlation between the size of the vortex and its strength, measured as the square of its strain minus the square of its vorticity. For vortex detection in real models, we use the strength parameter to locate potential vortex cores, and then measure the similarity of our ideal analytical vortex and the real vortex core for different strength thresholds.

18
Figure 7: After extracting the vortices from 350 time steps of a global Parallel Ocean Program run,
we identify which eddies from adjacent time steps are most likely the same and plot the courses traveled by the 5,000 longest-lived eddies on a world map. Among the plotted eddies, several known real-world eddies appear, particularly the Agulhas Rings traveling from the southern tip of Africa towards Brazil, and a Gulf Ring, traveling west from the center of the Gulf of Mexico.
6.1.3 Separating Signal and Noise in Atmospheric Temperature Changes: The Importance of Timescale
B.D. Santer, C. Mears, C. Doutriaux, P.J. Gleckler, S. Solomon, T.M.L. Wigley, N.P. Gillett, D. Ivanova, T.R. Karl, J.R. Lanzante, G.A. Meehl, P.A. Stott, K.E. Taylor, P.W. Thorne, M.F. Wehner, and F.J. Wentz, 2011. “Separating Signal and Noise in Atmospheric Temperature Changes: The Importance of Timescale.”Submitted to the Journal of Geophysical Research (Atmospheres).
• We compare global-scale changes in satellite estimates of the temperature of the lower troposphere (TLT) with model simulations of forced and unforced TLT changes. While previous work has focused on a single period of record, we select analysis timescales ranging from 10 to 32 years and then compare all possible observed TLT trends on each timescale with corresponding multi-model distributions of forced and unforced trends. We use observed estimates of the signal component of TLT changes and model estimates of climate noise to calculate timescale-dependent signal-to- noise ratios (S/N). These ratios are small (less than 1) on the 10-year timescale, increasing to more than 3.9 for 32-year trends. This large change in S/N is primarily due to a decrease in the amplitude of internally generated variability with increasing trend length. Because of the pronounced effect of interannual noise on decadal trends, a multi-model ensemble of anthropogenically-forced simulations displays many 10-year periods with little warming. A single decade of observational TLT data is therefore inadequate for identifying a slowly-evolving anthropogenic warming signal. Our results show that

19
temperature records of at least 17 years in length are required for identifying human effects on tropospheric temperature.
6.1.4 Calculating synthetic microwave sounder brightness temperatures from discrete level data
C.A. Mears, B.D. Santer, C. Doutriaux, F.J. Wentz, 2011. “Calculating Synthetic Microwave Sounder Brightness Temperatures from Discrete-level Data.” Submitted to the American Meteorological Society.
• Microwave sounders have been measuring the temperature of Earth’s atmosphere since late 1978. These measurements are vertical averages of deep atmospheric layers with weighting functions that extend over many kilometers. Often, scientists wish to compare these deep-layer measurements with other sources of atmospheric temperature data, including in situ measurements made by radiosondes and aircraft, or the output of general circulation models. These data are typically available on a number of discrete levels. To directly compare discrete-level measurements with deep-layer averages, a forward model that describes microwave radiation transfer in the atmosphere, as well as the radiative properties of the material surface is used to compute a synthetic microwave brightness temperature from the available discrete level parameters. The methods typically used vary greatly, from a simple weighting scheme employing fixed weights at each level to a full line-by-line radiative transfer calculation with sophisticated treatment of scattering effects, such as those performed by radiative transfer packages. In this work, we describe two algorithms that are more accurate than the simple weighting scheme, but less computationally intensive than the calculations performed by a complete radiative transfer package. We also investigate the impact of neglecting changes in some nontemperature variables such as sea-ice coverage cloud water content and surface emissivity, as well as the effect of coarse vertical sampling on the synthetic microwave brightness temperatures. The paper methodology will be distributed as part of UV-CDAT.