Ultra-processed foods, diet quality and human health · Ultra-processed foods, diet quality, and...
48
Ultra-processed foods, diet quality, and health using the NOVA classification system Food and Agriculture Organization of the United Nations Rome, 2019 Prepared by Carlos Augusto Monteiro Geoffrey Cannon Mark Lawrence Maria Laura da Costa Louzada and Priscila Pereira Machado
Transcript of Ultra-processed foods, diet quality and human health · Ultra-processed foods, diet quality, and...

Ultra-processed foods, diet quality, and health using the NOVA classification system
Food and Agriculture Organization of the United Nations
Rome, 2019
Prepared by
Carlos Augusto MonteiroGeoffrey Cannon Mark LawrenceMaria Laura da Costa LouzadaandPriscila Pereira Machado

Required citation:
Monteiro, C.A., Cannon, G., Lawrence, M., Costa Louzada, M.L. and Pereira Machado, P. 2019. Ultra-processed foods,diet quality, and health using the NOVA classification system. Rome, FAO.
The designations employed and the presentation of material in this information product do not imply the expression of any opinion
whatsoever on the part of the Food and Agriculture Organization of the United Nations (FAO) concerning the legal or development
status of any country, territory, city or area or of its authorities, or concerning the delimitation of its frontiers or boundaries. The
mention of specific companies or products of manufacturers, whether or not these have been patented, does not imply that these
have been endorsed or recommended by FAO in preference to others of a similar nature that are not mentioned.
The views expressed in this information product are those of the author(s) and do not necessarily reflect the views or policies
of FAO, nor do they constitute a validation of the NOVA classification system.
ISBN 978-92-5-131701-3
© FAO, 2019
Some rights reserved. This work is made available under the Creative Commons Attribution-NonCommercial-ShareAlike 3.0 IGO
licence (CC BY-NC-SA 3.0 IGO; https://creativecommons.org/licenses/by-nc-sa/3.0/igo/legalcode).
Under the terms of this licence, this work may be copied, redistributed and adapted for non-commercial purposes, provided that
the work is appropriately cited. In any use of this work, there should be no suggestion that FAO endorses any specific organization,
products or services. The use of the FAO logo is not permitted. If the work is adapted, then it must be licensed under the same
or equivalent Creative Commons licence. If a translation of this work is created, it must include the following disclaimer along with
the required citation: “This translation was not created by the Food and Agriculture Organization of the United Nations (FAO).
FAO is not responsible for the content or accuracy of this translation. The original [Language] edition shall be the authoritative
edition.”
Disputes arising under the licence that cannot be settled amicably will be resolved by mediation and arbitration as described in
Article 8 of the licence except as otherwise provided herein. The applicable mediation rules will be the mediation rules of the
World Intellectual Property Organization http://www.wipo.int/amc/en/mediation/rules and any arbitration will be conducted in
accordance with the Arbitration Rules of the United Nations Commission on International Trade Law (UNCITRAL).
Third-party materials. Users wishing to reuse material from this work that is attributed to a third party, such as tables, figures or
images, are responsible for determining whether permission is needed for that reuse and for obtaining permission from the
copyright holder. The risk of claims resulting from infringement of any third-party-owned component in the work rests solely with
the user.
Sales, rights and licensing. FAO information products are available on the FAO website (www.fao.org/publications) and can be
purchased through [email protected]. Requests for commercial use should be submitted via: www.fao.org/contact-
us/licence-request. Queries regarding rights and licensing should be submitted to: [email protected].

Ultra-processed foods, diet quality, and health using the NOVA classification system
Page 1 of 44
Contents
Acknowledgements 2
SECTION 1
Introduction 3
SECTION 2
The NOVA food classification system and its four food groups 6
SECTION 3
Ultra-processed foods and the nutritional quality of national diets 13
SECTION 4
Ultra-processed foods and the risk of non-communicable diseases 22
SECTION 5
Conclusions and implications 33
References 38
Annex 1 44

Page 2 of 44
Ultra-processed foods, diet quality, and health using the NOVA classification system
Acknowledgements
The report Ultra-processed foods, diet quality, and health using the NOVA classification system was prepared by Carlos Augusto Monteiro, Geoffrey Cannon, Mark Lawrence, Maria Laura da Costa Louzada, and Priscila Pereira Machado.

Ultra-processed foods, diet quality, and health using the NOVA classification system
Page 3 of 44
SECTION 1
Introduction
The significance of industrial processing, and in particular techniques and ingredients developed or created by modern food science and technology, on the nature of food and on the state of human health, is generally understated. This is evident in international and national policies and strategies designed to improve population nutrition and health, in dietary recommendations, and in public policies and actions guided by such recommendations. Until recently it has also been neglected in epidemiological and experimental studies concerning diet, nutrition and health.
The nature of processing
Reports issued by UN agencies and other authoritative organisations (WHO, 2003; WCRF, 2007) list a number of commonly consumed processed foods and drinks as certainly or probably implicated in obesity and various chronic non-communicable diseases. These include energy-dense food products, “fast foods”, “convenience foods”, soft drinks, sugary drinks, various refined starchy foods, processed meat and salt-preserved foods. But such reports stop short of examining the common factors in these foods – the nature, extent and purpose of the processes used to make them.
National dietary guidelines issued by governments of almost all countries, now with some exceptions (Brazilian Ministry of Health, 2014; Ministerio de Salud del Uruguay, 2016; Ministerio de Salud Publica del Equador & FAO 2018; Ministerio de Salud del Perú 2018), do not address how types of processing affect the nature and quality of foods. As one example, both the official US 2010 and the 2015-2020 Dietary Guidelines for Americans reports (USDA/DHSS, 2010; USDA/DHSS, 2015) advise reduced consumption of critical nutrients commonly in excess in processed foods such as free sugars, sodium and trans fats, but overlook the sources of these nutrients.
Also, attention to food additives is almost always confined to important issues of toxicity and other forms of contamination. Little attention is given to the equally important issue of adulteration, including the use of cosmetic food additives (notably, flavours, colours, and emulsifiers) used to make combinations of ingredients such as cheap processed oils, refined sugars and starches, with sodium, palatable and attractive.
The relative neglect of food processing is historically understandable. When dietary guidelines were first compiled and published in the first half of the last century, most food was combined with culinary ingredients and consumed in the form of dishes and meals, or was eaten as such.
But beginning in the second half of the century, branded, ready to eat, to drink or to heat ‘fast’ or ‘convenient’ packaged products became increasingly prominent in food supplies, and displaced long established dietary patterns based on minimally processed foods and freshly prepared dishes and meals.
Processing in itself is not the issue
Food processing in itself is not the issue. One obvious reason is that nowadays, practically all food is processed in some sense and in some way. The term ‘processing’ (like the term

Page 4 of 44
Ultra-processed foods, diet quality, and health using the NOVA classification system
‘industry’) is very general and therefore not helpful, and so judgements of foods simply because they are ‘processed’ are not meaningful. Further, attempts to distinguish between different types of processing by using undefined terms such as ‘fast’, ‘convenience’, or ‘junk’ food, cannot be the basis of scientific assessment (Monteiro, 2009).
Food scientists and technologists and food manufacturers are right to emphasize the benefits of originally ancient and also relatively novel processes such as drying, non-alcoholic fermentation, chilling and freezing, pasteurization, and vacuum-packing. But on the other hand, just to take two examples, evidence on the harm done by partial hydrogenation of oils is now conclusive, and on sugaring, notably in the manufacture of soft drinks (or ‘soda’), is very strong (de Souza et al., 2015; WHO, 2015).
Food processing and its effects on human health can be assessed and made the basis of guidelines and thus public policies and actions only when analysis is discriminating and precise, with terms defined, and the nature, purpose, extent and effects of processing identified and distinguished.
Acknowledging that ‘the over-reliance on processed foods, especially energy-dense foods high in sugar, fat and salt, is gradually displacing home-prepared meals and the consumption of fresh fruit and vegetables in typical diets’, FAO has published a technical report to provide guidance to countries and researchers on how to incorporate the collection of information on processed foods into their food consumption surveys (FAO, 2015). In this guidance report, two examples of food classifications based on food processing were described, one developed as part of EPIC (the European Prospective Investigation into Cancer and Nutrition) (Slimani, et al., 2009) and NOVA, a food classification system developed by researchers at the University of Sao Paulo, Brazil (Monteiro et al., 2010).
The EPIC and NOVA systems, together with other three alternatives of food classifications based on food processing (González-Castell, et al., 2007; Asfaw, 2011; Eicher-Miller, et al., 2012) were compared and reviewed elsewhere (Moubarac et al, 2014). A variant of NOVA was later proposed (Poti et al., 2015). Annex 1 lists the six existing food classifications that take into account food processing, with references that describe their methodologies and their use.1
The NOVA food classification system with its identification and definition of ultra-processed foods is the one that by far has been most applied in the scientific literature (Lawrence & Baker, 2019).
1 This report is on Ultra-processed foods, diet quality and health. Ultra-processed foods is a concept and a term only used by the NOVA food system classification and therefore the report focuses on NOVA
classification only.

Ultra-processed foods, diet quality, and health using the NOVA classification system
Page 5 of 44
NOVA classifies all foods into four groups (Monteiro et al., 2017a). One of these, termed ultra-processed foods, is made up of snacks, drinks, ready meals and many other product types formulated mostly or entirely from substances extracted from foods or derived from food constituents. Ultra-processed foods are made possible by use of many types of additive, including those that imitate or enhance the sensory qualities of foods or culinary preparations made from foods.
The processes and the ingredients used in the manufacture of ultra-processed foods make them highly convenient (ready-to-consume, almost imperishable) and highly attractive (hyper-palatable) for consumers, and highly profitable (low cost ingredients, long shelf-life) for their manufacturers.
But these processes and ingredients also make ultra-processed foods typically nutritionally unbalanced and liable to be over-consumed and to displace all three other NOVA food groups, all of which include foods processed in some form. These are unprocessed or minimally processed foods, processed culinary ingredients, and processed foods (Monteiro et al., 2017a). These other food groups are the basis of long-established dietary patterns, including those known to promote long and healthy lives (Sho, 2001; Sofi, et al., 2010; Jung et al., 2014).
The convenience and attractiveness of ultra-processed foods as defined by NOVA and their aggressive marketing, are among the reasons why they now amount to around or even more than half of the total dietary energy consumed in high-income countries with less established dietary patterns based on freshly prepared meals such as the United States of America (Baraldi et al., 2018), Canada (Moubarac, et al., 2017), the United Kingdom of Great Britain and Northern Island (Rauber, et al., 2018), and Australia (Machado, et al.,2019). Their sales in middle-income countries, including those whose cultures based on freshly prepared meals have so far survived, are growing very fast, up to ten percent per year (Monteiro et al., 2013).
The next section of this report describes in detail the NOVA food classification system and its four food groups, and provides a practical guide to identify ultra-processed foods. Subsequent sections list and examine the peer-reviewed literature on the impact of ultra-processed foods for the nutritional quality of overall diets, and for health and disease. Research and policy implications of the evidence described in these sections are discussed in the final section.

Page 6 of 44
Ultra-processed foods, diet quality, and health using the NOVA classification system
SECTION 2
The NOVA food classification system and its four food groups
The NOVA classification system groups all foods according to the nature, extent and purposes of the industrial processes they undergo. These involve physical, biological and chemical techniques used after foods are separated from nature, and before they are consumed or else made into dishes and meals.
Some foods may be consumed by themselves (examples are fruit, nuts, and milk). Others are usually consumed as all or part of prepared dishes and meals (examples are grains, vegetables, meat, and eggs). Others are food products used in making dishes and meals (examples are oils, butter, sugar, and salt). Or else they are food products manufactured so as to be ready to eat, drink or heat (examples are breads, cheeses, ham, packaged snacks, soft drinks, and pre-prepared dishes).
NOVA classifies all foods and food products into four groups. See table 1, below, for more details and lists of foods and food products in each of the four groups.
A description of the four NOVA food groups and a practical guide to identify ultra-processed foods follows, adapted from Monteiro, et al., 2017a and Monteiro, et al., 2019.
|GROUP 1 |
Unprocessed and minimally processed foods
Unprocessed (or natural) foods are the edible parts of plants (such as fruit, leaves, stems, seeds, roots) or from animals (such as muscle, offal, eggs, milk), and also fungi, algae and water, after separation from nature. See table 1, below.
Minimally processed foods are natural foods altered by methods that include removal of inedible or unwanted parts, and also processes that include drying, crushing, grinding, powdering, fractioning, filtering, roasting, boiling, non-alcoholic fermentation, pasteurization, chilling, freezing, placing in containers, and vacuum packaging. The distinction between unprocessed and minimally processed foods is not especially significant.
These methods and processes are designed to preserve natural foods, to make them suitable for storage, or else to make them safe or edible or more pleasant to consume. Many unprocessed or minimally processed foods are prepared and cooked as dishes or meals in kitchens at home or in restaurants or canteens in combination with processed culinary ingredients and sometimes with some processed foods.
Unprocessed and minimally processed foods vary in energy density and in their content and balance of fats, carbohydrates, proteins, and their fractions, and in vitamins, minerals and other bioactive compounds. No single type of food can provide human beings with all necessary energy and essential nutrients in adequate balance, except for breastmilk in the first six months of life.

Ultra-processed foods, diet quality, and health using the NOVA classification system
Page 7 of 44
Thus in general, animal foods are good sources of various amino acids, vitamins and minerals, but contain little or no dietary fibre. Quite often they are energy-dense and high in unhealthy types of fat. Plant foods are usually low in energy density and good sources of dietary fibre. Many are high in various micronutrients and bioactive compounds, and some are good sources of amino acids.
This is why the human species has evolved as omnivorous. It explains why a great variety of traditional and long established food systems have been developed that have in common, the combination of plant foods with complementary nutrient profiles, such as grains (cereals) with legumes (pulses), or roots with legumes, or grains with vegetables, and usually with modest amounts of animal foods.
In appropriate variety and combinations, all foods in this group are the basis for healthy diets.
|GROUP 2| Processed culinary ingredients
Processed culinary ingredients include oils, butter, lard, sugar and salt. See Table 1, below.
These are substances derived from group 1 foods or else from nature by processes such as pressing, refining, grinding, milling, and drying. Some methods used to make processed culinary ingredients are originally ancient. But now they usually are industrial products, designed to make durable products suitable for use in home, restaurant and canteen kitchens to prepare, season and cook freshly prepared dishes and meals.
In isolation, processed culinary ingredients are unbalanced, being depleted in some or most nutrients. Other than salt, they are also energy-dense, at 400 or 900 kilocalories per 100 grams. This is around 3-6 times more than cooked grains and around 10-20 times more than cooked vegetables.
But the key point here is that they are rarely if ever consumed by themselves. They are used in combination with foods to make palatable, diverse, nourishing and enjoyable meals and dishes such as stews, soups and broths, salads, breads, preserves, drinks, and desserts. Thus, oils are used in the cooking of grains (cereals), vegetables and legumes (pulses), and meat, and are added to salads. Table sugar is used to prepare fruit- or milk-based desserts. It is misleading to assess their nutritional significance in isolation. They should always be assessed in combination with foods.
Many culinary ingredients are cheap, and can be over-used. When used carefully and in small amounts, they result in delicious dishes and meals that are nutritionally balanced, with energy densities much lower than those of most ready-to-consume food products.
|GROUP 3| Processed foods
These include canned or bottled vegetables or legumes (pulses) preserved in brine; whole fruit preserved in syrup; tinned fish preserved in oil; some types of processed animal foods such as ham, bacon, pastrami, and smoked fish; most freshly baked breads; and simple cheeses to which salt is added. See Table 1, below.
They are made by adding salt, oil, sugar or other substances from group 2 to group 1 foods. Processes include various preservation or cooking methods, and with breads and cheeses,

Page 8 of 44
Ultra-processed foods, diet quality, and health using the NOVA classification system
non-alcoholic fermentation.
Processing here increases the durability of group 1 foods, or modifies or enhances their sensory qualities. Most processed foods have two or three ingredients, and are recognisable as modified versions of group 1 foods. They are generally produced to be consumed as part of meals or dishes, and also may be consumed by themselves as snacks. Most are highly palatable.
As with culinary ingredients, some methods used to make processed food products are originally ancient, and can be and are still used domestically or artisanally. But now almost all are manufactured industrially. Processes include canning and bottling using oils, sugars or salt; and methods of preservation such as salting, salt-pickling, smoking, and curing. The ingredients infiltrate the foods and so the processes alter their nature.
Processed food products usually retain the basic identity and most constituents of the original food. But when excessive oil, sugar or salt are added, they become nutritionally unbalanced. Except for canned vegetables, their energy density ranges from moderate (around 150-250 kilocalories per 100 grams for most processed meats), to high (around 300-400 kilocalories per 100 grams for most cheeses).
Like processed culinary ingredients, they can be over-used. When used sparingly, and in the case of processed meats also only occasionally, they also result in delicious dishes and meals that are nutritionally balanced, also with energy densities lower than those of most ready-to-consume food products.
|GROUP 4| Ultra-processed foods
Ultra-processed foods are formulations of ingredients, mostly of exclusive industrial use, typically created by series of industrial techniques and processes (hence ‘ultra-processed’).
Some common ultra-processed products are carbonated soft drinks; sweet, fatty or salty packaged snacks; candies (confectionery); mass produced packaged breads and buns, cookies (biscuits), pastries, cakes and cake mixes; margarine and other spreads; sweetened breakfast ‘cereals’ and fruit yoghurt and ‘energy’ drinks; pre-prepared meat, cheese, pasta and pizza dishes; poultry and fish ‘nuggets’ and ‘sticks’; sausages, burgers, hot dogs and other reconstituted meat products; powdered and packaged ‘instant’ soups, noodles and desserts; baby formula; and many other types of product. See table 1, below.
Processes enabling the manufacture of ultra-processed foods involve several steps and different industries. It starts with the fractioning of whole foods into substances including sugars, oils and fats, proteins, starches and fibre. These substances are often obtained from a few high-yield plant foods (such as corn, wheat, soya, cane or beet) and from puréeing or grinding animal carcasses, usually from intensive livestock farming.
Some of these substances are then submitted to hydrolysis, or hydrogenation, or other chemical modifications. Subsequent processes involve the assembly of unmodified and modified food substances with little if any whole food using industrial techniques such as extrusion, moulding and pre-frying. Colours, flavours, emulsifiers and other additives are frequently added to make the final product palatable or hyper-palatable. Sophisticated and attractive packaging is used, usually made of synthetic materials.

Ultra-processed foods, diet quality, and health using the NOVA classification system
Page 9 of 44
Sugar, oils and fats, and salt, used to make processed foods, are often ingredients of ultra-processed foods, commonly in combination. Additives that prolong product duration, protect original properties, and prevent proliferation of micro-organisms may be used in both processed and ultra-processed foods, as well as in processed culinary ingredients, and, infrequently, in minimally processed foods.
Ingredients characteristic of ultra-processed foods are either food substances of no or rare culinary use, or else classes of additives whose function is to make the final product sellable, palatable and often hyper-palatable.
Food substances of no or rare culinary use, employed in the manufacture of ultra-processed foods, include varieties of sugars (fructose, high-fructose corn syrup, ‘fruit juice concentrates’, invert sugar, maltodextrin, dextrose, lactose), modified oils (hydrogenated or interesterified oils) and sources of protein (hydrolysed proteins, soya protein isolate, gluten, casein, whey protein, and ‘mechanically separated meat’).
Classes of additives used only in the manufacture of ultra-processed foods, are flavours, flavour enhancers, colours, emulsifiers, emulsifying salts, artificial sweeteners, thickeners, and foaming, anti-foaming, bulking, carbonating, gelling and glazing agents. All of them, most notably flavours and colours, either disguise unpleasant sensory properties created by ingredients, processes or packaging used in the manufacture of ultra-processed foods, or give the final product intense sensory properties especially attractive to see, taste, smell and/or touch, or both.
Processes and ingredients used for the manufacture of ultra-processed foods are designed to create highly profitable products (low-cost ingredients, long shelf-life, powerfully branded). Their convenience (imperishable, ready-to-consume), hyper-palatability, and ownership by transnational corporations using pervasive advertising and promotion, give ultra-processed foods enormous market advantages. They are therefore liable to displace all other NOVA food groups, and to replace freshly made regular meals and dishes, with snacking any time, anywhere.
Not all ultra-processed foods are recent or new. The first such products created and, enabled by mass industrialisation, some commonly consumed for generations, include packaged cookies (biscuits), preserves (jams); sauces, meat, yeast and other extracts; ice-cream, chocolates, packaged candies (confectionery); margarines; and infant formulas.
Some of what are now ultra-processed foods were originally manufactured only with group 1 foods and salt or sugar or other substances from group 2, and thus would be classed in NOVA group 3 as processed foods. But as now formulated most of them are ultra-processed. Examples are commercially wrapped breads, packaged cakes and pies, and pre-prepared animal products such as hot dogs and burgers. Packaged ready-to-heat products consumed at home or at fast food outlets such as meat, cheese, pizza and pasta dishes, and French fries (chips) may look much the same as home-cooked food, but their formulations and the ingredients used in their pre-preparation render them ultra-processed.
Identifying ultra-processed foods
Food manufacturers do not have to state on food labels the processes used in their products, and even less the purposes of these processes. Sometimes this can make it difficult to identify ultra-processed foods with confidence.

Page 10 of 44
Ultra-processed foods, diet quality, and health using the NOVA classification system
There is of course no need to examine every food to know whether or not it is ultra-processed. Fresh vegetables, fruit, roots and tubers are obviously not ultra-processed; nor for instance are pasteurized milk and chilled meat. Plant oils, sugar and salt used as culinary preparations are also not ultra-processed.
It is however not always immediately clear when some specific food products are ultra-processed or not. Examples include breads and breakfast cereals. Here the solution is to examine the ingredients labels that by law must be included on pre-packaged food and drink products.
Industrial breads made only from wheat flour, water, salt and yeast are processed foods, while those whose lists of ingredients also include emulsifiers or colours are ultra-processed. Plain steel-cut oats, plain corn flakes and shredded wheat are minimally processed foods, while the same foods are processed when they also contain sugar, and ultra-processed if they also contain flavours or colours.
Generally, the practical way to identify if a product is ultra-processed is to check to see if its list of ingredients contains at least one item characteristic of the ultra-processed food group. These are either food substances never or rarely used in kitchens, or classes of additives whose function is to make the final product palatable or more appealing.
Food substances not used in kitchens appear in the beginning or in the middle of the lists of ingredients of ultra-processed foods. These include hydrolysed proteins, soya protein isolate, gluten, casein, whey protein, ‘mechanically separated meat’, fructose, high-fructose corn syrup, ‘fruit juice concentrate’, invert sugar, maltodextrin, dextrose, lactose, soluble or insoluble fibre, hydrogenated or interesterified oil. The presence in the list of ingredients of one or more of these food substances identifies a product as ultra-processed.
Classes of additive exclusively used in ultra-processed foods are at the end of lists of ingredients, together with other additives. These include flavours, flavour enhancers, colours, emulsifiers, emulsifying salts, artificial sweeteners, thickeners, and anti-foaming, bulking, carbonating, foaming, gelling and glazing agents. Any example of these classes of additive, as shown on ingredients lists also identifies a product as ultra-processed.
Information in ingredients labels is not fully standardized in all countries. But some of the most frequently used classes of additives such as flavours, flavour enhancers, colours and emulsifiers are usually easy to identify. They may be expressed as a class, such as flavourings or natural flavours or artificial flavours; or their names are followed by their class, such as ‘monosodium glutamate (flavour enhancer)’, or ‘caramel colour’, or ‘soya lecithin as emulsifier’. Other classes of additives commonly used in the manufacture of ultra-processed foods include sweeteners like aspartame, cyclamate or compounds derived from stevia. The UN Codex Alimentarius provides a regularly updated list of additives with their functional classes (FAO & WHO, 2017) and an online search facility (FAO & WHO, n.d.).
The next section of this report summarises the evidence linking the consumption of ultra-processed foods with the nutritional quality of diets.

Ultra-processed foods, diet quality, and health using the NOVA classification system
Page 11 of 44
TABLE 1. THE NOVA FOOD CLASSIFICATION SYSTEM AND ITS FOUR GROUPS DEFINED ACCORDING TO THE EXTENT AND PURPOSE OF FOOD PROCESSING
NOVA GROUP DEFINITION EXAMPLES
|GROUP 1| Unprocessed or minimally processed foods
Unprocessed
Edible parts of plants (fruit, seeds, leaves, stems, roots, tubers) or of or from animals (muscle, fat, offal, eggs, milk), and also fungi, algae, all after separation from nature. Spring and tap water.
Minimally processed
Unprocessed foods altered by industrial processes such as removal of inedible or unwanted parts, drying, powdering, squeezing, crushing, grinding, fractioning, steaming, poaching, boiling, roasting, and pasteurization, chilling, freezing, placing in containers, vacuum packaging, non-alcoholic fermentation, and other methods that do not add salt, sugar, oils or fats or other food substances to the original food.
The main aim of these processes is to extend the life of unprocessed foods, enabling their storage for longer use, or to make them edible, and, often, to make their preparation easier or more diverse.
Infrequently, minimally processed foods contain additives that prolong product duration, protect original properties or prevent proliferation of microorganisms.
Fresh, squeezed, chilled, frozen, or dried fruit and leafy and root vegetables; grains such as brown, parboiled or white rice, corn cob or kernel, wheat berry or grain; legumes such as beans, lentils, and chickpeas; starchy roots and tubers such as potatoes, sweet potatoes and cassava; fungi such as fresh or dried mushrooms; meat, poultry, fish and seafood, whole or in the form of steaks, fillets and other cuts; fresh, powdered, chilled or frozen eggs; fresh, powdered or pasteurized milk; fresh or pasteurized fruit or vegetable juices (with no added sugar, sweeteners or flavours); grits, flakes or flour made from corn, wheat, oats, or cassava; tree and ground nuts and other oily seeds (with no added salt or sugar); herbs and spices used in culinary preparations, such as thyme, oregano, mint, pepper, cloves and cinnamon, whole or powdered, fresh or dried; fresh or pasteurized plain yoghurt; tea, coffee, and drinking water.
Also includes foods made up from two or more items in this group, such as dried mixed fruits, granola made from cereals, nuts and dried fruit with no added sugar, honey or oil; pasta, couscous and polenta made with flours, flakes or grits and water; and foods with vitamins and minerals added generally to replace nutrients lost during processing, such as wheat or corn flour fortified with iron and folic acid.
|GROUP 2|
Processed culinary ingredients
Substances obtained directly from group 1 foods or from nature by industrial processes such as pressing, centrifuging, refining, extracting or mining.
Used to prepare, season and cook group 1 foods. May contain additives that prolong product duration, protect original properties or prevent proliferation of microorganisms.
Vegetable oils crushed from seeds, nuts or fruit (notably olives); butter and lard obtained from milk and pork; sugar and molasses obtained from cane or beet; honey extracted from combs and syrup from maple trees; starches extracted from corn and other plants; vegetable oils with added anti-oxidants; salt mined or from seawater, and table salt with added drying agents.
Also includes products consisting of group 2 items, such as salted butter, and group 2 items with added vitamins or minerals, such as iodised salt.
Cont.

Page 12 of 44
Ultra-processed foods, diet quality, and health using the NOVA classification system
TABLE 1. Cont.
NOVA GROUP DEFINITION EXAMPLES
|GROUP 3|
Processed foods
Products made by adding salt, oil, sugar or other group 2 ingredients to group 1 foods, using preservation methods such as canning and bottling, and, in the case of breads and cheeses, using non-alcoholic fermentation.
Processes and ingredients here are designed to increase the durability of group 1 foods and make them more enjoyable by modifying or enhancing their sensory qualities. They may contain additives that prolong product duration, protect original properties, or prevent proliferation of microorganisms.
Canned or bottled vegetables and legumes in brine; salted or sugared nuts and seeds; salted, dried, cured, or smoked meats and fish; canned fish (with or without added preservatives); fruit in syrup (with or without added anti-oxidants); freshly made unpackaged breads and cheeses.
|GROUP 4|
Ultra-processed foods
Formulations of ingredients, mostly of exclusive industrial use, made by a series of industrial processes, many requiring sophisticated equipment and technology (hence ‘ultra-processed’). Processes used to make ultra-processed foods include the fractioning of whole foods into substances, chemical modifications of these substances, assembly of unmodified and modified food substances using industrial techniques such as extrusion, moulding and pre-frying; use of additives at various stages of manufacture whose functions include making the final product palatable or hyper-palatable; and sophisticated packaging, usually with plastic and other synthetic materials. Ingredients include sugar, oils or fats, or salt, generally in combination, and substances that are sources of energy and nutrients that are of no or rare culinary use such as high fructose corn syrup, hydrogenated or interesterified oils, and protein isolates; classes of additives whose function is to make the final product palatable or more appealing such as flavours, flavour enhancers, colours, emulsifiers, and sweeteners, thickeners, and anti-foaming, bulking, carbonating, foaming, gelling, and glazing agents; and additives that prolong product duration, protect original properties or prevent proliferation of microorganisms.
Processes and ingredients used to manufacture ultra-processed foods are designed to create highly profitable products (low-cost ingredients, long shelf-life, emphatic branding), convenient (ready-to-consume) hyper-palatable products liable to displace freshly prepared dishes and meals made from all other NOVA food groups.
Adapted from Monteiro et al., 2017a.
Many ready-to-consume products such as carbonated soft drinks; sweet or savoury packaged snacks; chocolate, candies (confectionery); ice-cream; mass-produced packaged breads and buns; margarines and other spreads; cookies (biscuits), pastries, cakes, and cake mixes; breakfast ‘cereals’, ‘cereal’ and ‘energy’ bars; ‘energy’ drinks; milk drinks, ‘fruit’ yoghurts and ‘fruit’ drinks; ‘cocoa’ drinks; ‘instant’ sauces.
Many pre-prepared ready-to-heat products including pies and pasta and pizza dishes; poultry and fish ‘nuggets’ and ‘sticks’, sausages, burgers, hot dogs, and other reconstituted meat products; and powdered and packaged ‘instant’ soups, noodles and desserts.
Infant formulas, follow-on milks, other baby products; ‘health’ and ‘slimming’ products such as meal replacement shakes and powders.

Ultra-processed foods, diet quality, and health using the NOVA classification system
Page 13 of 44
SECTION 3
Ultra-processed foods and the nutritional quality of national diets
Since the NOVA food classification system with its concept of ultra-processed foods was first proposed in 2009, many studies have evaluated the impact of these foods on the nutritional quality of national diets.
The main focus of these studies has been on the dietary content of nutrients associated with non-communicable diseases (NCDs) including both NCD-promoting nutrients, such as free or added sugars, sodium, saturated and trans fats, and also high dietary energy density, and NCD-protective nutrients, such as protein and fibre.
Earlier studies were based on analyses of nationally-representative data sets provided by household budget surveys while more recent studies relied mostly on national dietary surveys.
Studies using national household budget surveys
Table 2 lists the four peer-reviewed articles that have examined at national level the influence of ultra-processed foods on the nutritional quality of total household food purchases. They are listed in ascendant order according to the year of publication, with information on the studied population, year of the survey, sample size, purpose of the study and main findings.
Findings reported by the articles refer to studies on data collected by nationally- representative household surveys in Brazil (2002/3), Canada (2001), Chile (2006/7), and Spain (1990, 2000 and 2010).
The studies in Brazil and Chile assessed the nutrient profile of total household food purchases in each country and then compared the nutrient profile of two purchase shares: one made up of only ultra-processed foods and the other restricted to non-ultra-processed foods. In both countries, the ultra-processed share (or the ‘average’ ultra-processed food) was shown to be significantly higher in NCD-promoting nutrients (free/added sugars, sodium) and in energy density, and lower in NCD-protective nutrients (protein and fibre) than the non-ultra-processed share (or the ‘average’ non-ultra-processed food). In Brazil, the ‘average’ ultra-processed food had also a higher content of NCD-promoting saturated fat.
The study in Canada assessed at individual level the association between household ultra-processed food purchases and the nutrient profile of total food purchases. Increases in household ultra-processed food purchases were significantly associated with total food purchases higher in NCD-promoting nutrients (free sugars and sodium) and in energy density, and lower in NCD-protecting nutrients (protein and fibre).
The study in Spain was focused on the relationship between ultra-processed food purchases and the content of NCD-promoting added sugar in total food purchases. In 1990, in 2000 and in 2010, increases in the ultra-processed food purchases were shown to be significantly associated with total food purchases higher in added sugar, and with the frequency of excessive added sugar content (≥ten percent of total energy).

Page 14 of 44
Ultra-processed foods, diet quality, and health using the NOVA classification system
The national household ultra-processed food purchases in Spain increased across the surveys (from 11.0 percent of total energy in 1990 to 24.6 percent in 2000 and to 31.7 percent in 2010) in parallel with increases in their content of added sugar (from 8.4 percent of total energy in 1990, to 11.2 percent in 2000 and to 13.0 percent in 2010).
Studies using national dietary surveys
Table 3 lists the fifteen peer-reviewed articles that evaluated at national level, the association between the dietary share of ultra-processed foods and the nutritional quality of overall diets. Articles are listed in ascendant order according to the year of publication, with information on the studied population, year of the survey, sample size, dietary outcomes, control variables and main findings.
Findings reported by the articles refer to studies on data collected by nationally-representative 24-hour recall/record food intake surveys undertaken between 2004 and 2014 in ten countries: the US (four studies), the UK (two studies), Chile (two studies), Brazil, Canada, Belgium, Colombia, Australia, Mexico, and Taiwan. Most studies included all age-groups except infants and toddlers. One study (the one in Taiwan) was restricted to adolescents.
All studies focused on the relationship between the dietary share of ultra-processed foods and the dietary content of nutrients associated with non-communicable diseases (NCDs). Some of them enlarged the list of NCD-protective nutrients, adding potassium and phytoestrogens. Four studies included a range of micronutrients other than sodium and potassium, some of them commonly associated with undernutrition and micronutrient deficiencies, such as iron, zinc and vitamin A. Finally, two studies examined the association between the dietary share of ultra-processed foods and the overall quality of diets measured through nutrient-based dietary patterns that considered the dietary content of a large range of macro and micronutrients. All studies adjusted estimates of the association between the dietary share of ultra-processed foods and indicators of the quality of the overall diet for demographic and socioeconomic variables.
Ultra-processed food intake and dietary content of NCD-promoting nutrients
Free or added sugar
Significant, direct, dose-response associations between the dietary share of ultra-processed foods and the dietary content of free/added sugar or the probability of excessive free/added sugar intakes (≥10 percent of total energy intake) were shown in all eight countries where these associations were studied (USA, Brazil, UK, Chile, Canada, Colombia, Australia, and Mexico).
For instance, the mean dietary content of free sugar in the Mexican diet ranged from 7.4 percent of total energy intake in the lower quintile of ultra-processed food intake to 17.5 percent in the upper quintile. In the US, the upper quintile of ultra-processed food intake showed three times as many individuals with excessive added sugar intake compared to the lower quintile (82.1 percent and 26.4 percent, respectively).
Saturated and trans fats
Significant, direct, dose-response associations between the dietary share of ultra-processed foods and the dietary content of saturated fat or the probability of excessive saturated fat intakes (≥ten percent of total energy intake) were found in all the ten countries.

Ultra-processed foods, diet quality, and health using the NOVA classification system
Page 15 of 44
For instance, the mean dietary content of saturated fat in the Colombian diet increased from 7.3 percent of total energy intake in the lower quintile of ultra-processed intake to 10.4 percent in the upper quintile. In Chile, the upper quintile of ultra-processed food intake showed 2.2 times as many individuals with excessive saturated fat intake compared to the lower quintile (47.8 percent and 21.7 percent, respectively).
The association between the intake of ultra-processed foods and the dietary content of trans fats was only studied in Brazil, Chile and Australia. In these three countries there was a significant, direct, dose-response association between the dietary share of ultra-processed foods and the dietary content of trans fats or the probability of excessive trans fat intakes (≥1 percent of total energy intake).
For instance, the mean dietary content of trans fats in the Brazilian diet increased from 0.8 percent of total energy intake in the lower quintile of ultra-processed intake to 1.9 percent in the upper quintile. In Chile, the upper quintile of ultra-processed food intake showed seven times as many individuals with excessive trans fat intake compared to the lower quintile (0.9 percent and 6.6 percent, respectively).
Sodium
Significant, direct, dose-response associations between the dietary share of ultra-processed foods and the dietary content of sodium or the probability of excessive intakes (≥2 000 mg/ 2 000 kcal) were found in the UK, Australia, and Belgium.
For instance, the mean dietary content of sodium in the Australian diet increased from 2 106 mg/2 000 kcal in the lower quintile of ultra-processed intake to 2 768 mg/2 000 kcal in the upper quintile. In the UK, the upper quintile of ultra-processed food intake showed 1.6 times as many individuals with excessive sodium intake (2 000 mg/2 000 kcal) compared to the lower quintile (86.7 percent and 55.8 percent, respectively).
The studies undertaken in Taiwan, Colombia, Brazil and Mexico did not consider the content of sodium in the assessment of the dietary nutrient profile, while in studies in Chile, US and Canada there were no significant associations between ultra-processed food intake and dietary sodium content.
Energy density
Significant, direct, dose-response associations between the dietary share of ultra-processed foods and energy density of diets were found in all five countries where these associations were studied (Australia, Canada, Chile, Colombia, and Mexico).
For instance, the mean energy density of the solid fraction of the Canadian diet increased from 1.9 kcal/g in the lower quintile of ultra-processed intake to 3.2 kcal/g in the upper quintile. In Chile there was a significant direct association between the dietary share of ultra-processed foods and the energy density of drinks (from 0.17 kcal/ml in the lower quintile of ultra-processed food intake to 0.33 kcal/ml in the upper quintile). In Australia, the proportion of people with dietary energy density above the recommendation (≥2.25kcal/g) increased from 2 percent to 25 percent, from the lower to the upper quintile of ultra-processed food intake.
Ultra-processed food intake and dietary content of NCD-protective nutrients
Protein
Significant, inverse, dose-response associations between the dietary share of ultra-processed

Page 16 of 44
Ultra-processed foods, diet quality, and health using the NOVA classification system
foods and the dietary content of protein were found in all countries, except in Belgium and Australia where this association was not investigated. Furthermore, in the US, one direct association between the dietary share of ultra-processed foods and the total energy intake was documented, partially mediated by the lower protein content of ultra-processed foods.
Fibre
Significant, inverse, dose-response associations between the dietary share of ultra-processed foods and the dietary content of fibre or the probability of insufficient intakes (<25g/2 000 kcal) were found in all eight countries where these associations were studied (US, Brazil, UK, Canada, Chile, Colombia, Australia, and Mexico).
For instance, the dietary content of fibre in the Colombian diet decreased from 25.6 g/2 000 kcal in the lower quintile of ultra-processed intake to 17.2 g/2 000 kcal in the upper quintile. In Chile, the upper quintile of ultra-processed food intake showed twice as many individuals with insufficient fibre intake compared to the lower quintile (86.3 percent and 46.9 percent, respectively).
Potassium
Significant, inverse, dose-response associations between the dietary share of ultra-processed foods and the dietary content of potassium or the probability of insufficient intakes (≤3 510 mg/2 000 kcal) were found in all seven countries where these associations were studied (US, Brazil, Canada, Chile, UK, Australia, and Taiwan).
For instance, the dietary content of potassium in the Taiwanese diet decreased from 2 178 mg/2 000 kcal in the lower quintile of ultra-processed intake to 1 810 mg/2 000 kcal in the upper quintile. In the UK, the upper quintile of ultra-processed food intake showed 1.6 times as many people with insufficient potassium intake compared to the lower quintile (92.3 percent and 56.1 percent, respectively). In Chile there was a significant direct association between the dietary share of ultra-processed foods and sodium/potassium ratio.
Phytoestrogens
A significant, inverse, dose-response association between the dietary share of ultra-processed foods and a biomarker of the intake of NCD-protective phytoestrogens, the urinary concentration of these food compounds, was found in one study undertaken in the USA.
Ultra-processed food intake and the general dietary content of micronutrients
The association between the intake of ultra-processed foods and the dietary content of micronutrients other than sodium and potassium was studied in four countries.
Significant, inverse, dose-response associations between the dietary share of ultra-processed foods and the mean dietary content of several micronutrients were found in the US (vitamins A, C, D and E, and calcium, magnesium, phosphorus and zinc), in Brazil (vitamins D, E, B12, niacin, pyridoxine, and copper, iron, magnesium, phosphorus, selenium and zinc), in Canada (vitamins A, C, D, E, B12, niacin, thiamine, riboflavin, and calcium, iron, magnesium, phosphorus and zinc) and in Taiwan (vitamins A, C, D, B6, niacin, thiamine, magnesium, calcium and iron). Only in Brazil, increases in the dietary share of ultra-processed foods were positively related with increases in the dietary content of calcium.

Ultra-processed foods, diet quality, and health using the NOVA classification system
Page 17 of 44
Ultra-processed food intake and nutrient-based dietary patterns
The association between the intake of ultra-processed foods and nutrient-based dietary patterns was studied in the US and in Brazil.
In the US, there was a significant dose-response inverse association between the dietary share of ultra-processed foods and a ‘healthy’ dietary pattern, richer in fibre, potassium, magnesium and vitamin C, with less added sugar and saturated fat.
In Brazil, there was a significant dose-response inverse association between the dietary share of ultra-processed foods and a ‘healthy’ dietary pattern, richer in protein and micronutrients, with less free sugars. A significant dose-response direct association was found with an ‘unhealthy’ dietary pattern with more total, saturated and trans fats, and less fibre.
In sum, the evidence from analyses of nationally-representative data sets collected in 11 countries from 2001 to 2015 shows that the displacement of non-ultra-processed by ultra-processed foods is consistently associated with an overall deterioration of the nutritional quality of diets.
This has several important implications for public health including a clear potential to increase the risk of several non-communicable diseases. This potential will be assessed in the next section of this report with examination of the peer-reviewed literature on the association between the dietary share of ultra-processed foods and the risk of these diseases.

Page 18 of 44
Ultra-processed foods, diet quality, and health using the NOVA classification system
TABLE 2. PEER-REVIEWED LITERATURE ON HOUSEHOLD ULTRA-PROCESSED FOOD PURCHASES AND THE NUTRIENT PROFILE OF TOTAL FOOD PURCHASES (2011-2018)*
AUTHOR AND YEAR STUDIED POPULATION PURPOSE OF THE STUDY
MAIN FINDINGS
Monteiro et al., 2011 Brazilian households in 11 metropolitan regions in 2002/3 (n=13 848)
To compare the nutrient profile of purchased ultra- processed and non-ultra-processed foods
Compared to non-ultra-processed foods, ultra- processed foods had higher energy density, higher content of added sugar, saturated fat, and sodium, and lower content of fibre.
Moubarac et al., 2013 Canadian households in 2001 (n=5 643)
To assess the association between purchase of ultra-processed foods and the nutrient profile of total food purchases
Increases in the purchase share of ultra-processed foods were significantly associated with total food purchases higher in energy density, free sugar and sodium, and lower in fibre and protein.
Crovetto et al., 2014 Chilean households in 2006/7 (n= 10 096)
To compare the nutrient profile of purchased ultra-processed and non-ultra-processed foods
Compared to non-ultra-processed foods, ultra-processed foods had higher energy density, free sugar and sodium, and lower in fibre and protein.
Latasa et al., 2018 Spanish households in 1990, 2000 and 2010 (n=2 012; 33 730; and 22 116, respectively)
To assess the association between purchase of ultra-processed foods and the content of added sugar in total food purchases
In each of the three surveys, increases in the purchase share of ultra-processed foods were associated with total food purchases higher in added sugar and more likely to exceed the upper limit of ten percent of total energy. Across the surveys, there were parallel increases in the purchase share of ultra-processed foods and in the content of added sugar in total food purchases.
*Including only nationally-representative studies.

Ultra-processed foods, diet quality, and health using the NOVA classification system
Page 19 of 44
TABLE 3. PEER-REVIEWED LITERATURE ON ULTRA-PROCESSED FOOD INTAKE AND THE NUTRIENT PROFILE OF THE OVERALL DIET (2015-2019)*
AUTHOR AND YEAR
STUDIED POPULATION
DIETARY OUTCOMES
CONTROL VARIABLES
MAIN FINDINGS
Adams & White, 2015
UK adult population in 2008-12 (n=2 174)
Protein, carbohydrate, fat, saturated fat, free sugar, sodium and fibre
Gender, occupational social class, age and percentage of energy from alcohol.
Increases in the dietary share of ultra-processed foods were associated with diets higher in free sugar, saturated fat and sodium, and lower in fibre and protein.
Steele et al., 2016
US population aged 1 year or older in 2009-2010 (n=9 317)
Added sugar Age, sex, race/ethnicity, family income, and educational attainment.
Increases in the dietary share of ultra-processed foods were associated with diets higher in added sugar. The upper quintile of ultra-processed consumption showed three times as many individuals with excessive added sugar intake (≥ten percent of total energy intake) compared to the lower quintile.
Moubarac et al., 2017
Canadian population aged 2 years or older in 2004 (n= 33 694)
Energy density, protein, free sugar, saturated fat, sodium, potassium, calcium, zinc, iron, magnesium, phosphorus, vitamins A, B6, B12, C, D, thiamine, riboflavin, niacin, fibre
Age, sex, educational attainment, relative family revenue.
Increases in the dietary share of ultra-processed foods were associated with diets with higher in energy density, free sugars and saturated fat, and lower in protein, fibre, vitamins A, C, D, B6 and B12, niacin, thiamine, riboflavin, zinc, iron, magnesium, calcium, phosphorus and potassium.
Steele et al., 2017a
US population aged 1 year or older in 2009-2010 (n=9 317)
Protein, carbohydrates, added sugars, fats, saturated fats, sodium, vitamins A, C, D, and E, iron, zinc, potassium, phosphorus, magnesium, calcium, and fibre
Age, sex, race/ethnicity, family income, and educational attainment
Increases in the dietary share of ultra-processed foods were associated with diets higher in added sugar and saturated fat, and lower in protein, fibre, vitamins A, C, D, and E, zinc, potassium, phosphorus, magnesium, and calcium. An inverse dose–response association was found between the dietary share of ultra-processed foods and the overall dietary quality measured through a nutrient balanced-pattern PCA-derived factor score characterized by being richer in fibre, potassium, magnesium and vitamin C, and having less saturated fat and added sugars.
Louzada et al., 2017
Brazilian population aged 10 years or older in 2008/9 (n=32 898)
Protein, carbohydrate, free sugar, total, saturated and trans fat, fibre, vitamins A, B6, B12, C, D and E, niacin, riboflavin, thiamine, zinc, iron, magnesium, manganese, copper, selenium, phosphorus, calcium and potassium
Age, sex, ethnicity, per capita household income, region, urban/rural status, and education.
Increases in the dietary share of ultra-processed foods were associated with diets lower in protein, fibre, vitamins D, E, B6 and B12, niacin, zinc, iron, magnesium, copper, selenium, phosphorus and potassium, and higher in free sugars, and total, saturated and trans fats. Quintiles of the dietary share of ultra-processed food were inversely associated with two healthy nutrient-based dietary patterns derived from principal component analyses (one richer in protein and micronutrients, and poorer in free sugars, and the second richer in vitamins), and directly associated with a unhealthy pattern richer in total, saturated and trans fats, and having less dietary fibre.
Cont.

Page 20 of 44
Ultra-processed foods, diet quality, and health using the NOVA classification system
TABLE 3. Cont.
AUTHOR AND YEAR
STUDIED POPULATION
DIETARY OUTCOMES
CONTROL VARIABLES
MAIN FINDINGS
Steele et al., 2017b
US population aged 6 years or older in 2009-2010 (n=2 692)
Phytoestrogens Age, sex, race/ethnicity, family income, education, BMI, physical activity, smoking status, normalized by creatinine, and difference between recommended and actual energy intake.
Increases in the dietary share of ultra-processed foods were associated with diets with higher urinary concentrations (a proxy for the diet content) of enterodiol and enterolactone.
Steele et al., 2017c
US population aged 2 years or older in 2009-2010 (n=9 042)
Protein and energy intake
Age and gender strata corresponding to those used to define energy and protein requirements, race/ethnicity, family, income, education.
The dietary share of ultra-processed foods was inversely related to the relative diet content in protein and positively related with total energy intake. Due to the increase in total energy intake with the increase in ultra-processed food intake, the absolute protein intake remained relatively constant across quintiles.
Cediel et al., 2017
Chilean population aged 2 years or older in 2010 (n=4 920)
Added sugar Age, urban/rural residence, geographic region, family income.
Increases in the dietary share of ultra-processed foods were associated with diets higher in added sugar. The upper quintile of ultra-processed consumption showed three times as many individuals with excessive added sugar intake (≥ten percent of total energy intake) compared to the lower quintile.
Rauber et al., 2018
UK population aged 1.5 year or older in 2008-2014 (n=9 364)
Protein, carbohydrate, free sugar, saturated fat, fibre, sodium, and potassium
Age, sex, ethnicity, and income
Increases in the dietary share or ultra-processed foods were associated with diets higher in free sugars and saturated fat, and lower in fibre, protein and potassium. The prevalence of people exceeding the upper limits recommended for free sugars and sodium increased by 85 percent and 55 percent, respectively, from the lowest to the highest ultra-processed food quintile.
Vandevijvere et al., 2018
Belgian population aged from 3 to 64 years in 2014/5 (n=3 146)
Sodium, saturated fat and trans fat
Age and sex Increases in the dietary share of ultra-processed foods were associated with higher risk of diets with excessive content in sodium and saturated fat.
Cont.

Ultra-processed foods, diet quality, and health using the NOVA classification system
Page 21 of 44
TABLE 3. Cont.
AUTHOR AND YEAR
STUDIED POPULATION
DIETARY OUTCOMES
CONTROL VARIABLES
MAIN FINDINGS
Chen et al., 2018
Taiwanese adolescents aged 16-18 years in 2011 (1 274)
Protein, carbohydrate, total, saturated, monounsaturated and polyunsaturated fats, vitamins A, E, D, B1, B2, B6, B2, niacin, potassium, magnesium, calcium, iron and dietary quality evaluated with the Youth Healthy Eating Index–Taiwan
Gender, grade, locality, major caregivers, household income, household expenditure, mother’s education, smoking, alcohol drinking, and BMI, percentages of energy intake in unprocessed and minimally processed foods, processed foods and total energy intake.
Increases in the energy intake of ultra-processed foods were associated with diets higher in saturated fat, and lower in protein, vitamins A, C, D, B1, and B6, niacin, potassium, magnesium, calcium, and iron as well as with an increased risk of poor dietary quality (ten percent increase in ultra-processed food intake=OR:1.33; CI 95 percent 1.16 to 1.52).
Parra et al., 2019
Colombian population aged from 1 to 64 years in 2005 (n=38 643)
Energy density, protein, free sugar, saturated fat, and fibre
Age, sex, zone and regions of residency, socioeconomic status and education
Increases in the dietary share of ultra-processed foods were associated with diets higher in energy density, free sugars, and saturated fat, and lower in protein and fibre.
Machado et al., 2019
Australian population aged 2 years or older in 2011-2012 (n=12 153)
Energy density, free sugar, saturated and trans fats, fibre, sodium, and potassium
Age, sex, educational attainment, socio-economic status and geographical location
Increases in the dietary share of ultra-processed foods were associated with higher energy density, free sugars, sodium, and saturated and trans fats, and lower in fibre and potassium. The prevalence of non-recommended intake levels of all studied nutrients increased linearly across quintiles of ultra-processed food intake, notably from 22 percent to 82 percent for free sugars, from 6 percent to 11 percent for trans-fat, and from 2 percent to 25 percent for dietary energy density, from the lowest to the highest ultra-processed food quintile.
Marrón-Ponce et al., 2019
Mexican population aged 1 year and older in 2012 (n= 10 087)
Energy density, protein, added sugar, saturated fat, and fibre
Age, residence area, region, socioeconomic status, education
Increases in the dietary share of ultra-processed foods were associated with diets higher in energy density, added sugars and saturated fat, and lower in protein and fibre.
Cediel et al., 2019
Chilean population aged 2 years or older in 2010 (n=4 920)
Energy density, free sugar, saturated and trans fats, fibre, sodium, and potassium
Age, urban/rural residence, geographic region, family income.
Increases in the dietary share of ultra-processed foods were associated with diets higher in energy density, free sugars, saturated and trans fats, and sodium/potassium ratio, and lower in fibre and potassium.
*Including only nationally-representative studies.

Page 22 of 44
Ultra-processed foods, diet quality, and health using the NOVA classification system
SECTION 4
Ultra-processed foods and the risk of non-communicable diseases
This section evaluates the peer-reviewed literature on the association between the dietary share of ultra-processed foods and the risk of various diet-related non-communicable diseases (NCDs).
Table 3 lists twenty-six peer-reviewed articles examining the association between ultra-processed food exposures and NCDs outcomes, most of them (22 out of 26) undertaken in adults. These articles are restricted to those that reported findings from ecological studies where countries were the unit of analysis, cross-sectional studies based on nationwide population samples, and any cohort study or randomized controlled trial. Articles are listed in ascendant order according to the year of publication, with information on the studied population, year of the survey, sample size, study design, exposure, NCD outcomes, control variables and main findings.
In the ecological studies, the exposure to ultra-processed foods was measured either by the share of ultra-processed foods in national household food purchases or by annual changes in national per capita sales of ultra-processed foods while the dietary content of ultra-processed foods was used in the individual-based studies.
Studied NCD outcomes included obesity and related factors (values of or changes in weight, body mass index, waist circumference, skinfolds, percentage of body fat); cardiovascular health (hypertension, dyslipidaemia, metabolic syndrome, and cardiovascular diseases - overall, coronary heart diseases and cerebrovascular disease); cancer (overall, breast, prostate, and colorectal cancer); depression; asthma and wheezing; gastrointestinal disorders, frailty syndrome, and also all-cause, cardiovascular, and cancer mortality.
All observational studies adjusted their estimates on the association between ultra-processed food exposure and NCD outcomes for several potential confounders, in most studies for more than ten. These include various demographic and socioeconomic variables (all studies), physical activity (except the two studies on young children and the study on the frailty syndrome, where physical activity is part of the outcome), smoking (except one study with adolescents) and variables on health antecedents related to the outcome.
A synthesis follows of the findings reported by the four studies undertaken in children and adolescents and the twenty-two studies in adults.
Children and adolescents
Following the selection criteria above, two studies on ultra-processed food consumption and NCD outcomes among children were found, and two among adolescents, all in Brazil.
The two studies on children were based on a follow-up for four years of a small cohort of 3-4 year-old children of low socioeconomic status. After adjustment for potential confounders, they found that ultra-processed food intake at preschool age was positively associated with increases from preschool to school age in cholesterol and LDL cholesterol, and in waist circumference.

Ultra-processed foods, diet quality, and health using the NOVA classification system
Page 23 of 44
One of the studies among adolescents examined a large nationally-representative sample of Brazilian 9th graders. After adjustment for potential confounders, it found a cross-sectional positive dose-response association between a score of ultra-processed food consumption and self-reported occurrence of asthma and wheezing.
The other study among adolescents followed for three years a cohort of students enrolled in the 1st year of high school in six schools in the metropolitan area of Rio de Janeiro. After adjustment for potential confounders, it did not find any association between consumption of ultra-processed foods and trajectories of body mass index and percentage of body fat mass.
Adults
The twenty-two studies on ultra-processed food exposures and NCD outcomes among adults include ecological studies, national cross-sectional studies, longitudinal studies and one randomized controlled trial. One ecological study involved nineteen European countries, and the other eighty countries from different world regions. National cross-sectional studies were undertaken in the US (two studies), France (two studies), Brazil, Canada and the UK. Longitudinal studies were based on the follow-up of middle-aged or older adults in Spain (the SUN project study, and the SENIOR-Enrica study); of adults in France (the French NutriNet-Santé study), of adults or pregnant women in the US (the NHANES III follow-up study, and the St. Louis Women’s Health Center study), and of adults in Brazil (the ELSA cohort study). The randomized controlled cross-over trial was undertaken by the US National Institutes of Health (NIH) with participants recruited in the United States.
A synthesis follows of the main findings of these studies grouped according to the studied NCD outcome.
Obesity
The association between ultra-processed food exposures and obesity or obesity-related outcomes among adults was examined by the two ecological studies, by five national cross-sectional studies (Brazil, the US, France, Canada and the UK), and by three longitudinal studies (the SUN project study, the St. Louis Women’s Health Center study, and the ELSA cohort study). After adjustment for potential confounders, significant positive associations were shown in the two ecological studies, in four of the five national cross-sectional studies, and in the three cohort studies.
The NIH randomized controlled trial has confirmed the association between ultra-processed food exposure and obesity-related outcomes. It shows that when exposed to ad libitum ultra-processed diets (81.3 percent of total energy from ultra-processed foods) participants consumed on average 508 kcal more per day than when exposed to ad libitum diets with no ultra-processed foods, and that at the end of two weeks participants increased 0.9 kg consuming the ultra-processed diet and decreased 0.9 kg consuming the non-ultra-processed diet. The ultra-processed and the non-ultra-processed diets offered to participants were matched for total energy, energy density, macronutrients, sugar, sodium and fibre.
Significant direct dose-response associations between the dietary share of ultra-processed foods and obesity after adjusting for potential confounders were found in still unpublished cross-sectional studies undertaken on representative samples of the adult population of Australia (Priscila Machado, personal communication) and of the UK (Fernanda Rauber, personal communication).

Page 24 of 44
Ultra-processed foods, diet quality, and health using the NOVA classification system
Cardiovascular and metabolic diseases
Studies on the association between the intake of ultra-processed foods and cardiovascular, and metabolic diseases include one national cross-sectional study on metabolic syndrome undertaken in the US adult population, one longitudinal study on hypertension from the Navarra SUN cohort, and another longitudinal study on coronary heart diseases, cerebrovascular diseases and all cardiovascular diseases from the French NutriNet cohort. After adjustment for potential confounders, the three studies found significant positive dose-response associations between the dietary share of ultra-processed foods and all studied cardiovascular health outcomes. The associations found in the French NutriNet cohort remained significant after control for saturated fat, sodium and sugar intakes.
One new longitudinal study from the NutriNet-Santé cohort, still unpublished, found significant direct dose-response associations between the dietary share of ultra-processed foods and the incidence of type 2 diabetes even with the control for saturated fat, sodium, sugar and fibre intakes (Bernard Srour, personal communication).
Cancer
Dietary share of ultra-processed foods and incidence of cancer was examined in the French NutriNet-Santé study. After adjustment for potential confounders, significant direct associations were found for overall and breast cancer (but not for prostate and colorectal cancer). This association remained significant after control for total fat, sodium and carbohydrate intake.
Depression
Association between the intake of ultra-processed foods and the incidence of depression was examined in the French NutriNet-Santé study, and also the SUN Navarra cohort study. After adjustment for potential confounders, significant direct dose-response associations between the dietary share of ultra-processed foods and incidence of depression were shown in both studies. In the French study, the association remained significant after control for total fat, sodium, and carbohydrate intakes.
Gastrointestinal disorders
The cross-sectional association between the intake of ultra-processed foods and gastrointestinal disorders was investigated in the French NutriNet-Santé study. After control for potential confounders, a direct dose-response association was found between the dietary share of ultra-processed foods and the risk of irritable bowel syndrome and functional dyspepsia.
Frailty
The longitudinal association between the intake of ultra-processed foods and incidence of the frailty syndrome (or presence of three or more of the following five phenotypic criteria: exhaustion after small efforts, muscle weakness, low physical activity, slow walking speed, and unintentional weight loss) was investigated in the Seniors-ENRICA cohort study. After control for potential confounders, a direct dose-response association was found between the dietary share of ultra-processed foods and the risk of frailty syndrome.

Ultra-processed foods, diet quality, and health using the NOVA classification system
Page 25 of 44
Mortality
The association between the intake of ultra-processed foods and all-cause mortality was investigated by three cohort studies the NHANES III follow-up, the SUN project and the French NutriNet-Santé. After adjustment for potential confounders, the three studies all found significant direct dose-response associations between the dietary share of ultra-processed foods and death risk due to all causes. Probably due to lack of statistical power, no significant association was found for disease-specific mortality including cardiovascular mortality (investigated by the NHANES III follow study and the SUN project study) and cancer mortality (investigated only by the SUN project study).
In sum, consistent evidence accumulated by studies with different design, undertaken in a great number of countries, shows that the displacement of non-ultra-processed by ultra-processed foods increases the risk of obesity and several other diet-related non-communicable diseases, and also premature mortality.
Ultra-processed foods, diet quality and health using the NOVA classification system
Page 26 of 444
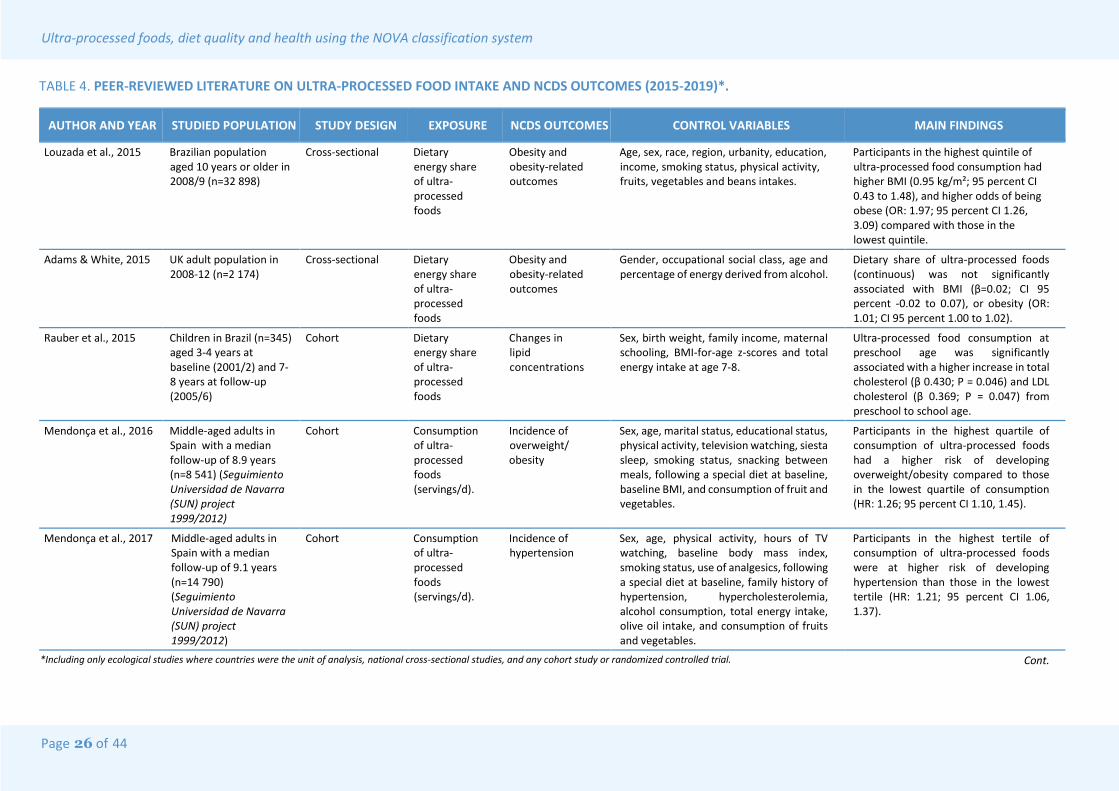
TABLE 4. PEER-REVIEWED LITERATURE ON ULTRA-PROCESSED FOOD INTAKE AND NCDS OUTCOMES (2015-2019)*.
AUTHOR AND YEAR STUDIED POPULATION STUDY DESIGN EXPOSURE NCDS OUTCOMES CONTROL VARIABLES MAIN FINDINGS
Louzada et al., 2015 Brazilian population aged 10 years or older in 2008/9 (n=32 898)
Cross-sectional Dietary energy share of ultra-processed foods
Obesity and obesity-related outcomes
Age, sex, race, region, urbanity, education, income, smoking status, physical activity, fruits, vegetables and beans intakes.
Participants in the highest quintile of ultra-processed food consumption had higher BMI (0.95 kg/m²; 95 percent CI 0.43 to 1.48), and higher odds of being obese (OR: 1.97; 95 percent CI 1.26, 3.09) compared with those in the lowest quintile.
Adams & White, 2015 UK adult population in 2008-12 (n=2 174)
Cross-sectional Dietary energy share of ultra-processed foods
Obesity and obesity-related outcomes
Gender, occupational social class, age and percentage of energy derived from alcohol.
Dietary share of ultra-processed foods (continuous) was not significantly associated with BMI (β=0.02; CI 95 percent -0.02 to 0.07), or obesity (OR: 1.01; CI 95 percent 1.00 to 1.02).
Rauber et al., 2015 Children in Brazil (n=345) aged 3-4 years at baseline (2001/2) and 7-8 years at follow-up (2005/6)
Cohort Dietary energy share of ultra-processed foods
Changes in lipid concentrations
Sex, birth weight, family income, maternal schooling, BMI-for-age z-scores and total energy intake at age 7-8.
Ultra-processed food consumption at preschool age was significantly associated with a higher increase in total cholesterol (β 0.430; P = 0.046) and LDL cholesterol (β 0.369; P = 0.047) from preschool to school age.
Mendonça et al., 2016 Middle-aged adults in Spain with a median follow-up of 8.9 years (n=8 541) (Seguimiento Universidad de Navarra (SUN) project 1999/2012)
Cohort Consumption of ultra-processed foods (servings/d).
Incidence of overweight/ obesity
Sex, age, marital status, educational status, physical activity, television watching, siesta sleep, smoking status, snacking between meals, following a special diet at baseline, baseline BMI, and consumption of fruit and vegetables.
Participants in the highest quartile of consumption of ultra-processed foods had a higher risk of developing overweight/obesity compared to those in the lowest quartile of consumption (HR: 1.26; 95 percent CI 1.10, 1.45).
Mendonça et al., 2017 Middle-aged adults in Spain with a median follow-up of 9.1 years (n=14 790) (Seguimiento Universidad de Navarra (SUN) project 1999/2012)
Cohort Consumption of ultra-processed foods (servings/d).
Incidence of hypertension
Sex, age, physical activity, hours of TV watching, baseline body mass index, smoking status, use of analgesics, following a special diet at baseline, family history of hypertension, hypercholesterolemia, alcohol consumption, total energy intake, olive oil intake, and consumption of fruits and vegetables.
Participants in the highest tertile of consumption of ultra-processed foods were at higher risk of developing hypertension than those in the lowest tertile (HR: 1.21; 95 percent CI 1.06, 1.37).
*Including only ecological studies where countries were the unit of analysis, national cross-sectional studies, and any cohort study or randomized controlled trial. Cont.

Ultra-processed foods, diet quality and health using the NOVA classification system
Page 27 of 44
44
TABLE 4. Cont.
AUTHOR AND YEAR STUDIED POPULATION STUDY DESIGN EXPOSURE NCDS OUTCOMES CONTROL VARIABLES MAIN FINDINGS
Monteiro et al., 2017b European countries, 1991-2008 (n=19)
Ecological Dietary energy from ultra-processed foods in household food availability
Obesity prevalence among adults
Countries’ GDP per capita, squared GDP per capita, difference in years between the estimates on obesity and availability of ultra-processed foods, measurement method of obesity (self-reported or directly measured), prevalence of physical inactivity and of smoking.
Each percentage point increase in the household availability of ultra-processed foods resulted in an increase of 0.25 (CI 95 percent 0.05 to 0.45) percentage points in obesity prevalence.
Rohatgi et al., 2017 Pregnant adult women followed during pregnancy and their new-borns in the US in 2013/4 (n=45) (St. Louis Women’s Health Center Study)
Cohort Dietary energy share of ultra-processed foods
Gestational weight gain, and new-born skinfolds and body fat percentage
For maternal outcomes: age, race, weight status, socioeconomic status, average daily energy and fat intake, and percent of time spent in moderate physical activity. For neonatal outcomes: those referred maternal variables plus gestational age at which neonatal measurements were taken.
Each percentage point increase in the dietary share of ultra-processed foods was associated with a 1.3 kg (CI 95 percent 0.3 to 2.4) increase in gestational weight, as well as with a 0.22 mm (CI 95 percent 0.005 to 0.4) increase in thigh skinfold, 0.14 (CI 9 percent percent 0.02 to 0.3) mm in subscapular skinfold, and 0.62 (CI 95 percent 0.04 to 1.2) percentage points of total body adiposity in the neonate.
Julia et al., 2018 French adult population in 2009-2014 (n=74 470) (French NutriNet-Santé study)
Cross-sectional Dietary share of ultra-processed foods (g)
Obesity Sex, age, household income, marital status, education, residence (urban/rural), and smoking status.
A higher dietary share of ultra-processed foods was significantly associated with overweight and obesity (P<0.0001)
Juul et al., 2018 US population aged 20-64 years in 2005-2014 (n=15 977)
Cross-sectional Dietary energy share of ultra-processed foods
Obesity and obesity-related outcomes
Age, sex, educational attainment, race/ethnicity, ratio of family income to poverty, marital status, smoking and physical activity level.
Participants in the highest quintile of consumption of ultra-processed foods had higher BMI (1.61 kg/m²; 95 percent CI 1.11 to 2.10) and waist circumference (4.07 cm; 95 percent CI 2.94 to 5.19), and higher odds of having obesity (OR: 1.53; 95 percent CI 1.29, 1.81), excess weight (OR: 1.48; 95 percent CI 1.25 to 1.76), and abdominal obesity (OR: 1.62; 95 percent CI 1.39 to 1.89) compared with those in the lowest quintile.
Cont.

Ultra-processed foods, diet quality and health using the NOVA classification system
Page 28 of 44 44
TABLE 4. Cont.
AUTHOR AND YEAR STUDIED POPULATION STUDY DESIGN EXPOSURE NCDS OUTCOMES CONTROL VARIABLES MAIN FINDINGS
Nardocci et al., 2018 Canadian population aged 18 years or older in 2004 (n=19,363)
Cross-sectional Dietary energy share of ultra-processed foods
Obesity and obesity-related outcomes
Sex, age, education, income, physical activity, smoking status, immigrant status, zone of residence, total energy reporting group, and measurement type (self-reported or directly measured).
A ten-percentage point increase in the relative energy intake from ultra-processed foods increased the odds of being obese (OR: 1.05; 95 percent CI 1.01 to 1.08) or overweight (OR: 1.03; 95 percent CI 1.01 to 1.07). Participants in the highest quintile of consumption of ultra-processed foods had higher odds of being obese (OR: 1.32; 95 percent CI 1.05 to 1.57) compared with those in the lowest quintile.
Melo et al., 2018 Brazilian 9th graders population (median age: 14 y) in 2012 (n=109,104)
Cross-sectional Ultra-processed food intake score.
Asthma and wheezing
Sex, age, mother’s education level, parents as smokers, having smoked in the past 30 days, alcohol consumption in the past 30 days, school type, geographical region, municipality of residence, and physical activity level.
Participants in the highest quintile of ultra-processed food intake score had higher odds of having asthma (OR: 1.27; 95 percent CI 1.15, 1.41) or wheezing (OR: 1.42; 95 percent CI 1.35 to 1.50), compared with those in the lowest quintile.
Fiolet et al., 2018 Adults aged 18 years or older in France with a median follow-up of 5 years (n=104,980) (French NutriNet-Santé study 2009/13)
Cohort Dietary share of ultra-processed foods (g)
Incidence of overall, breast, prostate and colorectal cancer
Age (timescale), sex, energy intake without alcohol, number of 24 hour dietary records, smoking status, educational level, physical activity, height, body mass index, alcohol intake, family history of cancers, and Western dietary pattern; breast cancer models were additionally adjusted for menopausal status, hormonal treatment for menopause, oral contraception, and number of children.
Participants in the highest quartile of consumption of ultra-processed foods had a higher risk of developing overall cancer (1.21; 95 percent CI 1.06 to 1.38) and postmenopausal breast cancer (HR: 1.38; 95 percent CI 1.06 to 1.81). Additional analyses show that these associations remain significant even with adjustment for total fat, sodium and carbohydrate intake.
Cont.

Ultra-processed foods, diet quality and health using the NOVA classification system
Page 29 of 44
44
TABLE 4. Cont.
AUTHOR AND YEAR STUDIED POPULATION STUDY DESIGN EXPOSURE NCDS OUTCOMES CONTROL VARIABLES MAIN FINDINGS
Schnabel et al., 2018 Adults aged 18 years or older in France with a median follow-up of 5 years (n=33,343) (French NutriNet-Santé study 2009/13)
Cross-sectional Dietary share of ultra-processed foods (g)
Functional gastro-intestinal disorders (FGiDs: irritable bowel syndrome, functional constipation, functional diarrhoea, and functional dyspepsia)
Sex, age, income level, education level, marital status, residence, BMI, physical activity, smoking status, energy intake, season of food records, time between food record and FGiDs questionnaire, adherence with national dietary recommendations (index).
Participants in the highest quartile of consumption of ultra-processed foods had a higher risk of irritable bowel syndrome (OR: 1.25; 95 percent CI 1.12 to 1.39) and functional dyspepsia (OR: 1.25; CI 95 percent 1.05 to 1.47).
Cunha et al., 2018 High school students in Brazil with a median follow-up of 3 years (n=1,035) (Adolescent Nutritional Assessment Longitudinal Study - ELANA 2010/12)
Cohort Dietary energy share of ultra-processed foods
BMI and body fat percentage trajectories during follow-up
Age (timescale), type of school, sex, physical activity, and energy intake underreporting.
There was no significant difference in BMI trajectories according to baseline ultra-processed food consumption (p=0.07 for the interaction term between age and quartiles of ultra-processed food consumption). Similar results for body fat percentage trajectories.
Vandevijvere et al., 2019
Countries in the Euromonitor annual food sales database and with NCD-RisC group sex-stratified annual BMI estimates for adults aged ≥18 years in the period 2002-2014 (n=80)
Ecological, longitudinal
Annual changes in national per capita sales of ultra-processed foods
BMI trajectory in the studied period
National per capita income, education, population living in urban areas, mean fruit and vegetable consumption in 2005, the tertile of the mean GINI‐index, and, indirectly, physical activity.
Increases in ultra-processed foods volume sales/capita were significantly and positively associated with population‐level BMI trajectories.
Steele et al., 2019 US adult population aged 20 years or older in 2009-2014 (n=6,385)
Cross-sectional Dietary energy share of ultra-processed foods
Metabolic Syndrome
Age, sex, race/ethnicity, income-to-poverty, educational attainment, smoking status and physical activity level.
Participants in the highest quintile of ultra-processed food consumption had higher odds of having metabolic syndrome (OR: 1.28; 95 percent CI 1.09, 1.50) compared with those in the lowest quintile.
Cont.

Ultra-processed foods, diet quality and health using the NOVA classification system
Page 30 o f 44 44
TABLE 4. Cont.
AUTHOR AND YEAR STUDIED POPULATION STUDY DESIGN EXPOSURE NCDS OUTCOMES CONTROL VARIABLES MAIN FINDINGS
Costa et al., 2019 Children in Brazil (n=307) aged 3-4 years at baseline (2001/2) and 7-8 years at follow-up (2005/6)
Cohort Dietary energy share of ultra-processed foods
Changes in anthropometric and glucose metabolism indicators
Sex, pre-pregnancy BMI, birth weight, breastfeeding, family income, maternal schooling and total screen duration.
Ultra-processed food consumption at preschool age was associated with a significant increase in waist circumference from preschool to school age (β 0.07; P = 0.035), but not with changes in glucose metabolism.
Kim et al., 2019 US adult population aged 20y or older with a median follow-up of 19 years (n= 11,898) (National Health and Nutrition Examination Survey 1988/94)
Cohort Consumption of ultra-processed foods (times/day)
All-cause and cardiovascular disease mortality
Age, sex, race/ethnicity, total energy intake, poverty level, education level, smoking status, physical activity, alcohol intake, BMI, hypertension status, total cholesterol and estimated glomerular filtration rate.
Participants in the highest quartile of frequency of ultra-processed food consumption were at higher risk of all-cause mortality (HR: 1.30; 95 percent CI 1·08, 1·57). No significant association was found for cardiovascular mortality
Schnabel et al., 2019 Adults (≥ 45y old) in France with a median follow-up of 7.1 years (n=44,551) (French NutriNet-Santé study 2009/17)
Cohort Dietary share of ultra-processed foods (g)
All-cause mortality
Sex, age, income level, education level, marital status, residence, BMI, physical activity level, smoking status, energy intake, alcohol intake, season of food records, first-degree family history of cancer or cardiovascular diseases, number of food records, and adherence with national dietary recommendations (index).
Ultra-processed food intake was associated with a higher risk of all-cause mortality (HR for an absolute increment of 10 in the percentage of ultra-processed foods in the diet = 1.14, 95 percent Cl = 1.04 to 1.27).
Rico-Campà et al., 2019 Adults aged 20-91 years in Spain with a median follow-up of 10.4 years (n=19,899) (Seguimiento Universidad de Navarra (SUN) project 1999/2014)
Cohort Quartiles of the energy adjusted ultra-processed food consumption.
All-cause mortality
Age, sex, marital status, baseline body mass index, total energy intake, smoking status, family history of cardiovascular disease, alcohol consumption, cardiovascular disease, cancer, or diabetes at baseline, hypertension at baseline, self-reported hypercholesterolemia at baseline, depression at baseline, educational level, snacking, following a special diet at baseline, physical activity, and lifelong cumulative exposure to smoking.
Participants in the highest quarter of ultra-processed foods consumption were at higher risk of all-cause mortality than those in the lowest quarter (HR 1.62, 95 percent CI 1.13 to 2.33). No significant association was found for cardiovascular and cancer mortality.
Cont.

Ultra-processed foods, diet quality and health using the NOVA classification system
Page 31 of 44
44
TABLE 4. Cont.
AUTHOR AND YEAR STUDIED POPULATION STUDY DESIGN EXPOSURE NCDS OUTCOMES CONTROL VARIABLES MAIN FINDINGS
Srour et al., 2019 Adults (≥18y old) in France with a median follow-up of 5.2 years (n=105,159) (French NutriNet-Santé study 2009/18)
Cohort Dietary share of ultra-processed foods (g)
Incidence of overall cardiovascular diseases and coronary heart, and cerebrovascular diseases
Age (timescale), sex, energy intake, number of 24-hour dietary records, smoking status, educational level, physical activity, body mass index, alcohol intake, and family history of cardiovascular disease, baseline prevalent type 2 diabetes, dyslipidaemia, hypertension, and hypertriglyceridemia as well as treatments for these conditions.
Participants in the highest quarter of ultra-processed foods consumption were at higher risk of overall cardiovascular disease (HR: 1.23, 95 percent CI 1.04 to 1.45) than those in the lowest quarter. Each percentage point increase in the dietary share of ultra-processed foods results in 1.12 (95 percent CI 1.02 to 1.24) higher risk of coronary heart diseases, and 1.11 (95 percent CI 1.01 to 1.21) higher risk of cerebrovascular disease. Additional analyses show persistent significant associations with adjustment for saturated fat, sodium and sugar intake.
Sandoval-Insausti et al., 2019
Adults (≥60y old) in Spain with a median follow-up of 3.5 years (n=1,822) (Seniors-ENRICA – Study on Nutrition and Cardiovascular risk factors, 2008/2012)
Cohort Dietary energy share of ultra-processed foods.
Incidence of frailty
Sex, age, education, marital status, tobacco consumption, former-drinker status, diagnose of chronic respiratory disease, coronary disease, stroke, osteoarthritis/arthritis, cancer, depression requiring treatment, and number of medications used.
Participants in the highest quartile of ultra-processed foods consumption were at higher risk of frailty than those in the lowest quintile (OR: 3.67, 95 percent CI 2.00 to 6.73).
Gómez-Donoso et al., 2019
Middle-aged adults in Spain with a median follow-up of 10.3 years (n=14,907) (Seguimiento Universidad de Navarra (SUN) project 1999/2014)
Cohort Energy-adjusted dietary share of ultra-processed foods (g)
Incidence of depression
Age (timescale), sex, baseline BMI, total energy intake, physical activity, smoking status, marital status, living alone, employment status, working hours per week, health-related career, years of education, adherence to Trichopoulou’s MeDiet Score, and baseline self-perception of competitiveness, anxiety, and dependence levels.
Participants in the highest quartile of ultra-processed foods consumption had a higher risk of developing depression than those in the lowest quartile (HR: 1.33; 95 percent CI 1.07-1.64).
Cont.

Ultra-processed foods, diet quality and health using the NOVA classification system
Page 32 of
TABLE 4. Cont.
AUTHOR AND YEAR STUDIED POPULATION STUDY DESIGN EXPOSURE NCDS OUTCOMES CONTROL VARIABLES MAIN FINDINGS
Adjibade et al., 2019 Adults (≥18y old) in France with a median follow-up of 5.4 years (n=26,730) (French NutriNet-Santé study 2009/18)
Cohort Dietary share of ultra-processed foods (g)
Incidence of depression
Age, sex, BMI, marital status, educational level, occupational categories, household income per consumption unit, residential area, number of 24-h dietary records, inclusion month, energy intake without alcohol, alcohol intake, smoking status, and physical activity.
Participants in the highest quartile of ultra-processed foods consumption had a higher risk of developing depressive symptoms than those in the lowest quartile (HR: 1.30; 95 percent CI 1.15 to 1.47). Additional analyses show that these associations remain significant with adjustment for total fat, sodium and carbohydrate intake, and a diet quality index.
Canhada et al., 2019 Adults (≥35y old) in Brazil with a median follow-up of 3.8 years (Longitudinal Study of Adult Health (ELSA-Brasil).
Cohort Dietary energy share of ultra-processed foods
Changes in anthropometric indicators and incidence of overweight/ obesity
Age, sex, colour/race, income, school achievement, smoking and physical activity
Participants in the highest quartile of consumption of ultra-processed foods had a greater risk of large weight gain (>1.68 kg/year) and waist circumference gain (>2.42 cm/year) (RR: 1.30; 95 percent CI 1.10 to 1.54, and RR: 1.33; 95 percent CI 1.12 to 1.57, respectively), and higher risk of developing overweight/obesity compared to those in the lowest quartile of consumption (HR: 1.29; 95 percent CI 1.08 to 1.53).
Hall et al., 2019 US adult voluntaries with a mean age of 31.2 years (n=20) (NIH study)
In-patient, randomized controlled cross-over trial
Ad libitum offer for two weeks of either ultra-processed diets (83 percent of energy from ultra-processed foods, on average) or diets with no ultra-processed foods
Daily energy intake, and weight and fat mass change
The ultra-processed and the non-ultra-processed diets were matched for presented calories, energy density, macronutrients, sugar, sodium, and fibre
Energy intake was greater during exposure to the ultra-processed diet (508 ± 106 kcal/day). Participants gained, on average, 0.9 ± 0.3 kg during the ultra-processed diet, most being of fat mass. Participants lost, on average, 0.9 ± 0.3 kg during the diet with no ultra-processed foods.
44

Ultra-processed foods, diet quality, and health using the NOVA classification system
Page 33 of 44
SECTION 5
Conclusions and implications
This report has listed and examined the peer-reviewed literature on the effects of ultra-processed foods on both diet quality and health. Papers on the effects on diet quality reported results from nineteen nationally-representative studies. Papers on health outcomes reported results from nine nationwide cross-sectional studies, sixteen longitudinal studies and one randomized controlled trial.
Taken together, the results from the studies on diet quality show significant and graded associations between the dietary share of ultra-processed foods and dietary nutrient profiles prone to non-communicable diseases, including high or excessive content of free or added sugar, saturated and trans fats, and sodium, and also high dietary energy density; and low or insufficient content of protein, fibre and potassium.
Furthermore, the results from the studies on health outcomes show plausible, significant and graded associations between the dietary share of ultra-processed foods and the occurrence or incidence of several non-communicable diseases, including obesity and obesity-related outcomes, cardiovascular and metabolic diseases, breast and all cancers, depression, gastrointestinal disorders, frailty in the elderly, and also premature mortality. In the case of short-term increases in body weight and fat, this is solidly supported by the randomised controlled trial conducted by the US National Institutes of Health (Hall, et al., 2019).
The significance of food processing
The significance of food processing, and in particular of ultra-processed food, is now generally recognized. In May 2019 Francis Collins, director of the US Government National Institutes of Health (NIH), in response to the NIH randomised controlled trial (Hall at al., 2019) stated: “It appears that a good place to start in reaching or maintaining a healthy weight is to work to eliminate or at least reduce ultra-processed foods in your diet in favour of a balanced variety of unprocessed, nutrient-packed foods” (Collins, 2019).
In July 2019 authors from the US National Cancer Institute and the World Cancer Research Fund/American Cancer Research Fund announced that their recommendation to limit consumption of “fast foods” in order to protect against cancer would be changed, “as there is currently no standard way to categorize or define cut-points for it” and instead “our solution was to create an adapted version of the NOVA classification system to create an ‘ultra-processed foods’ (UPFs) variable” (Shams-White, et al., 2019).
Also in July 2019, the Pan American Health Organization of the World Health Organization published Ultra-processed Food and Drink Products in Latin America: Sales, Sources, Nutrient Profiles and Policy Implications. (PAHO, 2019). The report takes into account the present national official dietary guidelines of Brazil (Brazilian Ministry of Health, 2014); Uruguay (Ministerio de Salud del Uruguay, 2016); Ecuador (Ministerio de Salud Pública del Equador & FAO 2018); and Peru (Ministerio de Salud del Perú, 2018), all of which recommend freshly prepared meals and avoidance of ultra-processed foods. In its final section on

Page 34 of 44
Ultra-processed foods, diet quality, and health using the NOVA classification system
‘recommendations’ the report states:
The initiatives to promote healthy eating and healthy nutrition environments alreadyimplemented in some Latin American countries are supported by the analyses,findings and conclusions of this report. Concerted actions led by governments,specific to national circumstances, are needed in all Latin American countries.
To counteract displacement of hand-made dishes made from fresh or minimallyprocessed food by ultra- processed products, established food systems need to bepreserved, family farmers supported, and healthy food preparation and cookingpromoted, including in schools.
Public health policies and market incentives are needed, in order to makeunprocessed and minimally processed food, and freshly prepared dishes and meals,more valued, and more available and affordable. Fresh and minimally processedfoods that are staples in long-established diets, such as grains, roots, tubers, legumesand other plant foods should have generally affordable and stable prices.
Unhealthy products need to be the subject of statutory regulatory measures. Someultra-processed products are shown in this report to be especially problematic. Theseinclude carbonated soft drinks, sweet and savoury snacks, biscuits (cookies),confectionery, and cakes, pastries and desserts.
These 2019 statements follow conclusions published by authoritative bodies in previous years. In September 2016, the Global Panel on Agriculture and Food Systems for Nutrition, an independent expert group one of whose members was José Graziano da Silva, FAO Director-General 2012-2019, published its Foresight report on Food Systems and Diets: Facing the Challenges of the 21st Century (GLOPAN, 2016). This
includes important recommendations and advice for leaders at the most senior levelsin countries and international organizations [and] constitute a stark warning for allcountries... the situation is set to worsen dramatically over the next 20 years aspowerful drivers of change such as population growth, climate change andurbanization converge on food systems… If the direction of current policies remainsthe same, then estimates suggest that by 2030, the number of overweight and obesepeople will have increased from 1.33 billion in 2005 to 3.28 billion, around one thirdof the projected global population. This is a major concern as no country to date hassuccessfully reversed growth in obesity once it has been allowed to develop.
Specific reference is made to production and consumption of ultra-processed food and drink products as a reason for the rise in obesity:
In 2000, sales of ultra-processed foods and beverages in the upper-middle-incomecountries were one third of those in the high-income countries. Fifteen years later,they were more than half… The term ‘ultra-processed’ was coined to refer toindustrial formulations manufactured from substances derived from foods orsynthesized from other organic sources. They typically contain little or no wholefoods, are ready-to-consume or heat up, and are fatty, salty or sugary and depleted indietary fibre, protein, various micronutrients and other bioactive compounds.Examples include: sweet, fatty or salty packaged snack products, ice cream, sugar-sweetened beverages, chocolates, confectionery, French fries, burgers and hot dogs,and poultry and fish nuggets.

Ultra-processed foods, diet quality, and health using the NOVA classification system
Page 35 of 44
The report, which ends with an annex listing all types of ultra-processed food products, goes on to state:
Sales of ultra-processed food and sugar-sweetened beverages are growing. Thisgrowth is almost exclusively found in lower-middle income and upper-middle-incomecountries... Sales of ultra-processed foods in East and South East Asia are expected toapproach those of high-income countries by 2035.
In January 2019, The Lancet published The Global Syndemic of Obesity, Undernutrition, and Climate Change (Swinburn et al., 2019). This was the product of a three-year Lancet project in which 43 authors from a broad range of disciplines from 14 countries were engaged, led by the University of Auckland, the US George Washington University, and the World Obesity Federation. This in effect endorses the WHO/FAO and Foresight reports:
The main reason for the increase in the prevalence of obesity and overweight is theinability of food systems to deliver healthy diets. The consumption of industrializedand processed foods that are high in trans fats, sugar, salt, and chemical additives isgrowing in most countries.... This type of consumption occurs mainly in urban settings and upper-middle income and high-income countries, although the negative impacts of food insecurity on diet quality also exist in low-income, middle-income, and high-income countries alike…
The manufacture of ultra-processed foods and sugary drinks is based on inexpensivecommodity ingredients such as sugar, flours, and oils, often with multiple preservatives,colourings, and flavourings. These products are typically energy-dense and nutrient-poor,and offer excessive amounts of energy, fat, sugar, or sodium. Examples include snackproducts such as chips or crisps, ready-to-eat cereals, sugary drinks, and confectionery.
By design, these products are highly palatable, cheap, ubiquitous, and containpreservatives that offer a long shelf life. These features, combined with aggressiveindustry marketing strategies, contribute to excessive consumption and make theseproducts highly profitable for the food, beverage, and restaurant industry sectors thatare dominant actors in the global food system.
The environmental impact of ultra-processed food is also indicated, with Australia as an example:
In Australia, ultra-processed food consumption is estimated to contribute to morethan a third of the total diet-related environmental effects; 35 percent of water use,39 percent of energy use, 33 percent of carbon dioxide equivalents, and 35 percent ofland use. If dietary trends continue, per-capita greenhouse-gas emissions from emptycalories are estimated to nearly double by 2050. Therefore, reduction of ultra-processed food consumption is a priority for reducing the environmental effects ofthe food system.
Research implications
The evidence presented in sections 3 and 4 of this report shows that ultra-processed food intake is consistently associated with both dietary nutrient profiles prone to NCDs, and increased risk of these diseases. Nonetheless, more research is needed.
More epidemiological research is especially needed on the impact of ultra-processed food

Page 36 of 44
Ultra-processed foods, diet quality, and health using the NOVA classification system
intake on the health and well-being of infants, children and adolescents including its effects on both diet-related chronic NCDs and also on undernutrition and micronutrient deficiencies.
More cohort studies on obesity, diabetes, cardiovascular diseases, various types of cancer and other diseases will enable meta-analyses of their association with ultra-processed food intake and estimation of disease-specific pooled relative risks. Ideally, ethics permitting, more randomized controlled trials should assess the impact of ultra-processed foods on energy intake, weight increase and other disease biomarkers.
A review of animal studies on the effects of ultra-processed foods on the gut microbiome has identified that common ingredients of these products, such as artificial sweeteners and emulsifiers, and substances generated by high-temperature extrusion, create a gut environment favouring microbes that promote low-grade inflammation associated with obesity and several diseases (Zinocker & Lindseth, 2018). Here more experimental and epidemiological research is needed.
More experimental and epidemiological research is needed on the behavioural effects of ultra-processed foods, and their role in appetite, craving, over-consumption, and quasi-addictive behaviour.
Systematic research is also needed on the various benefits of freshly prepared meals; on overall well-being and positive human health; and on the social, cultural, economic, political and environmental significance of the nature, extent and purposes of food processing, as set out in the NOVA classification. This implies “joined-up” teamwork involving investigators from all relevant disciplines, with appropriate methodologies, conducted in different countries.
One specific need is thorough careful examination of the cost in time and money of dietary patterns based on ultra-processed food as well as those based on preparation or acquisition of fresh meals. It is commonly said that modern living allows little time for cooking. But for many people, cooking is a constructive use of leisure time. It is also often said that ultra-processed foods are cheaper than freshly prepared meals. But this varies in different countries, and depends on what foods are used to make meals and on culinary skills, and does not include the value of freshly prepared meals as insurance against diseases and disabilities that are expensive and also time-consuming to treat.
Finally, continuous research on research is needed, as shown in sections 3 and 4 of this report and as pioneered by the World Cancer Research Fund/ American Institute for Cancer Research in their ground-breaking and very influential reports. (WCRF/AICR, 2007, 2009). Updated lists, digests and analyses of completed epidemiological and experimental research on ultra-processed foods and human health should be regularly made available.
Policy implications
Public policies and actions designed to promote freshly prepared meals and to restrict and reduce manufacture and consumption of ultra-processed foods, can and should be in various ways similar to those recommended for achieving healthy eating outlined in the United Nations Framework for Action, Decade of Action on Nutrition (FAO & WHO, 2014) and the UN Global Action Plan for the Prevention and Control of Non-communicable Diseases 2013–2020 (WHO, 2013).
Public policies and actions should protect long-established production, manufacture, distribution, sale and consumption of healthy food. This will involve systematic examination of

Ultra-processed foods, diet quality, and health using the NOVA classification system
Page 37 of 44
the behavioural, social, cultural, economic, political and environmental purposes and effects of food systems and supplies and dietary patterns.
Other specific public policies and actions, to involve statutory including fiscal measures, should give special priority to the health of infants, children and adolescents, and to the support of cooperative, small and family farmers and producers of fresh foods. They should ensure that staple healthy foods are affordable by and available to all, when appropriate by fixed prices, and encourage and protect cultures and dietary patterns based on freshly prepared meals.
Many policies and programmes designed to reorientate food systems and supplies and dietary patterns have already been discussed, reviewed and published by UN agencies and by national governments. These can and should contribute to actions that fully take into account the nature, extent and purpose of food processing, designed always to protect the overall immediate and indefinite good health and well-being of populations, the living and physical world, and the planet.

Page 38 of 44
Ultra-processed foods, diet quality, and health using the NOVA classification system
References
Adams, J. & White, M. 2015. Characterisation of UK diets according to degree of food processing and associations with socio-demographics and obesity: cross-sectional analysis of UK National Diet and Nutrition Survey (2008-12). International Journal of Behavioral Nutrition and Physical Activity, 12(160):1-12.
Adjibade, A., Julia, C., Allès, B., Touvier M., Lemogne, C., Srour, B., Hercberg, S. et al. 2019. Prospective association between ultra-processed food consumption and incident depressive symptoms in the French NutriNet-Santé cohort. BMC Medicine, 17(78):1-13.
Asfaw, A. 2011. Does consumption of processed foods explain disparities in the body weight of individuals? The case of Guatemala. Health Economics, 20(2):184–195.
Baraldi, L.G., Steele, E.M., Canella, D.S., et al. 2018. Consumption of ultra-processed foods and associated sociodemographic factors in the USA between 2007 and 2012: evidence from a nationally representative crosssectional study. BMJ Open, 8(e020574).
Brazilian Ministry of Health. 2014. Dietary Guidelines for the Brazilian Population. Brasília: Ministry of Health, November 2014. http://189.28.128.100/dab/docs/portaldab /publicacoes/guia_alimentar_populacao_ingles.pdf (accessed July 2019)
Canhada, S., Luft, V. C., Giatti, L., Duncan, B. B., Chor, D., Fonseca, M. J. M., Matos, et al. 2019. Ultra-processed Foods, Incident Overweight and Obesity, and Longitudinal Changes in Weight and Waist Circumference? The ELSA-Brasil Study. [Accepted in Public Health Nutrition]
Cediel, G., Reyes, M., Louzada, M.L.C., Steele, E.M., Monteiro, C.A., Corvalán, C. & Uauy, R. 2017. Ultra-processed foods and added sugars in the Chilean diet (2010). Public Health Nutrition, 21(1):125-133.
Cediel G, Reyes M, Corvalán, M, Levy, RB, Uauy, R and Monteiro, CA 2019. al. 2019. Ultra-processed foods drive to unhealthy diets: evidence from Chile. [Public Health Nutrition, accepted]
Chajes, V., Biessy, C., Byrnes, G., Deharveng, G., Saadatian-Elahi, M., Jenab, M., Peeters, P.H.M., Ocké, M., et al. 2011. Ecological-level associations between highly processed food intakes and plasma phospholipid elaidic acid concentrations: results from a cross-sectional study within the European prospective investigation into cancer and nutrition (EPIC). Nutrition and Cancer, 63(8):1235–1250.
Chen, Y.C., Huang, Y.C., Lo, Y.T.C., Wu, H.J., Wahlqvist, M.L. & Lee, M.S. 2018. Secular trend towards ultra-processed food consumption and expenditure compromises dietary quality among Taiwanese adolescents. Food & Nutrition Research, 62:1565. DOI: 10.29219/fnr.v62.1565.
Collins F., 2019. Ultra-processed diet leads to extra calories, weight gain. Bethesda, US National Institutes of Health. NIH Director’s blog. Posted on May 21st, 2019. https://directorsblog.nih.gov/2019/05/21/ultra-processed-diet-leads-to-extra-calories-weight-gain/
Costa, C.S., Rauber, F., Leffa, F., Sangalli, C.N., Campagnolo, P.D.B., Vitolo, M.R. 2019. Ultra-processed food consumption and its effects on anthropometric and glucose profile: A longitudinal study during childhood. Nutrition, Metabolism & Cardiovascular Diseases, 29 :177-184.
Ultra-processed foods, diet quality, and health using the NOVA classification system
Page 39 of 44
Crovetto, M.M, Uauy, R., Martins, A.P., Moubarac, J.C. & Monteiro, C.A. 2014. Disponibilidad de productos alimentarios listos para el consumo en los hogares de Chile y su impacto sobre la calidad de la dieta (2006-2007). Revista Médica de Chile, 142(7):850-858.
Cunha D.B., da Costa, T.H.M., Veiga, G.V., Pereira, R.A., Sichieri, R. 2018. Ultra-processed food consumption and adiposity trajectories in a Brazilian cohort of adolescents: ELANA study. Nutrition and Diabetes, 8(28):1-9.
de Souza Russell J, Mente Andrew, Maroleanu Adriana, Cozma Adrian I, Ha Vanessa, Kishibe Teruko et al. 2015. Intake of saturated and trans unsaturated fatty acids and risk of all cause mortality, cardiovascular disease, and type 2 diabetes: systematic review and meta-analysis of observational studies BMJ, 351:h3978
Eicher-Miller, H.A., Fulgoni, V.L. & Keast, D.R. 2012. Contributions of processed foods to dietary intake in the US from 2003-2008: A report of the Food and Nutrition Science Solutions Joint Task Force of the Academy of Nutrition and Dietetics, American Society for Nutrition, Institute of Food Technologists, and International Food Information Council. The Journal of Nutrition, 142:2065S–2072S.
Eicher-Miller, H.A., Fulgoni, V.L. & Keast, D.R. 2015. Processed Food Contributions to Energy and Nutrient Intake Differ among US Children by Race/Ethnicity. Nutrients, 7:10076–10088.
FAO. 2015. Guidelines on the collection of information on food processing through food consumption surveys. FAO, Rome.
FAO & WHO. 2014. Conference Outcome Document: Framework for Action [online]. Second International Conference on Nutrition. Rome, 19–21 November 2014. ICN2 2014/3 Corr.1. [Cited 4 April 2019]. http://www.fao.org/3/a-mm215e.pdf
FAO & WHO. 2017. Codex Alimentarius. Class and Names and the International Numbering System for Food Additives. Adopted in 1989. Revision: 2008.Amendment 2015. Available at: http://www.fao.org/input/download/standards/13341/CXG_036e_2015.pdf
FAO & WHO. (n.d.) Codex Alimentarius. GFSA Online. Updated up to the 41th Session of the Codex Alimentarius Commission (2018).
Fiolet, T., Srour, B., Sellem, L., Kesse-Guyot, E., Allès, B., Méjean, C., Deschasaux, M., Fassier, P. et al. 2018. Consumption of ultra-processed foods and cancer risk: results from NutriNet-Santé prospective cohort. British Medical Journal, 360:k322.
GLOPAN. Global Panel on Agriculture and Food Systems for Nutrition. 2016. Food systems and diets:Facing the challenges of the 21st century. London, Global Panel on Agriculture and Food Systems for Nutrition.
Gómez-Donoso, C., Sánchez-Villegas, A., Martínez-González, M.A., Gea, A., Mendonça, R.D., Lahortiga-Ramos, F. & Bes-Rastrollo, M. 2019. Ultra-processed food consumption and the incidence of depression in a Mediterranean cohort: The SUN Project. European Journal of Nutrition. DOI: 10.1007/s00394-019-01970-1.
González-Castell, D., González-Cossío, T., Barquera, S. & Rivera J.A. 2007. Contribution of processed foods to the energy, macronutrient and fiber intakes of Mexican children aged 1 to 4 years. Salud Pública de México, 49(5):345–356.
Hall, K.D., Ayuketah, A., Brychta, R, Cai, H., Cassimatis, T., Chem, K.Y., Chung, S.T. et al. 2019. Ultra-processed diets cause excess calorie intake and weight gain: an inpatient randomized controlled trial of ad libitum food intake. Cell Metabolism, 30(1):226. DOI: 10.1016/j.cmet.2019.05.020.

Page 40 of 44
Ultra-processed foods, diet quality, and health using the NOVA classification system
Julia, C., Martinez, L., Allès, B., Touvier, M., Hercberq, S., Méjean, C. & Kesse-Guyot, C. 2018.Contribution of ultra-processed foods in the diet of adults from the French NutriNet-Santé study. Public Health Nutrition, 21(1):27-37.
Jung SJ, Park SH, Choi EK et al. (2014) Beneficial effects of Korean traditional diets in hypertensive and type 2 diabetic patients. Journal of Medicinal Food, 17: 161–171.
Kim, H., Hu, E. & Rebholz, C. 2019. Ultra-processed food intake and mortality in the USA:
results from the Third National Health and Nutrition Examination Survey (NHANES III, 1988–1994). Public Health Nutrition, 22(10):1777-1785.
Latasa, P., Louzada, M.L.C., Martinez Steele, E. & Monteiro, C.A. 2018. Added sugars and ultra-processed foods in Spanish households (1990-2010). European Journal of Clininical Nutrition, 72(10):1404-1412.
Lawrence, M.A. & Baker, P.I. 2019. Ultra-processed food and adverse health outcomes. British Medical Journal, 365:l2289. DOI: 10.1136/bmj.l2289.
Louzada, M.L.C., Baraldi, L. G. , Martinez, E et al. 2015. Consumption of ultra-processed foods andobesity in Brazilian adolescents and adults. Preventive Medicine, 81: 9-15.
Louzada, M.L.C., Ricardo, C.Z., Steele, E.M., Levy, R.B. , Cannon, G. & Monteiro, C.A. 2017. The share of ultra-processed foods determines the overall nutritional quality of diets in Brazil. Public Health Nutrition: 21(1), 94–102.
Machado, P,P, Steele, E.M., Levy, R.B., Sui, Z., Woods, J., Gill, T.P., Scrinis, G. Monteiro, C.A. 2019. Ultra-processed foods and recommended intake levels of nutrients linked to non-communicable diseases in Australia: evidence from a nationally representative cross-sectional study. [Accepted in BMJ Open].
Marrón-Ponce, J.A., Flores, M., Cediel, G., Monteiro, C.A. & Batis, C. 2019. Associations between consumption of ultra-processed foods and intake of nutrients related to chronic non-communicable diseases in Mexico. Journal of de Academy of Nutrition and Dietetics, pii: S2212-2672(18)31402-3. DOI: 10.1016/j.jand.2019.04.020.
Mendonça, R.D., Pimenta, A.M., Gea, A., de la Fuente-Arrillaga, C., Martinez-Gonzalez, M.A., Lopes, A.C. & Bes-Rastrollo, M. 2016. Ultraprocessed food consumption and risk of overweight and obesity: the University of Navarra Follow-Up (SUN) cohort study. American Journal of Clinical Nutrition, 104(5):1433-1440.
Mendonça, R.D., Lopes, A.C., Pimenta, A.M., Gea, A., Martinez-Gonzales, M.A. & Bes-Rastrollo, M. 2017. Ultra-processed food consumption and the incidence of hypertension in amediterranean cohort: the seguimiento Universidad de Navarra Project. American Journal ofHypertension, 30(4):358-366.
Melo, B., Rezende, L., Machado, P., Gouveia, N., Levy, R. 2018. Associations of ultra-processed food and drink products with asthma and wheezing among Brazilian adolescents. Pediatric Allergy and Immunology, 29:504–511.
Ministerio de Salud del Uruguay. 2016. Guías alimentarias para la población uruguaya. Montevideo, Ministerio de Salud del Uruguay. Available at : https://www.gub.uy/ministerio-salud-publica/comunicacion/publicaciones/guia-alimentaria-para-la-poblacion-uruguaya (Accessed July 2019)
Ministerio de Salud del Perú, 2018. Guías alimentarias para la población peruana. Lima,
Juul, F.; Steele, E.M., Parekh, N., Monteiro, C.A. & Chang V.W. 2018. Ultra-processed food consumption and excess weight among US adults. British Journal of Nutrition, 120:90-100.

Ultra-processed foods, diet quality, and health using the NOVA classification system
Page 41 of 44
Ministerio de Salud. Available at: https://cdn.www.gob.pe/uploads/document/file/274420/RM_1353-2018-MINSA.PDF (Accessed July 2019)
Ministerio de Salud Publica del Ecuador y FAO. 2018. Documento Técnico de las Guías Alimentarias Basadas en Alimentos (GABA) del Ecuador GABA-ECU. Quito, Ministerio de Salud Pública del Ecuador y Organización de las Naciones Unidas para la Alimentación y la Agricultura. Available at: https://repositorio.ins.gob.pe/xmlui/bitstream/handle/INS/1128/guias_alimentarias_poblacion_peruana.pdf?sequence=3&isAllowed=y (Accessed July 2019)
Monteiro C.A. 2009. Nutrition and health. The issue is not food, nor nutrients, so much as processing. Public Health Nutrition, 12(5): 729-731. doi:10.1017/ S1368980009005291
Monteiro C.A., Cannon G., Levy R.B., Moubarac J-C, Louzada M.L., Rauber F.,Khandpur N. et al. 2019. Ultra-processed foods: what they are and how to identify them. Public Health Nutrition, 22(5), 936-941. doi:10.1017/S1368980018003762
Monteiro CA, Cannon G, Moubarac JC et al. 2017a. The UN Decade of Nutrition, the NOVA food classification and the trouble with ultra-processing. Public Health Nutrition, 21, 5-17.
Monteiro, C.A., Levy, R.B., Claro, R.M., Castro, I.R.R. & Cannon, G. 2010. A new classification of foods based on the extent and purpose of food processing. Cadernos de Saúde Pública, 26(11):2039-2049.
Monteiro, C.A., Levy, R.B., Claro, R.M., Castro, I.R. & Cannon, G. 2011. Increasing consumption of ultra-processed foods and likely impact on human health: evidence from Brazil. Public Health Nutrition, 14(1):5-13.
Monteiro CA, Moubarac J.C, Cannon G et al. 2013 Ultra-processed products are becoming dominant in the global food system. Obesity Reviews 14(2), 21–28.
Monteiro, C.A., Moubarac, J.C., Levy, R.B., Canella, D.S., Louzada, M.L.C., Cannon, G. 2017b. Household availability of ultra-processed foods and obesity in nineteen European countries. Public Health Nutrition, 21:18-26.
Moubarac J.C., Martins. A.P., Claro, R.M., Levy, R.B., Cannon, G. & Monteiro, C.A. 2013. Consumption of ultra-processed foods and likely impact on human health. Evidence from Canada. Public Health Nutrition, 16(12): 2240-2248.
Moubarac J-C, Parra D, Cannon G, Monteiro CA. 2014. Food classification systems based on food processing: significance and implications for policies and actions: a systematic literature review and assessment. Current Obesity Reports, 3(2):256-72. DOI 10.1007/s13679-014-0092-0
Moubarac, J.C., Batal, M., Louzada, M.L., Martinez Steele, E. & Monteiro, C.A. 2017. Consumption of ultra-processed foods predicts diet quality in Canada. Appetite, 108 :512-520.
Nardocci, M., Leclerc, B-S., Louzada, M.L., Monteiro, C.A., Batal, M., Moubarac, J-C. 2018. Consumption of ultra-processed foods and obesity in Canada. Canadian Journal of Public Health.
Parra, D.C., Louzada, M.L.C.; Moubarac, J.C., Levy, R.B., Khandpur, N., Cediel, G. & Monteiro, C.A. 2019. The association between ultra-processed food consumption and the nutrientprofile of the Colombian diet in 2005. Salud Pública de México, 61(2):147-154.
PAHO, 2019. Ultra-processed Food and Drink Products in Latin America: Sales, Sources, Nutrient Profiles and Policy Implications. Washington DC, PAHO.
Poti, J.M.; Mendez, M.A.; Ng, S.W. & Popkin, B.M. 2015. Is the degree of food processing and

Page 42 of 44
Ultra-processed foods, diet quality, and health using the NOVA classification system
convenience linked with the nutritional quality of foods purchased by US households? American Journal of Clinical Nutrition, 101:1251–1262.
Rauber, F., Louzada, M.L.C., Steele, E.M., Millett, C., Monteiro, C.A. & Levy, R.B. 2018. Ultra-processed food consumption and chronic non-communicable diseases-related dietary nutrient profile in the UK (2008-2014). Nutrients, 10(5):E587. DOI: 10.3390/nu10050587.
Rico-Campà, A., Martínez-González, M.A., Alvarez-Alvarez, I., Mendonça, R.D., Fuente-Arrillaga, C., Gómez-Donoso, C. & Bes-Rastrollo, M. 2019. Association between consumption of ultra-processed foods and all cause mortality: SUN prospective cohort study. British Medical Journal, 365:l1949. DOI: 10.1136/bmj.l1949.
Rohatgi, K.W., Tinius, R.A., Cade, W.T., Steele, E.M., Cahill, A.G., Parra, D.C. 2017. Relationships between consumption of ultra-processed foods, gestational weight gain and neonatal outcomes in a sample of US pregnant women. Peer Journal, 5, e4091. doi:10.7717/peerj.4091.
Sandoval-Insausti, H., Blanco-Rojo, R., Graciani, A., López-García, E., Moreno-Franco, B., Laclaustra, M., Donat-Vargas, C. et al. 2019. Ultra-processed Food Consumption and Incident Frailty: A prospective Cohort Study of Older Adults. The Journal of Gerentology. Series A, Biological Sciences and Medical Sciences, pii: glz140. DOI: 10.1093/gerona/glz140.
Schnabel L, Buscail C, Sabate J-M et al. 2018. Association between ultra-processed food consumption and functional gastrointestinal disorders: results from the French NutriNetSanté Cohort. The American Journal of Gastroenterology, 113: 1217–1228.
Schnabel, L., Kesse-Guyot, E., Allès, B., Touvier, M., Srour, B., Hercberg, S., Buscail, C. et al. 2019. Association between ultraprocessed food consumption and risk of mortality among middle-aged adults in France. JAMA Internal Medicine. [Epub ahead of print]. DOI: 10.1001/jamainternmed.2018.7289.
Shams-White M. Brockton N, Mitrou P et al. 2019. Operationalizing the 2018 World Cancer Research Fund/American Institute for Cancer Research (WCRF/AICR) Cancer Prevention Recommendations: A Standardized Scoring System. Nutrients 11, 1572.
Sho H. 2001. History and characteristics of Okinawan longevity food. Asia Pacific Journal of Clinical Nutrition, 10: 159–164.
Slimani, N., Deharveng, G., Southgate, D.A., Biessy, C., Chajes, V., van Bakel, M.M., Boutron-Ruault, M.C. & McTaggart, A., et. al. 2009. Contribution of highly industrially processed foods to the nutrient intakes and patterns of middle-aged populations in the European Prospective Investigation into Cancer and Nutrition study. European Journal of Clinical Nutrition, 63(Suppl.4): S206-25. DOI: 10.1038/ejcn.2009.82
Sofi, F., Abbate, R., Gensini, G.F. et al. 2010 Accruing evidence on benefits of adherence to the Mediterranean diet on health: an updated systematic review and meta-analysis. American Journal of Clinical Nutrition, 92: 1189–1196.
Srour, B., Fezeu, L.K., Kesse-Guyot, E., Allès, B., Méjean, C., Andrianasolo, R.M., Chazelas, E. et al. 2019. Ultra-processed food intake and risk of cardiovascular disease: prospective cohort study (NutriNet-Santé). British Medical Journal, 65:l1451. DOI: 10.1136/bmj.l1451.
Steele, E.M., Baraldi, L.G., Louzada, M.L.C., Moubarac, J.C., Mozaffarian, D. & Monteiro, C.A. 2016. Ultra-processed foods and added sugars in the US diet: evidence from a nationally
Rauber, F., Campagnolo, P., Hoffman, D., Vitolo, M. 2015. Consumption of ultra-processed food products and its effects on children’s lipid profiles: a longitudinal study. Nutrition, Metabolism and Cardiovascular Diseases, 25(1):116-122.

Ultra-processed foods, diet quality, and health using the NOVA classification system
Page 43 of 44
representative cross-sectional study. BMJ Open, 6(3):e009892. DOI: 10.1136/bmjopen-2015-009892.
Steele, E.M., Raubenheimer, D., Simpson, S.J., Baraldi, L.G. & Monteiro, C.A. 2017b. Ultra-processed foods, protein leverage and energy intake in the USA. Public Health Nutrition, 21(1):114-124.
Steele, E.M. & Monteiro, C.A. 2017c. Association between dietary share of ultra-processed foods and urinary concentrations of phytoestrogens in the U.S. Nutrients, 9(3):1-15.
foods and the overall nutritional quality of diets in the US: evidence from a nationally representative cross-sectional study. Population Health Metrics, 15(1):6. DOI: 10.1186/s12963-017-0119-3.
Steele, E.M., Juul, F., Neri, D., Rauber, F., Monteiro, C.A. 2019. Dietary share of ultra-processed foods and metabolic syndrome in the US adult population. Preventive Medicine, 125:40-48.
Swinburn B, Kraak V, Allender S et al. 2019. The Global Syndemic of Obesity, Undernutrition, and Climate Change: The Lancet Commission report. The Lancet 393: 791–846.
USDA/DHSS, 2010.Dietary Guidelines for Americans, 2010. Washington, DC: U.S. Government Printing Office. Avalable at: http://www.cnpp.usda. gov /sites/default/files/dietary_guidelines_for_ americans/PolicyDoc.pdf
USDA/DHSS, Department of Agriculture/ US Department of Health and Human Services. 2015.Dietary Guidelines for Americans 2015-2020. Washington DC: USDA/DHSS. https://health.gov /dietaryguidelines/2015/resources/2015-2020_Dietary_ Guidelines.pdf
Vandevijvere, S., De Ridder, K., Fiolet, T., Bel, S. & Tafforeau, J. 2018. Consumption of ultra-processed food products and diet quality among children, adolescents and adults in Belgium. European Journal of Nutrition. DOI: 10.1007/s00394-018-1870-3.
Vandevijvere, S., Jaacks, L.M., Monteiro, C.A., Moubarac, J.C., Girling-Butcher, M., Lee, A.C., Pan, A., Bentham, J., Swinburn, B. 2019. Global trends in ultraprocessed food and drink product sales and their association with adult body mass index trajectories. Obesity Reviews, 1-10.
WCRF/AICR. 2007. Food, Nutrition, Physical Activity and the Prevention of Cancer: A Global Perspective. Washington DC, AICR.
WCRF/AICR. 2009. Policy and Action for Cancer Prevention. Washington DC, AICR.
WHO. 2003. Diet, Nutrition and the Prevention of Chronic Diseases. Report of a joint WHO/FAO expert consultation. WHO technical report series 916. Geneva: World Health Organization.
WHO. 2013. Global Action Plan for the Prevention and Control of Non-Communicable Diseases, 2013-2020. Geneva: World Health Organization.
WHO. 2015. Guideline: Sugars intake for adults and children. Geneva: World Health Organization; 2015.
Zinöcker M.K., & Lindseth I.A. 2018. The Western diet-microbiome-host interaction and its role in metabolic disease. Nutrients 17;10(3). pii: E365.
Steele, E.M., Popkin, B.M.; Swinburn, B. & Monteiro, C.A. 2017a. The share of ultra-processed

Page 44 of 44
Ultra-processed foods, diet quality, and health using the NOVA classification system
ANNEX 1
Food processing classification systems: originators, where developed/applied, and references that describe their methods and applications
ORIGINATORS WHERE
DEVELOPED/APPLIED REFERENCES TO METHODS AND APPLICATIONS
Researchers from the National Institute of Public Health (NIPH), Mexico
Mexico/Mexico González-Castell, et al., 2007. Contribution of processed foods to the energy, macronutrient and fiber intakes of Mexican children aged 1 to 4 years. Salud Publica Mex., 49(5):345–56.
Researchers from the International Agency for Research on Cancer (IARC) and the European Prospective Investigation into Cancer and Nutrition (EPIC)
Europe/Europe Slimani, et al., 2009. Contribution of highly industrially processed foods to the nutrient intakes and patterns of middle-aged populations in the European Prospective Investigation into Cancer and Nutrition study. Eur. J. Clin. Nutr., 63 (Suppl. 4):S206–25.
Chajes, et al., 2011. Ecological-level associations between highly processed food intakes and plasma phospholipid elaidic acid concentrations: results from a cross-sectional study within the European prospective investigation into cancer and nutrition (EPIC). Nutr. Cancer, 63(8):1235–50.
Researchers from the University of São Paulo, Brazil
Brazil/Global Monteiro, et al., 2010. A new classification of foods based on the extent and purpose of their processing. Cad. Saúde Pública, 26(11):2039-2049
Monteiro, et al., 2017a. The UN Decade of Nutrition, the NOVA food classification and the trouble with ultra-processing. Public Health Nutrition, 21(1): 5-17.
NOVA has been used by over 80 studies conducted in many countries. Some of these studies are described in Monteiro et al., 2017a and some are reviewed in Section 3 and 4 of this report.
International Food Information Council (IFIC), US
US/US Eicher-Miller, et al., 2012. Contributions of processed foods to dietary intake in the US from 2003-2008: A report of the Food and Nutrition Science Solutions Joint Task Force of the Academy of Nutrition and Dietetics, American Society for Nutrition, Institute of Food Technologists, and International Food Information Council. J. Nutr., 142:2065S–2072S.
Eicher-Miller, et al., 2015. Processed Food Contributions to Energy and Nutrient Intake Differ among US Children by Race/Ethnicity. Nutrients, 7:10076–10088.
Research from the International Food Policy Research Institute (IFPRI)
Guatemala/ Guatemala
Asfaw, 2011. Does consumption of processed foods explain disparities in the body weight of individuals? The case of Guatemala. Health Econ., 20(2):184–95.
Researchers from the University of North Carolina at Chapel Hill, US
US/US Poti, et al., 2015. Is the degree of food processing and convenience linked with the nutritional quality of foods purchased by US households? Am. J. Clin. Nutr., 101:1251–1262.