Installing VIVO @ Your Institution 2012 VIVO Implementation Fest.

NeuroImage 112 (2015) 1–6
Contents lists available at ScienceDirect
NeuroImage
j ourna l homepage: www.e lsev ie r .com/ locate /yn img
Ultra-high resolution in-vivo 7.0 T structural imaging of the humanhippocampus reveals the endfolial pathway
Mansi B. Parekh a,⁎, Brian K. Rutt a, Ryan Purcell a, Yuanxin Chen b, Michael M. Zeineh a
a Department of Radiology, Stanford University, Stanford, CA, USAb Robarts Research Institute, University of Western Ontario, London, ON, Canada
⁎ Corresponding author. Fax: +1 650 723 5795.E-mail address: [email protected] (M.B. Parekh
http://dx.doi.org/10.1016/j.neuroimage.2015.02.0291053-8119/© 2015 Elsevier Inc. All rights reserved.
a b s t r a c t
a r t i c l e i n f oArticle history:Accepted 11 February 2015Available online 19 February 2015
The hippocampus is a very important structure in memory formation and retrieval, as well as in variousneurological disorders such as Alzheimer's disease, epilepsy and depression. It is composed of many intricatesubregions making it difficult to study the anatomical changes that take place during disease. The hippocampalhilus may have a unique neuroanatomy in humans compared to that in monkeys and rodents, with field CA3hgreatly enlarged in humans compared to that in rodents, and a white-matter pathway, called the endfolial path-way, possibly only present in humans. In this study we have used newly developed 7.0 T whole brain imagingsequence, balanced steady-state free precession (bSSFP) that can achieve 0.4 mm isotropic images to study,in vivo, the anatomy of the hippocampal hilus. A detailed hippocampal subregional segmentation was performedaccording to anatomic atlases segmenting the following regions: CA4, CA3, CA2, CA1, SRLM (stratum radiatumlacunosum moleculare), alveus, fornix, and subiculum along with its molecular layer. We also segmented ahypointense structure centrally within the hilus that resembled the endfolial pathway. To validate that thishypointense signal represented the endfolial pathway, we acquired 0.1 mm isotropic 8-phase cycle bSSFP onan excised specimen, and then sectioned and stained the specimen for myelin using an anti-myelin basic proteinantibody (SMI 94). A structure tensor analysis was calculated on themyelin-stained section to show directional-ity of the underlying fibers. The endfolial pathway was consistently visualized within the hippocampal bodyin vivo in all subjects. It is a central pathway in the hippocampus, with unknown relevance in neurodegenerativedisorders, but now that it can be visualized noninvasively, we can study its function and alterations inneurodegeneration.
© 2015 Elsevier Inc. All rights reserved.
Introduction
The medial temporal lobe (MTL) plays an important role inmemoryformation and retrieval as well as in various neurological disorders suchas Alzheimer's disease, epilepsy, depression and traumatic brain injury.Studying the structural changes that occur in the hippocampus, thecenterpiece of theMTL,may aid in the understanding of these disorders.The hippocampus is composed of several tightly packed, intricatesubregions making it difficult to identify the anatomical changes thattake place during disease. Subfields include the cornu ammonis regions(CA1, CA2, CA3 and CA4), the dentate gyrus (DG), and the subiculum,and these serve different functions and are variably affected by neuro-degenerative diseases (Burggren et al., 2008; Mueller and Weiner,2009). The CA fields consist of a pyramidal cell layer as well as the stra-tum radiatum (contains commissuralfibers and Schaffer collaterals, andapical dendrites of CA1/2/3 neurons), stratum lacunosum moleculare(contains Schaffer collaterals and perforant pathway fibers and apical
).
dendrites of CA1/2/3 neurons) and the stratum oriens (contains basaldendrites of pyramidal neurons, septal fibers and commissural fibers)(Insausti and Amaral, 2008). The medial and lateral entorhinal cortexsends projections to the dentate gyrus that perforate through thesubiculum (Scher et al., 2007; Witter and Amaral, 1991) The dentategyrus in turn sends unmyelinated projections called the mossy fibersthat innervate the CA4 and CA3 pyramidal cells (Kondo et al., 2009).These cells then send out the Schaffer collaterals that synapse ontoCA1 pyramidal cells (Rosene and Van Hoesen, 1977). However, inaddition to the above trisynaptic pathway, the hippocampus has variousefferent and afferent connections: fornix (fibers from the CA3 andsubiculum), commissural fibers (from CA3 to contralateral CA3) andfibers from the locus coeruleus.
The hippocampal hilus may have neuroanatomy that is unique tohumans, with field CA4 greatly enlarged compared to that in rodents(Lim et al., 1997), though its independent existence is controversial(Amaral, 1978; de No, 1934). Moreover, a white-matter pathway calledthe endfolial (EF) pathway may only be present in humans (Lim et al.,1997). Anatomically, the EF pathway consists of myelinated axons offield CA4 that originate in the pyramidal neurons of the hippocampal

Fig. 1. A) Illustration of intra-hippocampal connectivity. SRLM— stratum radiatum lacunosummoleculare; DG— dentate gyrus; PP— perforant pathway; Sub— subiculum; SO— stratumoriens. B) Fig. 1B from the 1997 Lim paper (citation) demonstrates human hippocampal architecture. The four myelinated layers, perforant pathway (PP), myelinated portion of theSchaffer collateral system (SC), the endfolial fiber pathway (EF), and the alveus (AL) are hyperintense. Scale bar 2.5 mm.“Reprinted from Journal of ComparativeNeurology,Vol. 385, LimC,Mufson EJ, Kordower JH, BlumeHW,Madsen JR, Saper CB., Connections of thehippocampal formation inhumans: II. Theendfolial fiber pathway, pp. 352–371. Copyright 1997, with permission from JohnWiley and Sons.” (Lim et al., 1997).
2 M.B. Parekh et al. / NeuroImage 112 (2015) 1–6
hilus and travel superomedially within the stratum oriens, just inferiorto the alveus, possibly an extended part of the Schaffer system(Lim et al., 1997) (Fig. 1A). While seemingly an important part of mne-monic circuitry consisting of output from hilar pyramidal neurons, thispathway has yet to be further explored.
The hippocampus is frequently targeted in magnetic resonanceimaging (MRI) studies due to its important roles in memory formationand retrieval, and its implication in many diseases and disorders.Studying the hippocampus at high-resolution in-vivomay lead to betterimaging biomarkers and improve diagnostic accuracy (Kerchner, 2011;Kerchner et al., 2010; Yushkevich et al., 2009). We have recently shownthat at 7.0 T, balanced steady state free precession (bSSFP) demon-strates high signal-to-noise ratio and produces a superior depiction ofthe MTL (Zeineh et al., 2014). In this study we have used the bSSFPsequence at 7.0 T to further investigate the ultra-structure of the hippo-campus, and have found that we can reliably identify the EF pathwayin vivo. We verified this in vivo finding by performing specimen MRIusing an identical sequence, and subsequent histologic analysis toprove the distinct orientation within this structure. This demonstratesthe remarkable resolution achievable at high field to investigatepathways possibly unique to humans.
Methods
Acquisition & image processing
In accordancewith Stanford's Institutional Review Board and HealthInsurance Portability and Accountability Act compliance, eight healthy,normal subjects were imaged on a GE 7.0 T Discovery MR950 whole-body scanner (GE Healthcare, Waukesha, WI) using a 32-channelreceive head coil contained within a quadrature transmit coil (NovaMedical, Inc., Wilmington, MA). A 2nd order shim sequence was run,and uniformity measured over a 3D cubic volume encompassing thewhole brain including the temporal lobes, approximately 20 cm insize. We achieved a uniformity of approximately 20 Hz r.m.s. acrossthe prescription with one to two iterations of shimming, verified byrunning the shim sequence a final timewithout any adjustments there-after. According to our prior work (Zeineh et al., 2014), we acquired 8even increments of phase-cycled bSSFP (3D Fast Imaging EmployingSteady-state Acquisition (FIESTA)), coronal, frequency S/I, TR 8.2 ms,TE 4.1 ms, FA 25°, BW 62 kHz, FOV 17 × 17 × 19.2 cm, 420 × 420 ×480 (0.4 mm isotropic acquisition). Images were reconstructed to512 × 512 × 480 using the standard GE reconstruction that utilizeszero-filling and Fermi filtering resulting in an anisotropic pixel size of0.33 × 0.33× 0.4mm. Partial Fourier encodingwas performed acquiringapproximately 58% of the phase encoding steps (half k-space with 32
overscans) and two-dimensional parallel imaging using accelerationfactor of 1.75 × 1.75 (Griswold et al., 2002). The scan time was 5 min11 s per phase cycle, making the total acquisition time approximately40 min. One volunteer moved on two of the bSSFP phase-cycles, sothese were repeated. Another volunteer underwent 6 rather than 8phase-cycles due to scan timing constraints. Six of these subjects werescanned as part of our prior work, and two were unique to this study.Due to motion between phase cycles, using methods previously pub-lished by our group (Zeineh et al., 2014), individual phase cycle imageswere combined into an initial sum-of-squares (SOS-1) image followedby a rigid body alignment of each phase cycle to the SOS-1. Thesewere then recombined into a second SOS image to produce a finalreconstructed volume, which was used for segmentation and analysis.
On one additional subject (not one of the eight subjects above), weperformed the same sequence at a lower acquisition resolution of0.6 mm isotropic by using the following parameters: 4 phase cycles,3D FIESTA (a sequence employing steady-state free precession), coro-nal, frequency S/I, TR 8.1 ms, TE 4.05 ms, FA 25°, BW 35 kHz, FOV18 × 18 × 23.4 cm, 300 × 300 × 390, reconstructed to 512 × 512 ×390, acceleration factor 2 × 2, complete Fourier encoding of all phaseencoding steps, Turbo acceleration factor 2, 2 min 53 s per phasecycle. The image processing pipeline was otherwise identical for thissubject.
Subfield analysis
The final reconstructed and aligned bSSFP volumes were visualizedusing ITK-SNAP (www.itksnap.org). Segmentation of hippocampal sub-regions was performedmanually according to anatomic atlases and ourprior work (Duvernoy, 2005; Insausti and Amaral, 2008; Yushkevichet al., 2009; Zeineh et al., 2012). Detailed hippocampal subfield segmen-tation was performed of the hippocampal body only, not the tail orhead. The anterior aspect of the hippocampal body is defined as thefirst slice posterior to the uncal apex. The hippocampal tail's anteriorboundary was defined as the first slice where the hippocampus beginsto elongate in the superiomedial–inferiolateral direction, and the sliceimmediately anterior was defined as the posterior-most hippocampalbody.
Endfolial pathwayOn the coronal plane, the EF pathwaywas observed as a hypointense
diagonal band extending inferiolaterally from the fornix to the center ofthe hilus (Fig. 2C). In the sagittal plane, the endfolial pathway was thehypointense band between the superior and inferior SRLM (stratumradiatum and lacunosum moleculare) (Fig. 2A), just below the fornixand located between CA3 and CA4/DG.

Fig. 2. In vivo segmentation of hippocampal subfields. A) Sagittal plane showing the hippocampus where the hypointense band is the endfolial pathway (blue arrows) and the teeth-likeundulations can be observed. B) Overlay of the segmentations. C and D show the hippocampal body in the coronal plane, without andwith segmentation, respectively. Pink arrows showthe SRLM in C.
3M.B. Parekh et al. / NeuroImage 112 (2015) 1–6
The segmentation was performed in the coronal plane using thefollowing rules: the superior boundary was the fornix and the inferiorboundary was the inferior-most extent of the hypointensity withinthe hilus. In sections where it was difficult to see the hypointenseband of the EF, we marked only one voxel below the fornix as the EF;this occurred in approximately 5% of the slices. If the inferior-most por-tion of the hypointense band of the EF seemed to curve upwards later-ally, such that it was contiguous with the SRLM, we only segmentedone voxel of curvature upwards such that the SRLM and EF segmenta-tions were not contiguous with each other. We bridged discontinuitieswithin the EF on the sagittal plan.Wewere able to observe the endfolialextend into the head for about 4–5 slices (1.2–1.6mm), howeverwe didnot include those slices in our segmentations.
SRLM (stratum radiatum and stratum lacunosum moleculare)The SRLM was observed as a thin hypointense C-shaped strip
centrally within the hippocampal body. The structure was always seg-mented as at least 1 pixel wide. Wherever it was difficult to see ahypointense signal, we filled in the structure based on adjacent slicesand a multi-planar analysis. The medial extent of the inferior SRLM
Fig. 3. Example of a 0.6 mm isotropic bSSFP, 4-phased directions dataset collected in 12 minpathway and the pink to the SRLM.
wasmarked at themedial extent of the CA4DG sublayer. Themedial ex-tent of the superior SRLM was marked up to where the hypointenseband terminates.When the hippocampal sulcuswas present, we alwayssegmented externally to it, so as not to include the dentate molecularlayer.
AlveusThe alveus was observed as the hypointense band surrounding the
hippocampus proper. The inferior-lateral boundary was extended tothe inferior boundary of the adjacent temporal horn of the lateral ven-tricle. The alveus was observed as a relatively darker band of 1–2 pixelsjust inferior to the thickened hypointense band of the fornix.
FornixThe fornixwas segmented as the thickened hypointense band just su-
perior to the alveus. The lateral boundary was where this hypointensitytransitioned from greater than or equal to 2 voxels in thickness to onevoxel in thickness. Themedial boundary of the fornix was CSF in the am-bient cistern. Sometimes the fornix was situated more medially withinthe ambient cistern for different subjects, and in such cases it was
. A) Sagittal and B) coronal view of the hippocampus. Blue arrows point to the endfolial
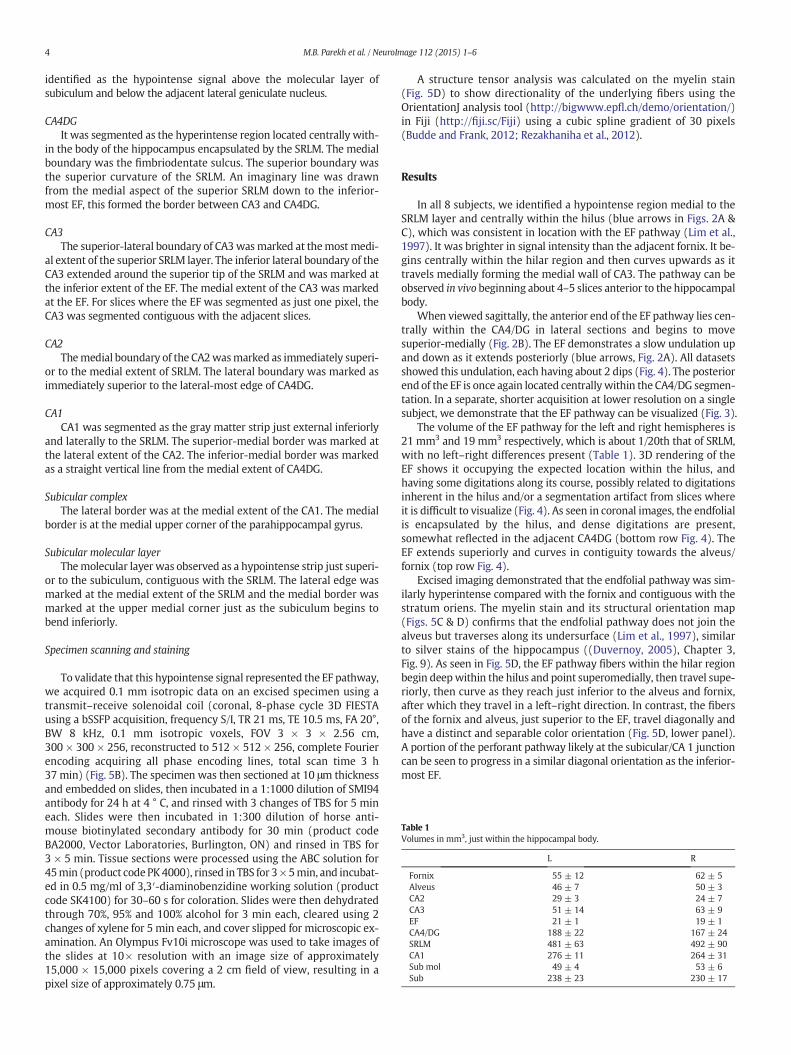
Table 1Volumes in mm3, just within the hippocampal body.
L R
Fornix 55 ± 12 62 ± 5Alveus 46 ± 7 50 ± 3CA2 29 ± 3 24 ± 7CA3 51 ± 14 63 ± 9EF 21 ± 1 19 ± 1CA4/DG 188 ± 22 167 ± 24SRLM 481 ± 63 492 ± 90CA1 276 ± 11 264 ± 31Sub mol 49 ± 4 53 ± 6Sub 238 ± 23 230 ± 17
4 M.B. Parekh et al. / NeuroImage 112 (2015) 1–6
identified as the hypointense signal above the molecular layer ofsubiculum and below the adjacent lateral geniculate nucleus.
CA4DGIt was segmented as the hyperintense region located centrally with-
in the body of the hippocampus encapsulated by the SRLM. The medialboundary was the fimbriodentate sulcus. The superior boundary wasthe superior curvature of the SRLM. An imaginary line was drawnfrom the medial aspect of the superior SRLM down to the inferior-most EF, this formed the border between CA3 and CA4DG.
CA3The superior-lateral boundary of CA3wasmarked at themost medi-
al extent of the superior SRLM layer. The inferior lateral boundary of theCA3 extended around the superior tip of the SRLM and was marked atthe inferior extent of the EF. The medial extent of the CA3 was markedat the EF. For slices where the EF was segmented as just one pixel, theCA3 was segmented contiguous with the adjacent slices.
CA2Themedial boundary of the CA2wasmarked as immediately superi-
or to the medial extent of SRLM. The lateral boundary was marked asimmediately superior to the lateral-most edge of CA4DG.
CA1CA1 was segmented as the gray matter strip just external inferiorly
and laterally to the SRLM. The superior-medial border was marked atthe lateral extent of the CA2. The inferior-medial border was markedas a straight vertical line from the medial extent of CA4DG.
Subicular complexThe lateral border was at the medial extent of the CA1. The medial
border is at the medial upper corner of the parahippocampal gyrus.
Subicular molecular layerThemolecular layer was observed as a hypointense strip just superi-
or to the subiculum, contiguous with the SRLM. The lateral edge wasmarked at the medial extent of the SRLM and the medial border wasmarked at the upper medial corner just as the subiculum begins tobend inferiorly.
Specimen scanning and staining
To validate that this hypointense signal represented the EF pathway,we acquired 0.1 mm isotropic data on an excised specimen using atransmit–receive solenoidal coil (coronal, 8-phase cycle 3D FIESTAusing a bSSFP acquisition, frequency S/I, TR 21 ms, TE 10.5 ms, FA 20°,BW 8 kHz, 0.1 mm isotropic voxels, FOV 3 × 3 × 2.56 cm,300 × 300 × 256, reconstructed to 512 × 512 × 256, complete Fourierencoding acquiring all phase encoding lines, total scan time 3 h37 min) (Fig. 5B). The specimen was then sectioned at 10 μm thicknessand embedded on slides, then incubated in a 1:1000 dilution of SMI94antibody for 24 h at 4 ° C, and rinsed with 3 changes of TBS for 5 mineach. Slides were then incubated in 1:300 dilution of horse anti-mouse biotinylated secondary antibody for 30 min (product codeBA2000, Vector Laboratories, Burlington, ON) and rinsed in TBS for3 × 5 min. Tissue sections were processed using the ABC solution for45min (product code PK4000), rinsed in TBS for 3×5min, and incubat-ed in 0.5 mg/ml of 3,3′-diaminobenzidine working solution (productcode SK4100) for 30–60 s for coloration. Slides were then dehydratedthrough 70%, 95% and 100% alcohol for 3 min each, cleared using 2changes of xylene for 5 min each, and cover slipped for microscopic ex-amination. An Olympus Fv10i microscope was used to take images ofthe slides at 10× resolution with an image size of approximately15,000 × 15,000 pixels covering a 2 cm field of view, resulting in apixel size of approximately 0.75 μm.
A structure tensor analysis was calculated on the myelin stain(Fig. 5D) to show directionality of the underlying fibers using theOrientationJ analysis tool (http://bigwww.epfl.ch/demo/orientation/)in Fiji (http://fiji.sc/Fiji) using a cubic spline gradient of 30 pixels(Budde and Frank, 2012; Rezakhaniha et al., 2012).
Results
In all 8 subjects, we identified a hypointense region medial to theSRLM layer and centrally within the hilus (blue arrows in Figs. 2A &C), which was consistent in location with the EF pathway (Lim et al.,1997). It was brighter in signal intensity than the adjacent fornix. It be-gins centrally within the hilar region and then curves upwards as ittravels medially forming the medial wall of CA3. The pathway can beobserved in vivo beginning about 4–5 slices anterior to the hippocampalbody.
When viewed sagittally, the anterior end of the EF pathway lies cen-trally within the CA4/DG in lateral sections and begins to movesuperior-medially (Fig. 2B). The EF demonstrates a slow undulation upand down as it extends posteriorly (blue arrows, Fig. 2A). All datasetsshowed this undulation, each having about 2 dips (Fig. 4). The posteriorend of the EF is once again located centrallywithin the CA4/DG segmen-tation. In a separate, shorter acquisition at lower resolution on a singlesubject, we demonstrate that the EF pathway can be visualized (Fig. 3).
The volume of the EF pathway for the left and right hemispheres is21 mm3 and 19 mm3 respectively, which is about 1/20th that of SRLM,with no left–right differences present (Table 1). 3D rendering of theEF shows it occupying the expected location within the hilus, andhaving some digitations along its course, possibly related to digitationsinherent in the hilus and/or a segmentation artifact from slices whereit is difficult to visualize (Fig. 4). As seen in coronal images, the endfolialis encapsulated by the hilus, and dense digitations are present,somewhat reflected in the adjacent CA4DG (bottom row Fig. 4). TheEF extends superiorly and curves in contiguity towards the alveus/fornix (top row Fig. 4).
Excised imaging demonstrated that the endfolial pathway was sim-ilarly hyperintense compared with the fornix and contiguous with thestratum oriens. The myelin stain and its structural orientation map(Figs. 5C & D) confirms that the endfolial pathway does not join thealveus but traverses along its undersurface (Lim et al., 1997), similarto silver stains of the hippocampus ((Duvernoy, 2005), Chapter 3,Fig. 9). As seen in Fig. 5D, the EF pathway fibers within the hilar regionbegin deepwithin the hilus and point superomedially, then travel supe-riorly, then curve as they reach just inferior to the alveus and fornix,after which they travel in a left–right direction. In contrast, the fibersof the fornix and alveus, just superior to the EF, travel diagonally andhave a distinct and separable color orientation (Fig. 5D, lower panel).A portion of the perforant pathway likely at the subicular/CA 1 junctioncan be seen to progress in a similar diagonal orientation as the inferior-most EF.

Fig. 4. 3D rendering of hippocampal subfields. A–D show renderings of the left hippocampus in 4 different subjects. The bottom shows the same 4 subjects, with the view rotated tovisualize from above and the fornix and alveus removed.
5M.B. Parekh et al. / NeuroImage 112 (2015) 1–6
Discussion
In vivo imaging, ex vivo imaging and histology confirm that ahypointense structure within the central hippocampus corresponds tothe morphology of the human-unique endfolial pathway, a structureonly once ever reported in the literature. The high isotropic resolutionof the bSSFP scans enabled us to characterize the endfolial, an extremelysmall but possibly important pathway, in every subject we scanned.Weprovide validation by correlating our in vivo segmentation with higherresolution ex vivo imaging and histology.
Amajor strength of ourwork is the ultra-high isotropic resolution ofthe scans. Based on the scale bar in Fig. 1B from Lim's article (Lim et al.,1997), the EF pathway is atmost 0.3mm inwidth in the left–right direc-tion, which would make its observation difficult with resolutions muchlower than our data. In fact, even with this high resolution, thehypointense structure was not easily observed in all slices. The relative-ly mild hyperintensity of the structure may relate to partial voluming,the degree of myelination, and/or the orientation of the myelin (Liu,2010) given that it is oriented differently when compared to the fornix.
The EF pathway undulates about 2–3 times in each subject as shownin Fig. 4. This maybe a result of the digitations observed within the
Fig. 5.A) In vivo bSSFP scan, B) excised bSSFP scan, C)myelin stain in a hippocampal slice (frombottom row is zoomed in to show the junction of endfolial pathway, alveus, stratum oriens an
granular cell layer of thedentate gyrus, theCA1 and the subiculumas re-ported in dissection studies of the hippocampus (Kominami et al., 2013;Yasutaka et al., 2013).
With the advent of better technology and higher field-strength scan-ners, more groups are attempting to segment the hippocampus moreaccurately using higher resolution scans (Winterburn et al., 2013;Wisse et al., 2012; Yushkevich et al., 2010; Zeineh et al., 2012). Thisalso allows for segmenting white matter of the hippocampus such asthe stratum radiatum/lacunosum moleculare (Winterburn et al., 2013;Zeineh et al., 2012), whichmay aid in understanding different neurode-generative diseases (Brickman et al., 2012). For all subfields of the hip-pocampal body, except the EF pathway, our work adheres tohistologically outlined boundaries (Duvernoy, 2005; Insausti andAmaral, 2008) and thus we believe we can accurately segment out thehippocampus with our acquisition methodology. Our work adds toexisting hippocampal subfield segmentation protocols by preciselydefining the endfolial pathway, which should facilitate more detailedinvestigations of microstructure in theMTL. Additionally, further explo-ration of the EF pathway should impact mnemonic models of hippo-campal circuitry. Other groups have performed high resolution ex vivoscanning on hippocampus specimens (Augustinack et al., 2005;
the same specimen scanned for C. D) Structure tensor analysis of themyelin stain in C. Thed fornix.

6 M.B. Parekh et al. / NeuroImage 112 (2015) 1–6
Shepherd et al., 2006), however, characterization of the EF pathway isyet to be done.
Excised imaging and histology show that the EF pathway is in factseparate from the alveus and the fornix. However, Lim et al. studiedthe trajectory of this pathway in detail and suggest that the EF pathwayruns within the stratum oriens as they originate in the hilus, but thedensity of these fibers diminish substantially on reaching the CA2(Lim et al., 1997). They speculate that the fibers cross the pyramidalcell layer and move orthogonally out of the plane to continue furtherto be in contiguity with the Schaffer system. Given the limited informa-tion about this pathway, there is not currently a gold standard withregard to its topography. While the pathway is of unknown clinicalrelevance, the role may be significant given the importance of thehilus to hippocampal function.
Application may be limited by the long acquisition time, but thestructure is apparent (Fig. 3, blue arrows) at slightly lower imaging res-olutions that can be more easily achieved (0.6 mm isotropic, under12 minute acquisition) and exploring this will be the subject of our fu-ture work. Moreover, data acquisition at 7.0 T is of such high resolutionthat we can translate freely between in vivo, ex vivo and histology. Ourfuture work will also involve segmenting the EF pathway in diseasestates such as epilepsy and Alzheimer's disease. For studies whereobtaining higher resolution imaging data may not be possible, thus lim-iting quantitative volumetric analysis, qualitative assessment of thepresence, absence or abnormality of the pathway may still be per-formed. Additionally, studies of neurodegenerative diseases that in-volve the usage of excised specimens and histological analysis mayperhaps benefit from examining this pathway due to its prominencein the hippocampus.
Despite the complicated structure of the hippocampus, our workdemonstrates that ultra-high resolution in vivo scanning can be usedfor reliable segmentation of its subfields; even subfields that havescarcely been characterized in the past. Our work extends subfield seg-mentation by further segmenting the intricate white matter layers ofthe hippocampus. Additionallywe correlated our segmentation findingswith histology and reported an uncharacterized unique human path-way that was observed in vivo.
Acknowledgments
We would like to acknowledge GE Healthcare for their support,Ricardo Insausti for his discussion regarding the endfolial pathway,Markus Axer for his suggestions regarding the tensor structural analysis,and Sherveen Parivash for his comments on this manuscript.
References
Amaral, D.G., 1978. A Golgi study of cell types in the hilar region of the hippocampus inthe rat. J. Comp. Neurol. 182, 851–914.
Augustinack, J.C., van der Kouwe, A.J., Blackwell, M.L., Salat, D.H.,Wiggins, C.J., Frosch,M.P.,Wiggins, G.C., Potthast, A., Wald, L.L., Fischl, B.R., 2005. Detection of entorhinal layer IIusing 7 Tesla [corrected] magnetic resonance imaging. Ann. Neurol. 57, 489–494.
Budde, M.D., Frank, J.A., 2012. Examining brain microstructure using structure tensoranalysis of histological sections. Neuroimage 63, 1–10.
Burggren, A.C., Zeineh, M.M., Ekstrom, A.D., Braskie, M.N., Thompson, P.M., Small,G.W., Bookheimer, S.Y., 2008. Reduced cortical thickness in hippocampal subre-gions among cognitively normal apolipoprotein E e4 carriers. Neuroimage 41,1177–1183.
de No, R.L., 1934. Studies on the structure of the cerebral cortex II. Continuation of thestudy of the ammonic system. Journal Fur Psychologie Und Neurologie 46, 113–177.
Duvernoy, H., 2005. Brain anatomy.Magnetic Resonance in Epilepsy: Neuroimaging Tech-niques 2nd ed. pp. 29–97.
Griswold, M.A., Jakob, P.M., Heidemann, R.M., Nittka, M., Jellus, V., Wang, J., Kiefer, B.,Haase, A., 2002. Generalized autocalibrating partially parallel acquisitions (GRAPPA).Magn. Reson. Med. 47, 1202–1210.
Insausti, R., Amaral, D.G., 2008. Entorhinal cortex of the monkey: IV. Topographical andlaminar organization of cortical afferents. J. Comp. Neurol. 509, 608–641.
Kerchner, G.A., 2011. Ultra-high field 7 T MRI: a new tool for studying Alzheimer's dis-ease. J. Alzheimers Dis. 26 (Suppl. 3), 91–95.
Kerchner, G.A., Hess, C.P., Hammond-Rosenbluth, K.E., Xu, D., Rabinovici, G.D., Kelley, D.A.,Vigneron, D.B., Nelson, S.J., Miller, B.L., 2010. Hippocampal CA1 apical neuropil atro-phy in mild Alzheimer disease visualized with 7-T MRI. Neurology 75, 1381–1387.
Kominami, R., Shinohara, H., Yasutaka, S., Kishibe, M., 2013. The human hippocampus ob-served by scanning electron microscopy (SEM): the dentate gyrus ismade of an arrayof the neuronal lamellae. Okajimas Folia Anat. Jpn. 89, 157–164.
Kondo, H., Lavenex, P., Amaral, D.G., 2009. Intrinsic connections of the macaque monkeyhippocampal formation: II. CA3 connections. J. Comp. Neurol. 515, 349–377.
Lim, C., Mufson, E.J., Kordower, J.H., Blume, H.W., Madsen, J.R., Saper, C.B., 1997. Connec-tions of the hippocampal formation in humans: II. The endfolial fiber pathway.J. Comp. Neurol. 385, 352–371.
Liu, C., 2010. Susceptibility tensor imaging. Magn. Reson. Med. 63, 1471–1477.Mueller, S.G., Weiner, M.W., 2009. Selective effect of age, Apo e4, and Alzheimer's disease
on hippocampal subfields. Hippocampus 19, 558–564.Rezakhaniha, R., Agianniotis, A., Schrauwen, J.T., Griffa, A., Sage, D., Bouten, C.V., van de
Vosse, F.N., Unser, M., Stergiopulos, N., 2012. Experimental investigation of collagenwaviness and orientation in the arterial adventitia using confocal laser scanning mi-croscopy. Biomech. Model. Mechanobiol. 11, 461–473.
Rosene, D.L., Van Hoesen, G.W., 1977. Hippocampal efferents reach widespread areas ofcerebral cortex and amygdala in the rhesus monkey. Science 198, 315–317.
Scher, A.I., Xu, Y., Korf, E.S., White, L.R., Scheltens, P., Toga, A.W., Thompson, P.M., Hartley,S.W., Witter, M.P., Valentino, D.J., Launer, L.J., 2007. Hippocampal shape analysis inAlzheimer's disease: a population-based study. Neuroimage 36, 8–18.
Shepherd, T.M., Ozarslan, E., King, M.A., Mareci, T.H., Blackband, S.J., 2006. Structural in-sights from high-resolution diffusion tensor imaging and tractography of the isolatedrat hippocampus. Neuroimage 32, 1499–1509.
Winterburn, J.L., Pruessner, J.C., Chavez, S., Schira, M.M., Lobaugh, N.J., Voineskos, A.N.,Chakravarty, M.M., 2013. A novel in vivo atlas of human hippocampal subfieldsusing high-resolution 3 T magnetic resonance imaging. Neuroimage 74, 254–265.
Wisse, L.E., Gerritsen, L., Zwanenburg, J.J., Kuijf, H.J., Luijten, P.R., Biessels, G.J., Geerlings,M.I., 2012. Subfields of the hippocampal formation at 7 T MRI: in vivo volumetric as-sessment. Neuroimage 61, 1043–1049.
Witter, M.P., Amaral, D.G., 1991. Entorhinal cortex of the monkey: V. Projections tothe dentate gyrus, hippocampus, and subicular complex. J. Comp. Neurol. 307,437–459.
Yasutaka, S., Shinohara, H., Kominami, R., 2013. Gross anatomical tractography (GAT) pro-posed a change from the ‘Two laminae concept’ to the ‘Neuronal unit concept’ on thestructure of the human hippocampus. Okajimas Folia Anat. Jpn. 89, 147–156.
Yushkevich, P.A., Avants, B.B., Pluta, J., Das, S., Minkoff, D., Mechanic-Hamilton, D., Glynn,S., Pickup, S., Liu, W., Gee, J.C., Grossman, M., Detre, J.A., 2009. A high-resolution com-putational atlas of the human hippocampus from postmortem magnetic resonanceimaging at 9.4 T. Neuroimage 44, 385–398.
Yushkevich, P.A., Wang, H., Pluta, J., Das, S.R., Craige, C., Avants, B.B., Weiner, M.W.,Mueller, S., 2010. Nearly automatic segmentation of hippocampal subfields inin vivo focal T2-weighted MRI. Neuroimage 53, 1208–1224.
Zeineh, M.M., Holdsworth, S., Skare, S., Atlas, S.W., Bammer, R., 2012. Ultra-high resolu-tion diffusion tensor imaging of the microscopic pathways of the medial temporallobe. Neuroimage 62, 2065–2082.
Zeineh, M.M., Parekh, M.B., Zaharchuk, G., Su, J.H., Rosenberg, J., Fischbein, N.J., Rutt, B.K.,2014. Ultrahigh-resolution imaging of the human brain with phase-cycled balancedsteady-state free precession at 7 T. Invest. Radiol. 49, 278–289.