Ultimate Tensile Strength-Processing Relationships for Metal Matrix ...

ORIGINAL RESEARCH
Ultimate tensile strength of embedded I-sections: a comparisonof experimental and numerical results
Mahmoud Heristchian • Pouyan Pourakbar •
Saeed Imeni • M. Reza Adib Ramezani
Received: 19 May 2014 / Accepted: 6 November 2014 / Published online: 21 November 2014
� The Author(s) 2014. This article is published with open access at Springerlink.com
Abstract Exposed baseplates together with anchor bolts
are the customary method of connection of steel structures
to the concrete footings. Post-Kobe studies revealed that
the embedded column bases respond better to the earth-
quake uplift forces. The embedded column bases also, offer
higher freedom in achieving the required strength, rigidity
and ductility. The paper presents the results of the pullout
failure of three embedded IPE140 sections, tested under
different conditions. The numerical models are then, gen-
erated in Abaqus 6.10-1 software. It is concluded that, the
steel profiles could be directly anchored in concrete with-
out using anchor bolts as practiced in the exposed con-
ventional column bases. Such embedded column bases can
develop the required resistance against pullout forces at
lower constructional costs.
Keywords Steel section embedded in concrete � Pullout
test � Ultimate load � Numerical modelling
Introduction
Using exposed baseplates and anchor rods is a common
method for connection of steel columns to concrete foot-
ings. Alternative method for connection of steel columns to
concrete is by directly embedding them, with or without
end plates, as shown in Fig. 1. In such a structural solution,
the overall depth, the dimensions of the footing, the
embedding depth and details of the embedded steel element
are crucial factors for the load transfer and integrity of the
connection. In general, the steel element may be subjected
to axial compressive or tensile forces, as well as shear and
bending forces. The main sources of tensile force in a
column element are lateral actions such as wind or earth-
quake loads. Experimentally and numerically, the paper
deals with the ultimate response of the embedded steel
elements, of the type of Fig. 1, subjected to tensile actions
in the absence of shear and moments.
Significant failure of column baseplate connections have
been reported in major earthquakes, emphasising not only
the importance of their function but also the lack of
knowledge of their true behaviour. Based on post-Kobe
research, Hitaka et al. (2003), report that larger rotational
stiffness is expected for embedded column base than the
conventional baseplate connection. Further, they observed
that anchor bolts had fractured or elongated severely in
Kobe earthquake, whereas no damage was reported for the
embedded column connections. Figure 2, shows the pullout
failure of an exposed steel column base, in Kobe earth-
quake, Hitaka et al. (2003).
Nakashima (1992, 1996), Suzuki and Nakashima
(1986), Nakashima and Igarashi (1987) studied extensively
the behaviour of shallowly embedded column bases under
cyclic loading. They embedded the conventional exposed
column bases in reinforced concrete. They found that the
embedding depth and detailing of the reinforcement around
the embedded column base had significant effect on its
rigidity, strength and deformation. The deeply embedded
column bases, with he C2D (where he: embedding depth,
D: column width), could guarantee the full fixity of the
connections. Recommendations on this embedding depth
have been made for different column shapes, Morino et al.
(2003). Kohzu et al. (1991), studied very shallow embed-
ded steel column bases under vertical and horizontal
M. Heristchian (&) � P. Pourakbar � S. Imeni �M. R. A. Ramezani
Islamic Azad University, South Tehran Branch (IAU STB),
Tehran, Iran
e-mail: [email protected]
123
Int J Adv Struct Eng (2014) 6:169–180
DOI 10.1007/s40091-014-0077-y
loading. The general conclusion of the studies is that the
embedding of the base plate improves its seismic behaviour
by increasing the strength and ductility. The degree of the
improvement of the behaviour depends on parameters such
as the depth and details of the embedding reinforcement.
Recommendations have also been given for wide-flange
profiles with embedding depth ranging from 1D to 2D,
Pertold et al. (2000a, b).
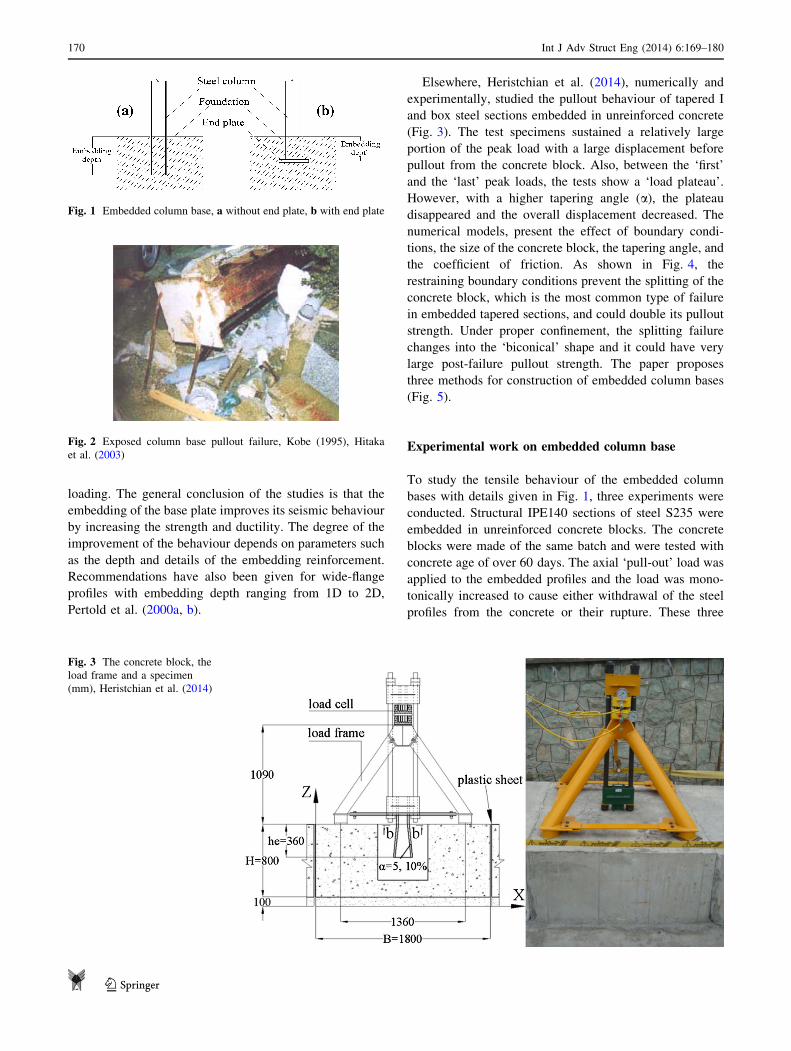
Elsewhere, Heristchian et al. (2014), numerically and
experimentally, studied the pullout behaviour of tapered I
and box steel sections embedded in unreinforced concrete
(Fig. 3). The test specimens sustained a relatively large
portion of the peak load with a large displacement before
pullout from the concrete block. Also, between the ‘first’
and the ‘last’ peak loads, the tests show a ‘load plateau’.
However, with a higher tapering angle (a), the plateau
disappeared and the overall displacement decreased. The
numerical models, present the effect of boundary condi-
tions, the size of the concrete block, the tapering angle, and
the coefficient of friction. As shown in Fig. 4, the
restraining boundary conditions prevent the splitting of the
concrete block, which is the most common type of failure
in embedded tapered sections, and could double its pullout
strength. Under proper confinement, the splitting failure
changes into the ‘biconical’ shape and it could have very
large post-failure pullout strength. The paper proposes
three methods for construction of embedded column bases
(Fig. 5).
Experimental work on embedded column base
To study the tensile behaviour of the embedded column
bases with details given in Fig. 1, three experiments were
conducted. Structural IPE140 sections of steel S235 were
embedded in unreinforced concrete blocks. The concrete
blocks were made of the same batch and were tested with
concrete age of over 60 days. The axial ‘pull-out’ load was
applied to the embedded profiles and the load was mono-
tonically increased to cause either withdrawal of the steel
profiles from the concrete or their rupture. These three
Fig. 1 Embedded column base, a without end plate, b with end plate
Fig. 2 Exposed column base pullout failure, Kobe (1995), Hitaka
et al. (2003)
Fig. 3 The concrete block, the
load frame and a specimen
(mm), Heristchian et al. (2014)
170 Int J Adv Struct Eng (2014) 6:169–180
123

specimens are referred to as M1, M2 and M3. The schematic
details of the test setup (plan and section) are presented in
Fig. 6. The embedding depth and the end conditions of the
IPE sections are given in Fig. 7. The embedding depths were
600, 400 and 200 mm for specimens M1, M2 and M3,
respectively. The specimen M1 did not have end plate but
the specimens M2 and M3 had end plate of size
200 9 200 9 15 mm. As it is seen in Fig. 6, the concrete
block had the height of 700 and width of 800 mm. The
thickness of the lean concrete beneath the concrete block
was 100 mm and the formwork of the concrete was brick-
work with a thickness of 100 mm. The characteristic com-
pressive strength of the concrete was 30 MPa. The surface
of the IPE steel sections did not receive any specific cleaning
treatment prior to embedding. This lack of treatment was to
simulate the real construction situation.
A hydraulic jack of nominal capacity 1500 kN was used
to pullout the IPE sections from the concrete. The jack
(support) reaction was transferred to the concrete at the
neighbouring zone of the embedded sections via two plates
of dimensions 600 9 100 mm. The IPE sections were
extended 200 mm above the concrete blocks (section A-A,
Fig. 6). Also, at the top of each section a load block
connected the structural section to the hydraulic jack. The
load blocks were made of steel plates 40 mm thickness and
were welded to the top of the I-sections. There were six
stiffeners welded to each structural I-section and the load
block. The vertical displacements were recorded on the
right and left sides of the load block (Fig. 7).
The tensile force, with a gradual increase, was applied to
the specimens M1 to M3, and the displacements of the top
of the specimens were recorded for load values. A
description of the results of the tests is presented as
follows.
Test M1
Figure 8, shows the load–displacement diagram for the
specimen M1. The diagram gives the records of the load
for the displacements at the left and right of the load block
of Fig. 7, together with their averages. Up to the load
560 kN the recorded displacements were less than 0.7 mm.
The average displacement of 8.2 mm was corresponding to
the maximum load of 682 kN. The displacement beyond
8.2 mm was not recorded. Figure 9a shows a general view
of the test setup, and Fig. 9b shows crushing of the con-
crete. Figure 9c shows the final pulled out stage of the
profile together with the peeling out and damage to the
paint of the section indicating the stretching of the profile.
This Figure also shows that the flange of the IPE section is
slightly bent inside and also has been slightly narrowed, as
seen against a straight block placed beside the pulled out
section.
Tests M2 and M3
The load–displacement diagrams for specimens M2 and
M3 are shown in Fig. 10. For test M2, the records
show significant differences for the right and left. This is
caused by unavoidable eccentricity of the setup such as
irregularities in the surfaces of contact, non-alignment ofFig. 4 Failure mechanisms under different boundary conditions,
Heristchian et al. (2014)
Fig. 5 Three methods for
construction of embedded
tapered column base,
Heristchian et al. (2014)
Int J Adv Struct Eng (2014) 6:169–180 171
123

the section and of the jack. The ultimate failure loads of the
tests were recorded to be 620 and 560 kN, for M2 and M3
tests, respectively. The breakage and failure of the profile
started from one side of the flange and significant peeling
of the painting of the flange was observed. The failures of
the specimens are shown in Fig. 11a, b for M2, and
Fig. 11c, d for M3. The remaining stubs of the specimens
are shown in Fig. 11b for M2 and Fig. 11c for M3. In
Fig. 11c, part of the crushed concrete around the profile has
been removed.
A discussion on the tests
The experiments were set up to acquire information on the
general and ultimate pullout strength of I-sections under three
different conditions. Therefore, it was not the aim of the tests
to provide information on the stress distribution along the
embedded profile. Further, though the displacements of the
top of the embedded (anchored) sections were recorded,
however, the main focus of the tests was to evaluate the final
‘strength’ of the specimens.
Fig. 6 Schematic details of test setup (plan and section)
Fig. 7 Section B–B of the experimental specimens M1 to M3
Fig. 8 Load–displacement diagram for specimen M1
172 Int J Adv Struct Eng (2014) 6:169–180
123

Fig. 10 Load–displacement diagrams for specimens M2 and M3
Fig. 11 Failure of specimens
M2 (a, b) and M3 (c, d)
Fig. 9 Pullout of specimen M1
Int J Adv Struct Eng (2014) 6:169–180 173
123

The specimen M1 had a combination of pulling out and
yielding, at the same time, it showed a smooth and ductile
behaviour. This specimen had identical section throughout
the embedded length. For this specimen, the bond strength
was the main resisting force against the pullout forces. The
knowledge of strain and slip distributions along the
embedded element, is the only way to get information on
the interface constitutive relation and it has been a matter
of study for several research workers. To discuss more on
the nature of the bond strength, consider Fig. 12, which
shows a number of steel elements embedded in concrete.
The elements have different shapes, but for each element
the cross-sectional shape is identical throughout the
embedding length. Suppose that, these elements are sub-
jected to a tensile (pullout) force. Most likely, the bond
stress distribution around the surface of the plain round
rebar S1, at a certain depth of embedment, say depth h, will
be the same. Similarly, the bond stress around the circular
hollow section S3, will be the ‘same’, due to axial sym-
metry, but it will have different values for inside and
outside surfaces (assuming that inside of the tube is also
filled with concrete). In fact, under slight pullout load, the
‘concrete column’ inside tube S3, will separate from
the main concrete, due to tensile stresses appearing at the
bottom of the embedded tube. The same situation occurs
for the concrete inside S4. For profiles S2, S4 and S5, there
is not any data showing that the two distinct points, p1 and
p2, would have the same bond stresses. Due to Poisson’s
effect, the bond stress around such sections will vary. For
symmetric sections such as round rebar or tube, the het-
erogeneous nature of the concrete and interference of the
aggregate size with the size of the section, could affect the
bond stress round the perimeter of the section at a certain
depth. Therefore, it is plausible that if, a slip data related to
a certain range of rebar size would be ‘exact’ for, say a
‘wire’ (plain small size) rebar, due to its diameter size
compared to the size of components of concrete. Presence
of the reinforcement in actual construction of footings is
another important factor which could affect the value of the
bond stress.
In this regard, one of the test results reported by Pertold
et al. (2000a) was to measure the bond strength between
steel sections and concrete. Three HEB100 structural pro-
files were embedded in concrete blocks and were subjected
to statically increasing pushout loads, till the signs of bond
slip between concrete and steel were observed, when the
specimens were considered failed. Dial gauges were used
to measure the relative displacement of the steel column
and the concrete base (near the point of the application of
the load).
It appears that there is no more literature regarding the
bond slip experiments on the embedded structural sec-
tions. However, a good number of test results have been
reported on plain rebars (Abrams 1913; Weathersby 2003;
Fabbrocino et al. 2002; Feldman and Bartlett 2005; Ver-
derame et al. 2009). In general, in the pullout tests the
amount of movement of the free end of the embedded bar
was measured, but in reference (Weathersby 2003) the
measurement of the strain was carried out at several
places along the length of the embedded bar. However,
applying this method to embedded steel elements would
face the difficulty that the shape and geometric dimen-
sions of the section might seriously affect the strain
measurements. Therefore, such information will be useful
only to a certain type (geometry) of the profile. In addi-
tion to the change in the shape (geometry) factor, which
could be present in the steel profile, the scale (size) factor,
would probably affect the results as well. In the light of
the above discussion, it will be useful to obtain data on
the global ultimate pullout behaviour of various embed-
ded shapes, parallel to obtaining information on its local
values of bond stress. Therefore, the experiments M1, M2
and M3, were devised more as a ‘field’ measurement/
experiment rather than having instrumented with delicate
measuring apparatus.
Both of the tests M2 and M3 ended up with the
breakage of the I-section under the tensile ultimate load
together with a slight moment. Therefore, the specimens
Fig. 12 A number steel sections embedded in concrete
Fig. 13 Resisting forces against pullout
174 Int J Adv Struct Eng (2014) 6:169–180
123
M2 and M3 which had end plates showed much higher
resistance against pulling out. Considering the fact that
the specimens M2 and M3 had 67 and 33 % of the
embedding length of the specimen M1, respectively, their
extra pullout resistance was provided by their end plates.
In comparison with test M1, the pullout behaviour of the
tests M2 and M3 could be considered as a brittle
behaviour.
Figure 13, shows three embedded steel elements
under tensile force T. In the case of C1, where the
surface of the steel element is parallel to the direction of
T, the resisting force Rs, is developed mainly by the
bond slip. The major component of Rs, is the shearing
stresses. In the case of C2, with the presence of the
(anchoring) end plate, a significant resisting component
Ra, is mobilised. The force Ra, is closely related to
compressive and punching resistance of concrete, and in
comparison to Rs, has higher unit stresses. Ozbolt et al.
(2005, 2007) and Ozbolt and Eligehausen 1990 have
presented finite element modelling of headed studs under
pullout forces. Also, Yeun et al. (2012), have experi-
mentally and numerically studied the headed studs. In
the modelling, the main mobilised force relates to Ra of
C2. In the case C3, the resistance of the inclined surface,
against the pullout forces, will incorporate both types of
bond slip (Rs), and anchoring (Ra), resistances. It could
be anticipated that, the values of the stresses on such a
surface depend on the inclination angle a.
A smooth rebar may be anchored by providing a type of
end hook, (Fabbrocino et al. 2002), or by fastening a nut…to its head (Eligehausen and Sawade 1989; Eligehausen
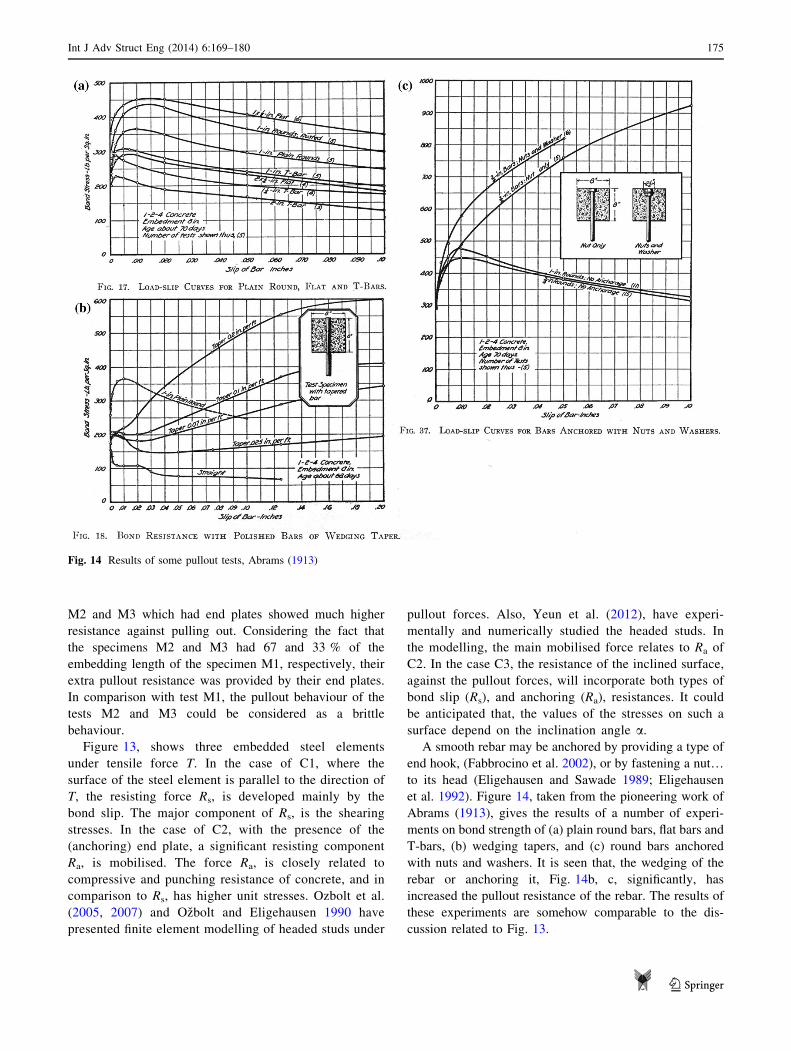
et al. 1992). Figure 14, taken from the pioneering work of
Abrams (1913), gives the results of a number of experi-
ments on bond strength of (a) plain round bars, flat bars and
T-bars, (b) wedging tapers, and (c) round bars anchored
with nuts and washers. It is seen that, the wedging of the
rebar or anchoring it, Fig. 14b, c, significantly, has
increased the pullout resistance of the rebar. The results of
these experiments are somehow comparable to the dis-
cussion related to Fig. 13.
Fig. 14 Results of some pullout tests, Abrams (1913)
Int J Adv Struct Eng (2014) 6:169–180 175
123
The numerical models
Numerical models were generated to simulate the pullout
tests for the experimental works mentioned in the paper.
First, two numerical models were generated based on the
results of the experimental works on the pullout strength of
the plain rebar. These models are named ‘A’ and ‘W’ and
are based on the data from the work of Abrams (1913), and
Weathersby (2003), respectively. Models A and W are used
to obtain the parameters related to the bond strength
between concrete and steel. Also, models M1 to M3 are
generated from respective tested specimens. Finally, model
P is generated based on the experiments by Pertold et al.
(2000b).
The modelling software is Abaqus 6.10-1 (2010), which
has the capability of modelling nonlinear behaviour of both
materials steel and concrete. The nonlinear dynamic
explicit method of analysis with consideration of material
and geometric nonlinearity is used. Also, the Abaqus ele-
ment C3D8R is used for the finite element modelling.
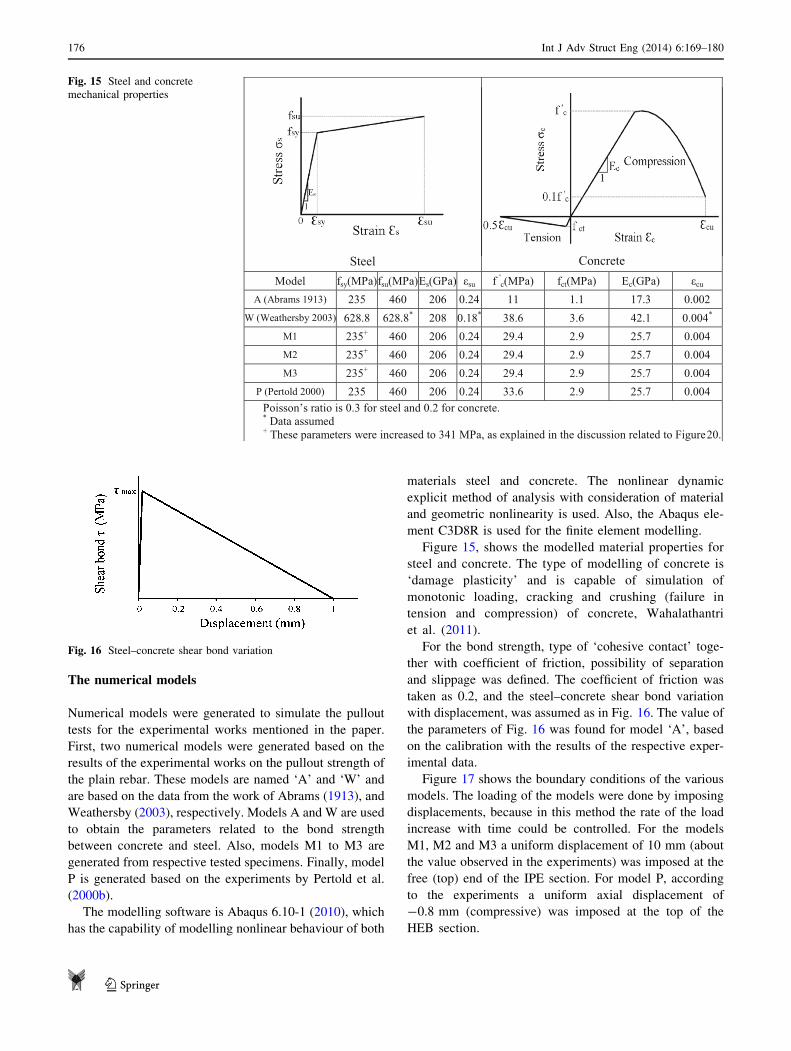
Figure 15, shows the modelled material properties for
steel and concrete. The type of modelling of concrete is
‘damage plasticity’ and is capable of simulation of
monotonic loading, cracking and crushing (failure in
tension and compression) of concrete, Wahalathantri
et al. (2011).
For the bond strength, type of ‘cohesive contact’ toge-
ther with coefficient of friction, possibility of separation
and slippage was defined. The coefficient of friction was
taken as 0.2, and the steel–concrete shear bond variation
with displacement, was assumed as in Fig. 16. The value of
the parameters of Fig. 16 was found for model ‘A’, based
on the calibration with the results of the respective exper-
imental data.
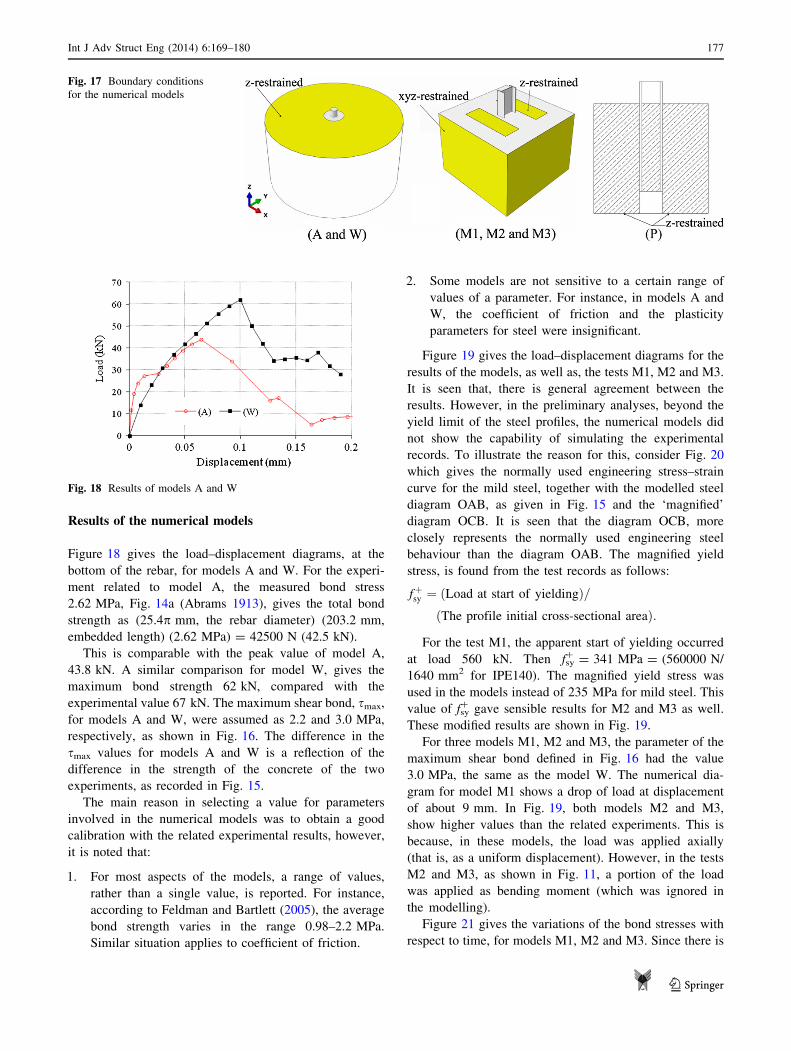
Figure 17 shows the boundary conditions of the various
models. The loading of the models were done by imposing
displacements, because in this method the rate of the load
increase with time could be controlled. For the models
M1, M2 and M3 a uniform displacement of 10 mm (about
the value observed in the experiments) was imposed at the
free (top) end of the IPE section. For model P, according
to the experiments a uniform axial displacement of
-0.8 mm (compressive) was imposed at the top of the
HEB section.
Steel ConcreteModel fsy(MPa)fsu(MPa)Es(GPa) εsu f 'c(MPa) fct(MPa) Ec(GPa) εcu
A (Abrams 1913) 235 460 206 0.24 11 1.1 17.3 0.002W (Weathersby 2003) 628.8 628.8* 208 0.18* 38.6 3.6 42.1 0.004*
M1 235+ 460 206 0.24 29.4 2.9 25.7 0.004M2 235+ 460 206 0.24 29.4 2.9 25.7 0.004M3 235+ 460 206 0.24 29.4 2.9 25.7 0.004
P (Pertold 2000) 235 460 206 0.24 33.6 2.9 25.7 0.004Poisson’s ratio is 0.3 for steel and 0.2 for concrete.* Data assumed+ These parameters were increased to 341 MPa, as explained in the discussion related to Figure20.
Fig. 15 Steel and concrete
mechanical properties
Fig. 16 Steel–concrete shear bond variation
176 Int J Adv Struct Eng (2014) 6:169–180
123
Results of the numerical models
Figure 18 gives the load–displacement diagrams, at the
bottom of the rebar, for models A and W. For the experi-
ment related to model A, the measured bond stress
2.62 MPa, Fig. 14a (Abrams 1913), gives the total bond
strength as (25.4p mm, the rebar diameter) (203.2 mm,
embedded length) (2.62 MPa) = 42500 N (42.5 kN).
This is comparable with the peak value of model A,
43.8 kN. A similar comparison for model W, gives the
maximum bond strength 62 kN, compared with the
experimental value 67 kN. The maximum shear bond, smax,
for models A and W, were assumed as 2.2 and 3.0 MPa,
respectively, as shown in Fig. 16. The difference in the
smax values for models A and W is a reflection of the
difference in the strength of the concrete of the two
experiments, as recorded in Fig. 15.
The main reason in selecting a value for parameters
involved in the numerical models was to obtain a good
calibration with the related experimental results, however,
it is noted that:
1. For most aspects of the models, a range of values,
rather than a single value, is reported. For instance,
according to Feldman and Bartlett (2005), the average
bond strength varies in the range 0.98–2.2 MPa.
Similar situation applies to coefficient of friction.
2. Some models are not sensitive to a certain range of
values of a parameter. For instance, in models A and
W, the coefficient of friction and the plasticity
parameters for steel were insignificant.
Figure 19 gives the load–displacement diagrams for the
results of the models, as well as, the tests M1, M2 and M3.
It is seen that, there is general agreement between the
results. However, in the preliminary analyses, beyond the
yield limit of the steel profiles, the numerical models did
not show the capability of simulating the experimental
records. To illustrate the reason for this, consider Fig. 20
which gives the normally used engineering stress–strain
curve for the mild steel, together with the modelled steel
diagram OAB, as given in Fig. 15 and the ‘magnified’
diagram OCB. It is seen that the diagram OCB, more
closely represents the normally used engineering steel
behaviour than the diagram OAB. The magnified yield
stress, is found from the test records as follows:
fþsy ¼ Load at start of yieldingð Þ=The profile initial cross-sectional areað Þ:
For the test M1, the apparent start of yielding occurred
at load 560 kN. Then fsy? = 341 MPa = (560000 N/
1640 mm2 for IPE140). The magnified yield stress was
used in the models instead of 235 MPa for mild steel. This
value of fsy? gave sensible results for M2 and M3 as well.
These modified results are shown in Fig. 19.
For three models M1, M2 and M3, the parameter of the
maximum shear bond defined in Fig. 16 had the value
3.0 MPa, the same as the model W. The numerical dia-
gram for model M1 shows a drop of load at displacement
of about 9 mm. In Fig. 19, both models M2 and M3,
show higher values than the related experiments. This is
because, in these models, the load was applied axially
(that is, as a uniform displacement). However, in the tests
M2 and M3, as shown in Fig. 11, a portion of the load
was applied as bending moment (which was ignored in
the modelling).
Figure 21 gives the variations of the bond stresses with
respect to time, for models M1, M2 and M3. Since there is
Fig. 18 Results of models A and W
Fig. 17 Boundary conditions
for the numerical models
Int J Adv Struct Eng (2014) 6:169–180 177
123

no end plate for test M1, therefore, all the pullout forces are
resisted by the bond stresses (contact friction). For model
M2, at the start, much of the resistance is provided by the
bond stresses, but when the displacement level is reached
0.15 mm, the role of the end plate (contact pressure) has
increased. At the end, about half the pullout tensile force is
resisted by the end plate. For model M3, the end plate came
into effect at the displacement level of 0.1 mm, and at the
end, about 3/4 of the load was transmitted by the end plate.
Figure 22, shows the stress distribution of the steel
sections for models M1, M2 and M3. In Fig. 22, the uni-
form necking of the models M2 and M3 is due to the
uniformly applied load (displacement).
Figure 23 represents the kinetic energy, as well as the
internal energy, with respect to time for one of the
models, namely M1. The diagram of the kinetic energy is
almost coincident with the horizontal axis. The low value
of the kinetic energy in Fig. 23, indicates that the rate of
loading for the model is within an acceptable range for a
static loading. This check is done for the other models as
well.
The diagrams of Fig. 24 show the results of analysis, at
the top of steel section, for model P together with the
related experimental results. It is seen that there is a fairly
good agreement between both results. For this model, smax
was 3.4 MPa.
Concluding remarks
The paper has studied the static pullout behaviour of
embedded steel sections. Three pullout experiments for
embedded IPE140 sections were conducted for this paper.
Also, a discussion was given on the bond slip and the
related experimental data. Then, numerical models of the
experimental works were studied with Abaqus 6.10-1
(2010). Based on the experimental and numerical studies in
this paper, the following remarks are made:
1. For specimen M1, that had identical cross-section
within the embedding length, the main resistance
source against pullout, was the bond stress.
2. The specimens M2 and M3 which had end plates, the
bearing strength related to the end plates actually came
into effect only after bond slippage occurred, see
‘contact pressure variations’ in Fig. 21.
Fig. 19 Load–displacement
diagrams for models M1, M2
and M3
Fig. 20 The normally used engineering and modelled behaviour of
steel
178 Int J Adv Struct Eng (2014) 6:169–180
123

3. As compared with experimental work, the numerical
models with appropriate data and suitable software
could simulate the tensile behaviour of an embedded
column base more economically. At present, due to
lack of enough numerical case studies, some param-
eters of the models have to be calibrated with
experimental work. In other words, the numerical
results are not ‘completely independent’ yet, and have
Fig. 22 Von Mises stresses (MPa) for models M1, M2 and M3
Fig. 21 Variations of the bond
stresses for models M1, M2 and
M3
Fig. 23 Variation of kinetic and internal energy for models M1 Fig. 24 Results for model P
Int J Adv Struct Eng (2014) 6:169–180 179
123

to be validated and verified. It is necessary that,
appropriate ranges and trends of variation of the
influential parameters for the numerical models to be
studied, such that the results of the models of the
already tested cases would not need calibration.
4. Despite the above remark, more experimental work is
required to acquire deeper understanding of the pullout
behaviour of embedded column bases. Tests having
jack supports (reactions) far from the ‘pull-out cone’
region of the embedded structural sections would
better simulate a static pullout condition in a real
column base. Also, more experiments are necessary
with varying geometries (and details) of embedded
structural sections.
Acknowledgments The support of IA University South Tehran
Branch is acknowledged. The authors also, wish to thank Messrs
Sepehr Spatial Structures Company and Mr Ali F. Khiabani for their
help and collaboration in carrying out the experimental work.
Open Access This article is distributed under the terms of the
Creative Commons Attribution License which permits any use, dis-
tribution, and reproduction in any medium, provided the original
author(s) and the source are credited.
References
Abaqus 6.10 (2010) Abaqus analysis user manual—Dassault Syste-
mes Simulia Corp
Abrams DA (1913) Test of bond between concrete and steel.
University of Illinois Bulletin No. 71, University of Illinois at
Urbana-Champaign Urbana, IL
Eligehausen R, Sawade G (1989) A fracture mechanics based
description of the pull-out behaviour of headed studs embedded
in concrete. In: Elfgren L (ed) Fracture mechanics of concrete
structures, Report of RILEM TC-90-FMA. Chapman and Hall,
London, pp 281–299
Eligehausen R, Bouska P, Cervenka V, Pukl R (1992) Size effect of
the concrete cone failure load of anchor bolts. In: Bazant ZP (ed)
FramCoS 1. Elsevier applied science, Breckenridge, pp 517–525
Fabbrocino G, Verderame G, Manfredi G, Cosenza E (2002)
Influence of smooth reinforcement on seismic capacity of joints
in RC GLD frames. University of Naples Federico II, Italy
Feldman LR, Bartlett FM (2005) Bond strength variability in pull-out
specimens with plain reinforcement. ACI Struct J 102(6):
860–867
Heristchian M, Motamedi M, Pourakbar P, Fadavi A (2014) Tensile
behaviour of tapered embedded column bases. Asian J Civil Eng
15(4):485–499
Hitaka T, Suitaa K, Kato M (2003) CFT Column Base Design and
Practice in Japan. In: Proceedings of the International Workshop
on Steel and Concrete Composite Construction (IWSCCC-2003),
Report No. NCREE-03-026, National Center for Research in
Earthquake Engineering, Taipei, Taiwan. pp 35–45
Kohzu I, Kaneta K, Fujii A, Fujii K, Kida T (1991) Experimental
study on very shallowly embedded type steel column-to-Footing
connections. J Struct Constr Eng AIJ 421:59–68
Morino S, Kawaguchi J, Tsuji A, Kadoya H (2003) Strength and
stiffness of CFT semi-embedded type column base. In: Proceed-
ings of the International Conference on Advances in Structure,
Sydney, Australia. pp 3–14
Nakashima S (1992) Mechanical characteristics of steel column-base
connections repaired by concrete encasement. In: Proceedings of
the Tenth World Conference on Earthquake Engineering,
Madrid, Spain, pp 5131–5136
Nakashima S (1996) Response of steel column bases embedded
shallowly into foundation beams. In: Proceedings of the
Eleventh World Conference on Earthquake Engineering, Aca-
pulco, Mexico
Nakashima S, Igarashi S (1987) Behaviour of steel square tubular
column bases of corner columns embedded in concrete footings.
In: Proceedings of International Conference on Steel and
Aluminium Structures, Cardiff. pp 376–385
Ozbolt J, Eligehausen R (1990) Numerical analysis of headed studs
embedded in large plain concrete blocks. Internal Report Nr.
4/10-90/9, Institut fur Werkstoffe im Bauwesen, Stuttgart
University, Germany
Ozbolt J, Kozar I, Eligehausen R, Periskic G (2005) Three-Dimen-
sional FE analysis of headed stud anchors exposed to fire. Comp
Concr 2(4):249–266
Ozbolt J, Eligehausen R, Periskic G, Mayer U (2007) 3D FE analysis
of anchor bolts with large embedment depths. Eng Fract Mech
74:168–178
Pertold J, Xiao RY, Wald F (2000a) Embedded steel column bases-I:
experiments and numerical simulation. J Constr Steel Res
56:253–270
Pertold J, Xiao RY, Wald F (2000b) Embedded steel column bases-II:
design model proposal. J Constr Steel Res 56:271–286
Suzuki T, Nakashima S (1986) An experimental study on steel
column bases consolidated with reinforced concrete studs: part
1–tests on steel column base under bending moment and
shearing force. J Struct Constr Eng AIJ 368:37–48
Verderame GM, Ricci P, De Carlo G, Manfredi G (2009) Cyclic bond
behaviour of plain bars. Part I: experimental investigation.
Constr Build Mater 23:3499–3511
Wahalathantri BL, Thambiratnam DP, Chan THT, Fawzia SA (2011)
Material model for flexural crack simulation in reinforced
concrete elements using abaqus. In: Proceedings of the First
International Conference on Engineering, designing and devel-
oping the built environment for sustainable wellbeing, Queens-
land University of Technology, Brisbane, Qld. pp 260–264
Weathersby JH (2003) Investigation of bond slip between concrete
and steel reinforcement under dynamic loading conditions. PhD
diss. Louisiana State University
Yeun KW, Hong KN, Kim J (2012) Development of a retrofit anchor
system for remodelling of building exteriors. Struct Eng Mech
44(6):839–856
180 Int J Adv Struct Eng (2014) 6:169–180
123