Ultimate Capacity of Innovative Cold-formed Steel Columnseprints.qut.edu.au/7620/1/7620.pdf · on...
29
1 This is the author version of article published as: Narayanan, S. and Mahendran, Mahen (2003) Ultimate Capacity of Innovative Cold- formed Steel Columns. Journal of Constructional Steel Research 59(4):pp. 489-508. Copyright 2003 Elsevier Ultimate Capacity of Innovative Cold-formed Steel Columns By S. Narayanan 1 and M. Mahendran 2 ABSTRACT This paper describes the distortional buckling behaviour of a series of innovative cold- formed steel columns. More than 15 laboratory experiments were undertaken first on these innovative steel columns of intermediate length under axial compression. All of these columns failed by distortional buckling with very little post-buckling strength. The section and buckling properties of the columns were determined using the finite strip analysis program THINWALL. The distortional buckling and nonlinear ultimate strength behaviour of the columns was investigated in detail using finite element analyses (ABAQUS). The finite element analyses included relevant geometric imperfections and residual stresses. The deflection and strain results from the experiments compared well with those from the analyses. The ultimate design load capacities were evaluated using the provisions of Australian Cold-formed Steel Structures Standard AS/NZS 4600-1996, and were compared with those from experiments and finite element analyses. A series of parametric studies was also carried out by varying the yield strength, thickness and column length. Details of this investigation and the results are presented in this paper. 1 – Visiting Academic, 2- Associate Professor of Civil Engineering, and Director, Physical Infrastructure Centre, School of Civil Engineering, Queensland University of Technology, Brisbane, QLD 4000, Australia
Transcript of Ultimate Capacity of Innovative Cold-formed Steel Columnseprints.qut.edu.au/7620/1/7620.pdf · on...

1
This is the author version of article published as: Narayanan, S. and Mahendran, Mahen (2003) Ultimate Capacity of Innovative Cold-
formed Steel Columns. Journal of Constructional Steel Research 59(4):pp. 489-508.
Copyright 2003 Elsevier Ultimate Capacity of Innovative Cold-formed Steel Columns
By S. Narayanan1 and M. Mahendran2
ABSTRACT
This paper describes the distortional buckling behaviour of a series of innovative cold-
formed steel columns. More than 15 laboratory experiments were undertaken first on
these innovative steel columns of intermediate length under axial compression. All of
these columns failed by distortional buckling with very little post-buckling strength.
The section and buckling properties of the columns were determined using the finite
strip analysis program THINWALL. The distortional buckling and nonlinear ultimate
strength behaviour of the columns was investigated in detail using finite element
analyses (ABAQUS). The finite element analyses included relevant geometric
imperfections and residual stresses. The deflection and strain results from the
experiments compared well with those from the analyses. The ultimate design load
capacities were evaluated using the provisions of Australian Cold-formed Steel
Structures Standard AS/NZS 4600-1996, and were compared with those from
experiments and finite element analyses. A series of parametric studies was also carried
out by varying the yield strength, thickness and column length. Details of this
investigation and the results are presented in this paper.
1 – Visiting Academic, 2- Associate Professor of Civil Engineering, and Director,
Physical Infrastructure Centre, School of Civil Engineering, Queensland University of
Technology, Brisbane, QLD 4000, Australia

2
1 INTRODUCTION
The use of cold-formed steel structures has increased rapidly in recent times due to
significant improvements to manufacturing technologies and development of thin, high
strength steels. The nominal yield strength of available steels ranges from 250 to 550
MPa while thicknesses less than 1 mm are commonly used. Cold-formed steel sections
have distinct structural stability problems, which are not observed in hot-rolled steel
sections. In steel compression members, three structural instability modes, namely
local, distortional and flexural / flexural – torsional buckling, are likely to occur.
Distortional buckling usually occurs in the flanges of channel or other sections if the lip
stiffener is inadequate to prevent its movement normal to the plane of the flange it
supports.
In the past, researchers have investigated the various buckling modes of commonly
used cold-formed steel sections. Hancock [1] presented a detailed study of a range of
buckling modes (local, distortional and flexural-torsional) in lipped channel sections.
He showed that the distortional mode of buckling may control the design for certain
geometries, especially those with rear flanges or lipped rear flanges. Lau and Hancock
[2] provided simple analytical expressions to allow the distortional buckling stress to be
calculated explicitly for any geometry of cross-section of thin-walled lipped channel
section columns. Lau and Hancock [3] provided design curves for sections where the
distortional buckling stress and yield stress were approximately equal. In these cases
the failure occurred before the elastic distortional buckling stress was reached. The
expressions derived by Lau and Hancock are now included in the Australian cold-
formed steel structures code AS/NZS 4600 [4].
Kwon and Hancock [5] studied simple lipped channels and a lipped channel with
intermediate stiffener under fixed boundary conditions. They chose section geometry
3
and yield strength of steel to ensure that a substantial post buckling strength reserve
occurs in the distortional mode for the test section.
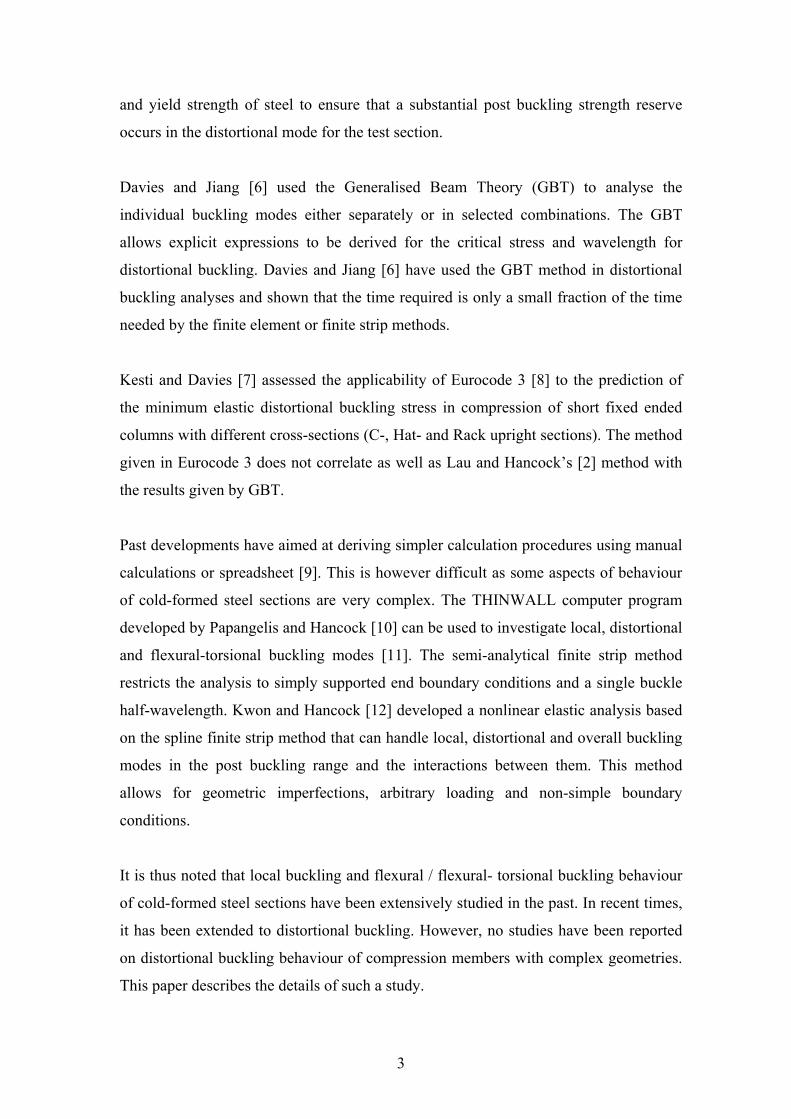
Davies and Jiang [6] used the Generalised Beam Theory (GBT) to analyse the
individual buckling modes either separately or in selected combinations. The GBT
allows explicit expressions to be derived for the critical stress and wavelength for
distortional buckling. Davies and Jiang [6] have used the GBT method in distortional
buckling analyses and shown that the time required is only a small fraction of the time
needed by the finite element or finite strip methods.
Kesti and Davies [7] assessed the applicability of Eurocode 3 [8] to the prediction of
the minimum elastic distortional buckling stress in compression of short fixed ended
columns with different cross-sections (C-, Hat- and Rack upright sections). The method
given in Eurocode 3 does not correlate as well as Lau and Hancock’s [2] method with
the results given by GBT.
Past developments have aimed at deriving simpler calculation procedures using manual
calculations or spreadsheet [9]. This is however difficult as some aspects of behaviour
of cold-formed steel sections are very complex. The THINWALL computer program
developed by Papangelis and Hancock [10] can be used to investigate local, distortional
and flexural-torsional buckling modes [11]. The semi-analytical finite strip method
restricts the analysis to simply supported end boundary conditions and a single buckle
half-wavelength. Kwon and Hancock [12] developed a nonlinear elastic analysis based
on the spline finite strip method that can handle local, distortional and overall buckling
modes in the post buckling range and the interactions between them. This method
allows for geometric imperfections, arbitrary loading and non-simple boundary
conditions.
It is thus noted that local buckling and flexural / flexural- torsional buckling behaviour
of cold-formed steel sections have been extensively studied in the past. In recent times,
it has been extended to distortional buckling. However, no studies have been reported
on distortional buckling behaviour of compression members with complex geometries.
This paper describes the details of such a study.

4
This study is part of a design project of civil engineering undergraduate students at
Queensland University of Technology (QUT) who were asked to design innovative and
economical open cold-formed steel column sections of 1000 mm length to resist an
axial compression load of 100 kN. The innovation was measured in terms of structural
efficiency and aesthetics. In designing the innovative and structurally efficient cold-
formed steel column sections, the principles followed were (1) Keeping the column
slenderness value (l/r) as small as possible to increase the overall buckling strength (2)
Keeping the plate slenderness value (b/t) within limits to eliminate local buckling. This
led to innovative columns that are unlikely to buckle locally (form factors closer to 1)
or globally (low l/r values). A total of 16 innovative steel columns designed by the
students were made using a press-braking process, and then tested to failure at QUT’s
Structures Laboratory. The buckling and ultimate strength behaviour of columns was
investigated using finite strip and finite element programs, and the results were
compared with experimental results and AS/NZS 4600 predictions.
2 EXPERIMENTAL STUDY
The 16 innovative 1000 mm long column sections were made of 0.8 mm and 0.95 mm
G550 steel and 0.96 mm and 1.14 mm G250 steel. The cross-sections of the steel
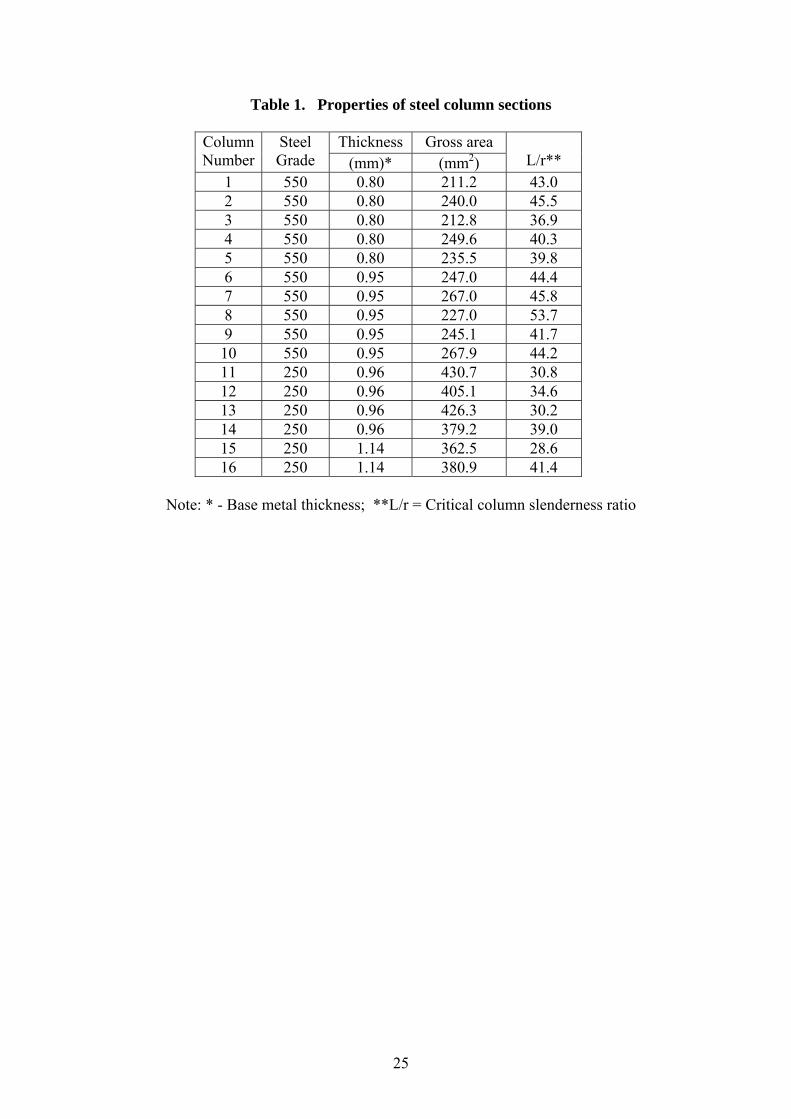
columns and their properties are shown in Figure 1 and Table 1, respectively. Column 1
was also tested in lengths of 876 mm, 675 mm, 475 mm, 275 mm, 130 mm and 100
mm. The steel column sections were placed between the cross-heads of a compression
testing machine and loaded to failure. The test set-up is shown in Figure 2. The ultimate
loads and the nature of failure were noted (Table 4). For the purpose of validation of
numerical models, the axial deformations and strains at mid-height for the locations
shown in Figure 3 were measured. The failures of all the columns were found to be
associated with distortional buckling except for the 130 mm and 100 mm columns,
which failed in local buckling.
Most of the columns tested are innovative and practical while some may not be
considered practical. Based on the experimental ultimate strength to weight ratios,
Column 8 was found to be the most efficient section. As anticipated, columns made of
5
higher grade steel (G550) were more efficient than those made of lower grade steel
(G250).
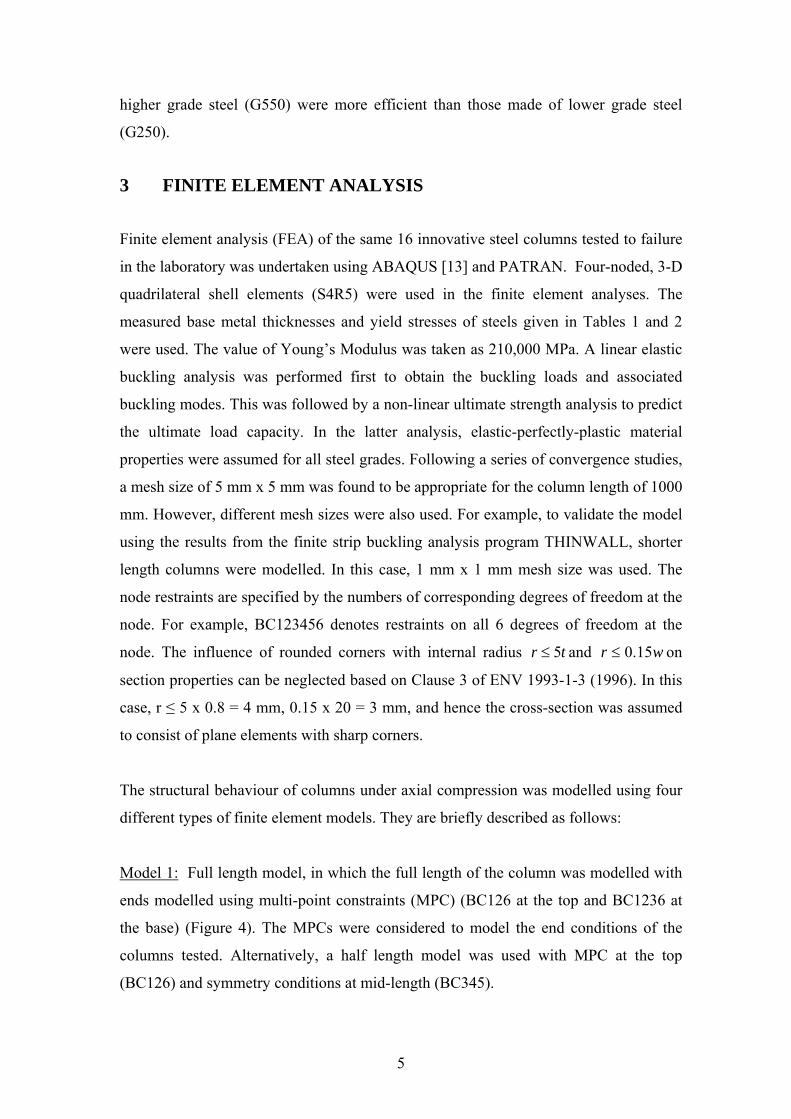
3 FINITE ELEMENT ANALYSIS Finite element analysis (FEA) of the same 16 innovative steel columns tested to failure
in the laboratory was undertaken using ABAQUS [13] and PATRAN. Four-noded, 3-D
quadrilateral shell elements (S4R5) were used in the finite element analyses. The
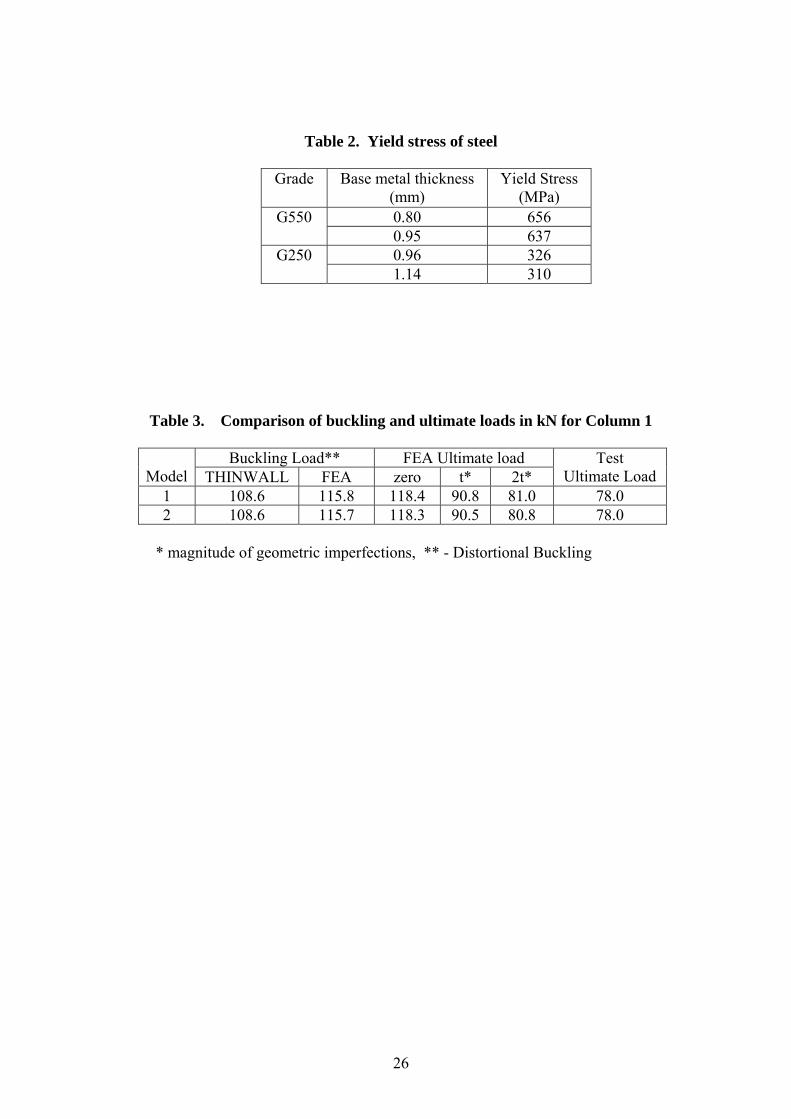
measured base metal thicknesses and yield stresses of steels given in Tables 1 and 2
were used. The value of Young’s Modulus was taken as 210,000 MPa. A linear elastic
buckling analysis was performed first to obtain the buckling loads and associated
buckling modes. This was followed by a non-linear ultimate strength analysis to predict
the ultimate load capacity. In the latter analysis, elastic-perfectly-plastic material
properties were assumed for all steel grades. Following a series of convergence studies,
a mesh size of 5 mm x 5 mm was found to be appropriate for the column length of 1000
mm. However, different mesh sizes were also used. For example, to validate the model
using the results from the finite strip buckling analysis program THINWALL, shorter
length columns were modelled. In this case, 1 mm x 1 mm mesh size was used. The
node restraints are specified by the numbers of corresponding degrees of freedom at the
node. For example, BC123456 denotes restraints on all 6 degrees of freedom at the
node. The influence of rounded corners with internal radius tr 5≤ and wr 15.0≤ on
section properties can be neglected based on Clause 3 of ENV 1993-1-3 (1996). In this
case, r ≤ 5 x 0.8 = 4 mm, 0.15 x 20 = 3 mm, and hence the cross-section was assumed
to consist of plane elements with sharp corners.
The structural behaviour of columns under axial compression was modelled using four
different types of finite element models. They are briefly described as follows:
Model 1: Full length model, in which the full length of the column was modelled with
ends modelled using multi-point constraints (MPC) (BC126 at the top and BC1236 at
the base) (Figure 4). The MPCs were considered to model the end conditions of the
columns tested. Alternatively, a half length model was used with MPC at the top
(BC126) and symmetry conditions at mid-length (BC345).

6
Model 2: Full length model with the cross-head of the compression testing machine
being modelled as a rigid surface at the ends of the column (referred to as rigid body
model). The rigid surface was modelled using rigid body elements (R3D4). The
reference node for the rigid surface was located at the centroid of the surface and had
BC126 at the top and BC1236 at the base (Figure 5). Alternatively, a half length model
was used with R3D4 elements at the top (BC126) and symmetry conditions at mid-
length (BC345).
Model 3: Half wavelength model based on the half wave buckling length of the column.
The ends were modelled using MPC.
Model 4: Half wavelength model based on the half wave buckling length of the column.
The ends were modelled using a rigid surface using R3D4 elements.
Detailed investigations showed that both the MPC and rigid body models (Models 1
and 2) were suitable for modelling global buckling behaviour of compression members.
Figure 6a shows how the MPC and rigid surface rotate as a plane surface at the ends
simulating pinned end conditions. Hence both the above types are also suitable for
modelling half wavelength models for global buckling.
The rigid body models (Models 2 and 4) were found to be suitable for local buckling
behaviour of compression members as shown in Figure 6b. However, the MPC model
was found to be unsuitable for modelling local buckling behaviour due to additional
restraints caused by MPC.
It was seen that both MPC and rigid body elements in Models 1 and 2 simulated the
actual test conditions for distortional buckling behaviour. The cross-heads of the testing
machine offered restraint against lateral movement of the column ends. This restraint
against opening out of the lips at the ends was provided by the MPC and rigid body
elements. Hence they were suitable for the full and half length experimental models
(Models 1 and 2). However, they were not suitable when half-wavelength models
(Models 3 and 4) are used for distortional buckling mode. The MPC and rigid body
elements were also not suitable with half wavelength models in modelling mixed
buckling modes (flexural – torsional and local –distortional buckling modes).

7
The results obtained using the different finite element models are compared with the
distortional buckling loads from THINWALL and the ultimate loads from tests for
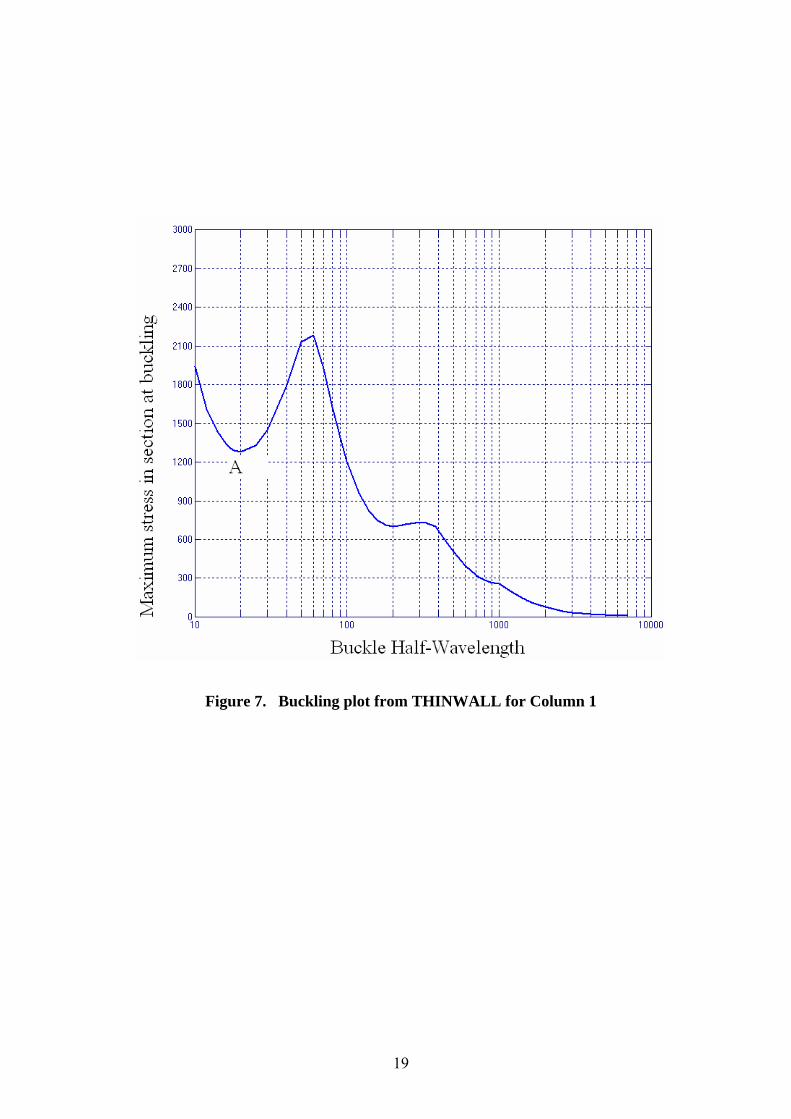
Column 1 in Table 3. The buckling results from THINWALL are shown in Figure 7.
The elastic critical stress for local buckling of plate elements is given by
( )2
2
2
112⎟⎠⎞
⎜⎝⎛
−=
wtEkf
υπ (1)
where k = 4.0 for simply supported plates, E = Young’s modulus, υ = Poisson’s ratio, t
= thickness of the element and w = width of the plate element.
The critical local buckling stress determined using Equation 1 for the most slender plate
element of Column 1 is 1215 MPa. This local buckling stress is lower than the result
from the finite strip analysis program THINWALL (1284 MPa from point A on Figure
7) as it considers the restraints provided by the adjacent plates. The finite strip analysis
results in Figure 7 showed that Column 1 buckles distortionally for half wavelengths
from about 60 mm to 1200 mm. Local buckling occurs for half wavelengths less than
60 mm whereas overall flexural buckling occurs for half wavelengths greater than 1200
mm. The FEA using Models 1 and 2 of 1000 mm long Column 1 gave distortional
buckling stress results that agreed well with the buckling stress from Figure 7
corresponding to the half wavelength observed in the finite element models (see Figure
8 and Table 3). The half wavelength, allowing for the restraints, can be obtained from
the deflected shape of the model.
Following the use of four different types of finite element models in which Models 1
and 2 gave very close results (Table 3), it was then decided to use half length models
with MPC (Model 1) to simulate the distortional buckling behaviour of all the 16
columns observed in the tests. Elastic distortional buckling loads from these FEA
compared well with THINWALL predictions as shown later in Table 5.
In the nonlinear analysis, initial geometric imperfections were modelled by providing
initial out-of-plane deflections to the model. The first elastic buckling mode shape was
used to create the geometric imperfections for the non-linear analysis. The maximum

8
amplitude of the buckled shape determined the degree of imperfection. For distortional
buckling modes, the imperfection was specified in terms of thickness. The maximum
value of distortional imperfection was initially taken as approximately equal to the plate
thickness t as recommended by Schafer and Pekoz [14]. Kwon and Hancock [5] found
that the geometric imperfections of press-braked 1.2 mm G500 lipped channel columns
were in the range of -1.5 mm to 1.0 mm (distortional) and -0.5 to 0.5 mm (overall).
These confirm Schaefer and Pekoz’s [14] recommendation for distortional
imperfection, however, in this study two geometric imperfection magnitudes, t and 2t,
were included to investigate the effects of such imperfections. Kwon and Hancock [5]
found that the overall imperfections had little effect on the buckling of the columns of
intermediate length since these columns generally buckled in a local, distortional or
mixed mode of local and distortional buckling. This study therefore did not include any
overall imperfections in the FEA.
Modelling imperfections for local buckling was undertaken by using imperfection
values of 167w by Schafer and Pekoz [14]. To study the effect of variations in
imperfections on the ultimate load, imperfection magnitudes of 167w and
1672w were used
in the nonlinear analyses. These values of imperfections are comparable with the upper
limit recommended by the BS 5950 formula [15]:
Ef
tw
tyc ⎟
⎠⎞
⎜⎝⎛= 145.0
δ (2)
where
=cδ Imperfection value
t = thickness of the member
w = width of a plate element of the member
fy = Yield strength of the material
E = Young’s modulus
For a 20 mm wide plate with 0.8 mm thickness, this value is 0.2 mm using Equation 2
as against the values of 0.12 mm (167w ) and 0.24 mm (
1672w ) used in this study.

9
The plot of the ratio of the non-linear ultimate load (with zero imperfection) to the
buckling load for each column versus the square root of the ratio of yield stress to the
buckling stress is shown in Figure 9. From the figure it can be seen that as the
slenderness (i.e. square root of the ratio of the yield stress to the buckling stress)
increases, the post buckling strength increases. This agrees well with the observations
made by Lau and Hancock [3] for channel section columns.
The residual stresses have also been included in the nonlinear analyses although their
effect on the ultimate load is considered small [14]. In cold-formed steel members,
residual stresses are dominated by flexural or through the thickness variation of
stresses. These residual stresses lead to early yielding on the faces of steel plates.
Residual stresses are idealised into flexural and membrane stresses. Membrane stresses
are more prevalent in roll-formed members than press-braked members. Flexural
residual stresses of up to 50% yield stress (fy) have been observed [14]. However, both
these values are highly variable. The average residual stress distribution recommended
by Schafer and Pekoz [14] for a press-braked lipped C-section is shown in Figure 10.
For this study an average flexural residual stress value of 17% fy has been applied
uniformly to all the plate elements of the columns. The variation of flexural residual
stress through the thickness was assumed to be linear with zero stress at the centre. It is
assumed that the higher residual stress at the corners is compensated by the increased
yield strength at the same location. Since the membrane residual stress is significantly
less than the flexural residual stress, the former has been ignored.
The residual stresses were modelled using the ABAQUS *INITIAL CONDITIONS
option with TYPE=STRESS, USER. The user defined initial stresses were created
using the SIGINI Fortran user subroutine. It was ensured that the residual stresses were
correctly defined with tension on the outside faces and compression on the inside faces.
The initial stresses were applied in a * STATIC step with no loading and the standard
model boundary conditions to allow equilibration of the initial stress field before
starting the response history. Table 4 compares the FEA ultimate load capacities of the
columns with and without residual stresses with the test ultimate load.

10
4 COMPARISON OF EXPERIMENTAL AND FEA RESULTS
Table 4 shows that the finite element models give good predictions of the ultimate
loads of the columns tested. When the imperfection magnitude was assumed equal to
the plate thickness t, the FEA predictions were on average about 6% higher than the test
loads (mean of 1.06) with a COV of 0.127 and a maximum error of 28% (overpredicts).
The use of an imperfection of 2t gave lower ultimate loads with a mean of 0.972 and
COV of 0.142 (without residual stresses), but the maximum error was 30%
(underpredicts). The table shows that the change in ultimate load produced by the effect
of including residual stresses is very small. When imperfection value is t, the addition
of residual stresses improved the prediction by lowering the mean value to 1.034 with a
COV of 0.117. The maximum overprediction is 28% and maximum underprediction is
16%. For the imperfection value of 2t, when residual stresses are also included, the
corresponding values are 0.956, 0.128 and 30%. Some sections appear to be more
sensitive to imperfections than others, for example, the ultimate capacity of Column 6
reduces drastically on application of imperfection, from 139.8 kN to 78.2 kN (for
imperfection t) and 66.6 kN (for imperfection 2t). Similarly, Column 15 is also seen to
be sensitive to imperfections. These observations clearly show that cold-formed steel
columns with certain geometries will be very sensitive to geometrical imperfections and
thus demonstrate the need to include appropriate geometrical imperfection magnitudes
in FEA. It is noted that except for Column 1, FEA using a geometrical imperfection of t
gives good comparisons with test results. From these observations, it can be concluded
that using a maximum distortional imperfection value of t as recommended by Schafer
and Pekoz [14] appears to be satisfactory.
Figure 11 compares the axial compression load versus shortening curves of the test and
FEA for Column 1 whereas Figure 12 compares the test and FEA strain curves. These
curves show reasonably good agreement between the test and FEA results.
5 DESIGN CODE PREDICTIONS
AS/NZS 4600 (SA, 1996) includes provisions for distortional buckling that are based
on research including testing of rack and C-sections by Lau and Hancock [3] and Kwon

11
and Hancock [12]. Nominal member capacity (Nc) of the sections subjected to
distortional buckling is given by:
⎥⎦
⎤⎢⎣
⎡−=
od
yyc f
fAfN
41 when
2y
od
ff > (3)
⎥⎥
⎦
⎤
⎢⎢
⎣
⎡+⎟
⎟⎠
⎞⎜⎜⎝
⎛−= 237.06.3055.0
2
od
yyc f
fAfN when
213y
ody f
ff
≤≤ (4)
where A = gross area, fy = yield stress, fod = elastic distortional buckling stress,
The member capacities (or ultimate load) based on distortional buckling were
calculated using Equations 3 and 4 for all the test columns and are given in Table 5. For
G550 steel columns with less than 0.9 mm thickness, 75% fy was used in the capacity
calculations as recommended by AS/NZS 4600.
Table 5 also includes the buckling loads predicted by the FEA and THINWALL as the
corresponding distortional buckling stress (fod) was used in the AS/NZS 4600 ultimate
load calculations. Comparison of FEA and test ultimate loads with AS/NZS 4600
predictions in Table 5 shows that AS/NZS 4600 over-predicts the ultimate loads by up
to 32% and 12% for G550 and G250 steel columns whereas it under-predicts the
ultimate loads by up to 1% and 15% for the same columns. When 0.75 fy was used in
the calculations for 0.8 mm G550 steel columns, the predictions were improved, giving
an average ratio of 1.061 and a COV of 0.121. This observation justifies the use of
AS/NZS 4600 rule of using 0.75 fy for G550 steels with less than 0.9 mm thickness. It
is also seen that the mean ratio of AS/NZS 4600 ultimate load to the FEA ultimate load
(with residual stresses and imperfection value of t) improved from 1.088 (with COV of
0.109) to 1.033 (with COV of 0.131) when 0.75fy was used. However, this rule was not
used for 0.95 mm G550 steel columns, and in this case the code over-predicted the
ultimate load by up to 32% (see Table 5). There were also other cases when over-
prediction of more than 20% occurred. This might have been either due to the
inadequacy of using 0.75fy for G550 steels or of the design equations in predicting
ultimate strengths for distortional buckling. Further experimental and numerical
research is needed to improve this.
12
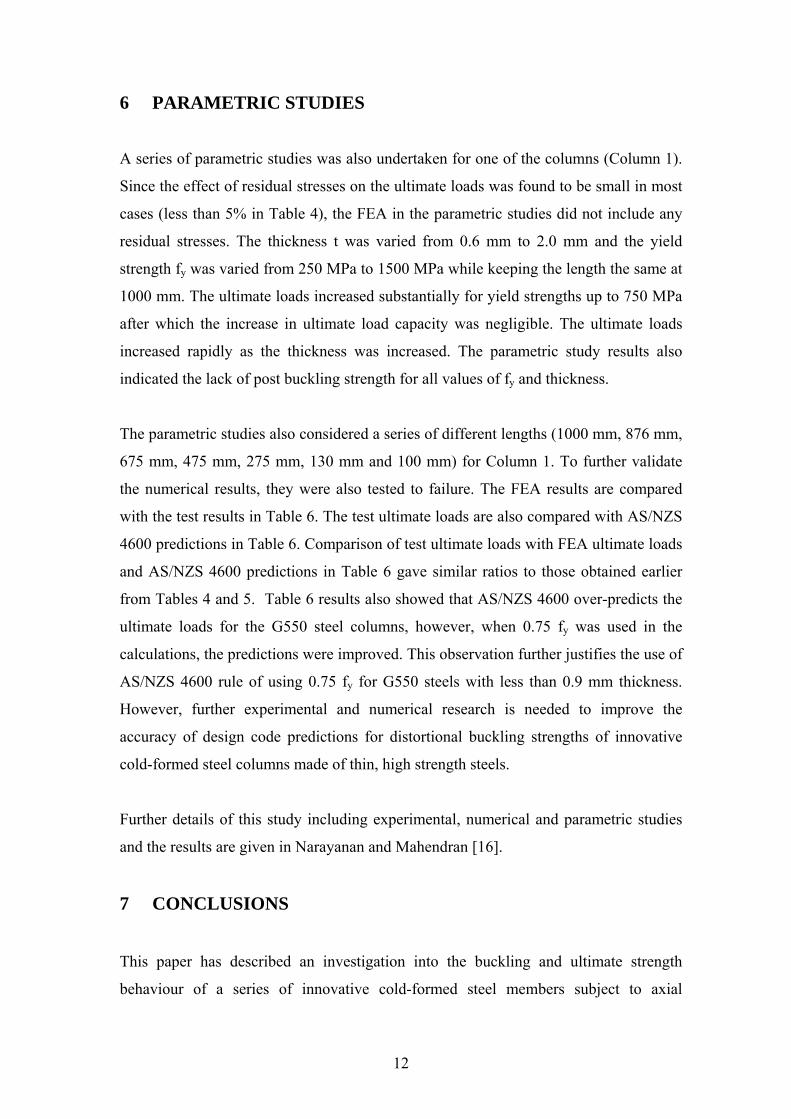
6 PARAMETRIC STUDIES
A series of parametric studies was also undertaken for one of the columns (Column 1).
Since the effect of residual stresses on the ultimate loads was found to be small in most
cases (less than 5% in Table 4), the FEA in the parametric studies did not include any
residual stresses. The thickness t was varied from 0.6 mm to 2.0 mm and the yield
strength fy was varied from 250 MPa to 1500 MPa while keeping the length the same at
1000 mm. The ultimate loads increased substantially for yield strengths up to 750 MPa
after which the increase in ultimate load capacity was negligible. The ultimate loads
increased rapidly as the thickness was increased. The parametric study results also
indicated the lack of post buckling strength for all values of fy and thickness.
The parametric studies also considered a series of different lengths (1000 mm, 876 mm,
675 mm, 475 mm, 275 mm, 130 mm and 100 mm) for Column 1. To further validate
the numerical results, they were also tested to failure. The FEA results are compared
with the test results in Table 6. The test ultimate loads are also compared with AS/NZS
4600 predictions in Table 6. Comparison of test ultimate loads with FEA ultimate loads
and AS/NZS 4600 predictions in Table 6 gave similar ratios to those obtained earlier
from Tables 4 and 5. Table 6 results also showed that AS/NZS 4600 over-predicts the
ultimate loads for the G550 steel columns, however, when 0.75 fy was used in the
calculations, the predictions were improved. This observation further justifies the use of
AS/NZS 4600 rule of using 0.75 fy for G550 steels with less than 0.9 mm thickness.
However, further experimental and numerical research is needed to improve the
accuracy of design code predictions for distortional buckling strengths of innovative
cold-formed steel columns made of thin, high strength steels.
Further details of this study including experimental, numerical and parametric studies
and the results are given in Narayanan and Mahendran [16].
7 CONCLUSIONS
This paper has described an investigation into the buckling and ultimate strength
behaviour of a series of innovative cold-formed steel members subject to axial

13
compression. Both laboratory experiments and numerical analyses were used to study
their structural behaviour dominated by distortional buckling. Effects of geometrical
imperfections and residual stresses on the ultimate load were investigated. It was found
that residual stresses had only a very small effect on the ultimate load. The ultimate
strength results from experiments, finite element analyses and the design standard were
compared, and appropriate recommendations were made. A series of parametric studies
was also carried out by varying the yield strength, thickness and length of columns, and
these results are also included in this paper. This investigation has shown that further
research is needed to improve the accuracy of design code predictions for distortional
buckling strengths of innovative cold-formed steel columns made of thin, high strength
steels.
8 ACKNOWLEDGEMENTS
The authors wish to thank the Physical Infrastructure Centre and the School of Civil
Engineering at Queensland University of Technology for providing the required
facilities and technical support for this research project. They also wish to thank the
TKM College of Engineering of the Kerala University and the Faculty of Built
Environment and Engineering, QUT for supporting the first author’s study leave
program at QUT during 2001.
References [1] Hancock GJ. Distortional buckling of steel storage rack columns. J Struct Engng,
1985;111(12): 2770-2783.
[2] Lau SCW, Hancock GJ. Distortional buckling formulas for channel columns. J
Struct Engng, ASCE 1987; 113(5): 1063-1078.
[3] Lau SCW, Hancock GJ. Inelastic buckling of channel columns in the distortional
mode. Thin-Walled Struct J 1990; 59-84.
[4] Standards Australia (SA), Australian/ New Zealand Standard AS/NZS 4600. Cold
formed steel structures, Sydney. 1996.
[5] Kwon YB, Hancock GJ. Tests of cold-formed channels with local and distortional
buckling. ASCE J of Struct Engng. 1992, 117(7):1786-1803.

14
[6] Davies JM, Jiang C. Design for distortional buckling. J Construct Steel Res.
1998,46:174-175.
[7] Kesti J, Davies JM. Local and distortional buckling of thin-walled short columns.
Thin-Walled Struct. 1999,34: 115-134.
[8] ENV 1993-1-3:1996/AC European Pre-standard Design of Steel Structures-Part 1-3:
General rules - Supplementary rules for cold formed thin gauge members and
sheeting,1996.
[9] Davies JM. Modelling, analysis and design of thin-walled steel structures. Light-
Weight Steel and Aluminium Structures, (P.Makelainen and P.Hassinen, editors),
Elsevier Science Ltd. 1999.
[10] Papangelis JP, Hancock GJ. Computer analysis of thin-walled structural members.
Computers and Structures. 1995,56, 1, 157 – 176.
[11] University of Sydney, THIN-WALL - Users Manual. 1996.
[12] Kwon YB, Hancock GJ. A nonlinear elastic spline finite strip analysis for thin-
walled sections. Thin-Walled Struct. 1991,12:295-319.
[13] HKS, Introduction to ABAQUS/ Standard, USA, Hibbitt, Karlsson &Sorenson,
Inc. 1998.
[14] Schafer BW, Pekoz T. Computational modelling of cold-formed steel:
characterizing geometric imperfections and residual stresses. J Construct Steel Res.
1998,47: 193-210.
[15] British Standards Institution (BSI), BS 5950-5, Structural use of steel work in
building - Code of Practice for design of cold formed thin gauge sections. 1998.
[16] Narayanan S, Mahendran M. Ultimate capacity of innovative cold-formed steel
columns. Research Monograph 2001-6, Physical Infrastructure Centre, Queensland
University of Technology, Brisbane. 2001.

15
20 15 15 20 7
20 10 20 20 10
18 30O 7, 45O
20 6 6
Column 1
Column 2
Column 3
Column 4
20 26 6 6 26
30 30 30 40 40 14.5 14.5
15 15 22 22 22 25 22 22 25 25
23 35o 23 8 8 23 55o
Column 5
Column 6
Column 7
Column 8
24 9 45O 24 6
30 20 15 20 15 25 6 25 40 25
30 30 60O 12 30
25 30 25 10 8, 45O
Column 9
Column 10
Column 11
Column 12
35 45O 35 12 12
10 15 10 20 20 30 20, 45O 30 20 10
49 49 46 46 129O 46 18 18 46
30 30 25
30 10 45O
Column 13
Column 14
Column 15
Column 16
Figure 1. Section geometries of the innovative steel columns (All dimensions are measured values in mm)
20
20
450

16
Figure 2. Test set up
0 1
Figure 3. Locations of strain measurement for Column 1

17
Shell elements (S4R5) Rigid beam elements joining nodes with MPC
Figure 4. Column ends modelled using MPC
Shell elements (S4R5) Rigid surface used to model the ends using R3D4 elements with load applied at section centroid
Figure 5. Column ends modelled using R3D4 elements

18
(a) Global buckling
(b) Local buckling
Figure 6. Use of MPC and rigid body elements in FEA
19
Figure 7. Buckling plot from THINWALL for Column 1

20
FEA Test
Figure 8. Distortional buckling of Column 1 from FEA and Test

21
0
0.2
0.4
0.6
0.8
1
1.2
1.4
0 0.5 1 1.5
SQRT(Yield stress/Buckling stress)
Ulti
mat
e L
oad/
Buc
klin
g Lo
ad
Figure 9. Plot of Ultimate Load/Buckling Load Vs SQRT (Yield Stress/Buckling
Stress)

22
Figure 10. Average flexural residual stress as a percentage of fy [14]

23
0
10
20
30
40
50
60
70
80
90
100
0 0.5 1 1.5 2 2.5 3 3.5
Axial shortening (mm)
Axi
al C
ompr
essi
on L
oad
(kN)
FEAExp
Figure 11. Axial compression load Vs Shortening curve for Column 1

24
0
10
20
30
40
50
60
70
80
90
100
-0.0025 -0.002 -0.0015 -0.001 -0.0005 0
Strain
Axi
al C
ompr
essi
on L
oad
(kN)
FEAExp
(a) Location 0
0
10
20
30
40
50
60
70
80
90
100
-0.0025 -0.002 -0.0015 -0.001 -0.0005 0
Strain
Axia
l Com
pres
sion
Loa
d (k
N)
FEAExp
(b) Location 1
Figure 12. Axial compression load vs Strain curves for Column 1
25
Table 1. Properties of steel column sections
Thickness Gross area Column Number
Steel Grade (mm)* (mm2)
L/r**
1 550 0.80 211.2 43.0 2 550 0.80 240.0 45.5 3 550 0.80 212.8 36.9 4 550 0.80 249.6 40.3 5 550 0.80 235.5 39.8 6 550 0.95 247.0 44.4 7 550 0.95 267.0 45.8 8 550 0.95 227.0 53.7 9 550 0.95 245.1 41.7 10 550 0.95 267.9 44.2 11 250 0.96 430.7 30.8 12 250 0.96 405.1 34.6 13 250 0.96 426.3 30.2 14 250 0.96 379.2 39.0 15 250 1.14 362.5 28.6 16 250 1.14 380.9 41.4
Note: * - Base metal thickness; **L/r = Critical column slenderness ratio
26
Table 2. Yield stress of steel
Grade Base metal thickness (mm)
Yield Stress (MPa)
0.80 656 G550 0.95 637 0.96 326 G250 1.14 310
Table 3. Comparison of buckling and ultimate loads in kN for Column 1
Buckling Load** FEA Ultimate load Model THINWALL FEA zero t* 2t*
Test Ultimate Load
1 108.6 115.8 118.4 90.8 81.0 78.0 2 108.6 115.7 118.3 90.5 80.8 78.0
* magnitude of geometric imperfections, ** - Distortional Buckling

27
Table 4. Comparison of FEA and Test ultimate loads
FEA ultimate loads (kN) FEA/ Test ultimate load
None**
0.17 fy**
None**
0.17 fy** Column
Test
ultimate load (kN) zero* t* 2t* zero t* 2t* t* 2t* t* 2t*
1 78.0 118.4 100.4 92.0 100.0 99.5 91.0 1.287 1.179 1.276 1.167 2 86.0 148.4 98.2 87.6 123.0 91.1 83.2 1.142 1.019 1.059 0.967 3 78.5 121.2 93.2 81.9 121.0 92.6 82.8 1.187 1.043 1.179 1.055 4 91.5 110.0 90.0 82.8 91.9 89.5 83.0 0.984 0.905 0.978 0.907 5 81.0 127.0 101.4 96.4 114.0 85.9 85.2 1.252 1.190 1.060 1.052 6 80.1 139.8 78.2 66.6 117.0 81.0 69.8 0.976 0.831 1.011 0.871 7 104.5 159.0 112.2 102.0 130.0 110.0 99.9 1.074 0.976 1.052 0.956 8 102.0 143.2 93.5 84.6 113.0 93.8 84.0 0.917 0.829 0.920 0.824 9 89.0 134.0 102.0 93.5 119.0 101.0 92.7 1.146 1.050 1.135 1.042 10 87.5 140.0 96.5 88.2 144.0 96.0 88.2 1.103 1.008 1.097 1.008 11 145.0 139.8 128.0 121.0 134.0 127.0 121. 0.883 0.834 0.876 0.834 12 94.5 107.0 92.9 91.9 93.6 89.1 88.2 0.983 0.972 0.943 0.933 13 100.2 138.0 113.0 109.0 121.0 111.0 108. 1.128 1.088 1.108 1.078 14 115.5 122.0 105.0 97.2 107.0 103.0 97.0 0.909 0.842 0.892 0.840 15 83.1 112.0 70.1 58.1 107.0 69.6 58.0 0.844 0.699 0.836 0.698 16 92.5 117.0 106.0 100.0 111.0 104.0 98.7 1.146 1.081 1.124 1.067
mean 1.060 0.972 1.034 0.956 COV 0.127 0.142 0.117 0.128
* - magnitude of geometric imperfections ** - residual stresses

28
Table 5. Comparison of Test and FEA results with design code predictions
Buckling load (kN)
AS/NZS 4600 Ult. load (kN)
Ultimate Load AS/NZS
4600/Test
Ultimate Load AS/NZS
4600/FEA(t*)
Column Thin-
Wall Abaqus
Test Ult.
Load (kN) fy 0.75fy fy 0.75fy** fy 0.75fy**
1 108.6 115.8 78.0 97.1 80.6 1.25 1.03 0.976 0.810 2 123.1 122.7 86.0 106.9 89.7 1.24 1.04 1.173 0.984 3 117.0 121.6 78.5 99.5 82.2 1.27 1.04 1.075 0.888 4 105.1 105.3 91.5 100.1 87.0 1.09 0.95 1.118 0.972 5 114.9 116.0 81.0 103.1 86.9 1.27 1.07 1.200 1.011 6 126.0 120.0 80.1 105.8 1.32 1.32 1.306 1.306 7 139.6 136.7 104.5 117.2 1.12 1.12 1.065 1.065 8 116.9 122.4 102.0 101.9 0.99 0.99 1.086 1.086 9 134.4 135.4 89.0 111.1 1.25 1.25 1.100 1.100 10 93.6 112.3 87.5 105.8 1.21 1.21 1.102 1.102 11 274.1 313.8 145.0 124.7 0.86 0.86 0.982 0.982 12 99.1 103.3 94.5 89.9 0.95 0.95 1.008 1.008 13 149.5 163.7 100.2 109.5 1.09 1.09 0.986 0.986 14 146.6 146.6 115.5 97.6 0.85 0.85 0.947 0.947 15 169.1 161.0 83.1 92.8 1.12 1.12 1.333 1.333 16 188.2 177.5 92.5 98.4 1.06 1.06 0.947 0.947
Mean 1.121 1.061 1.088 1.033 COV 0.133 0.121 0.109 0.131
Note: * - magnitude of initial geometric imperfections and also includes residual
stresses ** - 0.75 fy or fy as applicable

1
Table 6. Comparison of buckling and ultimate loads for different lengths of Column 1
Buckling loads (kN)
FEA Ult. Load* (kN)
AS/NZS 4600 AS/NZS 4600 Test load
Column Length (mm)
Type of Failure
Model type Thin-
wall Abaqus F1 F2
Test Load (kN)
fy 0.75fy
FEA (F1) Test load
fy 0.75fy
1000 Dist. MPC 108.6 115.8 99.5 91.0 78.0 97.1 80.6 1.28 1.24 1.03 876 Dist. MPC 128.7 137.3 109 100 87.6 103.6 84.3 1.24 1.18 0.96 675 Dist. MPC 151.2 156.1 105 95.9 90.9 107.8 86.6 1.16 1.18 0.95 475 Dist. MPC 165.3 177.8 113 106 102.1 111.6 88.7 1.11 1.09 0.87 275 Dist. MPC 205.5 227.2 122 116 107.2 118.1 92.4 1.14 1.10 0.86 130 Local Rigid 285.2 301.9 130 128 122.0 137.6 103.9 1.07 1.12 0.85 100 Local Rigid 270.0 300.5 132 129 123.6 137.6 103.9 1.05 1.11 0.84
mean 1.15 1.15 0.91 COV 0.07 0.05 0.08
Note: * - Includes residual stresses of 0.17fy
F1 - magnitude of initial geometric imperfections was t and (167w
) for distortional and local buckling modes
F2 - magnitude of initial geometrical imperfections was 2t and (1672w
) for distortional and local buckling modes.