Ulster County Childhood Obesity Study
17
Healthy Eating and Living Body Mass Index Screening Study Ulster County Department of Health Ulster County Report June 2011 Michael P. Hein County Executive La Mar Hasbrouck, MD, MPH Public Health Director Prepared by CRREO at SUNY New Paltz Eve Waltermaurer, PhD Kathleen Tobin, MS
-
Upload
daily-freeman -
Category
Documents
-
view
221 -
download
0
Transcript of Ulster County Childhood Obesity Study

8/6/2019 Ulster County Childhood Obesity Study
http://slidepdf.com/reader/full/ulster-county-childhood-obesity-study 1/17
Healthy Eating and LivingBody Mass IndexScreening Study
Ulster County Department of Health
Ulster County Report
June 2011
Michael P. Hein County Executive
La Mar Hasbrouck, MD, MPH Public Health Director
Prepared by CRREO at SUNY New Paltz
Eve Waltermaurer, PhDKathleen Tobin, MS
8/6/2019 Ulster County Childhood Obesity Study
http://slidepdf.com/reader/full/ulster-county-childhood-obesity-study 2/17
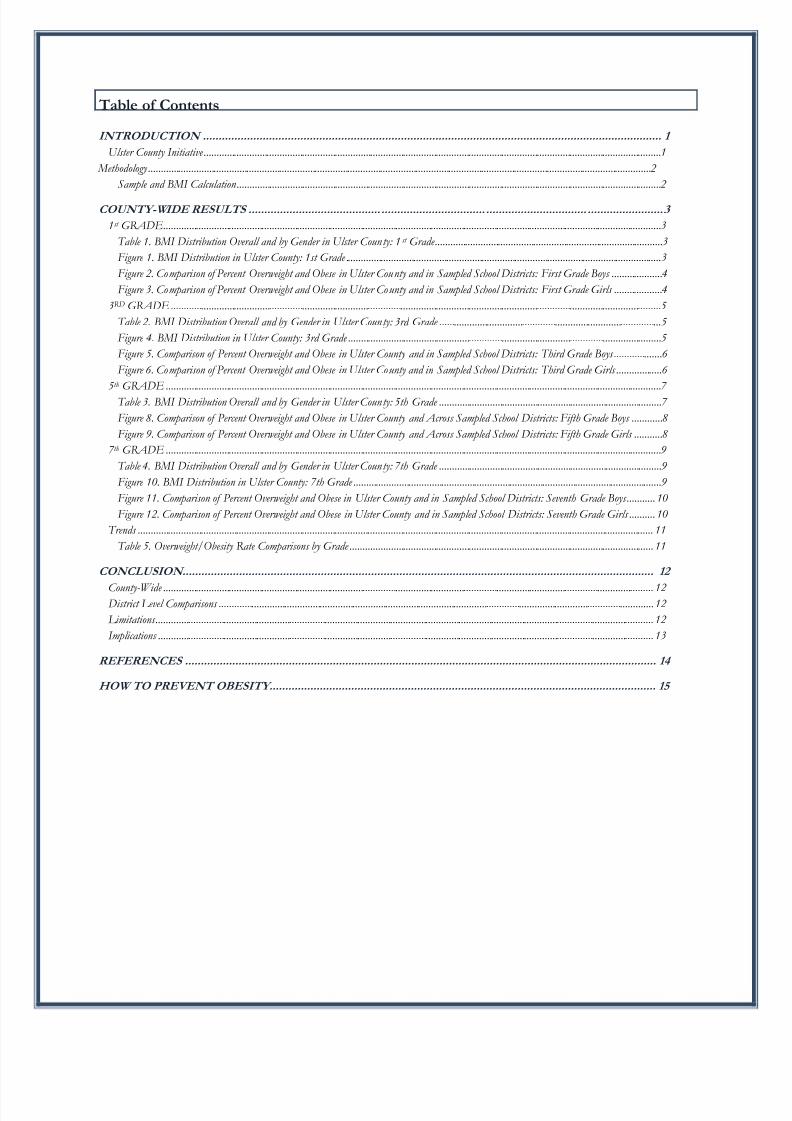
Table of Contents
INTRODUCTION .................................................................................................................................................. 1
Ulster County Initiative ..................................................................................................................................................................................... 1
Methodology ....................................................................................................................................................................................................... 2
Sample and BMI Calculation ........................................................................................................................................................................ 2
COUNTY-WIDE RESULTS .......................................... ................................. ................................ ........................ 3
1st GRADE ..................................................................................................................................................................................................... 3
Table 1. BMI Distribution Overall and by Gender in Ulster County: 1st Grade .......................................................................................... 3
Figure 1. BMI Distribution in Ulster County: 1st Grade ............................................................................................................................. 3
Figure 2. Comparison of Percent Overweight and Obese in Ulster County and in Sampled School Districts: First Grade Boys .................... 4
Figure 3. Comparison of Percent Overweight and Obese in Ulster County and in Sampled School Districts: First Grade Girls ................... 4
3RD GRADE .................................................................................................................................................................................................. 5
Table 2. BMI Distribution Overall and by Gender in Ulster County: 3rd Grade ........................................................................................ 5
Figure 4. BMI Distribution in Ulster County: 3rd Grade ............................................................................................................................ 5
Figure 5. Comparison of Percent Overweight and Obese in Ulster County and in Sampled School Districts: Third Grade Boys ................... 6
Figure 6. Comparison of Percent Overweight and Obese in Ulster County and in Sampled School Districts: Third Grade Girls .................. 6
5 th GRADE .................................................................................................................................................................................................... 7
Table 3. BMI Distribution Overall and by Gender in Ulster County: 5th Grade ........................................................................................ 7
Figure 8. Comparison of Percent Overweight and Obese in Ulster County and Across Sampled School Districts: Fifth Grade Boys ............ 8
Figure 9. Comparison of Percent Overweight and Obese in Ulster County and Across Sampled School Districts: Fifth Grade Girls ........... 8
7 th GRADE .................................................................................................................................................................................................... 9
Table 4. BMI Distribution Overall and by Gender in Ulster County: 7th Grade ........................................................................................ 9
Figure 10. BMI Distribution in Ulster County: 7th Grade .......................................................................................................................... 9
Figure 11. Comparison of Percent Overweight and Obese in Ulster County and in Sampled School Districts: Seventh Grade Boys ........... 10
Figure 12. Comparison of Percent Overweight and Obese in Ulster County and in Sampled School Districts: Seventh Grade Girls .......... 10
Trends ............................................................................................................................................................................................................ 11
Table 5. Overweight/Obesity Rate Comparisons by Grade ........................................................................................................................ 11
CONCLUSION...................................................................................................................................................... 12
County-Wide .................................................................................................................................................................................................. 12 District Level Comparisons ............................................................................................................................................................................ 12
Limitations ..................................................................................................................................................................................................... 12
Implications .................................................................................................................................................................................................... 13
REFERENCES ...................................................................................................................................................... 14
HOW TO PREVENT OBESITY........................................................................................................................... 15

8/6/2019 Ulster County Childhood Obesity Study
http://slidepdf.com/reader/full/ulster-county-childhood-obesity-study 3/17
1
INTRODUCTION
An obese child is more likely to become an obese adult. Health issues associated with obesity
include type 2 diabetes, heart disease, high cholesterol, and high blood pressure. Children who
are physically active perform better in school (Li & Hooker, 2010) and have higher self-esteem
and less depression (COFMP/COSH, 2006). One of the national goals for Healthy People 2020(HP2020) is to “Promote health and reduce chronic disease risk through the consumption of
healthful diets and achievement and maintenance of healthy body weights” by reducing the rate
of children aged 6-11 who are obese by 10% to a target of 15.7% and reduce the rate of children
ages 12-19 who are obese by 10% to a target of 16.9% (DHHS, 2011). Body Mass Index (BMI)
is a number calculated by using a child’s height and weight. It is age and gender specific for
children and adolescents to account for the differences in growth rates. Once the BMI is known
it is plotted on a BMI-for-age growth chart in order to obtain the percentile ranking compared to
other children of the same gender and age.
To help achieve the HP2020 goal in New York State, the New York State Department of Health
(NYSDOH) worked with key stakeholders and experts throughout the state to develop the New
York State Strategic Plan for Overweight and Obesity Prevention. In this plan, ten goals were
identified to help reduce overweight and obesity rates. The goals include: increasing the
awareness of overweight and obesity as a major public health threat; increase early recognition of
overweight and/or excessive weight gain; improve management (medical and nonmedical) of
people who are overweight or obese and those with obesity-related diseases; increase initiation,
exclusivity and duration of breastfeeding during infancy; improve lifelong healthy eating; increase
lifelong physical activity; decrease exposure to television and other recreational screen time;
increase policy and environmental supports for physical activity and healthy eating; increase andmaintain effective public health responses to the obesity epidemic; and, expand surveillance and
program evaluation to prevent overweight and obesity (NYSDOH, 2005).
Ulster County Initiative
In February 2007, the Healthy Eating and Living (HEAL-Ulster County) initiative was created by
the Ulster County Department of Health (DOH), made possible through funding and support
from the Ulster County Legislature’s Health and Human Services Committee. Additional help
came from key stakeholders who helped determine the scope of the problem in Ulster County. A
study released in 2008 that examined Body Mass Index (BMI) showed that among school agedchildren in 1st and 3rd grades, 36% of the students surveyed were classified at the 85th percentile
or higher (now referred to as “overweight” ) with 20% of these weighing at or above the 95 th
percentile (now referred to as “obese” ). This study was repeated collecting 2010 data for a
broader sample of students from across the county. For those schools who participated in the
2007 study, collecting 2010 data provides trend information (2006 compared with 2010) of
obesity rates to give districts insight as to whether the initiatives put into place since the previous
study period are working. For those schools new to the HEAL BMI screening, this 2011 report
provides baseline data while also providing information about which age groups may be at most
need for intervention.

8/6/2019 Ulster County Childhood Obesity Study
http://slidepdf.com/reader/full/ulster-county-childhood-obesity-study 4/17
2
Methodology
School district nurses were contacted by telephone to discuss participation in the study. Letters
were sent to district superintendents outlining the BMI study and requesting participation in the
data collection. Nurses in districts willing to participate received follow-up letters about the study
and data collection procedure for children currently in grades 1, 3, 5 and 7. These grades wereselected to provide a four-year follow-up for the 1st and 3rd grade data collected from schools
who participated in Ulster County’s 2007 HEAL BMI study and to establish early grade baselines
for future examinations. Statistical significance for comparisons of proportions was done using Z
tests.
Sample and BMI Calculation
For Ulster County, eight of the nine school districts participated for a total of 41 (out of 43)
schools. Gender, birth month and year, weight, height, and date of measurement were provided
for 5,796 children. Among these, 1,496 were 1 st graders, 1,492 were 3rd graders, 1,504 were 5th
graders and 1,304 were 7th graders. Just over 50% were male (2,933) and approximately 49% were female (2,863).
Each data set was calculated using an Excel BMI Calculator (EBMIC) designed by the Centers
for Disease Control and Prevention (CDC) to determine each child’s BMI and BMI-for-age
percentile. With the EBMIC, BMI was calculated by dividing the weight in pounds by height in
inches squared and multiplied by a factor of 703 (Barlow, 2007).
Due to the fact that children’s body fat changes with age and differs between girls and boys,
once each child’s BMI w as calculated, their percentile ranking was calculated using the EBMIC.
The percentile ranking helps to determine if a child is either underweight (less than the 5 th
percentile), healthy weight (5th percentile to less than the 85th percentile), overweight (85th
percentile to less than the 95th percentile), or obese (equal to or greater than the 95th percentile)
(Barlow, 2007). This classification is somewhat different than the one used in the 2007 study
where 85th-94th percentile were considered “at-risk for obesity” as opposed to the currently used
CDC nomenclature of “overweight” for those falling within these parameters.
In our sample of 5,796 children in Ulster County, from grades 1, 3, 5 and 7, 3% were identified
as underweight, 60% were identified normal weight, and 37% were obese or overweight, with
20% being obese. Our local rates reflect national trends. Data collected by the National Health
and Nutrition Examination Survey (NHANES) reports that nationwide, 35.5% of children ages
6-11 (typically grades 1 through 5) have a BMI > 85 while the rate of children in the BMI > 95
percentile was 19.6 % (Ogden, Carroll, Curtin, Lamb, & Flegal, 2010).

8/6/2019 Ulster County Childhood Obesity Study
http://slidepdf.com/reader/full/ulster-county-childhood-obesity-study 5/17

8/6/2019 Ulster County Childhood Obesity Study
http://slidepdf.com/reader/full/ulster-county-childhood-obesity-study 6/17
4
Figure 2. Comparison of Percent Overweight and Obese in Ulster County and inSampled School Districts: First Grade Boys
Figure 3. Comparison of Percent Overweight and Obese in Ulster County and inSampled School Districts: First Grade Girls
11%
16%
12%
9%
10%
18%
15%
11%
14%
21%
16%
12%
31%
16%
20%
20%
22%
19%
0% 5% 10% 15% 20% 25% 30% 35% 40% 45% 50%
District H
District G
District F
District E
District D
District C
District B
District A
UlsterCounty
Overweight Obese
9%
14%
10%
17%
10%
21%
16%
21%
15%
15%
6%
20%
23%
21%
13%
14%
22%
16%
0% 5% 10% 15% 20% 25% 30% 35% 40% 45% 50%
District H
District G
District F
District E
District D
District C
District B
District A
Ulster County
Overweight Obese

8/6/2019 Ulster County Childhood Obesity Study
http://slidepdf.com/reader/full/ulster-county-childhood-obesity-study 7/17
5
3RD GRADE
Table 2. BMI Distribution Overall and byGender in Ulster County: 3rd Grade
Figure 4. BMI Distribution in UlsterCounty: 3rd Grade
Total (N=1492)Underweight 3%
Normal 62%
Overweight or obese 35%
Overweight 17%Obese 18%
Boys (n=749)
Underweight 3%
Normal 60%
Overweight or obese 37%
Overweight 17%
Obese 20%Girls (n=743)
Underweight 3%
Normal 63%
Overweight or obese 33%
Overweight 17%
Obese 16%
Among Ulster County 3rd graders, 3% were
identified as underweight, 62% were normal weight, and 35% were obese or overweight,
with 18% being obese. While boys and girls
showed relatively similar rates of overweight
in this age group, boys tended to have a
higher rate of obesity than girls. This higher
rate of obesity, as compared with the rate of
children classified as overweight, among 3rd
grade boys, is seen in five of the eight school
districts. However, among the 3rd grade girls
in five districts, the proportion of obese girls
is equal or smaller than the proportion of girls
who are overweight. In nearly all districts,over one third of the 3rd grade boys fall into
the higher risk weight groups. Among 3rd
grade girls, in one district 43% of girls are at
high risk weights with nearly a quarter being
obese. Interestingly, the district that has the
highest at risk population of overweight or
obese girls (District B) is not one of the two
districts (A and E) that showed this high rate
among 1st grade girls.
Underweight3%
Normal
62%
Overweight17%
Obese18%

8/6/2019 Ulster County Childhood Obesity Study
http://slidepdf.com/reader/full/ulster-county-childhood-obesity-study 8/17
6
Figure 5. Comparison of Percent Overweight and Obese in Ulster County and inSampled School Districts: Third Grade Boys
Figure 6. Comparison of Percent Overweight and Obese in Ulster County and inSampled School Districts: Third Grade Girls
24%
11%
9%
18%
16%
22%
19%
15%
17%
15%
22%
24%
16%
22%
25%
17%
22%
20%
0% 5% 10% 15% 20% 25% 30% 35% 40% 45% 50%
District H
District G
District F
District E
District D
District C
District B
District A
Ulster County
Overweight Obese
14%
12%
16%
14%
20%
21%
20%
13%
17%
18%
6%
22%
12%
14%
23%
13%
16%
0% 5% 10% 15% 20% 25% 30% 35% 40% 45% 50%
District H
District G
District F
District E
District D
District C
District B
District A
Ulster County
Overweight Obese

8/6/2019 Ulster County Childhood Obesity Study
http://slidepdf.com/reader/full/ulster-county-childhood-obesity-study 9/17
7
5th GRADE
Table 3. BMI Distribution Overall and byGender in Ulster County: 5th Grade
Figure 7. BMI Distribution in UlsterCounty: 5th Grade
Among 5th graders in Ulster County, 3% were
identified as underweight, 56% as normal
weight, and 40% were obese or overweight,
with 22% being obese. Girls had a slightly
higher rate of above normal weight; however,
there are slightly more obese boys than girls in
this age group. Among 5th grade boys, in every
district in the county the prevalence of high
risk (overweight or obese) children is well
over one third. With two exceptions (District
E and H), there is a higher rate of obesity,
compared with overweight. Among 5th grade
girls, the districts show greater disparity with
one (District C) just exceeding a 50%
prevalence while the lowest (District H) has a
28% prevalence of overweight or obese girls
in this age group.
Underweight3%
Normal56%
Overweight18%
Obese22%
Total (N=1504)Underweight 3%
Normal 56%
Overweight or obese 40%
Overweight 18%Obese 22%
Boys (n=758)
Underweight 3%
Normal 57%
Overweight or obese 40%
Overweight 16%Obese 24%Girls (n=746)
Underweight 2%
Normal BMI 56%
Overweight or obese 42%
Overweight 21%
Obese 21%

8/6/2019 Ulster County Childhood Obesity Study
http://slidepdf.com/reader/full/ulster-county-childhood-obesity-study 10/17
8
Figure 8. Comparison of Percent Overweight and Obese in Ulster County and AcrossSampled School Districts: Fifth Grade Boys
Figure 9. Comparison of Percent Overweight and Obese in Ulster County and Across
Sampled School Districts: Fifth Grade Girls
20%
18%
16%
25%
13%
21%
11%
19%
16%
18%
22%
21%
11%
28%
23%
28%
25%
24%
0% 5% 10% 15% 20% 25% 30% 35% 40% 45% 50%
District H
District G
District F
District E
District D
District C
District B
District A
Ulster County
Overweight Obese
17%
27%
27%
16%
10%
27%
21%
18%
21%
11%
9%
18%
24%
32%
26%
26%
22%
21%
0% 5% 10% 15% 20% 25% 30% 35% 40% 45% 50%
District H
District G
District F
District E
District D
District C
District B
District A
Ulster County
Overweight Obese

8/6/2019 Ulster County Childhood Obesity Study
http://slidepdf.com/reader/full/ulster-county-childhood-obesity-study 11/17
9
7th GRADE
Table 4. BMI Distribution Overall and byGender in Ulster County: 7th Grade
Figure 10. BMI Distribution in UlsterCounty: 7th Grade
Total (N=1304)
Underweight 2%
Normal 56%
Overweight or obese 42%
Overweight 18%Obese 24%
Boys (n=649)
Underweight 3%
Normal 56%
Overweight or obese 41%
Overweight 15%
Obese 24%Girls (n=655)
Underweight 2%
Normal 57%
Overweight or obese 41%
Overweight 20%
Obese 21%
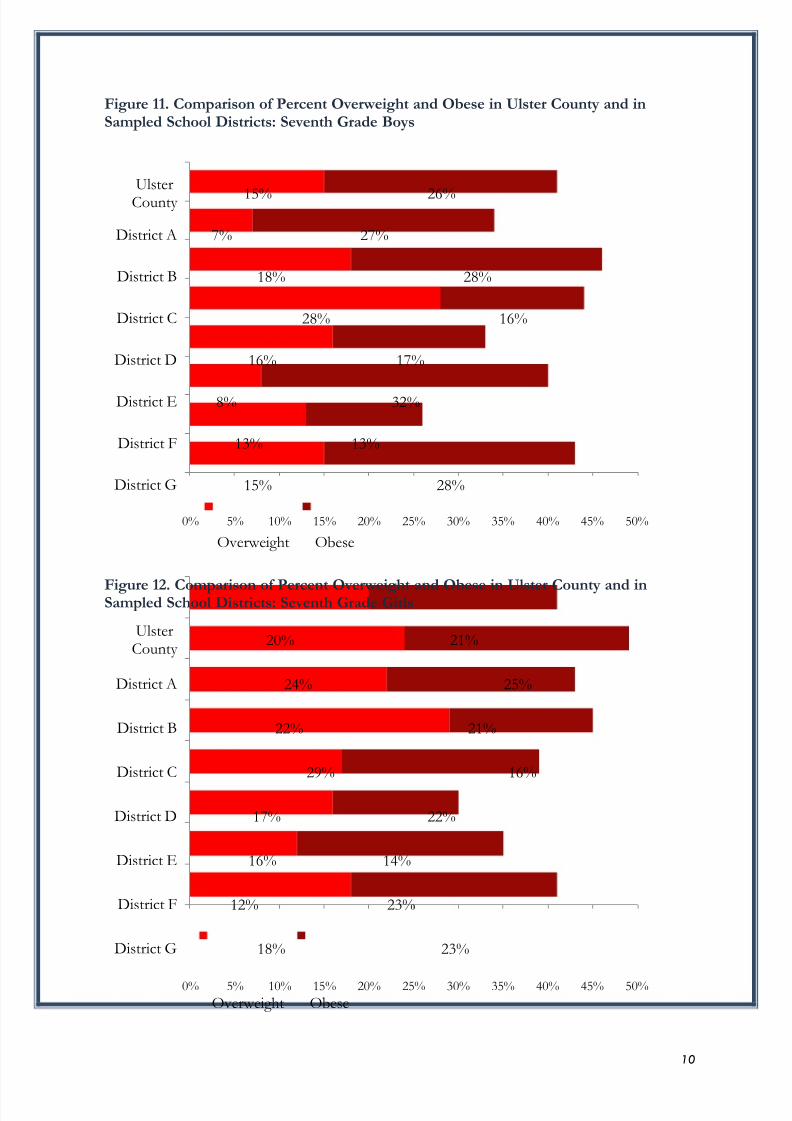
Among 7th graders in Ulster County, 2%
were identified as underweight, 56% asnormal weight, and 42% were obese or
overweight, with 24% being obese. Girls
had higher rates of overweight compared
with boys; and there are more obese boys
than girls in this group. In a comparison
across 7th grade boys in each participating
school district theres is considerable
variation in the prevalence of
overweight/obesity rates. While four of the
seven participating schools have aprevalence of four in ten or more at-risk
boys in this age group, the remaining three
have less than 35% in this classification.
Among the 7 th grade girls, the comparisons
across the districts show a similar pattern;
however only two of the participating
districts (E and F) fall at 35% or lower in
the high risk group.
Underweight2%
Normal56%
Overweight18%
Obese24%
8/6/2019 Ulster County Childhood Obesity Study
http://slidepdf.com/reader/full/ulster-county-childhood-obesity-study 12/17
10
Figure 11. Comparison of Percent Overweight and Obese in Ulster County and inSampled School Districts: Seventh Grade Boys
Figure 12. Comparison of Percent Overweight and Obese in Ulster County and inSampled School Districts: Seventh Grade Girls
15%
13%
8%
16%
28%
18%
7%
15%
28%
13%
32%
17%
16%
28%
27%
26%
0% 5% 10% 15% 20% 25% 30% 35% 40% 45% 50%
District G
District F
District E
District D
District C
District B
District A
UlsterCounty
Overweight Obese
18%
12%
16%
17%
29%
22%
24%
20%
23%
23%
14%
22%
16%
21%
25%
21%
0% 5% 10% 15% 20% 25% 30% 35% 40% 45% 50%
District G
District F
District E
District D
District C
District B
District A
UlsterCounty
Overweight Obese

8/6/2019 Ulster County Childhood Obesity Study
http://slidepdf.com/reader/full/ulster-county-childhood-obesity-study 13/17
11
Trends
The graph below shows the BMI obesity rate
for Ulster County school districts comparing
1st, 3rd, 5th and 7th graders in 2010. This graph
demonstrates that there is a statistically significant (p < .05) increase in
overweight/obesity overall and by gender
comparing grades 1st to 7th. However, when
examined by sequential grades, the increase is
only significant comparing 3rd and 5th grades.
In fact, comparing 5th and 7th grade the overall
rate remains constant. Among boys, the most
notable difference, although not statistically
significant (NS), occurs between 3rd
and 5th
grade where the 5th grade rate shows an 11%
increased rate. Similarly, girls show a
statistically significant difference between 3rd
and 5th grade whereby rates among female 5th
graders are 27% higher.
Table 5. Overweight/Obesity Rate Comparisons by Grade
P Values 1st – 3rd 3rd – 5th 5th – 7th 1st – 7th
Total NS <.01 NS <.01
Boys NS NS NS <.01
Girls NS <.01 NS <.01
32%
35%
41%41%
33%
36%40% 41%
31%33%
42%42%
1st Grade 3rd Grade 5th Grade 7th Grade10%
20%
30%
40%
50%
Total Boys Girls

8/6/2019 Ulster County Childhood Obesity Study
http://slidepdf.com/reader/full/ulster-county-childhood-obesity-study 14/17
12
CONCLUSION
County-Wide
Nationwide, there has been a linear trend in an increasing number of overweight or obese boysand girls over time (Ogden, Carroll, Curtin, Lamb, & Flegal, 2010). While it appears that as
children age in Ulster County they are showing increased rates of overweight and obesity, much
of this is a slow steady increase that is statistically significant overall, but not when assessed
incrementally. The one exception is significant increases for girls between 3rd and 5th grade.
Similarly, the prevalence of normal weight children in the county declines moderately and then
stablizes with just under 60% of children falling into this category overall. For the lower risk
group of overweight, the most notable increase seems to occur from 1st to 3rd grade.
Correspondingly, as age increases, incidence in the higher risk group increases; there are more
obese children in 3rd grade than 5th grade and and then again from 5th grade to 7th grade. This
pattern demonstrates that the overall BMI increase from 1st through 7th grade is driven by the
higher rate of obesity, the highest risk group, rather than just a steady rise above normal weight
among children.
District Level Comparisons
When comparing across school districts, there were no clear patterns thus discouraging the use
of overall county-level findings to understand each district individually. In other words, a district
that showed high rates of overweight or obese boys did not necessarily show this same patternamong its girls. Similarly, when looking at districts individually, higher or lower rates of
overweight or obesity among one grade did not necessarily correlate with the rate in the other
grades within the same district.
Limitations
There are some data limitations that should be considered when examining this report. The first
limitation relates to the data collection methodology used by each district. For several reasons,
data collection across districts could not be precisely uniform. In one district, the physical
education teacher calculates weight and height for all children annually, thereby providing themost up to date information. In two districts, the school nurses conducted individual screenings
for children in each grade. All other districts relied on transcribing existing data from medical
records. The New York State Education Law 903 and 904 require each student’s health
examination form to include BMI and determination of weight status for grades pre-K, K, 2nd,
4th, and 7th. Beginning in 2010, the state mandated school districts to provide aggregated BMI
data for these grades utilizing a 50% sample of school districts each year. Four participating
districts were among those randomly selected by the state this year to provide data from 2009.
Those schools who were selected felt an added burden to provide data for the county, as well for
potentially dissimilar grades. Similarly, the non-selected schools were limited to collecting weight
and height data only for the state-mandated grades. As this study examined students who in the

8/6/2019 Ulster County Childhood Obesity Study
http://slidepdf.com/reader/full/ulster-county-childhood-obesity-study 15/17
13
2010-2011 school year were in grades 1, 3, 5 and 7, some schools chose to use the previous
year’s medical reports for their 1st, 3rd and 5th grade while using the current school year’s medical
records for their 7th graders. While this difference in data collection methods is not ideal, no
major error is expected to have occurred as a result because variations in BMI any particular year
is random and small.
A second limitation results because BMI is not a diagnostic tool, and as such, further evaluation
is needed by a healthcare provider in order to determine if the high BMI is a cause for concern
(CDC, 2009). Children who are on the short or tall ends of the height spectrum may have an
inaccurate BMI (Council on Sports Medicine and Fitness and Council on School Health, 2006).
In addition, BMI does not account for muscle mass which, for some part, explains the higher
prevalence of BMI among older students who, on average, have greater muscle mass compared
with their younger counterparts.
Implications
Data collection for this report allows for statistical evaluation of the prevelence of obesity or
overweight in any given district. BMI data can track trends of weight status for school districts
to determine effectiveness of obesity prevention programs already in place, or whether programs
need to be initiated (Soto & White, 2010). It can identify particular age groups at risk so that
interventions may be more appropriately directed (Nihiser et al., 2007). While it appears from the
county-level results, that girls and boys between the grades of 3rd and 5th grade would be the ideal
target population for healthy weight education, each school district when examined individually
should use their specific data to further refine their best target population for intervention. In
addition, school districts can use the benchmarking comparisons to better understand their
particular rates of overweight and obesity within the county context.

8/6/2019 Ulster County Childhood Obesity Study
http://slidepdf.com/reader/full/ulster-county-childhood-obesity-study 16/17
14
REFERENCES
Barlow SE; Expert Committee. Expert committee recommendations regarding the prevention,assessment, and treatment of child and adolescent overweight and obesity: Summary
report. Pediatrics . 2007 Dec;120(suppl 4):S164-92.
Centers for Disease Control and Prevention. (2009). About BMI for children and teens. Division of Nutrition, Physical Activity and Obesity, National Center for Chronic DiseasePrevention and Health Promotion. Retrieved fromhttp://www.cdc.gov/healthyweight/assessing/bmi.
Council on Sports Medicine and Fitness and Council on School Health (COFMP/COSH).(2006). Active healthy living: Prevention of childhood obesity through increased physicalactivity. Pediatrics , 117, 1834-1842.
Li, J., & Hooker, N. H. (2010). Childhood obesity and schools: Evidence from the nationalsurvey of children’s health. Journal of School Health, 80, 96-103.
New York State Department of Health (NYDOH). (2005). New York State strategic plan foroverweight and obesity prevention. Retrieved fromhttp://www.health.state.ny.us/prevention/obesity/strategic_plan/strategic_plan_index.htm.
Nihiser, A. J., Lee, S. M., Wechsler, H., McKenna, M., Odom, E., Reinold, C., Grummer-Shawn,L. (2007). Body mass index measurement in schools. Journal of School Health, 77, 651-671.
Ogden, C. L., Carroll, M. D., Curtin, L. R., Lamb, M. M., & Flegal, K. M. (2010, reprinted), January 20). Prevalence of high body mass index in US children and adolescents, 2007-2008. Journal of the American Medical Association, 303(3), 245-249.
Soto, C., & White, J. H. (2010, August 2). School health initiatives and childhood obesity: BMIscreening and reporting. Policy, Politics, & Nursing Practice , 11, 108-114.
United States Department of Health and Human Services (USDOH). (2010). Healthy People 2020:Leading Health Indicators: Nutrition and Weight Status. Retrieved fromhttp://www.healthypeople.gov/2020/topicsobjectives2020/overview.aspx?topicid=29

8/6/2019 Ulster County Childhood Obesity Study
http://slidepdf.com/reader/full/ulster-county-childhood-obesity-study 17/17