ulrich Spiesshofer, Ceo; Eric Elzvik, Cfo - ABB Group · ABB LTD, ZURICH, SWITZERLAND, OCTOBER 27,...
25
ABB LTD, ZURICH, SWITZERLAND, OCTOBER 27, 2016 Continued margin growth in tough markets 2016 Q3 results Ulrich Spiesshofer, CEO; Eric Elzvik, CFO
Transcript of ulrich Spiesshofer, Ceo; Eric Elzvik, Cfo - ABB Group · ABB LTD, ZURICH, SWITZERLAND, OCTOBER 27,...
ABB LTD, ZURICH, SWITZERLAND, OCTOBER 27, 2016
Continued margin growth in tough markets2016 Q3 resultsUlrich Spiesshofer, CEO; Eric Elzvik, CFO

October 27, 2016©ABB
Slide 2
—
This presentation includes forward-looking information and statements including statements concerning the outlook for ourbusinesses. These statements are based on current expectations, estimates and projections about the factors that mayaffect our future performance, including global economic conditions, and the economic conditions of the regions andindustries that are major markets for ABB Ltd. These expectations, estimates and projections are generally identifiable bystatements containing words such as “expects,” “believes,” “estimates,” “targets,” “plans,” “outlook” or similarexpressions.
There are numerous risks and uncertainties, many of which are beyond our control, that could cause our actual results todiffer materially from the forward-looking information and statements made in this presentation and which could affectour ability to achieve any or all of our stated targets. The important factors that could cause such differences include,among others:
– business risks associated with the volatile global economic environment and political conditions– costs associated with compliance activities– market acceptance of new products and services– changes in governmental regulations and currency exchange rates, and– such other factors as may be discussed from time to time in ABB Ltd’s filings with the U.S. Securities and Exchange
Commission, including its Annual Reports on Form 20-F.
Although ABB Ltd believes that its expectations reflected in any such forward-looking statement are based upon reasonableassumptions, it can give no assurance that those expectations will be achieved.
This presentation contains non-GAAP measures of performance. Definitions of these measures and reconciliations betweenthese measures and their US GAAP counterparts can be found in the ‘Supplemental reconciliations and definitions’ sectionof “Financial Information” under “Quarterly results and annual reports” on our website at www.abb.com/investorrelations
Important notices

October 27, 2016©ABB
Slide 3
—
1On a comparable basis; 2Operational EPS growth is in constant currency (2014 foreign exchange rates)
Q3 2016: Continued margin growth in tough markets
Operational EBITA margin Operational EPS Cash flow from operating activities
12.6 %+10 bps
$0.32steady2
$1.1 bn-8%
Orders Base orders Revenues
$7.5 bn-13%1
$6.7 bn-6%1
$8.3 bn0%1
October 27, 2016©ABB
Slide 4
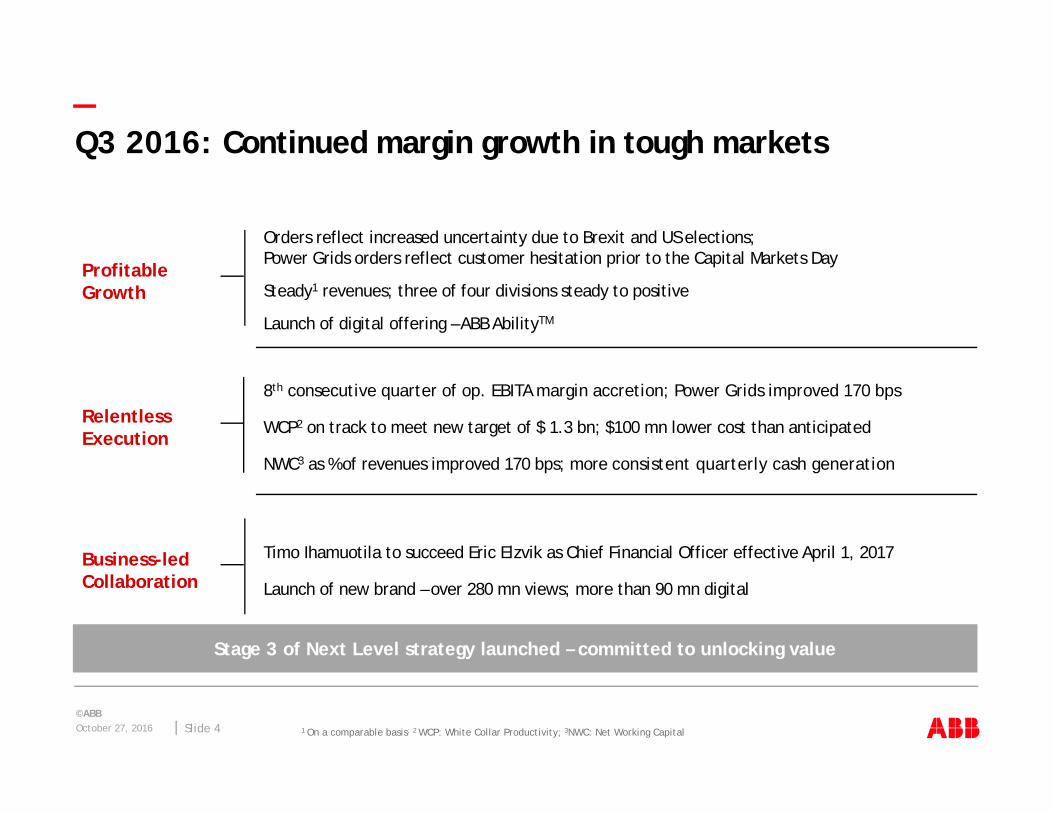
—Q3 2016: Continued margin growth in tough markets
Profitable Growth
Relentless Execution
Business-led Collaboration
Orders reflect increased uncertainty due to Brexit and US elections;Power Grids orders reflect customer hesitation prior to the Capital Markets Day
Steady1 revenues; three of four divisions steady to positive
Launch of digital offering – ABB AbilityTM
8th consecutive quarter of op. EBITA margin accretion; Power Grids improved 170 bps
WCP2 on track to meet new target of $ 1.3 bn; $100 mn lower cost than anticipated
NWC3 as % of revenues improved 170 bps; more consistent quarterly cash generation
Timo Ihamuotila to succeed Eric Elzvik as Chief Financial Officer effective April 1, 2017
Launch of new brand – over 280 mn views; more than 90 mn digital
1 On a comparable basis; 2 WCP: White Collar Productivity; 3NWC: Net Working Capital
Stage 3 of Next Level strategy launched – committed to unlocking value

October 27, 2016©ABB
Slide 5
—
1AMEA: Asia, Middle East and Africa; 2Selected countries from among ABB’s Top 20 countries by total order volume
Q3 2016: Increased uncertaintiesBrexit and the US election with additional dampening effect
2016 Q3 total order growth by region 2016 Q3 base order growth2
Americas
Base orders
USCanadaBrazil
Total-16%
0%-51%
ChinaIndiaUAE
-9%+31%-67%
Europe
Base orders
GermanyUKItalyNorway
Total-20%-56%+12%-63%
-8%
-16%
AMEA1
0%
-18%
Base orders
Total
-9%
-5%
Change on a comparable basis
Brazil -33%
Canada -16%
China -3%
Germany +3%
India -3%
Italy +2%
Norway -36%
Saudi Arabia -46%
South Korea +4%
Spain -6%
Sweden +3%
UK -20%
US -6%
Change on a comparable basis

October 27, 2016©ABB
Slide 6
—Q3 2016: Performance by divisionKey figures
ABB Group Electrification Products
Discrete Automation and Motion
Process Automation Power Grids
Orders 7.5 2.2 2.1 1.2 2.4
Comparable -13% -4% -4% -21% -21%
Revenues 8.3 2.3 2.2 1.5 2.6
Comparable 0% 0% 0% -7% +1%
Op. EBITA % 12.6% 17.8% 14.1% 12.2% 9.5%
+10 bps +40 bps -70 bps +150 bps +170 bps
$ bnunless otherwise stated

October 27, 2016©ABB
Slide 7
—Q3 2016: Operational EBITA margin up 10 bps
Operational EBITA bridge Q3 2015 to Q3 2016, $ mn
12.5% op. EBITA margin
12.6% op. EBITA margin
Net savings Net volume
OtherProject margins
Mix ForexOp. EBITAQ3 2015
Op. EBITAQ3 2016
1,046
-41-15+29 -52
+107 -63
1,081

October 27, 2016©ABB
Slide 8
—
$ mn
Originalguidance
New guidance 2015 2016 2017
Total Cost 1,200-1,250
1,100-1,150 420 450 ~230
Restructuring and related expenses 850-900 ~630 370 250 ~10
Program implementation 350 470 50 200 220
Q3 2016: Updated White Collar Productivity program costs30% increased target with $100 mn less combined cost
$ mn Original target
New target 2015 2016 2017 2018
Gross savings (run rate end of 2017) 1,000 1,300
Gross savings (incremental y-o-y) ~25 >550 450 300

October 27, 2016©ABB
Slide 9
—Q3 2016: Working capital program yielding results
Enhanced cash culture drives NWC reduction and consistent cash generation
15
14
13
181716
101112
Q2 Q3 Q4
20142015
2016
Q1
Strong working capital management contributions
Focus on consistent cash generation through the year
170 bps reduction Q3 2016 vs Q3 2015
Sustainable value chain optimization
NWC as a % of revenues Cash flow from operating activities, $ mn
Net Working Capital reduction A solid, consistent cash generator
53 252598
1,0821,173
1,081
0
500
1000
1500
2000
2500
3000
9M 2015 9M 2016
Q3
Q2
Q1
2,415
1,824
+30%

October 27, 2016©ABB
Slide 10
—
1Planned 2017 – 2019
Next Level Stage 3 – committed to unlocking valueFour actions
Delivering attractive shareholder returns supported by planned share buy-back of $3 bn1
Profitable Growth
Relentless Execution
Business-led Collaboration
Driving growth in four market-leading entrepreneurial divisions
Accelerating momentum in operational excellence
Strengthening the global ABB brand
Quantum leap in digital
1
2
3
4

October 27, 2016©ABB
Slide 11
—ABB names Timo Ihamuotila as Chief Financial OfficerAppointment effective April 1, 2017
Timo Ihamuotila joins ABB as CFO from Nokia
Extensive experience in communications, software & services industries, active portfolio management and operational performance improvement
Deep understanding in corporate transformation and digital business models
Succeeds Eric Elzvik in an orderly transition process, thorough hand over in Q2’17
Quantum leap in digital as cornerstone of Next Level Stage 3: after creating the Chief Digital Officer role, new CFO key to transforming ABB as leader in digital industries

October 27, 2016©ABB
Slide 12
—Q3 2016 summary and outlook
Q3 results
Operational EBITA margin increased to 12.6%
WCP on track to $1.3 bn savings; expected total cost reduced by $100 mn
Net Income $568 million; basic earnings per share +2%
Base orders -6%1; reflect Q3 uncertainty
Revenues steady
Cash flow from operating activities reflects more consistent quarterly cash generation
Timo Ihamuotila to succeed Eric Elzvik as CFO effective April 1, 2017
Outlook
Mixed short-term picture
Modest growth and increased uncertainties in Europe e.g. Brexit; slower growth in China; continued market growth in US
Oil price effects to continue
Long-term demand outlook remains positive –growth drivers in place for utility, industry, transport & infrastructure
Launch of Stage 3 of Next Level strategy – committed to unlocking value
1 On a comparable basis

October 27, 2016©ABB
Slide 13
—
October 27, 2016©ABB
Slide 14
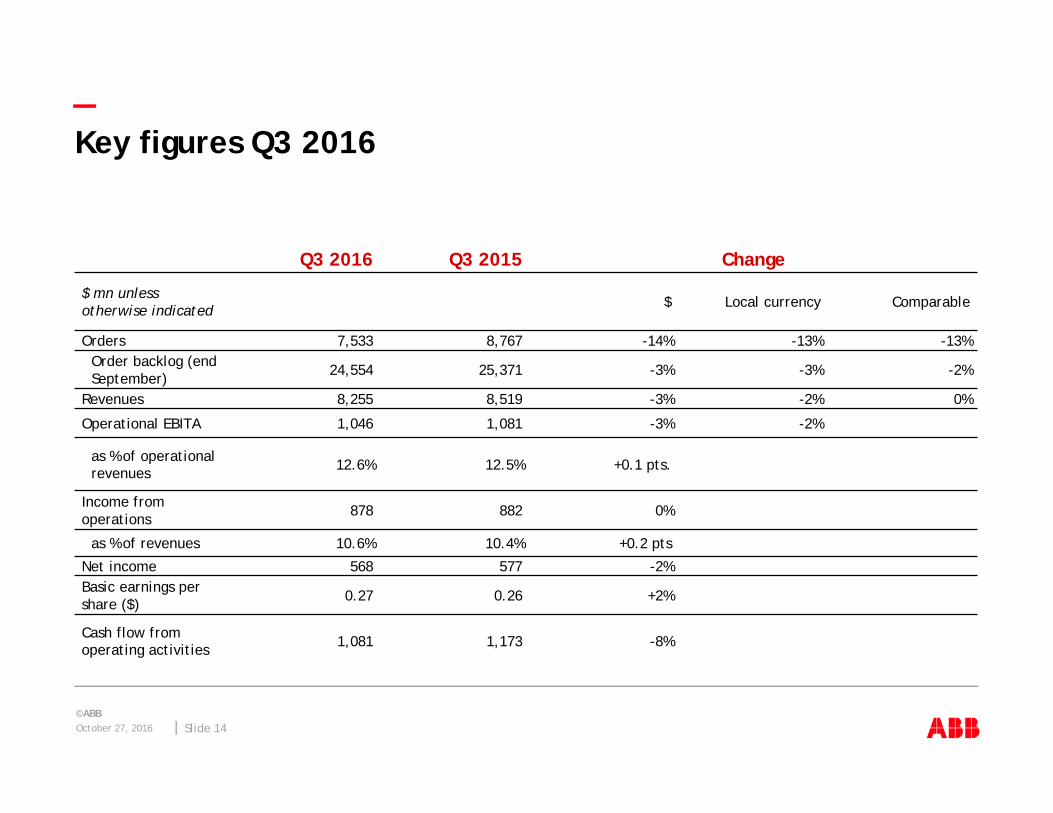
—Key figures Q3 2016
Q3 2016 Q3 2015 Change
$ mn unless otherwise indicated $ Local currency Comparable
Orders 7,533 8,767 -14% -13% -13%Order backlog (end September) 24,554 25,371 -3% -3% -2%
Revenues 8,255 8,519 -3% -2% 0%
Operational EBITA 1,046 1,081 -3% -2%
as % of operational revenues 12.6% 12.5% +0.1 pts.
Income from operations 878 882 0%
as % of revenues 10.6% 10.4% +0.2 pts
Net income 568 577 -2%Basic earnings per share ($) 0.27 0.26 +2%
Cash flow from operating activities 1,081 1,173 -8%
October 27, 2016©ABB
Slide 15
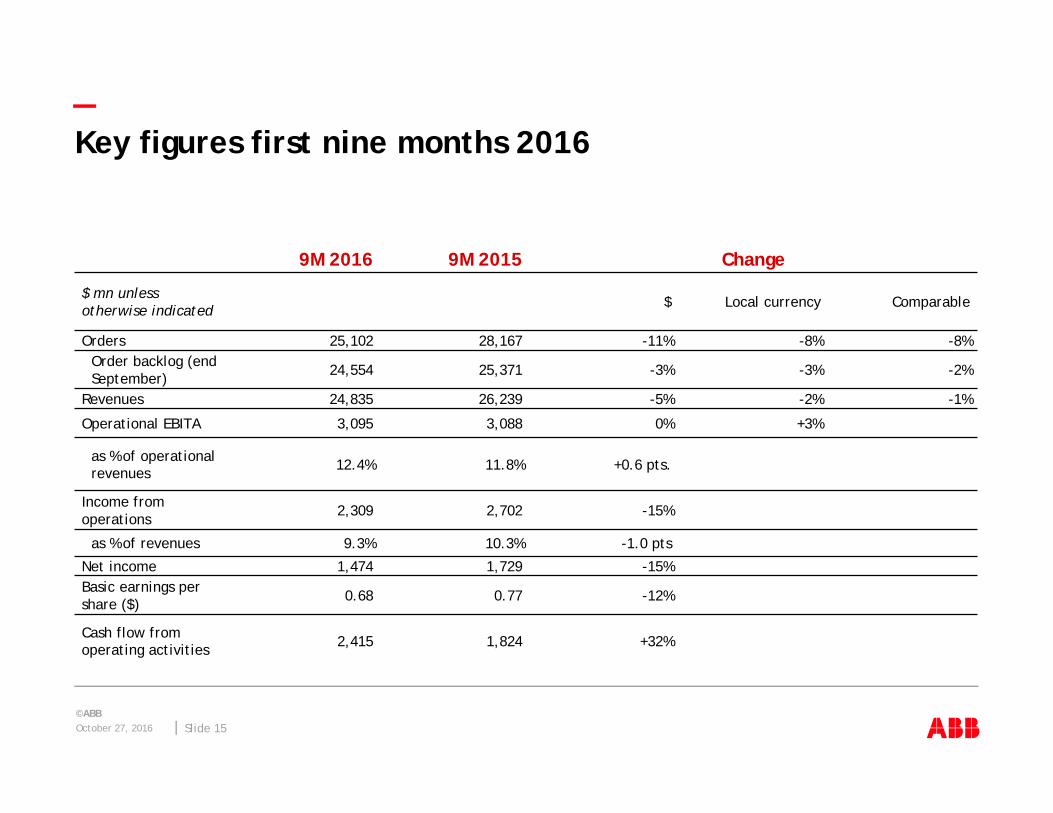
—Key figures first nine months 2016
9M 2016 9M 2015 Change
$ mn unless otherwise indicated $ Local currency Comparable
Orders 25,102 28,167 -11% -8% -8%Order backlog (end September) 24,554 25,371 -3% -3% -2%
Revenues 24,835 26,239 -5% -2% -1%
Operational EBITA 3,095 3,088 0% +3%
as % of operational revenues 12.4% 11.8% +0.6 pts.
Income from operations 2,309 2,702 -15%
as % of revenues 9.3% 10.3% -1.0 pts
Net income 1,474 1,729 -15%Basic earnings per share ($) 0.68 0.77 -12%
Cash flow from operating activities 2,415 1,824 +32%
October 27, 2016©ABB
Slide 16
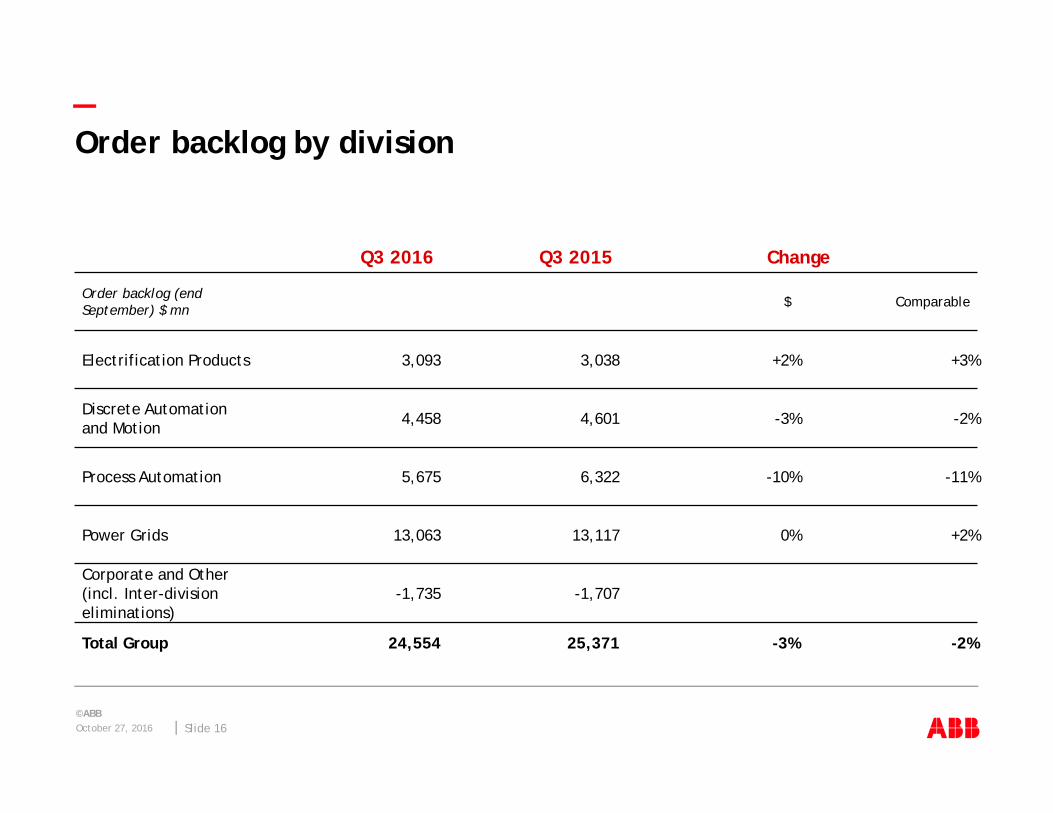
—Order backlog by division
Q3 2016 Q3 2015 Change
Order backlog (end September) $ mn $ Comparable
Electrification Products 3,093 3,038 +2% +3%
Discrete Automation and Motion 4,458 4,601 -3% -2%
Process Automation 5,675 6,322 -10% -11%
Power Grids 13,063 13,117 0% +2%
Corporate and Other(incl. Inter-division eliminations)
-1,735 -1,707
Total Group 24,554 25,371 -3% -2%

October 27, 2016©ABB
Slide 17
—Third party base orders by division
Q3 2016 Q3 2015 % Change
Third-party base orders $ mn Comparable
Electrification Products 2,095 2,173 -1%
Discrete Automation and Motion 1,899 1,983 -3%
Process Automation 1,128 1,316 -13%
Power Grids 1,588 1,782 -9%
Corporate and Other 17 18
Total Group 6,727 7,272 -6%

October 27, 2016©ABB
Slide 18
—Cash flow from operating activities by division
Q3 2016 Q3 2015 % Change
Cash flow from operating activities $ mn
Electrification Products 373 372 0%
Discrete Automation and Motion 322 386 -17%
Process Automation 234 197 +19%
Power Grids 189 189 0%
Corporate and Other -37 29
Total Group 1,081 1,173 -8%

October 27, 2016©ABB
Slide 19
—
1Calculated on earnings per share before rounding; 2Tax amount is computed by applying the Adjusted Group effective tax rate to the operational adjustments, except for gains and losses from sale of businesses for which the actual provision for taxes resulting from the gain or loss has been computed; 3Operational EPS growth rate is in constant currency (2014 foreign exchange rates)
Operational EPS analysis
Q3 2016 Q3 2015
mn $, except per share data in $ EPS EPS 1
Net income (attributable to ABB) 568 0.27 577 0.26 +2%
Operational adjustments:
Acquisition–related amortization 70 74
Restructuring and restructuring-related expenses (including WCP implementation costs)
39 59
Gains and losses on sale of businesses, acquisition-related expenses and certain non-operational items
35 -6
FX / commodity timing differences in income from operations 24 72
Tax on operational adjustments2 -53 -57
Operational net income / Operational EPS 683 0.32 719 0.32 0%3
October 27, 2016©ABB
Slide 20
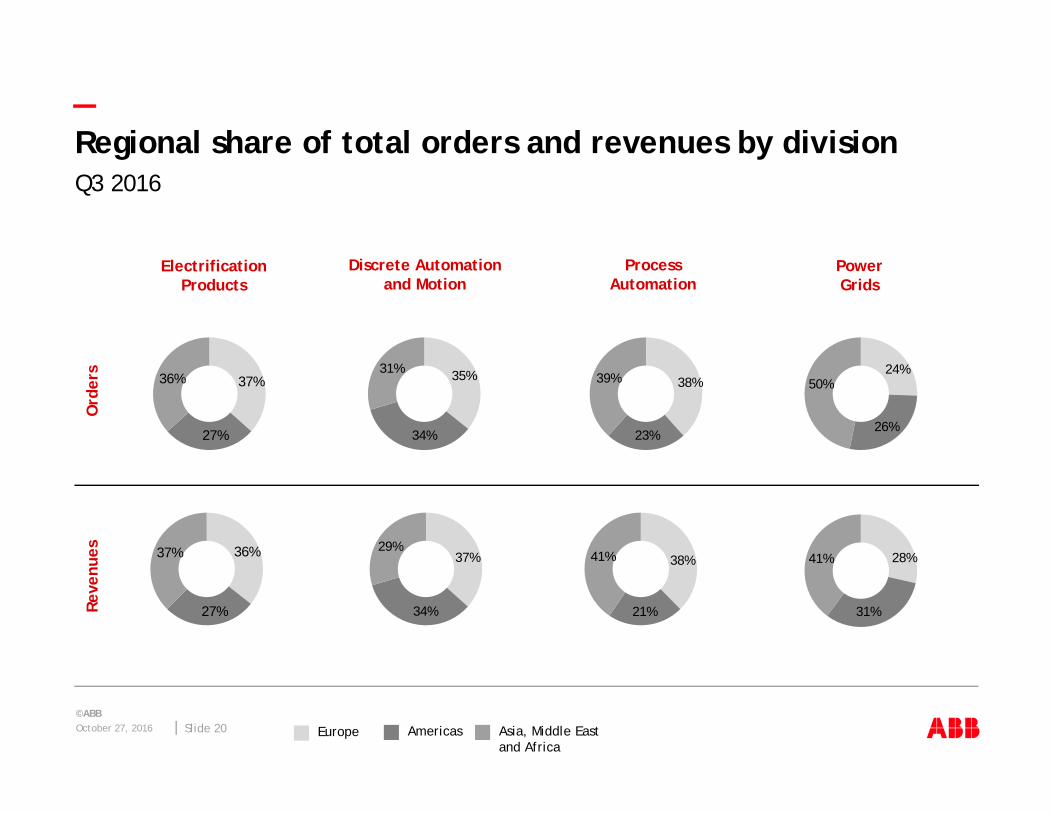
—Regional share of total orders and revenues by divisionQ3 2016
Ord
ers
Reve
nues
Electrification Products
36% 37%
27%
37% 36%
27%
Discrete Automation and Motion
31% 35%
34%
29%37%
34%
Process Automation
39% 38%
23%
41% 38%
21%
Power Grids
50%24%
26%
41% 28%
31%
Europe Americas Asia, Middle East and Africa
October 27, 2016©ABB
Slide 21
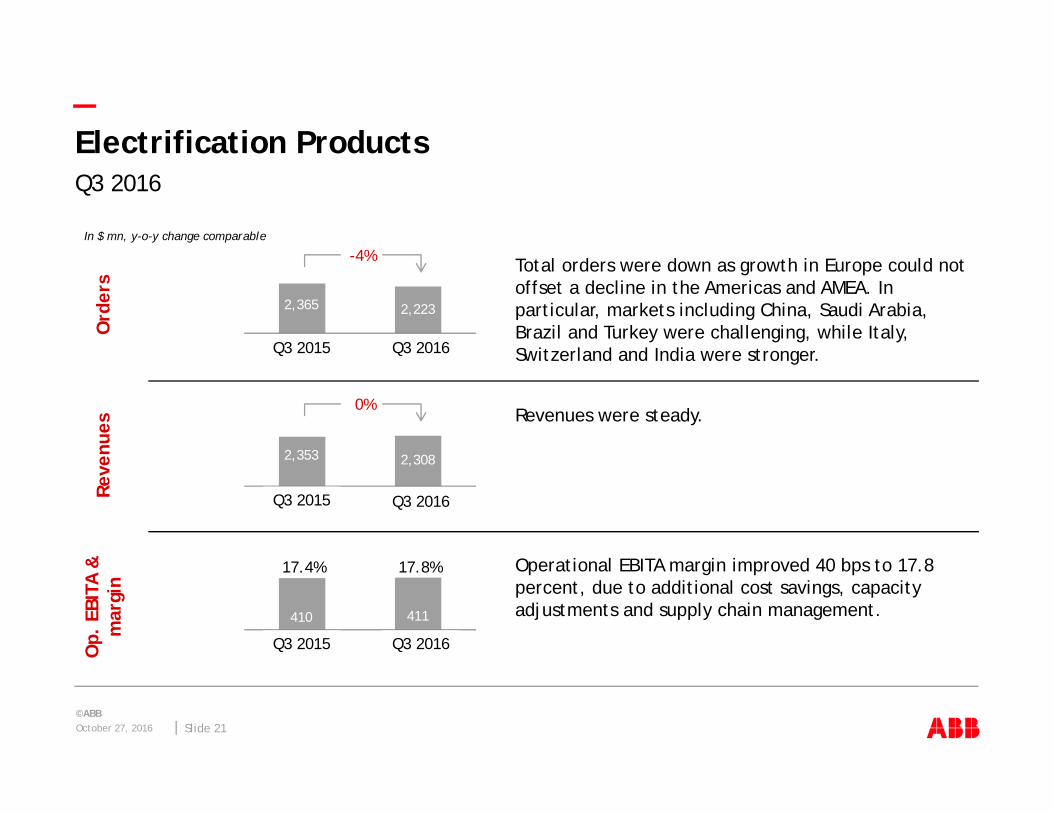
—Electrification Products Q3 2016
Ord
ers
Total orders were down as growth in Europe could not offset a decline in the Americas and AMEA. In particular, markets including China, Saudi Arabia, Brazil and Turkey were challenging, while Italy, Switzerland and India were stronger.
Op.
EBI
TA &
m
argi
n
Operational EBITA margin improved 40 bps to 17.8 percent, due to additional cost savings, capacity adjustments and supply chain management.
Reve
nues
Revenues were steady.
In $ mn, y-o-y change comparable
1 2
-4%
2,365 2,223
Q3 2015 Q3 2016
1 2
0%
2,353 2,308
Q3 2015 Q3 2016
1 2
17.8%
410 411
17.4%
Q3 2015 Q3 2016
October 27, 2016©ABB
Slide 22
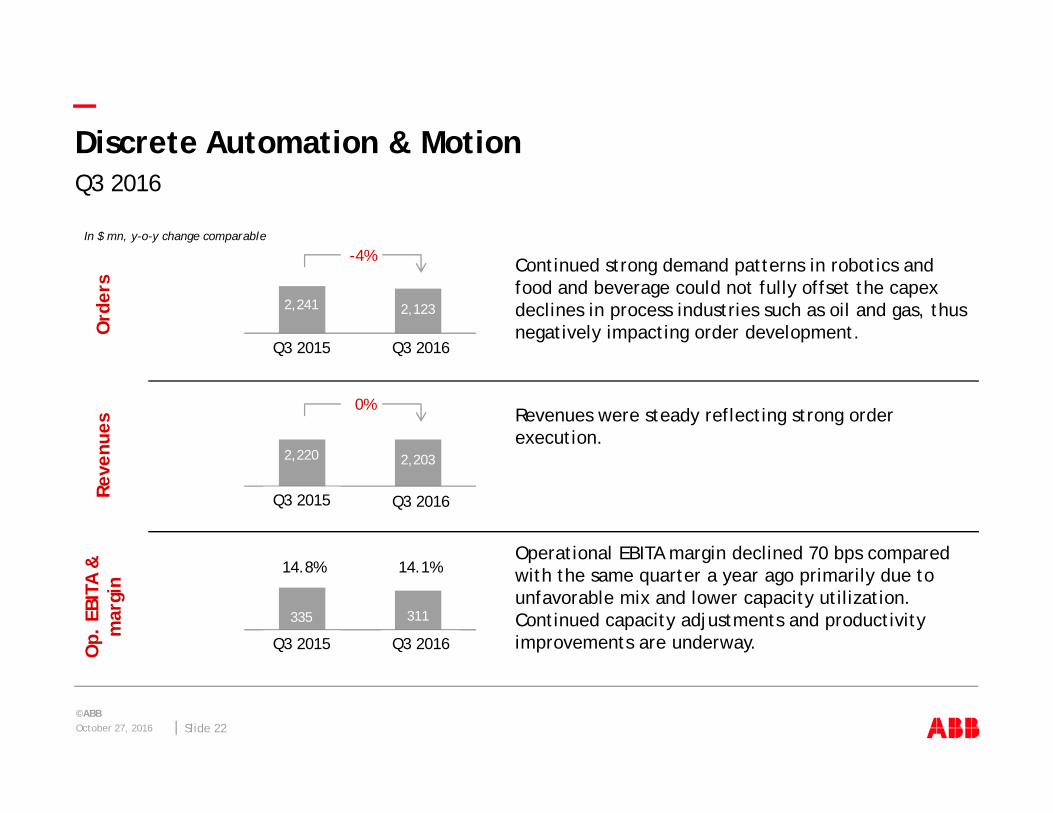
—Discrete Automation & MotionQ3 2016
Continued strong demand patterns in robotics and food and beverage could not fully offset the capex declines in process industries such as oil and gas, thus negatively impacting order development.
Operational EBITA margin declined 70 bps compared with the same quarter a year ago primarily due to unfavorable mix and lower capacity utilization. Continued capacity adjustments and productivity improvements are underway.
Revenues were steady reflecting strong order execution.
In $ mn, y-o-y change comparable
1 2
-4%
2,241 2,123
Q3 2015 Q3 2016
1 2
0%
2,220 2,203
Q3 2015 Q3 2016
1 2
14.1%
335 311
14.8%
Q3 2015 Q3 2016
Ord
ers
Op.
EBI
TA &
m
argi
nRe
venu
es

October 27, 2016©ABB
Slide 23
—Process AutomationQ3 2016
Total orders were 21 percent lower as reduced capital expenditure and cautious discretionary spending in process industries continued to impact large as well as base orders.
Operational EBITA margin increased 150 bps to 12.2 percent due to successful project execution and implemented cost out and productivity measures.
Revenues declined 7 percent as steady demand for specialty vessels could not compensate for declines in such segments as mining and oil & gas.
In $ mn, y-o-y change comparable
1 2
-21%
1,529 1,193
Q3 2015 Q3 2016
1 2
-7%
1,659 1,523
Q3 2015 Q3 2016
1 2
12.2%
181 187
10.7%
Q3 2015 Q3 2016
Ord
ers
Op.
EBI
TA &
m
argi
nRe
venu
es

October 27, 2016©ABB
Slide 24
—Power GridsQ3 2016
Total orders were lower compared with the same quarter a year ago primarily due to the timing of large order awards
Lower base orders reflect sluggishness in some markets such as the US, Saudi Arabia and Brazil while Europe remained supportive.
Operational EBITA was up 170 bps to 9.5 percent.
Solid performance driven by sustained project execution, improved productivity and continued cost savings.
Revenues were slightly higher due to steady execution of a healthy order backlog.
In $ mn, y-o-y change comparable
1 2
-21%
3,082 2,391
Q3 2015 Q3 2016
1 2
+1%
2,791 2,636
Q3 2015 Q3 2016
1 2
9.5%
221 254
7.8%
Q3 2015 Q3 2016
Ord
ers
Op.
EBI
TA &
m
argi
nRe
venu
es

October 27, 2016©ABB
Slide 25
—More information available at ABB Investor Relations
Name Telephone E-Mail
Alanna AbrahamsonHead of Investor Relations
+41 43 317 3804 [email protected]
Beat Fueglistaller +41 43 317 4144 [email protected]
Annatina Tunkelo +41 43 317 3820 [email protected]
Ruth Jaeger +41 43 317 3808 [email protected]