Ukraine Tree Nuts Annual Walnuts Annual Report GAIN Publications/Tree Nuts Annual... · in Ukraine,...
15
THIS REPORT CONTAINS ASSESSMENTS OF COMMODITY AND TRADE ISSUES MADE BY USDA STAFF AND NOT NECESSARILY STATEMENTS OF OFFICIAL U.S. GOVERNMENT POLICY Date: GAIN Report Number: Approved By: Prepared By: Report Highlights: Ukraine is projected to produce around 102,000 metric tons (MT) of walnuts in marketing year (MY) 2015/16 remaining at essentially MY 2014/15 production levels. Exports are expected to continue to account for over half of Ukrainian walnut production even though their volume is projected to decrease from 59,320 MT in MY2014/15 to 55,700 MT in MY2015/16. EU has already reduced EU import tariffs on Ukrainian walnuts to zero in 2014. Enactment of EU-Ukraine Deep and Comprehensive Free Trade beginning January 1, 2016 would create conditions for duty-free treenut trade between countries. The European Union and the Middle East are expected to remain the top export markets for Ukrainian walnut exports. Denys Sobolev, Agricultural Specialist Stan Phillips, Agricultural Counselor Walnuts Annual Report Tree Nuts Annual Ukraine UP1534 8/27/2015 Required Report - public distribution
-
Upload
trinhkhanh -
Category
Documents
-
view
214 -
download
0
Transcript of Ukraine Tree Nuts Annual Walnuts Annual Report GAIN Publications/Tree Nuts Annual... · in Ukraine,...
THIS REPORT CONTAINS ASSESSMENTS OF COMMODITY AND TRADE ISSUES MADE BY
USDA STAFF AND NOT NECESSARILY STATEMENTS OF OFFICIAL U.S. GOVERNMENT
POLICY
Date:
GAIN Report Number:
Approved By:
Prepared By:
Report Highlights:
Ukraine is projected to produce around 102,000 metric tons (MT) of walnuts in marketing year (MY)
2015/16 remaining at essentially MY 2014/15 production levels. Exports are expected to continue to
account for over half of Ukrainian walnut production even though their volume is projected to decrease
from 59,320 MT in MY2014/15 to 55,700 MT in MY2015/16. EU has already reduced EU import
tariffs on Ukrainian walnuts to zero in 2014. Enactment of EU-Ukraine Deep and Comprehensive Free
Trade beginning January 1, 2016 would create conditions for duty-free treenut trade between countries.
The European Union and the Middle East are expected to remain the top export markets for Ukrainian
walnut exports.
Denys Sobolev, Agricultural Specialist
Stan Phillips, Agricultural Counselor
Walnuts Annual Report
Tree Nuts Annual
Ukraine
UP1534
8/27/2015
Required Report - public distribution
GAIN Report – UP1534 – Walnuts Annual Report Page 2 of 15
UNCLASSIFIED USDA Foreign Agricultural Service
Commodities:
Production:
Ukraine is projected to produce 102,000 metric tons (MT) of walnuts in marketing year (MY) 2015/16
remaining at essentially MY 2014/15 production levels. Walnut production in Ukraine remains
distributed throughout the country. Various regions have been producing walnuts as well as hazelnuts
for many years. Climate conditions and soil in Ukraine are suitable for growing nut trees. At present,
about 99 percent of all walnuts harvested in Ukraine are produced by small private family farms that
harvest trees growing on their land plots. Three decades ago, when there was no private land ownership
in Ukraine, walnuts were produced by collective farms in the Soviet planned economy. Some of those
orchards are over 40 years old, but still bear walnuts, though at much lower yields.
Starting in 2009, Ukrainian farmers began developing walnut orchards for commercial purposes. The
size of these plantations ranges from 0.5 hectare (ha) up to 100 ha. Some regions, especially in central
and southern Ukraine, require irrigation to secure expected yields, while orchards in the northern part of
the country may not have as high of yields as a result of cooler climates. Total area of commercial
walnut trees constituted around 2,000 ha in 2014 or slightly above
12 percent of total walnut tree area in Ukraine.
Producers prefer Ukrainian origin seedlings, although due to the increase in demand and the inability of
local seedling producers to meet such a demand, some new seed varieties are being imported from
neighboring Moldova and Belarus. Ukrainian State Registry of plant varieties
(in Ukrainian) is comprised of over 30 different varieties for walnut, allowing commercial growers to
pick varieties that would be commercially sustainable in their area. According to industry reports,
commercial walnut production yield has increased as has the quality of the end product.
Most of Ukraine’s walnut producers do not treat trees for diseases. However, with more commercial
walnut production coming online and taking over poorly managed and aging orchards, these newly
established producers are said to pay greater attention to production technologies (beyond irrigation) to
increase growing efficiencies. For example, these growers are conducting research into ideal growing
areas, investing in nurseries to improve genetic stocks, and applying fertilizer and pesticides to their
orchards.
However, walnut production in Ukraine is still a labor intensive business for the most part with the
majority of walnuts harvested by hand or rudimentary nut picking devices used by the previous
generation of growers. Another part of the business that is of interest to commercial growers is walnut
wood, which is used for furniture manufacturing locally and with some exports. Other products related
to walnut value-added production are treated leaves for medicinal use and walnut (green/young nut)
preserves. In recent years, demand for walnut oil from primarily EU importers has surfaced as niche
Ukrainian growers are pursuing. The domestic market in Ukraine has also generated some demand for
walnut oil as a gourmet food and a key ingredient in the premium segment of natural cosmetic products.
Walnuts, Inshell Basis
GAIN Report – UP1534 – Walnuts Annual Report Page 3 of 15
UNCLASSIFIED USDA Foreign Agricultural Service
Total walnut planted area in Ukraine declined to 15,600 ha in 2014, which is around 4.3 percent below
the production area in 2013. The influx of new orchard plantings still has not offset the reduction in area
caused by older orchards from the Soviet period being cut down gradually. Similarly, yields from newly
planted varieties managed with improved production technologies using irrigation, fertilizers, pest and
disease control by commercial growers has also not offset the declines in production resulting from
cuttings of old walnut orchards.
New walnut orchards are expected to start bearing fruit in five to seven years after being planted. At the
start of the production age, walnut tree yields are low; they increase gradually and will reach their prime
anywhere between fifteen to twenty years. Average yields of the newly planted trees (upon maturation)
are expected to be higher than that of the older stock.
For the purpose of this report FAS-Kyiv is using the official walnut area and production estimates
provided by the State Statistics Service of Ukraine, which might differ from the estimates included in
previous GAIN Report UP1432.
Consumption:
Walnut consumption is projected to increase slightly in MY 2015/16 to 46,349 MT as it did in MY
2014/15. Although almonds, cashews, pistachios, and Brazilian nuts (in the order of highest to lowest
based on consumer popularity) are widely available in local retail outlets, they are usually more
expensive than walnuts. Difficult economic conditions recently experienced by Ukrainian consumers
likely contributed toward a shift away from imported nuts in favor of locally produced walnuts and
hazelnuts. This trend is expected to continue into MY 2015/16.
Demand from domestic chocolate producers and other candy manufacturers who use walnuts in their
recipes are projected to remain stable in MY 2015/16. Many of these confectionary products are
exported. Generally speaking a greater portion of processed foods and higher priced confectionary
products use walnuts in their recipes or to garnish cakes and baked goods for example.
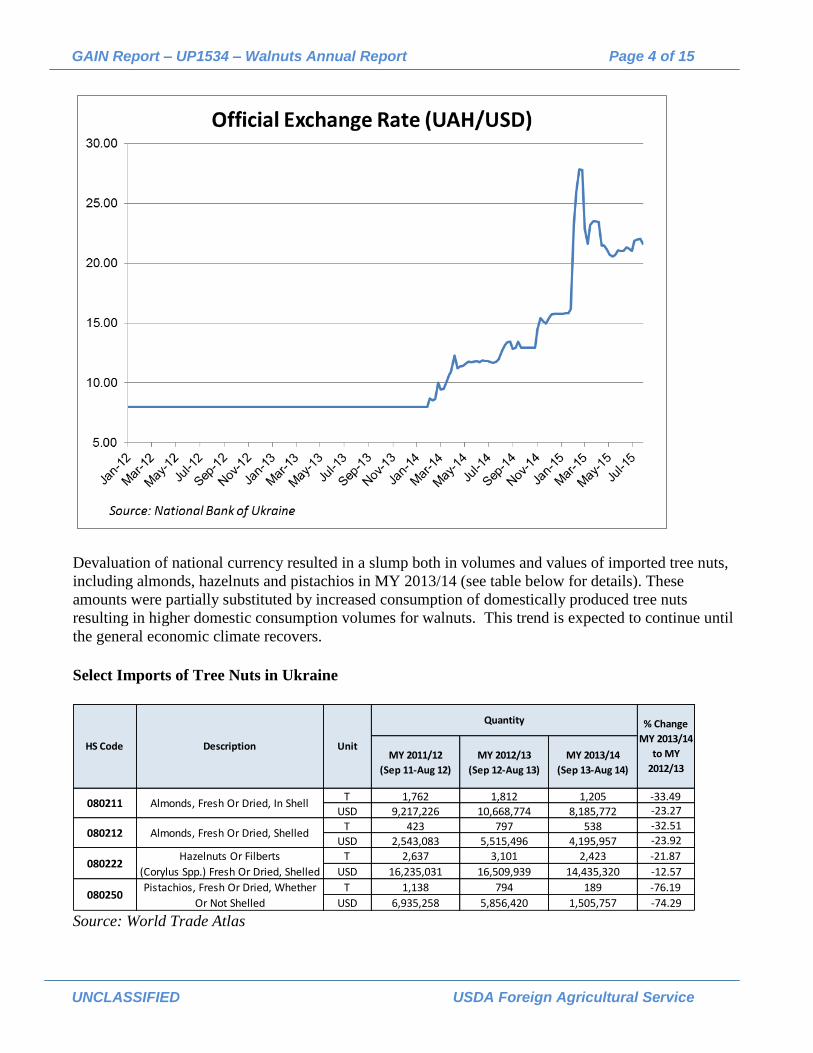
Consumer behaviors are closely tied with the general economic situation. Ukraine’s present political
and economic crisis has led to a significant devaluation in the local currency (Hryvna – UAH) and a
number of trade-related problems associated the devaluation’s inflationary effect (for more details see
Official Exchange Rate graph below).
Total currency devaluation in 2014 reached almost 100 percent-- undermining imports and boosting
exports. Another surge came in February 2015, further devaluating the national currency by almost 50
percent. Since March 2015 the exchange rate has fluctuated within relatively narrow margins as the
result of tight monetary policies in place by the National Bank of Ukraine.
GAIN Report – UP1534 – Walnuts Annual Report Page 4 of 15
UNCLASSIFIED USDA Foreign Agricultural Service
Devaluation of national currency resulted in a slump both in volumes and values of imported tree nuts,
including almonds, hazelnuts and pistachios in MY 2013/14 (see table below for details). These
amounts were partially substituted by increased consumption of domestically produced tree nuts
resulting in higher domestic consumption volumes for walnuts. This trend is expected to continue until
the general economic climate recovers.
Select Imports of Tree Nuts in Ukraine
MY 2011/12
(Sep 11-Aug 12)
MY 2012/13
(Sep 12-Aug 13)
MY 2013/14
(Sep 13-Aug 14)
T 1,762 1,812 1,205 -33.49USD 9,217,226 10,668,774 8,185,772 -23.27
T 423 797 538 -32.51
USD 2,543,083 5,515,496 4,195,957 -23.92
T 2,637 3,101 2,423 -21.87
USD 16,235,031 16,509,939 14,435,320 -12.57
T 1,138 794 189 -76.19
USD 6,935,258 5,856,420 1,505,757 -74.29080250
Pistachios, Fresh Or Dried, Whether
Or Not Shelled
% Change
MY 2013/14
to MY
2012/13
080212 Almonds, Fresh Or Dried, Shelled
080222Hazelnuts Or Filberts
(Corylus Spp.) Fresh Or Dried, Shelled
080211 Almonds, Fresh Or Dried, In Shell
Quantity
HS Code Description Unit
Source: World Trade Atlas

GAIN Report – UP1534 – Walnuts Annual Report Page 5 of 15
UNCLASSIFIED USDA Foreign Agricultural Service
Trade:
Walnut exports are projected to decline slightly to 55,700 MT in MY 2015/16 reflecting stable
production and higher domestic consumption.
Exports of walnuts are in most cases managed by private enterprises. An industry group, the Tree Nut
Association, was established several years ago to assist walnut market entrants. The Association serves
as a consultant to growers in various stages of the business cycle and has had some success in raising
production standards in orchards as well as targeting export markets around the world.
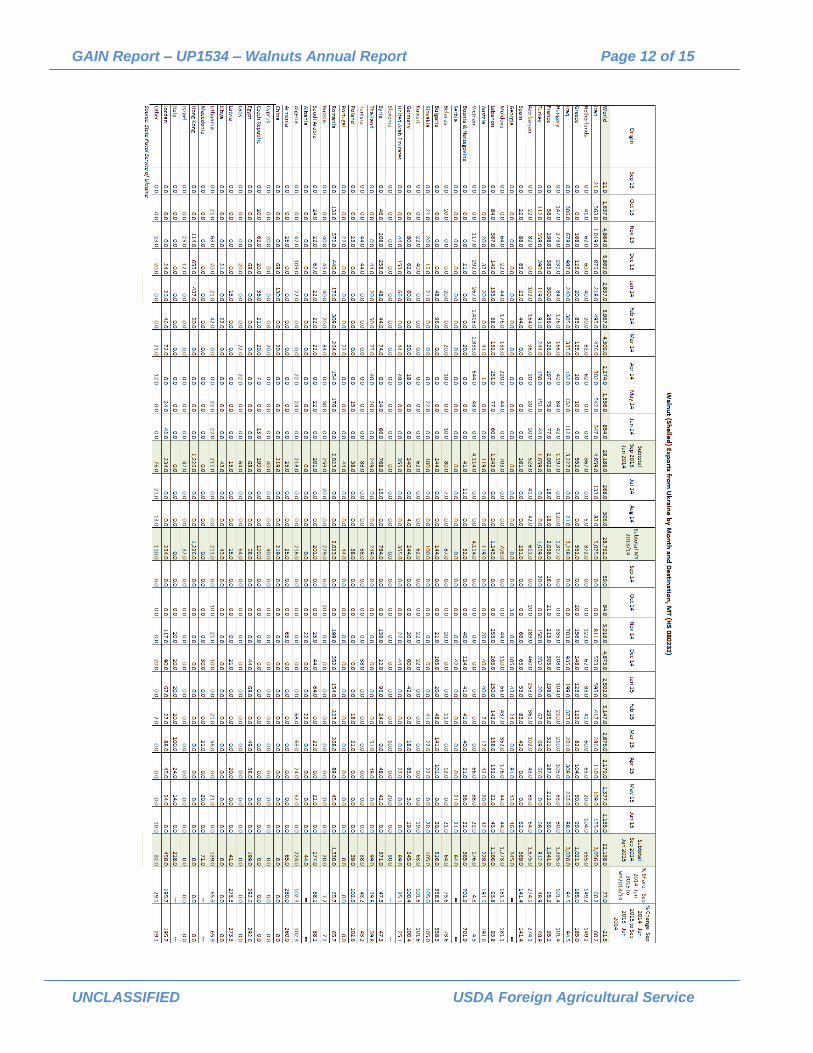
Ukraine exported over 22,100 MT of shelled walnuts from September 2014 through June 2015
including around 11,300 MT to Middle Eastern markets and over 8,100 MT to the EU. Egypt, Tunisia
and Thailand imported significant amounts during the same period. Ukraine’s walnut exports are
usually concentrated on the October through May period. In May, walnuts from the southern
hemisphere become available on the world market thus curbing demand and sales of Ukrainian product
(particularly to European markets).
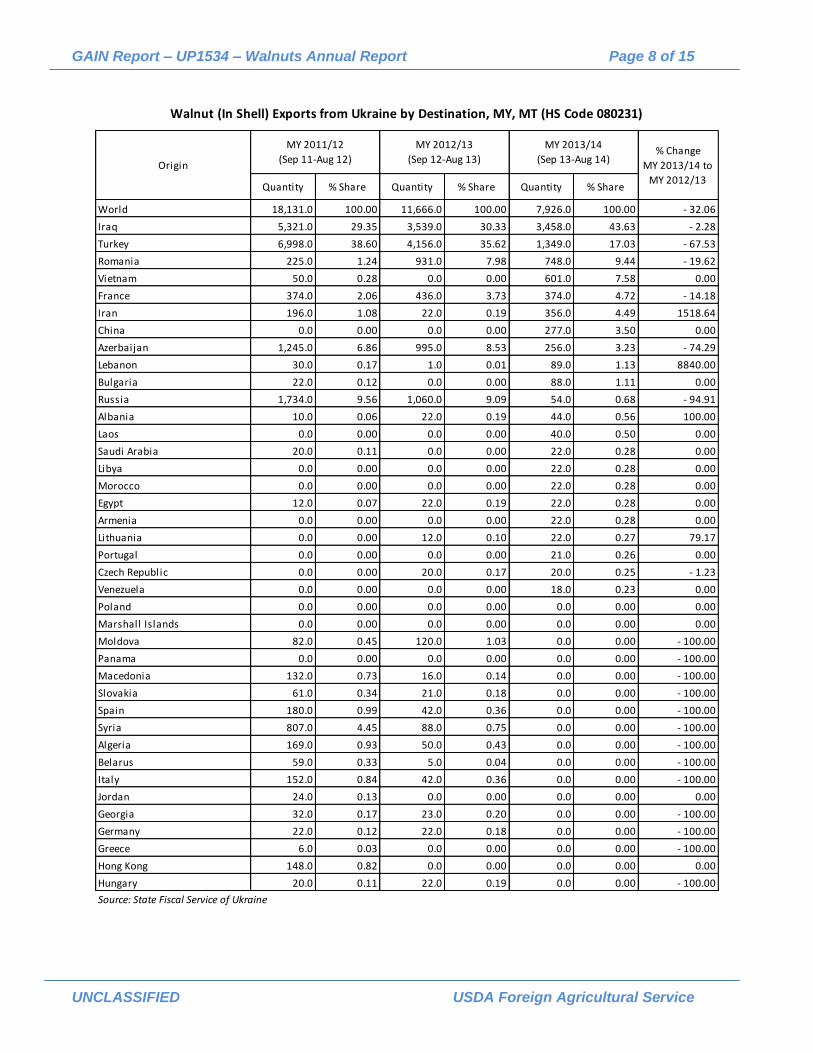
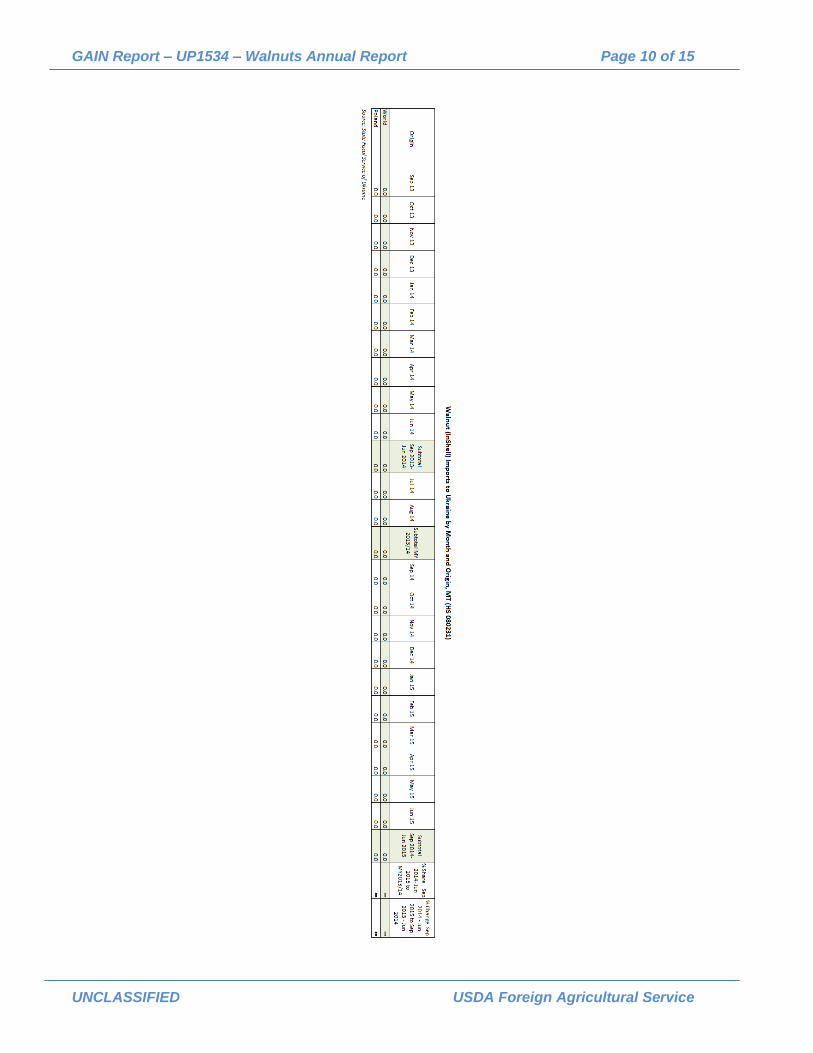
The vast majority of Ukrainian walnuts are exported shelled. In-shell exports of walnuts amounted to
about 5,500 MT from September 2014 through June 2015; a 30 percent decline from in-shell exports
during the same months of the preceding year. The largest importer of in-shell walnuts was Turkey
accounting for over 2,600 MT. Iraq (1,250 MT) and the EU (1,200 MT) were other signification
destinations during the September 2014 – June 2015 period.
According to industry experts, the average conversion rate between shelled to in-shell walnuts in
Ukraine ranges between 33-38 percent. It is expected that this ratio will improve in the future with
greater commercial production development. Conversion rates for the recently established walnut
orchards average at about 55 percent, though the share of these plantations is still relatively small so do
not have much impact on the national average.
For the purpose of this report, PS&D tables are calculated on the basis of in-shell weight by multiplying
the weight of shelled walnuts (HS Code: 080232) by 2.34.
Ukraine hasn’t imported any substantial volumes of walnuts due to strong position of national producers
and production volumes exceeding domestic consumption. Taking into account that production
volumes are tend to be stable and commercial growers are establishing on the market, such trend would
likely be case in the future.
Stocks:
Walnut stocks are difficult to calculate because large quantities are still produced by private family
farms that do not report their stock figures and the majority of these tree nuts are stored by private
producers. Unless these products are exported, there is no trace of stock or production for that matter.
As commercial walnut production develops in Ukraine, growers understand that official national data
must become available in the marketplace.
GAIN Report – UP1534 – Walnuts Annual Report Page 6 of 15
UNCLASSIFIED USDA Foreign Agricultural Service
Policy:
Market observers to not expect any major increases in governmental support to be implemented for
walnut production. Grain, sugar, and livestock production are identified as higher priority sectors for
support from State Budget resources. It is possible, however, that Ukrainian policy-makers will allow
use of walnut tree seedlings to mitigate eroded parcels of land. Producers who plant the seedlings
would then be eligible for compensation under local programs for land conservation and protection.
In April 2014 the European Union enacted Regulation # 374/2014 (Regulation) unilaterally reducting or
eliminating EU customs duties on goods originating in Ukraine. In accordance with the Regulation EU
import duties for walnuts originating in Ukraine have been decreased to zero from the previously
existing regular rate of 5.1 percent for shelled walnuts (HS Code 080230) and 4 percent for inshell
walnuts (HS Code 080231). This measure should slightly increase the competitiveness of Ukrainian
walnuts within the EU market.
In January 2016, the Deep and Comprehensive Free Trade Area (DCFTA) is expected to be
implemented between EU and Ukraine. Consequently, Ukrainian import duties currently ranging from
5 to 15 percent on a wide spectrum of EU tree nuts will be eliminated. Ukraine is expected to eliminate
the current import duties of 10 percent for both shelled and in-shell walnuts originating in the EU.
Although this measure is not expected to translate into the additional import volumes of walnuts in
Ukraine, it might trigger partial substitution of walnuts in domestic consumption with imported tree nuts
(cashew, almonds, pistachios etc.). For more details see Consumption section above.
Marketing:
Ukrainians consume walnuts in their everyday diets. It is a common ingredient in dessert-type dishes
and in local cuisine. Walnuts are often consumed raw as well as slightly roasted. Walnut oil is becoming
a niche product. Cold pressed oil is highly-valued for its nutritional purposes. Industrial walnut oil
production has been on the rise in Ukraine in recent years.
Walnuts are often sold in bulk in farmers’ markets in Ukraine (both shelled and in-shell). Local food
stores prefer to carry pre-packaged walnuts. However, in this case, the price of walnuts is only slightly
lower than that of almonds or cashews that are often thought of by Ukrainian consumers as premium
type nuts. This is mainly because many Ukrainians have walnut trees in their back yards or summer
homes which are grown by relatives or friends and can provide them with sufficient supplies for their
family’s annual uses. Thus, local consumers are not keen on purchasing packaged walnuts (specifically
amongst all tree nuts) in retail outlets at prices comparative of imported tree nuts. Ukrainian consumers
do purchase almonds and other imported tree nuts on occasion, but the locally grown walnuts and
hazelnuts are the ‘go to’ nuts they prefer when it comes to day-to-day food choices.
Another market segment of walnut buyers in Ukraine is the confectionary industry. Producers of
chocolates, sweets, desserts, bakery products and snacks are the most reliable users of walnuts in the
local market. More research needs to be conducted to determine the specifics and trends of this market
segment.
Production, Supply and Demand Data Statistics:

GAIN Report – UP1534 – Walnuts Annual Report Page 7 of 15
UNCLASSIFIED USDA Foreign Agricultural Service
USD A Off icial N ew P o st USD A Off icial N ew P o st USD A Off icial N ew P o st
Area Planted (HA) 0 16,300 0 15,600 15,500
Area Harvested (HA) 0 16,300 0 15,600 15,500
Bearing Tress (1000 trees) 0 0 0 0 0
Non-Bearing Trees (1000 trees) 0 0 0 0 0
Total Trees (1000 trees) 0 0 0 0 0
Beginning Stocks (MT) 4,000 1,500 5,700 1,500 1,500
Production (MT) 95,000 115,790 85,000 102,740 102,000
Imports (MT) 0 0 0 0 0
Total Supply (MT) 99,000 117,290 90,700 104,240 103,500
Exports (MT) 75,000 75,227 65,000 59,320 55,700
Domestic Consumption (MT) 18,300 40,563 25,000 43,420 46,300
Ending Stocks (MT) 5,700 1,500 700 1,500 1,500
Total Distribution (MT) 99,000 117,290 90,700 104,240 103,500
USDA Offic ia l a nd FAS-Kyiv Fo re ca st Pro d uctio n Sup p ly a nd De ma nd Sta tis tics
Walnut, In Shel l Basis
Ukra ine
2013/2014
M arket Year B egin: Sep 2013
Revised
2015/2016
M arket Year B egin: Sep 2015
Forecast
2014/2015
M arket Year B egin: Sep 2014
Estimated
Author Defined:
GAIN Report – UP1534 – Walnuts Annual Report Page 8 of 15
UNCLASSIFIED USDA Foreign Agricultural Service
Quantity % Share Quantity % Share Quantity % Share
World 18,131.0 100.00 11,666.0 100.00 7,926.0 100.00 - 32.06
Iraq 5,321.0 29.35 3,539.0 30.33 3,458.0 43.63 - 2.28
Turkey 6,998.0 38.60 4,156.0 35.62 1,349.0 17.03 - 67.53
Romania 225.0 1.24 931.0 7.98 748.0 9.44 - 19.62
Vietnam 50.0 0.28 0.0 0.00 601.0 7.58 0.00
France 374.0 2.06 436.0 3.73 374.0 4.72 - 14.18
Iran 196.0 1.08 22.0 0.19 356.0 4.49 1518.64
China 0.0 0.00 0.0 0.00 277.0 3.50 0.00
Azerbaijan 1,245.0 6.86 995.0 8.53 256.0 3.23 - 74.29
Lebanon 30.0 0.17 1.0 0.01 89.0 1.13 8840.00
Bulgaria 22.0 0.12 0.0 0.00 88.0 1.11 0.00
Russia 1,734.0 9.56 1,060.0 9.09 54.0 0.68 - 94.91
Albania 10.0 0.06 22.0 0.19 44.0 0.56 100.00
Laos 0.0 0.00 0.0 0.00 40.0 0.50 0.00
Saudi Arabia 20.0 0.11 0.0 0.00 22.0 0.28 0.00
Libya 0.0 0.00 0.0 0.00 22.0 0.28 0.00
Morocco 0.0 0.00 0.0 0.00 22.0 0.28 0.00
Egypt 12.0 0.07 22.0 0.19 22.0 0.28 0.00
Armenia 0.0 0.00 0.0 0.00 22.0 0.28 0.00
Lithuania 0.0 0.00 12.0 0.10 22.0 0.27 79.17
Portugal 0.0 0.00 0.0 0.00 21.0 0.26 0.00
Czech Republic 0.0 0.00 20.0 0.17 20.0 0.25 - 1.23
Venezuela 0.0 0.00 0.0 0.00 18.0 0.23 0.00
Poland 0.0 0.00 0.0 0.00 0.0 0.00 0.00
Marshall Islands 0.0 0.00 0.0 0.00 0.0 0.00 0.00
Moldova 82.0 0.45 120.0 1.03 0.0 0.00 - 100.00
Panama 0.0 0.00 0.0 0.00 0.0 0.00 - 100.00
Macedonia 132.0 0.73 16.0 0.14 0.0 0.00 - 100.00
Slovakia 61.0 0.34 21.0 0.18 0.0 0.00 - 100.00
Spain 180.0 0.99 42.0 0.36 0.0 0.00 - 100.00
Syria 807.0 4.45 88.0 0.75 0.0 0.00 - 100.00
Algeria 169.0 0.93 50.0 0.43 0.0 0.00 - 100.00
Belarus 59.0 0.33 5.0 0.04 0.0 0.00 - 100.00
Italy 152.0 0.84 42.0 0.36 0.0 0.00 - 100.00
Jordan 24.0 0.13 0.0 0.00 0.0 0.00 0.00
Georgia 32.0 0.17 23.0 0.20 0.0 0.00 - 100.00
Germany 22.0 0.12 22.0 0.18 0.0 0.00 - 100.00
Greece 6.0 0.03 0.0 0.00 0.0 0.00 - 100.00
Hong Kong 148.0 0.82 0.0 0.00 0.0 0.00 0.00
Hungary 20.0 0.11 22.0 0.19 0.0 0.00 - 100.00
Source: State Fiscal Service of Ukraine
MY 2012/13
(Sep 12-Aug 13)
MY 2013/14
(Sep 13-Aug 14)
Walnut (In Shell) Exports from Ukraine by Destination, MY, MT (HS Code 080231)
Origin
MY 2011/12
(Sep 11-Aug 12)% Change
MY 2013/14 to
MY 2012/13

GAIN Report – UP1534 – Walnuts Annual Report Page 9 of 15
UNCLASSIFIED USDA Foreign Agricultural Service
GAIN Report – UP1534 – Walnuts Annual Report Page 10 of 15
UNCLASSIFIED USDA Foreign Agricultural Service
GAIN Report – UP1534 – Walnuts Annual Report Page 11 of 15
UNCLASSIFIED USDA Foreign Agricultural Service
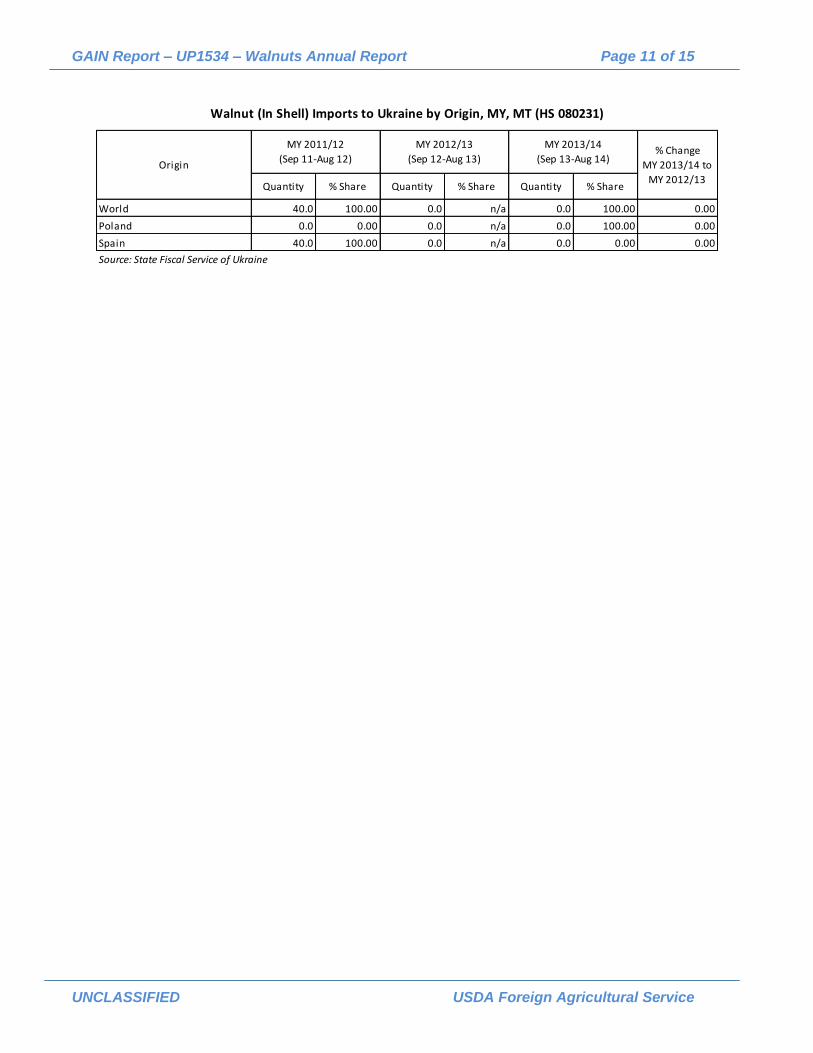
Quantity % Share Quantity % Share Quantity % Share
World 40.0 100.00 0.0 n/a 0.0 100.00 0.00
Poland 0.0 0.00 0.0 n/a 0.0 100.00 0.00
Spain 40.0 100.00 0.0 n/a 0.0 0.00 0.00
MY 2012/13
(Sep 12-Aug 13)
MY 2013/14
(Sep 13-Aug 14)% Change
MY 2013/14 to
MY 2012/13
Source: State Fiscal Service of Ukraine
Walnut (In Shell) Imports to Ukraine by Origin, MY, MT (HS 080231)
Origin
MY 2011/12
(Sep 11-Aug 12)
GAIN Report – UP1534 – Walnuts Annual Report Page 12 of 15
UNCLASSIFIED USDA Foreign Agricultural Service
GAIN Report – UP1534 – Walnuts Annual Report Page 13 of 15
UNCLASSIFIED USDA Foreign Agricultural Service
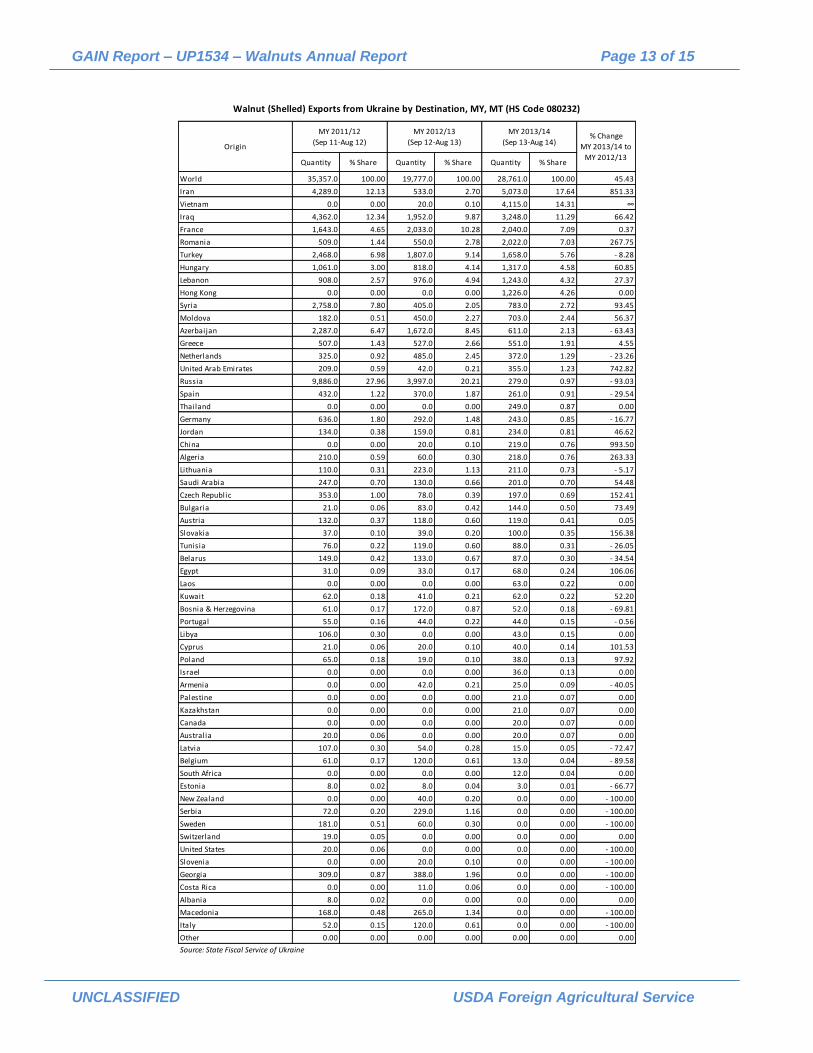
Quantity % Share Quantity % Share Quantity % Share
World 35,357.0 100.00 19,777.0 100.00 28,761.0 100.00 45.43
Iran 4,289.0 12.13 533.0 2.70 5,073.0 17.64 851.33
Vietnam 0.0 0.00 20.0 0.10 4,115.0 14.31 ∞
Iraq 4,362.0 12.34 1,952.0 9.87 3,248.0 11.29 66.42
France 1,643.0 4.65 2,033.0 10.28 2,040.0 7.09 0.37
Romania 509.0 1.44 550.0 2.78 2,022.0 7.03 267.75
Turkey 2,468.0 6.98 1,807.0 9.14 1,658.0 5.76 - 8.28
Hungary 1,061.0 3.00 818.0 4.14 1,317.0 4.58 60.85
Lebanon 908.0 2.57 976.0 4.94 1,243.0 4.32 27.37
Hong Kong 0.0 0.00 0.0 0.00 1,226.0 4.26 0.00
Syria 2,758.0 7.80 405.0 2.05 783.0 2.72 93.45
Moldova 182.0 0.51 450.0 2.27 703.0 2.44 56.37
Azerbaijan 2,287.0 6.47 1,672.0 8.45 611.0 2.13 - 63.43
Greece 507.0 1.43 527.0 2.66 551.0 1.91 4.55
Netherlands 325.0 0.92 485.0 2.45 372.0 1.29 - 23.26
United Arab Emirates 209.0 0.59 42.0 0.21 355.0 1.23 742.82
Russia 9,886.0 27.96 3,997.0 20.21 279.0 0.97 - 93.03
Spain 432.0 1.22 370.0 1.87 261.0 0.91 - 29.54
Thailand 0.0 0.00 0.0 0.00 249.0 0.87 0.00
Germany 636.0 1.80 292.0 1.48 243.0 0.85 - 16.77
Jordan 134.0 0.38 159.0 0.81 234.0 0.81 46.62
China 0.0 0.00 20.0 0.10 219.0 0.76 993.50
Algeria 210.0 0.59 60.0 0.30 218.0 0.76 263.33
Lithuania 110.0 0.31 223.0 1.13 211.0 0.73 - 5.17
Saudi Arabia 247.0 0.70 130.0 0.66 201.0 0.70 54.48
Czech Republic 353.0 1.00 78.0 0.39 197.0 0.69 152.41
Bulgaria 21.0 0.06 83.0 0.42 144.0 0.50 73.49
Austria 132.0 0.37 118.0 0.60 119.0 0.41 0.05
Slovakia 37.0 0.10 39.0 0.20 100.0 0.35 156.38
Tunisia 76.0 0.22 119.0 0.60 88.0 0.31 - 26.05
Belarus 149.0 0.42 133.0 0.67 87.0 0.30 - 34.54
Egypt 31.0 0.09 33.0 0.17 68.0 0.24 106.06
Laos 0.0 0.00 0.0 0.00 63.0 0.22 0.00
Kuwait 62.0 0.18 41.0 0.21 62.0 0.22 52.20
Bosnia & Herzegovina 61.0 0.17 172.0 0.87 52.0 0.18 - 69.81
Portugal 55.0 0.16 44.0 0.22 44.0 0.15 - 0.56
Libya 106.0 0.30 0.0 0.00 43.0 0.15 0.00
Cyprus 21.0 0.06 20.0 0.10 40.0 0.14 101.53
Poland 65.0 0.18 19.0 0.10 38.0 0.13 97.92
Israel 0.0 0.00 0.0 0.00 36.0 0.13 0.00
Armenia 0.0 0.00 42.0 0.21 25.0 0.09 - 40.05
Palestine 0.0 0.00 0.0 0.00 21.0 0.07 0.00
Kazakhstan 0.0 0.00 0.0 0.00 21.0 0.07 0.00
Canada 0.0 0.00 0.0 0.00 20.0 0.07 0.00
Australia 20.0 0.06 0.0 0.00 20.0 0.07 0.00
Latvia 107.0 0.30 54.0 0.28 15.0 0.05 - 72.47
Belgium 61.0 0.17 120.0 0.61 13.0 0.04 - 89.58
South Africa 0.0 0.00 0.0 0.00 12.0 0.04 0.00
Estonia 8.0 0.02 8.0 0.04 3.0 0.01 - 66.77
New Zealand 0.0 0.00 40.0 0.20 0.0 0.00 - 100.00
Serbia 72.0 0.20 229.0 1.16 0.0 0.00 - 100.00
Sweden 181.0 0.51 60.0 0.30 0.0 0.00 - 100.00
Switzerland 19.0 0.05 0.0 0.00 0.0 0.00 0.00
United States 20.0 0.06 0.0 0.00 0.0 0.00 - 100.00
Slovenia 0.0 0.00 20.0 0.10 0.0 0.00 - 100.00
Georgia 309.0 0.87 388.0 1.96 0.0 0.00 - 100.00
Costa Rica 0.0 0.00 11.0 0.06 0.0 0.00 - 100.00
Albania 8.0 0.02 0.0 0.00 0.0 0.00 0.00
Macedonia 168.0 0.48 265.0 1.34 0.0 0.00 - 100.00
Italy 52.0 0.15 120.0 0.61 0.0 0.00 - 100.00
Other 0.00 0.00 0.00 0.00 0.00 0.00 0.00
MY 2012/13
(Sep 12-Aug 13)
MY 2013/14
(Sep 13-Aug 14)% Change
MY 2013/14 to
MY 2012/13
Source: State Fiscal Service of Ukraine
Walnut (Shelled) Exports from Ukraine by Destination, MY, MT (HS Code 080232)
Origin
MY 2011/12
(Sep 11-Aug 12)

GAIN Report – UP1534 – Walnuts Annual Report Page 14 of 15
UNCLASSIFIED USDA Foreign Agricultural Service
GAIN Report – UP1534 – Walnuts Annual Report Page 15 of 15
UNCLASSIFIED USDA Foreign Agricultural Service
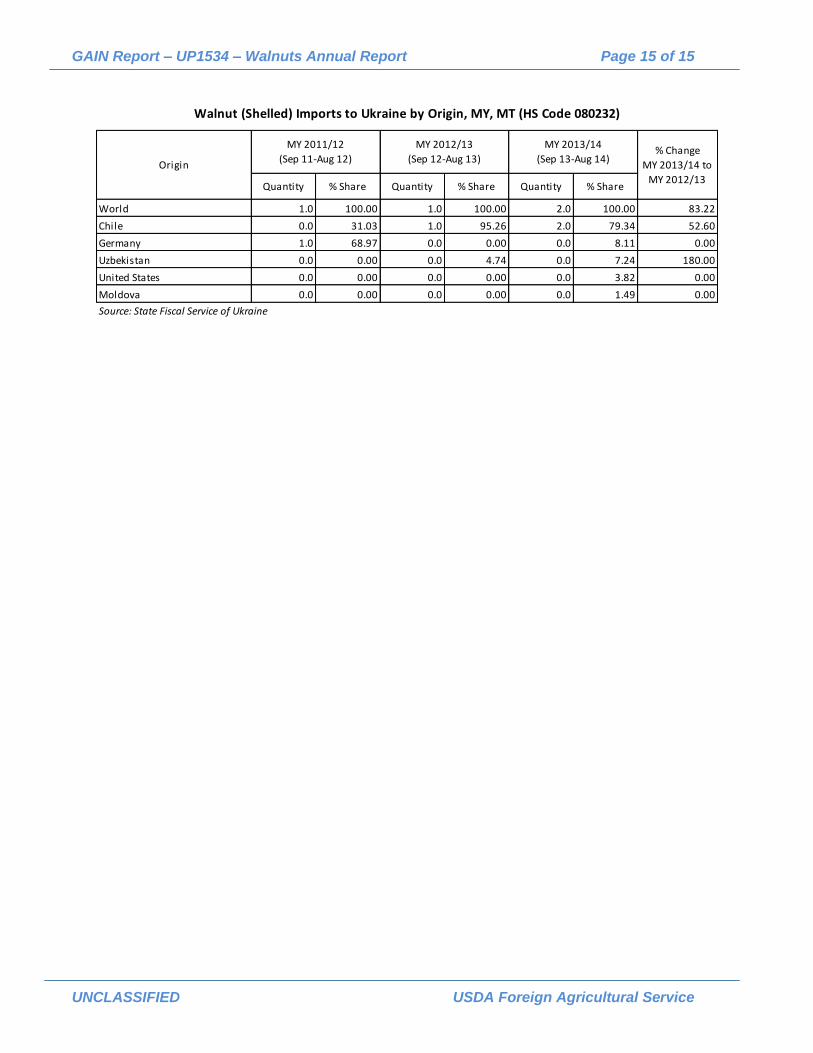
Quantity % Share Quantity % Share Quantity % Share
World 1.0 100.00 1.0 100.00 2.0 100.00 83.22
Chile 0.0 31.03 1.0 95.26 2.0 79.34 52.60
Germany 1.0 68.97 0.0 0.00 0.0 8.11 0.00
Uzbekistan 0.0 0.00 0.0 4.74 0.0 7.24 180.00
United States 0.0 0.00 0.0 0.00 0.0 3.82 0.00
Moldova 0.0 0.00 0.0 0.00 0.0 1.49 0.00
MY 2012/13
(Sep 12-Aug 13)
MY 2013/14
(Sep 13-Aug 14)% Change
MY 2013/14 to
MY 2012/13
Source: State Fiscal Service of Ukraine
Walnut (Shelled) Imports to Ukraine by Origin, MY, MT (HS Code 080232)
Origin
MY 2011/12
(Sep 11-Aug 12)