Ukraine Policy Dialogue report -...
99
February 2012 3448_0711PB IHS CERA Ministry of Energy and Coal Industry of Ukraine SPECIAL REPORT Natural Gas and Ukraine’s Energy Future Ukraine Policy Dialogue
Transcript of Ukraine Policy Dialogue report -...

February 2012
3448_0711PB
IHS CERAMinistry of Energy and Coal Industry of Ukraine
SPECIAL REPORT
Natural Gas and Ukraine’s Energy FutureUkraine Policy Dialogue

TERMS OF USE. The accompanying materials were prepared by IHS CERA Inc. (hereafter IHS CERA) and are not to be redistributed without prior written consent. IHS CERA content and information, including but not limited to graphs, charts, tables, figures, and data, are not to be reprinted or redistributed without prior written permission from IHS CERA. Content distributed or reprinted must display IHS CERA’s legal notices and attributions of authorship. IHS CERA provides the materials “as is” and does not guarantee or warrant the correctness, completeness or currentness, merchantability, or fitness for a particular purpose. All warranties of which are hereby expressly disclaimed and negated. To the extent permissible under the governing law, in no event will IHS CERA be liable for any direct, indirect, special, incidental, lost profit, lost royalties, lost data, punitive, and/or consequential damages, even if advised of the possibility of same.
© IHS, 2012
No portion of this report may be reproduced, reused, or otherwise distributed in any form without prior written consent.

IHS CERA & Ministry of Energy and Coal Industry of Ukraine would like to acknowledge and thank our Premium Partners in supporting the Ukraine Policy Dialogue Initiative

IHS CERA & Ministry of Energy and Coal Industry of Ukraine would like to acknowledge and thank our Premium Partners in supporting the Ukraine Policy Dialogue Initiative

Cadogan Petroleum plc, 5th Floor 4/5 Grosvenor Place, London SW1X 7HJ
T: +44 (0)207 245 0801 F: +44 (0)207 245 0802
Registration Number: 5718406
Registered in England and Wales
IHS CERA & Ministry of Energy and Coal Industry of Ukraine would like to acknowledge and thank our Standard Partners in supporting the Ukraine Policy Dialogue Initiative


Ukraine Special Report Natural Gas and Ukraine’s Energy Future
Executive Summary 1
© 2012 IHS No portion of this report may be reproduced, reused, or otherwise distributed in any form without prior written consent.
Ukraine Special Report: Natural Gas and Ukraine’s Energy Future
EXECUTIVE SUMMARY
At the request of Ukraine’s Ministry of Energy and Coal Industry, IHS CERA has carried out an intensive six-month program of research, consultation, and analysis in order to help all stakeholders develop a shared understanding of the specific challenges and opportunities presented by Ukraine’s natural gas industry. This has allowed participants to begin developing some policy concepts that could help Ukraine realize its full potential in this sector in partnership with both domestic and foreign investors.
This Executive Summary outlines the main conclusions of the Special Report as well the as the specific policy recommendations that have emerged from the dialogue.
The overriding insight of the study program is that Ukraine has the potential to transform its natural gas industry by enacting the right policies. The geological potential exists for Ukraine to produce much larger volumes of gas than it does today and, with the right demand-side measures, even to reach self-sufficiency in natural gas. Achieving this goal will only be possible, however, with much larger flows of investment into gas exploration and development—and this investment can be expected only if today’s industry structure and regulatory climate are reformed to attract private sector involvement from both domestic and international sources.

Ukraine Special Report Natural Gas and Ukraine’s Energy Future
2 Executive Summary
©2012 IHS No portion of this report may be reproduced, reused, or otherwise distributed in any form without prior written consent.
Hydrocarbon Resource Assessment
It is clear that Ukraine’s natural gas resource potential is very large—certainly much larger than commonly perceived. Although IHS CERA has not carried out a detailed, independent technical resource assessment, we have applied our own international experience as well as our methodologies for assessing so-called yet-to-find resources to data and analyses obtained from a variety of sources, including IHS proprietary databases and official data provided by Naftogaz of Ukraine and the government of Ukraine.
Ukraine’s gas potential will be produced from several distinct sources:
Advanced recovery from fields already in production
Development of discoveries currently considered marginal
Exploration for new accumulations within existing conventional plays or in new areas of southern Ukraine, including the offshore Black Sea
Tight gas sands, i.e., reservoirs with substantial resources but extremely low permeability
Unconventional gas resources, including both shale gas and coalbed methane (CBM)
Regardless of the source, Ukraine’s ability to achieve its potential—or even to scratch the surface—will depend heavily on the extent to which modern technologies for seismic evaluation, drilling, completion, well stimulation, and production management are applied. This, in turn, will depend mainly on the attractiveness of the investment climate for exploration and production (E&P).
IHS CERA has generated an indicative gas production profile for Ukraine through 2035 under a scenario in which modern technologies are gradually but comprehensively applied (see Figure ES-1). This production profile does not rely on particularly aggressive assumptions from a geological point of view, but it does require that investment in upstream gas development grows from present levels of approximately $1 billion annually to levels approaching $10 billion annually.
Figure ES-1
Projected Production Profile 2012–35
Existing Fields (decline)
New Resource Development
Tight Gas Reservoirs
Unconventionals Base Case
0
10
20
30
40
50
60
70
80
2005 2010 2015 2020 2025 2030 2035
Annual Production
(Bcm)
Source: IHS CERA.

Ukraine Special Report Natural Gas and Ukraine’s Energy Future
Executive Summary 3
© 2012 IHS No portion of this report may be reproduced, reused, or otherwise distributed in any form without prior written consent.
This production scenario is characterized by the following underlying trends and estimates:
The incipient decline of conventional gas production in Ukraine is reversed by 2015 on the basis of major investment, including from foreign investors, along with the application of modern upstream technologies. This results in new production of about 14 billion cubic meters (Bcm) per year by 2025 and 26 Bcm per year by 2035. High levels of investment activity should gradually convert conventional gas resources that are today considered contingent or prospective into proven reserves.
Tight gas development starts slowly but achieves production levels of 9 Bcm per year by 2025 and 16 Bcm per year by 2035.
Evaluation, appraisal, and development of unconventional gas resources result in the achievement of a production plateau of 25 Bcm per year soon after 2025. It is this component of Ukraine’s gas potential that carries with it the highest level of uncertainty; IHS CERA has developed several scenarios for shale gas and CBM production based on varying estimates of formation productivity and other factors. The scenario that has been incorporated into the indicative production profile is a reasonable reference case.
Ukraine’s Gas Transportation System
Ukraine’s extensive gas transportation system, which includes nearly 40,000 kilometers of transmission pipeline and 74 compressor stations along with 32 Bcm of active storage capacity—which is at present bundled with the pipeline system in terms of ownership and operations—is a core asset for Ukraine in terms of both its strategic importance and its economic value.
The flow of Russian transit gas through Ukraine’s trunk pipelines has declined in recent years both in absolute terms and as a percentage of total Russian exports to Europe. IHS CERA expects transit volumes to continue their decline in the medium term with the start-up of the Nord Stream pipeline, and then to stabilize toward the end of the present decade, with slow growth possible after 2020.
It is an appropriate goal for Ukrainian policy to reinforce the central importance of the transit system for Russian gas exports and European gas supply. One mechanism that has been proposed in this regard is transfer of trunk pipeline ownership and operations to a Ukraine-led multilateral consortium in which both Russian and European companies would take a minority shareholding. Such an arrangement would require consensus on a wide range of legal and commercial issues.
Ukraine’s Domestic Gas Market—Pricing, Consumption, and Indigenous Production
Ukraine’s domestic gas market was designed for an era of cheap gas that no longer exists. Not only does the current gas market structure result in large and sustained financial losses for the state, not to mention inevitable complications in the relationship with Ukraine’s main gas supplier, but it also acts as a disincentive to investment in new gas development. For these reasons, IHS CERA believes the status quo is no longer sustainable.
The sector is dominated by Naftogaz of Ukraine, a 100% state-owned entity, which through a network of subsidiaries is the leading or only player in all major areas of the natural gas industry: production, import, transportation, storage, distribution, and sales. Price regulation is mainly the responsibility of the National Electricity Regulatory Committee (NERC).

Ukraine Special Report Natural Gas and Ukraine’s Energy Future
4 Executive Summary
©2012 IHS No portion of this report may be reproduced, reused, or otherwise distributed in any form without prior written consent.
Ukraine’s domestic gas market of approximately 55 Bcm annually (not including pipeline system use and losses) is divided into three categories:
Industrial customers—a group which by NERC definition includes the power generation sector—make up about 45% of the market. Users in this category pay prices that fully reflect the cost of imported gas.
Residential customers make up about 35% of the market, and pay a regulated price which, although it has increased significantly in the past three years, remains very low by European standards. This price is notionally linked with the supply cost of gas produced domestically by Naftogaz’s affiliates.
District heating utilities account for the remaining 20% of demand and pay a blended price reflecting both import prices and supply costs for domestic gas.
The recent history of gas demand and pricing is shown in Figure ES-2.
Figure ES-2
Gas Deliveries by Category of User, 2000–10
17.2
17.3
17.0
18.0 17.1 18.0 18.9 17.1
17.6
16.8
17.6
17.4
8.6
10.8 12.8
14.4 13.9 13.7 12.9
10.5
10.1
10.2
11.1 10.9
8.3 7.6 8.1
8.3 8.8 8.7 8.2
7.2
7.2
5.8
5.3 5.3
73.4 70.5 69.8
76.3 75.8 76.4
74.0
69.9
66.4
52.0
57.7 59.3
38.3
33.8 30.9
34.5 35.0 34.9 32.9
34.1
30.5
18.4
22.7 24.7
0
50
100
150
200
250
300
350
400
450
0
10
20
30
40
50
60
70
80
90
2000 2001 2002 2003 2004 2005 2006 2007 2008 2009 2010 1H2011
$/M
cm
wit
h V
AT
Bcm
Internal Use by Gas Sector* Heat Producers**
Budgetary Organizations Population
Other Chemicals
Metals and Mining Power Sector
Total Industry, Total
Gas Price for Industry, Rhs Gas Price for Population, Rhs
Gas Price for District Heating, Rhs
Source: IHS CERA. *Includes internal gas use by transporting, distributing, and gas-producting companies. **For the needs of population, budgetary organizations, and other residential users.

Ukraine Special Report Natural Gas and Ukraine’s Energy Future
Executive Summary 5
© 2012 IHS No portion of this report may be reproduced, reused, or otherwise distributed in any form without prior written consent.
The present market structure is not sustainable for the following reasons:
Structural financial losses. The district heating sector continues to pay a low “blended” price even though it is being supplied notionally with purely imported gas; this arrangement results in losses to Naftogaz of as much as $2.5 billion annually.
High import prices. Prices in many European contracts for import of Russian gas have been revised downward in the past two years, while Ukraine’s January 2009 contract terms have not changed in parallel. As a result, Ukraine’s average import price for Russian gas now exceeds the export parity value of this gas, which is to say, it is significantly higher than the German border price minus transit costs from Ukraine to Germany.
Disincentives to upstream investment. The regulated prices established for gas produced by Naftogaz and its affiliates are much lower than prices for imported gas, and too low to justify new investment under most circumstances. Domestic production is in decline as a result.
Demand Outlook
Although Ukrainian industry has reduced its gas consumption significantly in recent years under the pressure of rising prices, IHS CERA sees substantial further potential for greater increases in energy efficiency. In particular, the chemicals sector (consuming 8 to 8.5 Bcm annually at present) could reduce its use of gas by 2 Bcm per year while maintaining its current output, and the metals sector (with consumption of roughly 9 Bcm annually) could similarly cut consumption by nearly 4 Bcm per year.
Meanwhile, higher prices for the residential sector would also lead to some greater efficiency and reduced demand. However, there is limited potential for reducing demand elsewhere, and economic growth will tend to have some upward effect on gas consumption. IHS CERA has developed alternative scenarios for Ukrainian gas demand. In the highest case, demand grows to 73 Bcm by 2030; in the lowest case, it declines to 55 Bcm. In the base case scenario, however, Ukrainian consumption of gas will be flat or show very slight growth during this period as efficiency improvements in some sectors offset growing demand in others.
Supply Outlook
One area of growth in Ukrainian gas production in recent years has been the small share of production (just 8%) controlled by independent producers, which are allowed to sell gas domestically at an unregulated price. More investment here is possible if the investment climate is perceived to be stable and fair; however, under present circumstances this will remain just a small component of overall gas production and will at best make up for declining Naftogaz production.
The prospects of a more significant boost in Ukrainian domestic gas supply depend entirely on a more radical change in the environment for investment in gas development, including reform of the state sector as well as pricing reform.
The Regulatory Environment
Although Ukrainian legislation affecting the gas sector has fostered many positive changes in the past 18 months, the overall regulatory environment for investors remains complex and extremely challenging.

Ukraine Special Report Natural Gas and Ukraine’s Energy Future
6 Executive Summary
©2012 IHS No portion of this report may be reproduced, reused, or otherwise distributed in any form without prior written consent.
The permitting process for E&P (for oil as well as gas) has changed frequently in the past three years, creating an overall sense of legal and regulatory instability. Meanwhile, the overall permitting framework contains flaws and ambiguities that risk leading investors to the conclusion that full compliance is time-consuming at best and impossible at worst.
Customs clearance procedures for imported equipment are cumbersome and expensive, and add to upstream development costs; any benefit in terms of local content is outweighed by the negative impact of reduced upstream investment and development.
The new Law “On the Principles of the Functioning of the Natural Gas
Market,” which was adopted in July 2010 as a condition of accession to the Energy Community—an EU-backed multilateral organization—represents a step forward. However, in many areas the law lacks specific implementation mechanisms and fails to define clearly a “transition period” during which provisions will be phased in. Furthermore the Law continues the practice of regulated pricing for wholly or partly state-owned gas producers.
The European Gas Market
The events of the past three years have put the traditional structures of the European gas market under great stress. In the economic recession of 2009, European gas demand declined sharply just as the global liquefied natural gas market became oversupplied. This resulted in a large pricing differential between gas delivered at (high) oil-linked prices under long-term contracts on the one hand and the (low) spot prices for gas traded at the Continent’s emerging hubs on the other.
This situation put enormous pressure on the long-term contracts that have long formed the basis for Gazprom’s sales into Europe—not to mention huge financial pressure on the traditional leading companies of the European gas midstream, which found themselves buying gas at high prices and selling it at low prices. Although the market has largely returned to balance in 2011, it is clear that the European gas industry has changed in some fundamental ways, most notably with the growing relevance of traded market prices for gas.
These developments are not, however, likely to have a major impact on Ukraine’s position with respect to the European gas market. Some key elements of the market should remain relatively stable going forward.
Demand growth to continue. First, European import of gas is very likely to continue growing over time because of slow but steady demand growth as well as declining indigenous production. It is true that Europe has considerable potential for production of shale gas and CBM. But for reasons of cost and politics, IHS CERA believes that unconventional gas will emerge more gradually in Europe than in North America.
Russia a main supplier. Second, Russia will remain a major source of gas for Europe imports under any scenario; and indeed in most scenarios European imports of Russian gas will continue to grow over time.
Radical scenarios in which European gas demand begins to decline sharply as a result of a major focus on renewable energy and efficiency, or where an explosive shale gas boom (in Poland and elsewhere) displaces Russian gas, are theoretically possible but unlikely.
These conclusions highlight again the relevance of the Ukrainian pipeline system for Europe as well as Russia, even in the context of declining transit volumes.

Ukraine Special Report Natural Gas and Ukraine’s Energy Future
Executive Summary 7
© 2012 IHS No portion of this report may be reproduced, reused, or otherwise distributed in any form without prior written consent.
Benchmarking Analysis of Ukraine and Other Competing International Opportunities
IHS CERA has undertaken a comparative review of Ukraine as a destination for investment in E&P, taking into account a wide range of parameters including average field characteristics, capital and operating costs, and fiscal terms. The IHS proprietary databases were used to review a total of 30 conventional gas plays and 26 unconventional gas plays for comparison.
Overall, Ukraine did not fare particularly well in comparison to the other plays considered, largely because of its relatively unattractive fiscal terms in the context of the commercial environment for marketing the produced gas.
Recommendations for the Future
The following specific policy recommendations emerged from the dialogue. Taken together, IHS CERA would expect that the implementation of policies along the lines described in this Special Report would attract substantial new investment to the Ukrainian gas sector and help Ukraine achieve the promise of its potential natural gas resources.
Industry Structure
Ukraine can benefit from the vertical unbundling of the gas sector by restructuring the current integrated industry into distinct segments:
An upstream segment that will build on today’s semicompetitive playing field to become fully competitive in the context of stronger and clearer regulation
A downstream segment comprising distribution and marketing into which more competition can gradually be introduced
A midstream segment—transportation and storage—that could remain as a regulated monopoly for the time being (although storage could be spun off as well).
Upstream
A target of attracting up to $10 billion of investment annually into the upstream will likely require a revamp of the terms under which foreign or domestic investors can invest in the exploration and development of natural gas (as well as oil). This could include the following reforms:
Changes to permitting including greater duration and acreage for license awards, a strong preference for issuing combined special permits for E&P, and in general more streamlined permitting procedures
Strengthening the stability of properly obtained permits and introducing robust procedures for smooth conversion of existing exploration permits into production permits
Increasing significantly the time allowed for submission of bidding documents at license auctions
Developing special rules for unconventional gas E&P because of the inherent differences relative to conventional gas development
Making access to exploration data easier
Simplifying procedures for importing equipment and reducing customs duties on new technology for E&P

Ukraine Special Report Natural Gas and Ukraine’s Energy Future
8 Executive Summary
©2012 IHS No portion of this report may be reproduced, reused, or otherwise distributed in any form without prior written consent.
Implementing an internationally competitive system of upstream taxation—necessary (but not sufficient) condition for meeting Ukraine’s investment needs. Such a regime would combine a relatively low royalty (no more than 10% of sale price) with profit-based taxation. This tax-and-royalty approach could be complemented with an alternative system based on production-sharing agreements for larger, more difficult projects (for instance, those offshore).
Downstream
In terms of the domestic gas market, full implementation of the 2010 law on Principles of Functioning of the Natural Gas Market is a good first step, but there is a need to go further in some areas:
The principle of free choice of suppliers for consumers will provide strong leverage for squeezing costs out of the supply chain and ultimately lead to lower prices for end users.
Secondary legislation will be required to implement the principle of
nondiscriminatory access to the gas transportation system as well as storage facilities.
Price liberalization will ultimately remove distortions caused by regulation. The extent of this liberalization should lie in a range of outcomes:
At a maximum, this would include full price liberalization for all categories of customers, combined with financial support for vulnerable categories of consumers (which could be financed by upstream royalties).
As a minimum first step, regulated prices for sales to district heating
utilities would be increased to reflect the actual cost of gas acquisition in order to make Naftogaz financially sustainable.
Ukraine’s greatest challenge is that there is only a limited track record of international private-sector investors participating in its E&P sector and achieving commercial success. This lack of visible success stories along with the complex regulatory environment have created the perception Ukraine is a difficult place in which to invest in gas development.
Adopting the recommendations arising from this dialogue and study program will not alter perceptions immediately. But the experience of other countries following this path suggests that a goal of self-sufficiency in natural gas could be achieved through Ukraine’s consistent and patient application of the policy prescriptions laid out in this Special Report.

Ukraine Special Report Natural Gas and Ukraine’s Energy Future
Chapter 1 1-1
© IHS, 2012 No portion of this report may be reproduced, reused, or otherwise distributed in any form without prior written consent.
CHAPTER 1: HYDROCARBON RESOURCE ASSESSMENT
Introduction
This section provides a high-level overview of the current status and potential of Ukraine's conventional and unconventional gas resources, in order to characterize the development opportunities that can be encouraged by future energy policy. This overview makes use of data and insights provided by Naftogaz of Ukraine and the government of Ukraine as well as IHS CERA and publicly available data on historical production and gas resources and reserves. IHS CERA has applied its judgments based on international experience, particularly for areas in which specific data for Ukraine was limited. It is important to highlight that this study is intended to provide an overview only and does not amount to a full, independent technical assessment of Ukraine's gas resources.
Undoubtedly, Ukraine has vast resource potential divided among three areas: existing producing areas in the east and west of the country, new areas including the South as well as the Ukrainian sector of the Black Sea, and finally the country's largely unexplored unconventional reservoirs. The Ukrainian government estimates remaining conventional gas resources at 5.37 trillion cubic meters (Tcm), a large portion of which is characterized as prospective resources. For comparison, there are 2.6 Tcm of remaining resources in the highly mature onshore and offshore areas of the Netherlands and the United Kingdom, and about 3 Tcm remaining in offshore Norway. Meanwhile, estimates for the commercial potential of Ukraine's unconventional shale gas vary widely from 1.2 Tcm in a recent US study to IHS CERA’s own estimate of 11.5 Tcm.
In this study, a variety of potential upstream investment opportunities have been identified for both conventional and unconventional resources. These opportunities can be categorized broadly as follows:
Further development of existing fields. Ukraine has large gas resources in fields that have been producing for decades but which have seen limited investment since independence. These fields could potentially yield new resources through the application of production optimization, gas compression, infill drilling, and development of small pools as satellites.
Development of recent discoveries and economically marginal fields. Here also the broader application of new technologies, including 3D seismic, could have a strong impact.
Exploration within known conventional plays, for instance, stratigraphic and lithological traps or salt tectonic complexes, where broader application of new technology could bring major benefits.
Exploration in new plays which are yet to be identified or fully defined. These include deep plays and in particular the deeper offshore sectors of the Black Sea, which could contain large undiscovered potential.
Tight gas sands. These structures pose a technical challenge because of their low permeability. However, commercial exploitation of such resources, if their commercial potential can be proven, would again benefit enormously from modern technology such as hydraulic fracturing which has only just started to be used widely in Ukraine.
Unconventional resources (shale gas and coalbed methane [CBM]).
Unconventional gas clearly offers major opportunities for increased gas production

Natural Gas and Ukraine’s Energy Future Ukraine Special Report
1-2 Chapter 1
© IHS, 2012 No portion of this report may be reproduced, reused, or otherwise distributed in any form without prior written consent.
in the Ukraine if the lessons of the US unconventional gas boom can be applied and if geological potential can be developed into a commercial resource.
The rest of this section summarizes the current resource base and the potential of prospective resources in Ukraine, taking particularly into account the potential benefits from application of modern exploration and production technology as well as the potential of tight sands and unconventional reservoirs.
Conventional Gas: Overview of Gas Resource Base
The following discussion of Ukraine's future gas production potential draws on assessments of ultimate recoverable resources provided by the Ukrainian government. The IHS CERA analysis puts these estimates in a context of potential development, investment, and risk over the period 2012-35 and reflects IHS CERA's tested approach for estimating resources based on the recognized classification system commonly used by international investors.
It is important to highlight that there are some key differences between the resource assessment methodology used by Naftogaz and the Ukrainian government and that used by IHS CERA. In Ukraine, the classification system developed during the Soviet period is used; this puts reserves and resources into six categories, namely, A, B, C1, C2, C3 and D. For its part, IHS CERA applies the Petroleum Resources Management System (PRMS) defined by the Society of Petroleum Engineers. IHS CERA's analysis of recoverable resources are based on the PRMS categories of proven and probable (referred to as 2P), which is considered the equivalent of A+B+C1 reserves in the Ukrainian classification. The categories C2 and C3 can be considered as contingent resources. Category D is considered equivalent to prospective resources in this report following PRMS standards, although in Ukraine, this category is often referred to as predicted resources.
The official Ukrainian government estimate of 5.37 Tcm for remaining conventional gas resources includes both contingent and prospective (predicted) resources, i.e., all categories through D, with category D resources representing 64% of this total.
Table 1-1 compares resource estimates from IHS CERA data with estimates from various Ukrainian sources, as reinterpreted by IHS CERA. As can be seen, there are no significant differences between the IHS CERA assessment of proven and probable reserves and the Ukrainian assessment of A+B+C1, either on an overall or regional basis.
Table 1-1
Ukraine's Initial Conventional Gas Resources, IHS CERA and Various Estimates from Various Ukrainian Sources
(nonassociated gas; billion cubic meters)
Region IHS Ukraine
Proven + Probable Initial ABC1 C2+C3 D Total Remaining
East 2,374 2,431 707 1,516 4,654 2,791
West 407 368 136 373 877 554
South 99 101 350 1,602 2,053 2,021
Total 2,880 2,900 1,193 3,491 7,584 5,366
Source: IHS CERA. Note: The above estimates are based on various sources and reinterpreted by IHS CERA, which can lead to slight differences with some official Ukrainian published numbers.

Ukraine Special Report Natural Gas and Ukraine’s Energy Future
Chapter 1 1-3
© IHS, 2012 No portion of this report may be reproduced, reused, or otherwise distributed in any form without prior written consent.
These figures show that most of Ukraine's initial 2P reserves are or were located in the East, while a large portion of Ukraine's ultimate potential lies in the South, including the offshore Black Sea.
Ukraine geoscientists estimate the country's potential ultimate recoverable resources based not only on A, B, and C1, but also taking into account contingent (C2 and C3) and prospective (D) resources. It should be noted that the Ukrainian system defines category D as an unallocated resource figure, often referred to as predictive resource, meaning that no specific prospect has been identified and drilled; instead the estimate is based on the density of exploration within a basin, information on success rates, and the expectation that future prospects will be found.
The methodology used by IHS CERA to estimate yet-to-find (YTF) resources instead extrapolates from proven and probable resources based on the reserve probability distribution in existing petroleum systems, and takes into account minimum economically recoverable risked resources as well as differences in development timing. This IHS CERA method does not fully capture the potential of plays that have not yet been identified, and ultimate potential can turn out to be higher than YTF estimates made by this method. Therefore in this report we make reference to all categories of resource potential, drawing on the data made available by the government of Ukraine.
It should also be noted that of resources in the C2, C3, and D categories, more than 50% are estimated to be situated at drilling depths of between 4,000 and 6,000 meters (m), with around two thirds of this resource deeper than 5,000 m. This suggests that exploitation of these resources will involve higher risk because of tighter and deeper reservoirs, increased operational risks, and higher development costs.
Conventional Resource Opportunities by Region
Although detailed field-by-field analysis was not possible within the scope of this study, some broad estimates have been made about future development potential based on available data as well as the global experience of IHS CERA's team. The resource numbers quoted in the text are based on various Ukrainian sources and reinterpreted by IHS CERA.
East Region
The East region of Ukraine for the purposes of this report consists of the area in and around the Dnieper-Donets Basin in eastern Ukraine. It is the most developed of the three regions in terms of existing gas production. The first discoveries here were made more than a century ago, but the main phase of development took place in the 1960s and 1970s. Since that time, investment and development activity has been at relatively low levels, and new technologies such as 3D seismic, horizontal drilling, and hydraulic fracturing have been used to only a modest extent.
Reservoirs of Paleozoic age form the large majority of producing fields in this region. Reservoir characteristics vary widely from tight reservoirs with porosity of less than 10% and permeability less than 1 millidarcy to high-quality reservoirs with permeability in the darcy range. The structural style of the hydrocarbon traps and accumulations in this area also vary, ranging from simple anticlines, fault-blocks to complex salt tectonic areas. In general, the area is highly faulted with relatively small accumulations. Most reservoirs have normal pressures, but slight overpressure has been measured in some cases.
The East region has the highest ultimate recoverable resources in Ukraine based on the official government estimates, totaling 4,654 billion cubic meters (Bcm), which is 62% of the total estimated gas resource for the country. This includes contingent resources of 707 Bcm (category C2 + C3) and prospective resources of 1,516 Bcm (category D). This leaves a
Natural Gas and Ukraine’s Energy Future Ukraine Special Report
1-4 Chapter 1
© IHS, 2012 No portion of this report may be reproduced, reused, or otherwise distributed in any form without prior written consent.
figure of 2,431 Bcm for initial recoverable resources located in existing discoveries and producing fields (A+B+C1), of which 77% has already been produced.
Development of the remaining resources in these existing fields and discoveries as well as the contingent resources could benefit from modern 3D seismic surveys to better delineate small fault-blocks, deeper hydrocarbon pools, and small satellite fields. Modern production techniques such as horizontal drilling, hydraulic fracturing, and compression could improve recovery from marginal reservoirs. These technical options are discussed below.
It is estimated that 85% of the remaining resource in the category ABC1 can be developed through improved recovery and by successfully delineating new pools and satellites of existing fields. Thus, of the remaining 568 Bcm, a total of 483 Bcm could be developed in the future.
Potential development of the contingent resources (C2+C3) is much more uncertain because of geological, development, and economic risks. It is estimated that economic development of relatively small satellite accumulations will be feasible; this represents 66% of the total resources in this category, or 467 Bcm.
Prospective resources (category D) hold the largest risks both above and below ground. Given that this is a relatively mature basin, it is assumed that only 30% of this gas would ultimately be developed, leading to a potential of 455 Bcm.
Although this East region of Ukraine is mature, it would certainly benefit from the use of modern technology as discussed later in this section. In particular, the productivity of Paleozoic reservoirs should respond very well to modern fracturing techniques and horizontal wells.
West Region
This region in western Ukraine consists of areas bordering Poland, Romania, and Moldova, incorporating the Carpathian Flysch Zone, the Foredeep, and East European Platform. This geologically complex region is made up of sandstone reservoirs of Cretaceous and Tertiary age in complex structural settings ranging from simple horst and graben structures to heavily thrusted anticlines. Accumulations are relatively small with a median size of 2.2 Bcm, but with 15% of the fields bigger than 10 Bcm.
Gas resources in the West region are not at the same scale as the East region. Of the total initial resources of nonassociated gas of 877 Bcm, the initially recoverable category (A+B+C1) holds 368 Bcm, contingent resources (C2+C3) are 136 Bcm, and prospective/predicted resources (category D) are estimated at 373 Bcm. Since this is a very old region for gas production, most of the initial resource has already been produced, leaving only 45 Bcm in this category (about 5% of the initial resource). With regard to contingent resources, again the application of modern seismic technology to better delineate deeper pools or complex structures would be extremely helpful. However, given the zone's structural complexity, IHS CERA estimates that a total of 226 Bcm from the combined categories C2, C3, and D could be commercially developable in the future.
South Region
The southern region has been underexplored to date but has major potential over a large area. This region includes the Ukrainian sectors of the Azov and Black Seas as well as onshore areas of the Crimean Peninsula. The Black Sea zone includes shallow areas closer to shore, but water depths further south are greater than 2,000 m. Although seismic has been shot offshore in the past, exploration is immature, and many potential prospects have not

Ukraine Special Report Natural Gas and Ukraine’s Energy Future
Chapter 1 1-5
© IHS, 2012 No portion of this report may be reproduced, reused, or otherwise distributed in any form without prior written consent.
been properly defined. Modern exploration and drilling technology has been applied only to a very modest extent.
The major sandstone reservoirs are formed by the Oligocene-Miocene Mykop Group, but the largely untested potential is recognized in Carboniferous, Jurassic, and Cretaceous sandstones. Since many prospects are located in deep water, exploitation will require not only considerable investment but also a significant improvement in supply chain capability and infrastructure to service the emerging offshore industry as it develops.
To date, initial recoverable gas resources in the A+B+C1 category are estimated at 101 Bcm. Large potential of 350 Bcm is present as contingent resources (C2+C3), of which almost three-quarters could be located in the shallow part of the Black Sea in water depths of less than 100 m. Prospective resources (category D) for the entire South region amount to another 1,584 Bcm, of which 928 Bcm consists of potential resources located offshore in the Black Sea at depths of more than 100 m, with the Azov Sea accounting for another 291 Tcm.
Because of the large uncertainty around the extent of the geological plays in the offshore areas, it is assumed that 30% of the prospective resources will be developed with current technology, which is similar to discovery and development rates in the North Sea.
Application of Modern Technology to Develop Resources
The development of existing fields as well as exploration for new prospects in Ukraine has been hampered by low levels of investment as well as limited application of modern technology. A number of exploration and production methods that have been successfully used in other mature areas (such as Northwest Europe) could be used to improve the productivity of existing fields or to explore for additional gas accumulations.
3D Seismic
This technique is used not only to better delineate subsurface structures, but also--with the use of technology such as amplitude variation with offset and the evaluation of direct hydrocarbon indicators--to detect gas in small accumulations that would not previously have been recognized, for instance accumulations in unusual positions such as downthrown fault-blocks. This methodology has been very useful in the northern Netherlands, to cite one example, where significant additional resources have been discovered.
The use of 3D seismic acquisition has been limited to date in Ukraine. For example, since 1998, Naftogaz has shot a total of 6,553 square kilometers of 3D seismic, mostly concentrated in the Dnieper-Donets Basin and the offshore Black Sea. However, only 10%-20% of the prospective area of the Dnieper-Donets Basin is believed to have been covered by 3D seismic thus far. This represents a large opportunity for identifying additional resources in these mature areas.
Horizontal Drilling
Horizontal well-bores offer multiple advantages over vertical wells, such as larger drainage areas and limited pressure drawdown. Apart from improved reservoir recovery, multilateral well development also has reduced drilling and production costs per unit of production.
From data provided by Naftogaz, it is understood that horizontal drilling activity in Ukraine has been modest to date. Chornomornaftogaz has drilled eight horizontal wells, of which five were on the Skhidno-Kazantipskoye field in the Azov Sea and three on the Shtormovoye Field in the Black Sea. Naftogaz reported that it drilled nine horizontal wells

Natural Gas and Ukraine’s Energy Future Ukraine Special Report
1-6 Chapter 1
© IHS, 2012 No portion of this report may be reproduced, reused, or otherwise distributed in any form without prior written consent.
between 1999 and 2010, with a total of 1,688 m of horizontal section. Here also the potential opportunity for improved exploitation efficiency is clear.
Multilateral Completions
Operational and production efficiency can be improved significantly using multilateral well completions. This technique has not been used widely so far in Ukraine.
Well Stimulation Through Hydraulic Fracturing
This technology introduces fractures in the reservoir rock to enhance flow rates in reservoirs with low permeability. Although well stimulation has been in use for many decades, recent success in North American shale gas with multistage hydraulic fracturing has demonstrated its potential to increase flow rates from tight gas reservoirs as well as shale gas reservoirs. This technology has already been tested in the Olkhovskoye field with some success, suggesting there is potential for its further application in Ukraine.
Production Management
The use of compression to boost production is a well-established technique to extend field life and add to recoverable resources. Some success has been achieved on the Shebelinskoye field, where resource additions of some 295 Bcm have been cited, along with a significant increase of production levels.
It is also noted that nitrogen injection, which has been employed to great effect outside Ukraine (for instance in Mexico's Cantarell field), has been used to a small extent in Ukraine to increase production.
Tight Reservoir Development
Some parts of the gas reservoirs discovered in the past could not be developed because of poor reservoir properties. These "tight" reservoirs have relatively low porosity and permeability which restrict the flow of natural gas. Whereas normal producing reservoirs have permeability in the range of millidarcies to darcies, tight reservoirs have permeability of fractions of millidarcies. In this case, methods of well stimulation such as multistage fracturing could be used to enhance the permeability of induced fractures in order to drain the tight reservoirs.
Tight gas reservoirs are present in five recognized intervals in the Permian and Carboniferous areas of the Dnieper-Donets Basin. At present, only onshore reservoirs are considered feasible for development involving modern well stimulation. There are large opportunities for tight reservoir development not only in the East region but also to a lesser extent in the West region. Various tight reservoir intervals in the East region Carboniferous section are already targeted for future development.
No precise resource numbers are available, and estimates of ultimate recoverable tight gas resources based on a study carried out by the Ukrainian government vary between about 1.5 Tcm and 8.5 Tcm. Many of these resources are located at depths greater than 4,000 m, and to a large extent they have not been properly explored.
Unconventional Resources
The results of a recent IHS CERA study, which are supported by results from a separate study carried out by the Energy Information Agency within the US Department of Energy, show that Ukraine holds vast resources of shale gas and CBM. The majority of shale gas and CBM in Ukraine is present in the East region, specifically the Dnieper-Donets-Donbas Basin,

Ukraine Special Report Natural Gas and Ukraine’s Energy Future
Chapter 1 1-7
© IHS, 2012 No portion of this report may be reproduced, reused, or otherwise distributed in any form without prior written consent.
with some additional potential present in the West region. Total gas-in-place resources for unconventional gas in Ukraine could exceed 11.5 Tcm, in IHS CERA's view.
Experience from production in the United States shows that only a small portion of shale gas and CBM plays—their so-called sweet spots—are likely to be economically producible. The location and geometry of sweet spots is determined by gas content, maturity, depth, pressure, and rock mechanics; at this stage, these factors remain highly uncertain in frontier areas for unconventional gas such as Ukraine.
IHS CERA has mapped the potential areas for shale gas and CBM in the East and West regions of Ukraine. By applying analogues from the United States, potential key parameters including time to first production as well as ramp-up and plateau rates were determined for the various play areas. This allows modeling of potential longer-term production profiles for different cases, taking into account various possible levels for unit production costs.
The potential shale gas and CBM areas were risked on the basis of key geological parameters including depth, thickness, maturity, and gas content. From this analysis, each play was categorized to have high, medium, or low potential. Taking also into account aboveground risks such as access restrictions, recovery factors, and regulatory constraints, IHS CERA estimated the timing of when each play could start production, the time it would take to reach plateau, and also its ultimate plateau production level.
This approach allows for potential production volumes to be estimated for Ukraine's shale gas and CBM potential in aggregate. Estimates of gas in place and production potential for individual unconventional plays are not particularly useful, given the large uncertainties regarding rock mechanics and the presence and distribution of sweet spots. But aggregating estimates over a large range of plays does produce robust results, in IHS CERA's view.
IHS CERA's modeling of potential production shows a wide range of plausible scenarios for unconventional gas production in Ukraine. In the base case, unconventional gas production reaches a plateau of about 25 Bcm per year by 2030. A high case, incorporating more optimistic assumptions about aggregate play productivity, points toward plateau production of 30 Bcm per year or higher. In either case, these levels of production could be reached, using P50 assumptions for productivity and thus unit costs, at wellhead supply costs
of between $176 and $282 per thousand cubic meters.
Indicative Production Scenario
While a full technical and commercial assessment of Ukraine's resources has not been undertaken as part of this study, it is important to highlight the possible scale and impact of investment in the various exploration and development opportunities as listed above. IHS CERA has therefore modeled an indicative outlook for future Ukrainian gas production from the key resource categories listed above from 2012 to 2035. Some indicative approximations have been applied to both conventional and unconventional resources, as follows:
Production from existing fields is assumed to decline at a rate of 2.4% per
year. This reflects results from IHS CERA research on global decline rates for gas fields similar to those in Ukraine, taking into account the maturity of producing fields. This decline rate assumes that some production technologies are applied to arrest decline and improve recovery. It is noteworthy that Ukraine has already had considerable success in heading off production declines from its existing fields for many years.
$5–8 per thousand cubic feet (Mcf).

Natural Gas and Ukraine’s Energy Future Ukraine Special Report
1-8 Chapter 1
© IHS, 2012 No portion of this report may be reproduced, reused, or otherwise distributed in any form without prior written consent.
Remaining resources in the categories of proven and probable (A+B+C1) are
assumed to be 85% developed onshore and 50% offshore. Recoverable resources were risked at 85% feasible for development onshore and 50% for offshore up to 2035.
Additional development of contingent resources in the category C2+C3 is
assumed following the application of modern technology. These resource figures are risked at a level of approximately 60% for the East and West regions and at 50% for the South.
It was estimated that 30% of prospective/predictive resources (category D) for
all regions would be developed, taking into account exploration risk.
Given the large investment required for field appraisal and development, as well as the necessity of building a significant service industry and support infrastructure, development is assumed take place initially at a relatively slow pace. Development of prospective resources is assumed to take more time than development of proven or probable resources located near existing infrastructure. Figure 1-1 shows the results of IHS CERA production modeling exercise for Ukraine on the whole, taking into account conventional gas, tight gas reservoirs, and unconventional gas. This project growth would be driven by the East region, which is seen to be the most likely destination for initial major investments, starting with reserves in the proven and probable category (A+B+C1), followed by exploration and exploitation of contingent resources. Exploration for prospective resources (category D) is assumed to have no impact on production before 2020.
Production in the West region is assumed to be much smaller, deriving initially from the redevelopment of remaining proven and probable resources as well as contingent resources.
Figure 1-1
Projected Production Profile for Ukrainian Gas, 2012–35
Existing Fields (decline)
New Resource Development
Tight Gas Reservoirs
Unconventionals Base Case
0
10
20
30
40
50
60
70
80
2005 2010 2015 2020 2025 2030 2035
Annual Production
(Bcm)
Source: IHS CERA.

Ukraine Special Report Natural Gas and Ukraine’s Energy Future
Chapter 1 1-9
© IHS, 2012 No portion of this report may be reproduced, reused, or otherwise distributed in any form without prior written consent.
Considerable time and significant investment will be needed before the large prospective resources of the South region can be explored and developed. In part this reflects the considerable time it will take to build the infrastructure and oilfield service capability needed to explore the deeper waters of the Black Sea. Thus first production is not expected before 2020, and it is likely to start at relatively low levels.
For production from tight gas reservoirs, a minimum assumption for resources able to be developed of 1.5 Tcm was used, of which 20% (300 Bcm) was assumed as the risked recoverable resource involving current technology. In this area as well, development will not be rapid.
The development of Ukraine's important unconventional gas potential will require large investment; if this investment is forthcoming, it could have a highly significant impact on overall gas production in Ukraine. The potential productivity of individual plays is highly uncertain, and various alternative cases have been considered. In the base case, productivity could reach some 25 Bcm per year after a long period of exploration and infrastructure and service sector development.
Investment Requirements
It is clear that the exploitation of Ukraine's considerable gas resources will require considerable new capital investment. The rate at which money will be invested and resources will be exploited is of course a function to a large extent of the policy incentives provided by the government and the industry response to those incentives—as well as the actual commercial viability of the resources.
If one assumes that government policy succeeds in providing a conducive environment for investment, and as a result the production scenario described above is achieved, this would imply levels of investment in gas development far greater than those recently seen in Ukraine. Capital costs for shale gas and CBM development alone could reach levels of $2-$3.5 billion annually (in 2011 dollars) if and when unconventional development takes off. Total capital investment for the production scenario shown in Figure 1-1 could reach levels of approximately $10 billion per year during some periods between 2012 and 2035. This figure does not include related investment in support infrastructure.


Ukraine Special Report Natural Gas and Ukraine’s Energy Future
Chapter 2 2-1
© IHS, 2012 No portion of this report may be reproduced, reused, or otherwise distributed in any form without prior written consent.
CHAPTER 2: OVERVIEW OF UKRAINE’S GAS TRANSPORTATION SYSTEM AND PRACTICES
Transportation and Storage
Ukraine’s Gas Transportation System (GTS) consists of nearly 40,000 kilometers (km) of pipeline, of which more than half (22,000 km) are high-pressure pipelines, as well as 74 compressor stations (see Figure 2-1). In terms of nameplate capacity, the Ukrainian pipeline system can receive 288 billion cubic meters (Bcm) annually from the east and can deliver 179 Bcm annually beyond Ukraine’s borders, mainly toward Europe; Russian transit gas being delivered farther west into Europe accounts for nearly two-thirds of the gas volumes transported by the system (see Figure 2-2). Having entered the Ukrainian system from Russia and Belarus, gas can exit into Poland, Slovakia, Hungary, Romania, and Moldova.
The Ukrainian GTS is owned by the state and managed by Ukrtransgaz, with the exception of trunk pipelines on the territory of Crimea, which are managed by Chornomornaftogaz. Both Ukrtransgaz and Chornomornaftogaz are subsidiaries of state-owned Naftogaz of Ukraine.
Figure 2-1
Gas Infrastructure—Ukraine
Source: IHS CERA. 10503-15

Natural Gas and Ukraine’s Energy Future Ukraine Special Report
2-2 Chapter 2
© IHS, 2012 No portion of this report may be reproduced, reused, or otherwise distributed in any form without prior written consent.
Figure 2-2
Ukrainian Gas Consumption versus Gas Transit Volumes, 1990–2010
Ukraine also benefits from Europe’s second largest system of gas storage, which consists of 13 storage facilities with an active capacity of nearly 32 Bcm. These storage facilities are divided into four operational regions: West (five facilities), Central (four facilities), East (two facilities), and South (two facilities). All gas storage is operated by Ukrtransgaz apart from one 1 Bcm facility in Crimea. The total capacity for injection and withdrawal across the system is roughly 250 million cubic meters per day.
Ukraine’s gas storage has traditionally played an important role by providing convenience to Gazprom and by extension to Gazprom’s customers in Europe, which have benefitted from flexible supply of Russian gas as a result. However, in the wake of commercial disputes, Russian use of Ukrainian gas storage has declined considerably. Storage also allows Ukraine to manage its own seasonal swings in demand and at times to hold extra volumes purchased in expectation of higher future prices.
Gas Transit Volumes
Volumes of gas transiting the territory of Ukraine have been in decline since 2004, and Ukraine’s significance as the core transit state for Russian gas is declining over time as Russia continues slowly to diversify its export routes—first with the Blue Stream pipeline to Turkey and imminently with the start-up of the Nord Stream pipeline to Germany (see Figure 2-3). Meanwhile, transit of Russian gas through Ukraine to Southern Russia has dropped to zero following Gazprom’s construction of a new bypass pipeline on Russian territory.
Russian gas transit via Ukraine will continue to decline for the next few years before potentially rebounding in the longer term. Figures 2-4 and 2-5 show projections for Russian gas transit via Ukraine under different scenarios in terms of volume and also as a share of Russia’s total gas exports to Europe by pipeline.
0
20
40
60
80
100
120
140
160
1990 1992 1994 1996 1998 2000 2002 2004 2006 2008 2010
Bcm
Total Gas Consumption Total Transit Shipments
Source: IHS CERA.

Ukraine Special Report Natural Gas and Ukraine’s Energy Future
Chapter 2 2-3
© IHS, 2012 No portion of this report may be reproduced, reused, or otherwise distributed in any form without prior written consent.
Figure 2-3
Transit of Gas Through Ukraine, 2004–10
Figure 2-4
Outlook for Russian Gas Transit via Ukraine to 2030 (volumes)
60%
62%
64%
66%
68%
70%
72%
74%
76%
78%
80%
0
20
40
60
80
100
120
140
160
2004 2005 2006 2007 2008 2009 2010
Bcm
Total Transit Shipments (Bcm)
Ukraine’s Share of Russia’s Gas Transit to Europe (percentage)
Source: IHS CERA.
0
20
40
60
80
100
120
140
160
2005 2010 2015 2020 2025 2030
Bcm
Base Case
High Case
Low Case
Source: IHS CERA.

Natural Gas and Ukraine’s Energy Future Ukraine Special Report
2-4 Chapter 2
© IHS, 2012 No portion of this report may be reproduced, reused, or otherwise distributed in any form without prior written consent.
Figure 2-5
Outlook for Russian Gas Transit via Ukraine to 2030 (as percentage of total Russian gas exports to Europe via pipeline)
Transit Fees and Tariffs
Ukraine gas transit fees (see Figure 2-6) are among the highest in Eastern Europe, although lower than standard levels in Western Europe.
In general, transit fees on the Ukrainian pipeline system have been rising gradually along with the price Ukraine pays for Russian gas (see Figure 2-7). Meanwhile Ukrtransgaz has also steadily raised tariffs for domestic gas transportation in hryvnia terms (although depreciation led to a sharp tariff decline in dollar terms in late 2008). Domestic tariffs are charged on a “postage stamp” basis, meaning that all users pay the same tariff regardless of exit and entry point, and the distance traveled on the system (see Figure 2-8).
As is standard in many European countries, the domestic pipeline tariff consists of two elements: one part is for transit through trunk pipelines, and another component is for local distribution. Figure 2-9 shows the breakdown between these two components and presents them in terms of dollars per thousand cubic meters (Mcm) per 100 km (assuming an average domestic gas journey of 600 km through the trunk pipeline system). Here it can be seen that the trunk element has increased rather slowly and remains lower than the Russian transit tariff, while the distribution tariff has increased more quickly in recent years.
Transit and domestic tariffs are set on a cost-plus basis by the National Electricity Regulatory Commission (NERC), which despite its name also has responsibility for some areas of gas regulation. The major variable cost is gas consumed within the pipeline system itself in order to run its compressors. Starting from 2010, based on the new long-term overall contract signed between Naftogaz and Gazprom, the transit tariff has been calculated on the basis of a formula that starts from a base tariff rate of $2.04/Mcm/100 km (which is adjusted for inflation annually) and also includes a fuel component (set currently at about $0.80/Mcm/100 km). Domestic postage-stamp tariffs are also determined on the basis of cost-plus methodology.
0%
10%
20%
30%
40%
50%
60%
70%
80%
2005 2010 2015 2020 2025 2030
Base Case
High Case
Low Case
Source: IHS CERA.

Ukraine Special Report Natural Gas and Ukraine’s Energy Future
Chapter 2 2-5
© IHS, 2012 No portion of this report may be reproduced, reused, or otherwise distributed in any form without prior written consent.
Figure 2-6
Average Gas Transit Fees for Selected European Countries, 2010
Figure 2-7
Ukraine’s Gas Transit Fees, 2005–11
0.00
1.00
2.00
3.00
4.00
5.00
6.00
Central and Western Europe
Slovakia Ukraine Czech republic
Poland Belarus
Dollars/ Mcm/
100 km
Source: IHS CERA.
0.00
0.50
1.00
1.50
2.00
2.50
3.00
2005 2006 2007 2008 2009 2010 2011
Dollars / Mcm /
100 km
Source: IHS CERA.

Natural Gas and Ukraine’s Energy Future Ukraine Special Report
2-6 Chapter 2
© IHS, 2012 No portion of this report may be reproduced, reused, or otherwise distributed in any form without prior written consent.
Figure 2-8
Ukraine’s Domestic Gas Transportation Tariff, 2003–11 (“postage stamp” basis)
Figure 2-9
Ukraine’s Domestic Gas Transportation Tariff, 2006–11: Trunk Component versus Distribution Component
8.20 8.97
13.99
18.26 19.24
24.22
18.41
29.62
32.64
35.63 37.79
0
5
10
15
20
25
30
35
40
2001–03
May-0
4
Ju
n-0
6
Jan
-07
Ju
l-07
Sep
-08
May-1
0
Au
g-1
0
Ap
r-11
Ju
l-11
Oct-
11
General Tariff
(dollars)
Source: IHS CERA.
2.33
3.04 3.21
4.04
3.07
4.94
5.44
5.94
6.30
0.00
1.00
2.00
3.00
4.00
5.00
6.00
7.00
Ju
n-0
6
De
c-0
6
Ju
n-0
7
De
c-0
7
Ju
n-0
8
De
c-0
8
Ju
n-0
9
De
c-0
9
Ju
n-1
0
De
c-1
0
Ju
n-1
1
Dollars/ Mcm/
100 km
Trunk tariff Distribution tariff
Transit tariff
Source: IHS CERA.
Ukraine Special Report Natural Gas and Ukraine’s Energy Future
Chapter 2 2-7
© IHS, 2012 No portion of this report may be reproduced, reused, or otherwise distributed in any form without prior written consent.
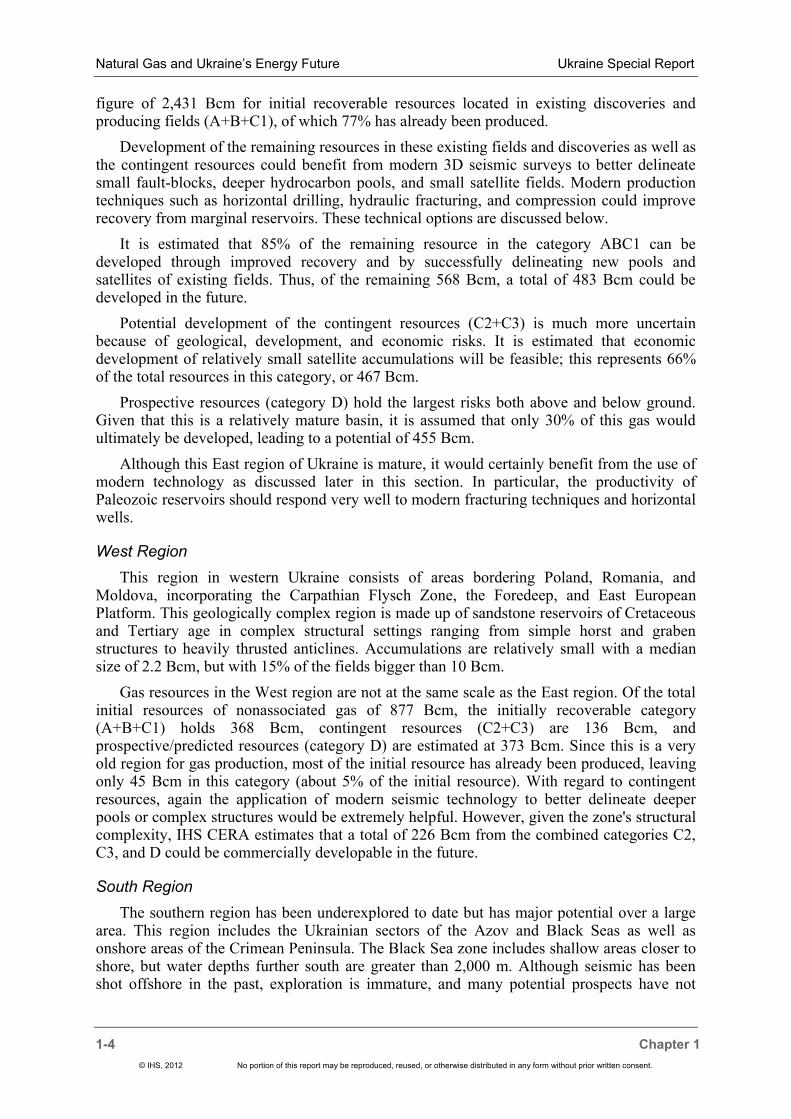
IHS CERA estimates (based on long-term views of European gas prices under different scenarios, namely Global Redesign, Vortex, and Metamorphosis) that the Ukrainian transit tariff for Russian gas is likely to remain roughly flat at approximately $3/Mcm/100 km through at least 2020 (see Figure 2-10). The tariff itself is calculated based on the formula in the 10-year contract on gas transit signed between Russian and Ukraine on January 19, 2009.
Taking into account both tariffs and transit volumes under different scenarios, we see a range of possible trajectories for Ukraine’s annual transit revenue (see Figure 2-11). In our base case scenario, we see transit revenues staying relatively flat at about $2.5 billion annually.
Technical Condition of the Gas Transportation System
Estimates of investment required to modernize the Ukrainian gas transit system vary widely. Naftogaz estimates required investments at $5.3 billion over the course of the next seven years, on the assumption that the entire network would be modernized (including distribution systems as well). Work on this modernization program has begun with the first phase of the reconstruction of the Ukrainian segment of the Urengoy-Pomary-Uzhgorod pipeline, which began in 2011 and included insulation replacement, pipe relaying, and the modernization of two compressor stations. This particular project is estimated to cost $539 million, covered partly by a $310 million loan from the European Bank for Reconstruction and Development and the European Investment Bank. The European Union’s estimate for modernizing the Ukrainian system is $3.2 billion, with a focus on the main transit pipelines and unbundling underground storage from the transportation system. Gazprom’s estimate for the cost of needed investment in the system is $9 billion.
Figure 2-10
Outlook for Ukraine’s Transit Tariff to 2020
0.00
0.50
1.00
1.50
2.00
2.50
3.00
3.50
4.00
2011 2012 2013 2014 2015 2016 2017 2018 2019 2020
Dollars/ Mcm/
100 km
Base Case
High Case
Low Case
Source: IHS CERA.

Natural Gas and Ukraine’s Energy Future Ukraine Special Report
2-8 Chapter 2
© IHS, 2012 No portion of this report may be reproduced, reused, or otherwise distributed in any form without prior written consent.
Figure 2-11
Outlook for Ukrainian Gas Transit Revenues to 2020 (nominal)
Multilateral Consortium
Ukraine, Russia, and the European Union have for years been discussing the concept of a multilateral consortium taking over ownership and operations of Ukraine’s trunk gas pipelines. For Ukraine, the interest in such an arrangement is driven in part by a desire to achieve some reduction in Russian gas prices as part of a deal. For its part, Russia and Gazprom are interested in establishing some measure of control over gas transit through the territory of Ukraine to ensure uninterrupted gas flow. The European Union is interested mainly in ensuring stable gas supply.
Suggestions about a multilateral consortium first appeared in mid-1990s but have never come to fruition. Any deal would require consensus on control and governance of the consortium, the legal character of ownership rights over the trunk pipelines, the valuations of both pipeline and storage assets, and the mechanisms for investment in system modernization.
0.00
0.50
1.00
1.50
2.00
2.50
3.00
3.50
4.00
4.50
5.00
2011 2012 2013 2014 2015 2016 2017 2018 2019 2020
Billion US
Dollars (nominal)
Base Case High Case Low Case
Source: IHS CERA.

Ukraine Special Report Natural Gas and Ukraine’s Energy Future
Chapter 3 3-1
© 2012 IHS No portion of this report may be reproduced, reused, or otherwise distributed in any form without prior written consent.
CHAPTER 3:GAS PRODUCTION IN UKRAINE
The Rise and Fall of Ukraine’s Gas Industry
The gas industry of the Soviet Union as a whole relied heavily on Ukrainian gas fields until the 1970s. In the 1940s, the bulk of Soviet nonassociated gas came from Dashava field in the North Carpathian Basin of western Ukraine. After World War II, several other local fields were brought onstream, leading to the construction of one of the USSR’s first long-distance gas pipelines in 1949 to bring Ukrainian gas to Moscow and later (1960–62) to Minsk and the Baltic states. The 1960s and 1970s marked the golden age of the Ukrainian gas industry: the 1956 discovery and development of the Shebelinkskoye gas field in the Dnieper-Donets Basin turned Ukraine into a key focus area for Soviet industrial development, with more and more industrial production relying on natural gas. The first Soviet gas exports to Europe in 1967 started with the construction of a high-capacity westbound transmission system, the Bratsvo pipeline.
The weak point of Ukrainian 1960s gas boom was its heavy dependence on a handful of large gas fields such as Shebelinka, Efremovskoye, and Yablunevskoye. As these fields went into decline in the late 1970s and 1980s, the Soviet gas industry began to shift to West Siberia and Central Asia, and investment of capital, technology, and human resources in the Ukrainian gas industry stagnated.
Ukraine entered its present stage of stable to stagnating production in the early 1990s with the breakup of the USSR. Despite relatively low levels of investment—approximately $1 billion per year—Ukraine has been able to maintain relatively stable gas production levels during the past two decades. However, lack of investment is beginning to tell, and total gas production (including associated gas) declined by 8% in 2010 (see Figure 3-1).
Figure 3-1
Ukrainian Gas Production, 1940–2011
Total Gas Production (natural and associated)
0
10
20
30
40
50
60
70
80
1940
1950
1960
1970
1976
1980
1985
1991
1993
1995
1997
1999
2001
2003
2005
2007
2009
2011
Billion Cubic
Meters
-50.5 Bcm (-73%) in 20
years
Source: IHS CERA.
Natural Gas and Ukraine’s Energy Future Ukraine Special Report
3-2 Chapter 3
© 2012 IHS No portion of this report may be reproduced, reused, or otherwise distributed in any form without prior written consent.
In geological terms, it is clear that Ukraine has the potential to reverse the current trend—this is clear from Chapter 1 of this report—provided that the right policies are in place. But in the absence of the right policies to attract investment, gas production in Ukraine will likely face a steady decline.
Distribution of Gas Production
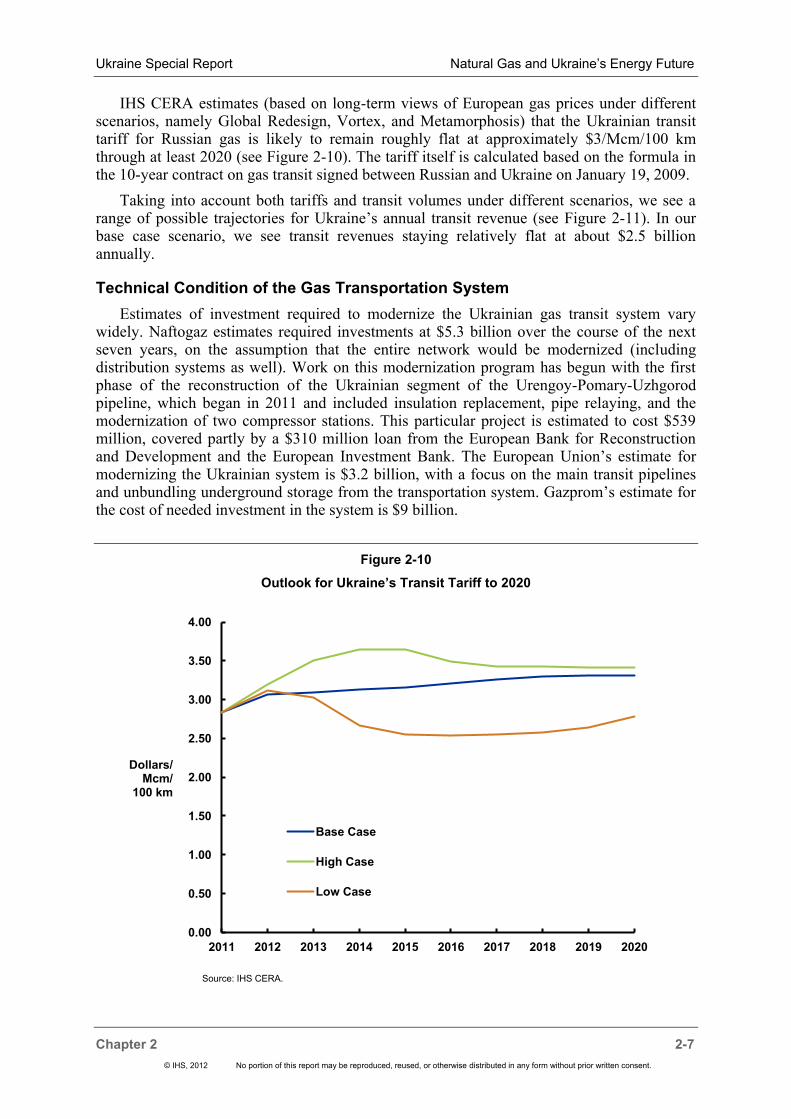
About 90% of total gas production in Ukraine is concentrated in the Dnieper-Donets Basin, primarily in Poltava and Kharkiv regions (see Figure 3-2). Production levels by region are shown in Figure 3-3.
The 100% state-owned oil and gas holding company Naftogaz of Ukraine is responsible for more than 90% of Ukraine’s natural gas production through a small number of wholly or partly owned affiliates. Most of the fields in Naftogaz’s asset portfolio are old and already in their depletion stage; and without much investment its production affiliates are for the moment finding it difficult to hold off an overall production decline. Production of nonassociated gas in Ukraine dropped by 5% in 2010, with production declining for almost
all producers in Ukraine (see Figure 3-4). Combined Naftogaz production declined 4.9% as Ukrnafta’s production contracted by 16%, and production by Ukrgazdobycha declined by 3% as a result of a loss of reservoir pressure following some operational problems. Gas production of another state company, Nadra Ukrainy, dropped by 65% in 2010. Gas production of the biggest independent producers declined as well: CJSC Neftegazdobycha by 22.6% and JKX Oil & Gas by 12.1%.
Figure 3-2
Main Basins and Fields
Source: IHS CERA. 10503-16
Total natural and associated gas production decreased 8% in 2010.

Ukraine Special Report Natural Gas and Ukraine’s Energy Future
Chapter 3 3-3
© 2012 IHS No portion of this report may be reproduced, reused, or otherwise distributed in any form without prior written consent.
Figure 3-3
Ukrainian Gas Production by Region, 2004–08
Figure 3-4
Gas Production by Company, 1996–2010
0
5
10
15
20
2004 2005 2006 2007 2008
Billion Cubic
Meters
Crimean Republic (NBD) Poltavska (DDB) Kharkivska (DDB)
Luganska (DDB) Dnipropetrovska (DDB) Sumska (DDB)
Chernigivska (DDB) Lvivska (NCB) Ivano-Frankovska (NCB)
Source: IHS CERA. Note: NBD = North Black Sea Basin; DDB = Dnieper-Donets Basin; NCB = North Carpathian Basin.
0
5
10
15
20
25
1996 1998 2000 2002 2004 2006 2008 2010
Billion Cubic
Meters
Naftogaz of Ukraine (total) Ukrgazdobycha (NG) Ukrnafta (NG) Chernomorneftegaz (NG) Other companies
Source: IHS CERA.
Natural Gas and Ukraine’s Energy Future Ukraine Special Report
3-4 Chapter 3
© 2012 IHS No portion of this report may be reproduced, reused, or otherwise distributed in any form without prior written consent.
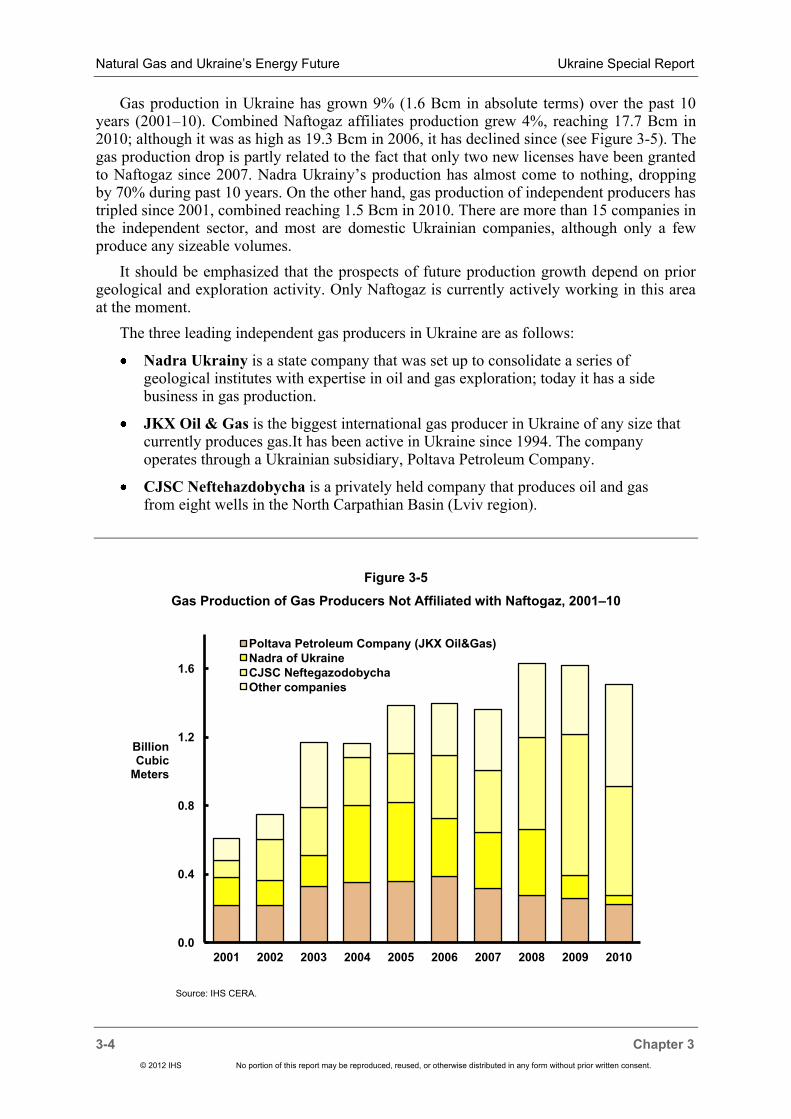
Gas production in Ukraine has grown 9% (1.6 Bcm in absolute terms) over the past 10 years (2001–10). Combined Naftogaz affiliates production grew 4%, reaching 17.7 Bcm in 2010; although it was as high as 19.3 Bcm in 2006, it has declined since (see Figure 3-5). The gas production drop is partly related to the fact that only two new licenses have been granted to Naftogaz since 2007. Nadra Ukrainy’s production has almost come to nothing, dropping by 70% during past 10 years. On the other hand, gas production of independent producers has tripled since 2001, combined reaching 1.5 Bcm in 2010. There are more than 15 companies in the independent sector, and most are domestic Ukrainian companies, although only a few produce any sizeable volumes.
It should be emphasized that the prospects of future production growth depend on prior geological and exploration activity. Only Naftogaz is currently actively working in this area at the moment.
The three leading independent gas producers in Ukraine are as follows:
Nadra Ukrainy is a state company that was set up to consolidate a series of geological institutes with expertise in oil and gas exploration; today it has a side business in gas production.
JKX Oil & Gas is the biggest international gas producer in Ukraine of any size that currently produces gas.It has been active in Ukraine since 1994. The company operates through a Ukrainian subsidiary, Poltava Petroleum Company.
CJSC Neftehazdobycha is a privately held company that produces oil and gas from eight wells in the North Carpathian Basin (Lviv region).
Figure 3-5
Gas Production of Gas Producers Not Affiliated with Naftogaz, 2001–10
0.0
0.4
0.8
1.2
1.6
2001 2002 2003 2004 2005 2006 2007 2008 2009 2010
Billion Cubic
Meters
Poltava Petroleum Company (JKX Oil&Gas)
Nadra of Ukraine
CJSC Neftegazodobycha
Other companies
Source: IHS CERA.

Ukraine Special Report Natural Gas and Ukraine’s Energy Future
Chapter 3 3-5
© 2012 IHS No portion of this report may be reproduced, reused, or otherwise distributed in any form without prior written consent.
Potential for Greater International E&P Interest—Under the Right Conditions
Up until now there has been very limited foreign investment in Ukraine’s gas upstream. An uncertain political situation, a heavily regulated market, low domestic gas prices, and constantly changing laws have all worked against foreign investment inflows. However, with positive changes clearly under way, more international oil and gas companies are beginning to look for opportunities in the Ukrainian market. Table 3-1 summarizes recent activities of some international majors in Ukraine.
Chapter 6 and Appendix A of this report address in more detail some of the specific regulatory issues where positive reforms could lead to major growth in exploration and production investment in Ukraine.

Natural Gas and Ukraine’s Energy Future Ukraine Special Report
3-6 Chapter 3
© 2012 IHS No portion of this report may be reproduced, reused, or otherwise distributed in any form without prior written consent.
Table 3-1
Recent International E&P Activity in Ukraine
Foreign Company Activity in Ukraine
Shell Signed a joint activity agreement with Ukrgazdobyvannya in 2005 on geological study; new aoint activity agreement on upstream activities and production was signed in September 2011 (after an extended period of obtaining approvals from different agencies).
ExxonMobil Signed a memorandum of cooperation with Naftogaz in 2011 agreeing on joint study of unconventional gas resource potential.
Eni Signed a framework agreement with Naftogaz and obtained approval from the State Service for Geology and Mineral Resources to study shallow waters of the Black Sea; in 2011 Eni completed a deal with the small UK-listed Cadogan Petroleum to acquire a 30% share in Pokrovskoye Petroleum (along with an option for another 30%) as well as 60% of Zagorynska Petroleum.
Vanco Together with partners, Vanco signed Ukraine’s first (and only, so far) production-sharing agreement in 2007 for development of an offshore block; this agreement was then revoked in 2008 and reinstated in 2011. DTEK-Oil&Gas (a newly set up subsidiary of the Ukrainian company DTEK) has taken over the leading role in the project and plans to proceed with development.
LUKOIL In 2010 obtained governmental approval for negotiating a potential joint operation agreement for exploration of three blocks in Black Sea (Odesskoye, Bezymyannoye, Subbotinskoye) in partnership with Naftogaz subsidiary Chernomorneftegaz.
TNK-BP Agreed in October 2010 to a draft memorandum of cooperation with Naftogaz concerning E&P of gas in Donetsk region. This agreement was approved by the Cabinet of Ministers.
Shelton The company’s joint venture with Ukrnafta, Kashtan Petroleum, will soon resume operations at the Lelyaki field after the the State Service for Geology and Mineral Resources restored Kashtan’s special permit in August 2011; Shelton also has signed an agreement with Chernomorneftegaz to develop two fields in the Azov Sea.
3P International
Company acquired JSC Tysagaz for US$17 million in 2011; Tysagaz’s core assets are four natural gas licenses in Zakarpatska Oblast
Regal Petroleum
This small exploration company holds two gas/condensate licenses but has suffered from operational setbacks and litigation over licenses; recently a court injunction stopping its exploration activity was annulled. The Ukrainian company Smart Holding has recently taken a controlling stake.
Others Chevron is evaluating shale gas opportunities in western Ukraine; Statoil intends to sign a cooperation agreement with Naftogaz on Black Sea shelf and shale gas exploration in the near future; Arawak Energy, Vitol’s upstream division, is considering business opportunities in Ukraine.
Source: IHS CERA.

Ukraine Special Report Natural Gas and Ukraine’s Energy Future
Chapter 4 4-1
© 2012 IHS No portion of this report may be reproduced, reused, or otherwise distributed in any form without prior written consent.
CHAPTER 4: GAS CONSUMPTION: ANALYSIS AND OUTLOOK
Background
The Ukrainian domestic gas market came into existence during the Soviet period when gas was abundant and cheap—and over-consumed as a consequence. Ukraine’s consumption of gas has been cut in half since the end of the Soviet era, initially because of overall economic contraction and then since 2006 because of rising prices for imported Russian gas, which prompted efficiency measures such as replacement of obsolete equipment (see Figure 4-1).
There is still today significant potential for a further reduction of gas consumption in Ukraine, both through changes in economic structure (i.e., a reduction in the share of gas-intensive activities in the overall economy) as well as through further implementation of energy-saving technologies such as improved building standards and modern, efficient equipment. Ukraine’s energy intensity remains today six to seven times higher than in Western industrial countries and two to three times higher than countries of Eastern and Central Europe. Indeed Ukraine’s energy intensity resembles that of hydrocarbon-exporting post-Soviet countries such as Russia, Kazakhstan, and Uzbekistan (see Figure 4-2).
Analysis of Gas Consumption by Sector
Gas consumption is almost equally distributed between industrial and residential consumers (see Figure 4-3). The industrial sector can be divided into four subgroups: power generation, metals and mining, chemicals, and ―other.‖ Together industrial consumers use about 25 to 30 billion cubic meters (Bcm) annually. Residential consumption includes both households and district heating companies, which together consume about 28 to 30 Bcm annually. Two remaining categories of consumption are budget-financed entities (0.8 to 1 Bcm per year) as well as the requirements of the pipeline system itself, which amount to 5.5 to 7 Bcm per year.
Figure 4-1
Ukrainian Gas Consumption, 1990–2010
Total Gas Consumption
0
20
40
60
80
100
120
140
1990 1995 2000 2005 2010
Billion Cubic
Meters
Source: IHS CERA.

Natural Gas and Ukraine’s Energy Future Ukraine Special Report
4-2 Chapter 4
© 2012 IHS No portion of this report may be reproduced, reused, or otherwise distributed in any form without prior written consent.
Figure 4-2
Energy Intensity of GDP, Various Countries (2010)
Figure 4-3:
Gas Consumption by Sector, 2000–11
0 100 200 300 400 500 600
Uzbekistan
Kazakhstan
Ukraine
Russia
Bulgaria
United States
Poland
Turkey
Tons of Oil Equivalent per $1,000 of GDP
Source: IHS CERA.
0
10
20
30
40
50
60
70
80
2000 2001 2002 2003 2004 2005 2006 2007 2008 2009 2010 1H_2011
Billion Cubic
Meters
Power sector Chemicals
Other industry Metals and mining
Households Budget financed entities
District heating companies Pipeline needs and technical losses
Source: IHS CERA.

Ukraine Special Report Natural Gas and Ukraine’s Energy Future
Chapter 4 4-3
© 2012 IHS No portion of this report may be reproduced, reused, or otherwise distributed in any form without prior written consent.
In 2009 Ukrainian gas end-of-pipe consumption (a measure that excludes pipeline use) declined by 22% to 46.1 Bcm. Most of this decline took place in the industrial sector, which was hit hard by the contraction in global demand. In 2010, more than half of this gas demand returned as consumption grew by 13.7%, to 52.4 Bcm, driven by a rebound in demand for Ukrainian exports of iron and steel and nitrogenous fertilizers (see Figure 4-4).
Industrial Consumers
Chemical Sector
The main activity in the Ukrainian chemical industry is production of nitrogenous fertilizers. Six major fertilizer plants located mainly in eastern Ukraine consume together approximately 8.0 to 8.5 Bcm annually: SeveroDonetsk Azot, Stirol (Gorlovka), Odesa Port Plant, DniprAzot, RivneAzot, and CherkasskAzot. Overall the chemical sector accounts for 7% of GDP and 8% to 10% of Ukraine’s total export earnings.
The fertilizer industry is highly exposed to the prices it pays for natural gas, which at current levels represent roughly 75% of the cost of a unit of nitrogen fertilizer. This cost structure means that energy efficiency has been a major priority for the sector since 2006 when the prices of imported Russian gas began to grow and gradually removed what had been a major competitive advantage for Ukrainian producers. CherkasskAzot has reported that that Ukraine’s six major plants reduced their ration of gas consumed per ton of ammonia production from 1.46 thousand cubic meters (Mcm) per ton to 1.12 Mcm per ton between 1990 and 2010, with much of that increase coming in the past four years. At Rivneazot (part of the industrial holding company Group DF), the reconstruction of two production units in 2007 reduced its gas consumption from 1.24 Mcm per ton to 0.99 Mcm per ton, making it equal in efficiency to the average nitrogen fertilizer plant in Eastern Europe.
Figure 4-4
Sectoral Shares of Gas Consumption in Ukraine, 2010
5%
12%
11%
12%
31%
2%
19%
9%
Power sector
Metals and mining
Chemicals
Other industry
Households
Budget financed entities
District heating companies
Source: IHS CERA.

Natural Gas and Ukraine’s Energy Future Ukraine Special Report
4-4 Chapter 4
© 2012 IHS No portion of this report may be reproduced, reused, or otherwise distributed in any form without prior written consent.
The sector consolidated throughout 2010, as four out of the six major plants are now part of Group DF, which is currently responsible for 70% of ammonia production, 60% of urea production, and 100% of production of ammonium nitrate. This may be a good sign for the prospects of energy efficiency in the sector, as Group DF has announced a modernization program at its recently acquired plants (SeveroDonetsk Azot, CherkasskAzor, and Stirol). Full modernization of facilities at the four Group DF factories as well as the two others could potentially reduce gas use in the sector by approximately 20%, or 1.7 Bcm per year at the 2007 level of ammonia production. Further reductions (another 3.5%) could be achieved through restructuring, most notably by conversion of ammonia units to urea production. However, this option would require sizable investment and could not be justified by gas savings alone.
Figure 4-5 summarizes potential gas saving in the nitrogen fertilizers industry from 2007 levels of production and gas consumption. Overall savings could be about 23%. However, a 25% increase in fertilizer output from 2007 levels would have the effect of bringing gas consumption back to approximately 8.5 Bcm even with gas savings measures in place.
Figure 4-5
Potential Gas Savings from Efficiency Improvements in the Chemicals Sector
8.6
6.6 6.9
0.3
7.5
0.6 0.6
8.6
1.1 1.1 1.1
5
6
7
8
9
5.1 mt of Ammonia,
2.8 mt of Nitrogen Fertilizers
Savings from Modernization of All Plants in DF Group at 2007
Level of Production
Savings from Modernization of
All 6 Plants at 2007 Level of Production
Savings from Switch to Urea:
2.6 mt of Ammonia,
5.4 mt of Urea
Production Growth (+25%) with Efficient
Plants: 6.4 mt of Ammonia,
3.6 mt of Nitrogen Fertilizers
Billion Cubic
Meters
Source: IHS CERA.
Total Gas Consumption by Sector
DF Group Modernization
Gas savings from
All 6 Plants Modernization
Switch of Half Ammonia Production to Urea Production

Ukraine Special Report Natural Gas and Ukraine’s Energy Future
Chapter 4 4-5
© 2012 IHS No portion of this report may be reproduced, reused, or otherwise distributed in any form without prior written consent.
Metals Sector
The Ukrainian metals sector consumes about 8.5 to 9.5 Bcm annually, or roughly one-third of total industrial consumption. The factories that consume the bulk of this gas are concentrated in the eastern part of the country, chiefly in the Donetsk, Dnipropetrovsk, and Zaporozhye regions.
Based on 2010 data, Ukraine is the world’s eighth largest steel producer and sixth largest iron ore producer. Ukrainian steelmakers export over 70% of their output, with Asia, Europe, and post-Soviet countries as the main markets. Metals exports are crucial to country’s overall trade balance as they account for 35% to 40% of the country’s total export earnings.
Despite some efficiency improvements in recent years, the iron and steel industry in Ukraine remains inefficient by global standards.
Energy costs in Ukraine’s metals sector represent 50% of total costs, relative to a global average of 20% to 25%.
Ukraine continues to use outdated and inefficient open-hearth furnaces (OHF), producing about 40% of steel with this technology. OHFs are no longer used in advanced industrial countries and represent only 10% of current production in Russia.
Continuous casting technology, which is more energy efficient, is used in only 50% of Ukraine’s output, relative to a global level of 90%.
There is a low level of utilization of by-product gases from coke oven blast furnaces in Ukrainian plants; these gases can be fully reused and could provide 30% to 40% of total energy use.
Only one plant (Donetskstal) in Ukraine uses pulverized coal injection (PCI) technology in the production process. PCI can displace up to 80% of natural gas use and up to 25% of coking gas use in pig iron production.
Positive changes in energy efficiency are under way: almost every plant is currently investing in at least one of these ways to improve production processes and reduce unit gas consumption. Companies are currently focusing on projects in three areas:
Replacement of OHFs with oxygen converters, or reducing output from OHFs (industrywide savings estimated at 1.4 Bcm per year at 2007 level of final production)
Replacement of gas with coal in blast furnace production of pig iron through PCI (industrywide savings estimated at 2.5 Bcm per year at 2007 level of final production)
Greater utilization of blast furnace gas and coke-oven gas (industrywide savings estimated at 0.3 Bcm per year at 2007 level of final production)
Figure 4-6 summarizes potential gas savings in 2007 from these three methods. As shown here, gas consumption in the Ukrainian metals sector could be reduced by 44%, or 3.9 Bcm annually, from 2007 levels if all three methods are fully utilized across all production capacities in the industry. Alternatively, Ukraine could produce 78% more metal products with the same level of gas consumption. Ambitious plans announced by companies add up to 30% growth in steel production capacity by 2020; but if efficiency investments are made, total consumption in the industry would still be 1.6 Bcm per year lower than in 2007 despite this higher production.

Natural Gas and Ukraine’s Energy Future Ukraine Special Report
4-6 Chapter 4
© 2012 IHS No portion of this report may be reproduced, reused, or otherwise distributed in any form without prior written consent.
Figure 4-6
Potential Gas Savings from Efficiency Improvements in the Metals Sector
Power Generation Sector
In 2005–06, with the first significant import gas price increase, power generation companies cut gas consumption by half compared with 2000; 5,400 megawatts (MW) of pure gas-fired capacity were put in reserve. For 2000–10 overall, gas consumption for power generation declined by 75%, from 12 Bcm to 3 Bcm (see Figure 4-7) as the use of gas was eliminated in base-load power stations. This was possible because of the operating characteristics of installed generation capacity in Ukraine. Most of Ukraine’s thermal power stations were built in the 1960s and 1970s, with 62% of capacity initially constructed as coal-fired plants, but almost all large plants have the flexibility to switch between coal and gas. Prior to 2006, many power stations used gas as the predominant fuel for cost and operational reasons; but with gas prices increasing after 2006, coal became cheaper and began to dominate the fuel mix for thermal generation (see Figure 4-8). Meanwhile 5,400 MW of pure gas-fired capacity was simply idled.
The future volumes of gas needed by the power generation sector will be determined by two key factors in Ukraine’s electricity balance: first, the share of nuclear power generation going forward; and second, the availability and cost of coal available for power generation.
5.4 5.7
0.3
7.1
1.4 1.4
9.6
2.5 2.5 2.5
7.0
9.6
4
5
6
7
8
9
10
2007 Production
Level
PCI Replacement of OHFs
Use of By-Product Gases
30% Production
Growth
78% Production
Growth
Billion Cubic
Meters
Source: IHS CERA.
Total Gas Consumption by Sector
Overall PCI Technology Implementation
Gas Savings from
Total Replacement of OHFs
Efficient By-Product Gases Use

Ukraine Special Report Natural Gas and Ukraine’s Energy Future
Chapter 4 4-7
© 2012 IHS No portion of this report may be reproduced, reused, or otherwise distributed in any form without prior written consent.
Figure 4-7
Gas Consumption in Power Sector by Region, 2000–10
Figure 4-8
Power Generation Fuel Balance, 1990–2010
0
2
4
6
8
10
12
2000 2001 2002 2003 2004 2005 2006 2007 2008 2009 2010
Billion Cubic
Meters
Other Dnipropetrovska Donetska
Ivano-Frankovska Poltavska Kharkivska
Kyivska and Kyiv City
Gas Consumption
Halved
Source: IHS CERA.
0
100
200
300
1990 1995 2000 2005 2010
Billion kW per
Hour
Nuclear
Hydro
Thermal (coal)
Thermal (oil)
Thermal (gas)
Source: IHS CERA.

Natural Gas and Ukraine’s Energy Future Ukraine Special Report
4-8 Chapter 4
© 2012 IHS No portion of this report may be reproduced, reused, or otherwise distributed in any form without prior written consent.
Nuclear Generation
Ukraine has four existing operating nuclear stations with a total capacity of 13.8 gigawatts (15 reactor units); Chernobyl’ was closed on December 15, 2000. Almost half of Ukraine’s power comes from nuclear generation: production was 89.2 billion kilowatt-hours (kWh) in 2010 (47% of total) (see Figure 4-8). To provide this amount of power, stations are operating at almost maximum capacity: current nuclear load factor is 70%–80%. Ukraine will not be able to increase nuclear generation significantly in the outlook period, but it will be able to maintain its high share of nuclear generation in the power balance going forward through delayed retirement and new capacity additions; nuclear generation will provide about
90 billion kWh annually through 2030.
Availability of Coal
A key issue that is currently stimulating a great deal of discussion in Ukraine is the question of whether it will be possible to increase domestic coal production and at what cost. Currently the power generation sector consumes about 25 to 30 million tons of coal annually, almost half of all processed coal production. The Ukrainian Energy Strategy anticipates a significant increase of coal-fired generation going forward, with power sector coal needs more than doubling by 2030.
However, the Ukrainian coal industry today is in a very poor state. Coal production has been stable for 15 years, but production capacities have for the most part not been modernized since before World War II. Significant growth in production would require formidable investments, which in turn could be attracted only through comprehensive reorganization of the coal industry, namely privatization (today 60% of Ukrainian coal production is state controlled). One obvious result of such a restructuring would be a significant increase in domestic coal prices, which today are kept artificially low by the state company Ugol Ukrainy: the regulated price in 2011 was $79 per ton, which covers only about two-thirds of production costs and is approximately 40% lower than the import price for Russian thermal coal. In such a pricing environment, more than half of Ukraine’s coal mining sector operates at a loss.
The state has managed thus far to maintain the status quo in the coal industry through subsidies: the 2010 figure was $1.11 billion. To increase coal production, Ukraine would have to introduce cost-reflective coal pricing. There are in any case questions about the cost competitiveness of Ukrainian coal, as well as its generally low quality: even now Ukraine must import a few million tons of thermal Kuzbass coal from Russia to maintain normal operations at particular power plants. If Ukraine does proceed to increase significantly coal use in the power sector, it will most likely end up importing more coal from Russia.
Coal is competitive with gas at current gas price levels in Ukraine: the switching point is approximately at $200 to $220 per Mcm, assuming a market price for coal. But as noted earlier, certain power plants must use a certain volume of gas for technical reasons. Moreover, the 5,400 MW of idle gas-fired capacity is well positioned to compensate for the short-term drop in nuclear generation as a result of capacity retirements in approximately 2018–20. Meanwhile much of Ukraine’s coal-fired power generation capacity will reach the end of its operational life in the next 10 to 15 years; and financing for new coal plants (particularly from European sources) is hard to come by because of EU environmental policies.
The State Nuclear Regulatory Committee granted a 20-year extension of the operating licenses for two Rovno units in December 2010; EnergoAtom plans to extend most of existing reactors’ operating lifetimes as well. Construction is in progress on additional capacity: Khmelnitskiy 3 and 4 (2,000 MW).

Ukraine Special Report Natural Gas and Ukraine’s Energy Future
Chapter 4 4-9
© 2012 IHS No portion of this report may be reproduced, reused, or otherwise distributed in any form without prior written consent.
Other Industry
Volume of consumption in the sector ―other industry‖ ranges from 50 to 300 Mcm from region to region; regions with highest consumption are mostly in eastern Ukraine. The cement industry accounts for 15%–20% of gas consumption in this segment. The rest is represented by agriculture, textile, leather, food, pulp and paper, forest, and other industries (see Table 4-1). During the 2009 economic crisis, the sector reacted swiftly with a 40% drop in consumption (see Figure 4-9). Unlike other industries, the segment’s consumption levels did not rebound in 2010, because producers switched to other types of fuels.
The cement industry is the most gas-intensive segment of this group: gas accounts for 40% of the final value of Ukrainian cement. About 90% of producers still use the very energy-intensive ―wet‖ method of cement production; the ―dry‖ method is 30% less energy intensive than wet. Gas price hikes in 2006 and 2009 led to two structural changes in industry: half of producers invested in switching to coal from gas, and half of producers invested in the technology upgrade to the dry method. In 2009 cement production fell 40% and remained flat in 2010; the first half of 2011 suggested that there was little or no growth in 2011 as well. The main driver of cement industry gas consumption is completed construction works, which halved in 2009, declined even more in 2010, and remained at a low level in 2011.
The overall sector has already reacted to gas price hikes with maximum possible fuel switching, thus the future volume of gas consumption in the sector will be linked to the general economic trend: higher growth and demand for products in each of these industries will drive gas consumption up; moderate economic growth will keep gas consumption in the sector at a stable 6–7 Bcm per year.
Table 4-1
“Other Industries” Annual Gas Consumption (approximate)
Industry Gas Consumption (Bcm)
Food industry 1.66
Coke and refinery industry 1.00
Agriculture, forestry, fishing 0.60
Extractive industry other than oil and gas 0.60
Machinery production 0.50
Transportation equipment production 0.40
Pulp and paper industry 0.23
Retail trade, hotels, restaurants 0.20
Electronic and optical equipment 0.23
Rubber and plastic materials 0.11
Construction 0.10
Timber 0.08
Textile industry 0.04
Leather manufacture 0.02
Other 0.03
Total 5.80

Natural Gas and Ukraine’s Energy Future Ukraine Special Report
4-10 Chapter 4
© 2012 IHS No portion of this report may be reproduced, reused, or otherwise distributed in any form without prior written consent.
Figure 4-9
Gas Consumption from “Other Industries,” 2000–11
District Heating Companies and Households
The combined gas consumption of district heating companies and the residential sector account for half of total gas consumption in Ukraine.
Gas consumption by the residential sector is concentrated in eastern Ukraine, where the bulk of the population and industrial production is located. Population density in the six key regions of eastern Ukraine is 1.7 times higher than elsewhere, and 85% of this population is urban (in contrast with 58% of the country’s overall population). It is clear that this sector holds considerable potential for gas savings, and the steps have already been taken to promote more efficiency. Gas meter installation and differentiation of prices by consumer (by volume and existence of a meter) has produced positive results: During the past 10 years, total gas consumption has remained flat despite extension of the gas grid to an additional 30 cities and 130 towns (see Figure 4-10). This trend is set to continue, with residential consumption on track to remain flat or to decline slowly; continued installation of meters and slowly increasing efficiency of consumption should cancel out any consumption growth from gasification.
The district heating sector consists of district boilers and small combined heat and power stations that generate and supply heat to the population via district heating networks. About 70% of Ukraine’s 77,000 boilers use gas as their fuel. The Ministry of Housing and Communal Services estimates current heat losses at 30%, mainly attributable to aging equipment and pipe networks. Most district heating companies are owned by municipal authorities and carry a social burden of artificially low heat prices for the population. As a result, the sector suffers from a lack of investment.
2
4
6
8
10
12
2000 2001 2002 2003 2004 2005 2006 2007 2008 2009 2010 1H_2011
Billion Cubic
Meters
Other Industries
Cement Industry
Source: IHS CERA.

Ukraine Special Report Natural Gas and Ukraine’s Energy Future
Chapter 4 4-11
© 2012 IHS No portion of this report may be reproduced, reused, or otherwise distributed in any form without prior written consent.
Figure 4-10
Residential Gas Consumption, 2000–10
Although tariffs are supposed to be set by local governments on the basis of cost-plus methodology, actual revenue amounts to only 75% to 85% of total costs on average. In 2007, a 13% reduction in gas consumption was achieved by switching boilers to coal where possible (namely where needed infrastructure was in place), but further reduction will require structural reforms and considerable infrastructure investments (see Figure 4-11).
Gas consumption in the district heating sector is likely to remain at about 9 to 10 Bcm per year. A massive switch to coal seems to be unachievable for a number of reasons, including the unlikelihood of major investments in heating plants, the artificially low prices for coal, and the problems with air pollution and coal storage in urban areas.
Pipeline and Technical Needs
Technical and pipeline needs now amount to 5–6 Bcm annually, having declined as transport volumes in pipelines have been reduced. Investment in the upgrade of the pipeline system has been limited owing to the difficult financial position of Naftogaz of Ukraine. Despite low levels of investment, the share of technical gas requirements as a percentage of throughput volume has declined slightly since 2002. In 2007, Naftogaz provided a breakdown of potential gas savings in technical use (see Figure 4-12). The total volume of potential savings cited is about 3.9 Bcm per year. These measures, which would require considerable investment, could bring down the percentage of gas for technical needs to 3% of total transit volume compared with the present 5%.
81.0%
81.5%
82.0%
82.5%
83.0%
83.5%
6.0
6.5
7.0
7.5
8.0
8.5
2000 2001 2002 2003 2004 2005 2006 2007 2008 2009 2010
Billion Cubic
Meters
6 regions: Dnipropetrovska, Donetska, Luganska, Poltavska, Kharkivska, Kyivska
Level of Gasification (RHS)
Source: IHS CERA.

Natural Gas and Ukraine’s Energy Future Ukraine Special Report
4-12 Chapter 4
© 2012 IHS No portion of this report may be reproduced, reused, or otherwise distributed in any form without prior written consent.
Figure 4-11
Gas Consumption for District Heating by Region, 2000–11
Figure 4-12
Naftogaz Potential Reduction of Pipeline Use of Gas, 2007
0
2
4
6
8
10
12
14
16
2000 2001 2002 2003 2004 2005 2006 2007 2008 2009 2010 1H_2011
Billion Cubic
Meters
Other
Kyiv city
Donetska
Kharkivska
Dnipropetrovska
Source: IHS CERA.
6.9
2.45
0.81
0.28 0.25
0.14
2.9
0
1
2
3
4
5
6
7
Total Technical Needs in 2007
Use of Cogeneration at
Compressor Stations
Modernization of Compressor
Stations
Introduction of Standards
Throughout Naftogaz
Introducing Turboexpanders on Distribution
Lines
Independent Generation in
Upstream Operations
Reduced Technical Needs
in 2007
Billion Cubic
Meters
Source: IHS CERA.

Ukraine Special Report Natural Gas and Ukraine’s Energy Future
Chapter 4 4-13
© 2012 IHS No portion of this report may be reproduced, reused, or otherwise distributed in any form without prior written consent.
Gas Consumption Outlook in Different Scenarios
Our gas consumption outlook is based on an in-house country fuel balance model. It is represented in four scenarios that differ in their underlying assumptions such as GDP growth, industrial growth, electricity demand and electricity balance, and pace of energy efficiency programs undertaken by types of industrial consumers (see Table 4-2).
Looking forward, total gas consumption in Ukraine is likely to remain within a band of roughly 55 to 63 Bcm per year over the course of the next decade and perhaps beyond. Our base case assumes some restructuring of the economy, with services growing faster than industrial production. In this scenario, consumption will grow at an average rate of 0.4% annually—meaning that it will not come close to reaching 2007 levels even by 2030.
One alternate scenario produces the same level of gas demand by 2030, but with very different trends in the medium term; in this case the political will to reform the coal industry would be found, causing gas consumption to decline through 2020 despite robust economic growth. The other alternative scenarios involve sluggish economic growth in a low case, and strong growth (without a coal renaissance) in the high case (see Figure 4-13). The four scenarios are described in more detail in Table 4-2.
Figure 4-13
Gas Consumption Outlook to 2030 under Various Scenarios
40
45
50
55
60
65
70
75
2007 2010 2015 2020 2025 2030
Billion Cubic Meters
Rapid economic growth with preference to gas in the industry
Sluggish economic growth
Rapid economic growth with preference to coal in the industry
Base Case (moderate growth)
Limited gas saving potential is realized in low scenario,
moderate production growth makes gas consumption volumes relatively stable
Gas savings potential in base and high case scenario is realized during this period; however, production growth
offsets some of its effect
Source: IHS CERA.
Drops are attributed to Khmelnitsky nuclear
blocks' start of operation

Natural Gas and Ukraine’s Energy Future Ukraine Special Report
4-14 Chapter 4
© 2012 IHS No portion of this report may be reproduced, reused, or otherwise distributed in any form without prior written consent.
Table 4-2
Gas Consumption Drivers by Scenario
Industrial Output Growth Electric Power Balance
Industrial Production and Implemented Savings Programs
Base Case (moderate economic growth)
Industrial index lags GDP growth as economy goes through restructuring
About 2.8% average growth during the period.
Nuclear generation still accounts for about 50% of power output.
Coal-fired thermal generation remains flat.
Gas-fired thermal generation compensates for retired nuclear capacity in 2018–20.
Metals, fertilizers, cement industries have stable but slow growth.
There is insufficient coal to introduce PCI technology on every plant, but stable flow of export earnings ensures investment and improves energy efficiency by about 20% in metal production.
Most fertilizer plants will upgrade production capacities by 2020–22.
Half of cement plants will switch to dry method of production by 2018–20.
Alternative 1 (sluggish economic growth)
About 1% average annual growth during period (production decline in 2012–13)
Nuclear generation account for about 50% of total, but with low demand for power.
Coal production steadily declines.
Gas-fired generation substitutes for retired nuclear capacity
.
Metals, fertilizers, cement industries will not have enough money to invest in modernization programs before 2023–25.
However, weak demand and low output level will help them to maintain 2009–10 consumption level.
Total gas consumption will slightly grow to capture the effect of gasification.
Alternative 2.1 (rapid economic growth—with more gas)
About 6% average annual growth during the period.
Favorable prices do not stimulate incentive to invest in profound modernization.
Nuclear generation will account for more than 50% of power balance with new capacity (Khmelnitskiy 3 and 4).
Gas-fired generation grows in line with electricity consumption growth.
Metals, fertilizers, cement industries on stable and strong growth.
Favorable prices do not stimulate incentive to invest in profound modernization; only projects that are already commissioned will be finished.
Alternative 2.2 (rapid economic growth—with more coal)
About 6% average annual growth during the period
Nuclear generation will account for more than 50% of power balance with new capacity (Khmelnitskiy 3 and 4).
Coal production grows and accounts for growing share of thermal generation.
Gas-fired generation remains at lowest possible level.
Metals, fertilizers, cement industries on stable and strong growth. All plants finish modernization and limit gas consumption at a maximum possible level by 2016–17.
Stable production growth offsets savings from efficiency; industrial gas consumption will grow again starting from 2020.
Source: IHS CERA.

Ukraine Special Report Natural Gas and Ukraine’s Energy Future
Chapter 5 5-1
© 2012 IHS No portion of this report may be reproduced, reused, or otherwise distributed in any form without prior written consent.
CHAPTER 5: UKRAINE’S DOMESTIC GAS MARKET
As described in Chapter 3, the Ukraine consumes about 60 billion cubic meters (Bcm) of natural gas per year, making it one of the largest markets in Europe. Ukraine imports approximately 65% to 70% of this volume (see Figure 5-1).
Structure of the Domestic Gas Market
The design of the Ukrainian gas market has remained unchanged in its main features—albeit with occasional modifications—for the past 20 years. In fact, one should use caution with the term gas market with respect to Ukraine; in many ways the Soviet-style system of administrative gas rationing and regulated prices is still present in certain sectors (see below), even though the economy at large has moved to market principles. Put differently, the Ukrainian gas industry is still at a relatively early stage of transition to a Western-style deregulated and liberalized gas market. The system of domestic gas supply is based on the state-owned National Joint Stock Company Naftogaz of Ukraine, a vertically integrated, legal monopoly combining the functions of production, transportation, and distribution of gas. Naftogaz, which operates through a series of wholly owned subsidiaries as well as a handful of joint ventures for gas production and regional marketing, dominates the Ukrainian gas market with almost 90% of production, control of the pipeline system, and access to final consumers via its regional distribution affiliates.
It should be noted that Naftogaz’s dominant position in the Ukrainian gas market comes with serious liabilities, especially with regards to supplying gas to certain categories of gas users at subsidized prices, to district heating utilities in particular.
Independent domestic producers and wholesale traders are present in the market, but they supply only around 5% of gas to final users (mostly within the high-priced industrial sector). While independents have the right to sell their gas at nonregulated prices, producers with state ownership of 50% or more must sell at regulated prices that have traditionally been kept low.
Figure 5-1
Gas Balance in Ukraine, 1990–2010
Domestic Gas Production
Gas Imports
0
20
40
60
80
100
120
140
1990 1995 2000 2005 2010
Bcm
Total Gas Consumption
Source: IHS CERA.

Natural Gas and Ukraine’s Energy Future Ukraine Special Report
5-2 Chapter 5
© 2012 IHS No portion of this report may be reproduced, reused, or otherwise distributed in any form without prior written consent.
On the downstream side, two important characteristics of the Ukrainian gas market stand out:
High gas penetration. Thanks to infrastructure investments made during the Soviet era, 78% of urban households and 38% of rural households are connected to the gas grid. There are 47,000 industrial customers in the country (including utilities), and over 13.4 million private homes are connected. Over 8.2 million gas users have gas meters installed.
Domestic wholesaling dominated by Naftogaz. Naftogaz has primary responsibility for marketing natural gas as well as liquid petroleum gas (LPG) on
the territory of Ukraine. Its system of low-pressure distribution pipelines has the status of a natural monopoly and is considered a “single technological system of national importance,” meaning that it is not subject to privatization under present legislation.
Although the low-pressure pipeline system remains state-owned, regional distribution companies (oblgazy and gorgazy) were wholly or partly privatized roughly a decade ago. Today Naftogaz continues to own controlling stakes in 19 of the 42 regional distribution companies and a minority stake in another 6.
In November 2011, Gas of Ukraine, a wholly owned subsidiary of Naftogaz that acted as the key supplier to domestic gas users from 2000 onward, was liquidated. Its functions were folded back into Naftogaz, which took over the gas supply contracts with the 42 regional distributors.
Pricing of Imported Gas
For many years after the collapse of the USSR, Ukraine managed to keep its domestic gas prices well below comparable levels of countries in Eastern Europe, owing first of all to abundant and cheap gas supply from Russia (and Central Asia), and second, to significant volumes of inexpensive domestic gas production.
At the time of the USSR’s breakup, Russia supplied Ukraine with most of its gas but at the same time relied on Ukrainian transit for about 70% of its gas supply to Europe. Initially this situation of interdependence led to relatively low import prices; but over time, through bilateral negotiations, Russia and Ukraine began to introduce market-based settlement principles on payment for both transit and gas sales. The most recent overall agreement, which forms the basis for sales and transit of Russian gas today, consisted of two separate 10-year contracts on gas sales and gas transit that were signed between the Russian and Ukrainian sides on January 19, 2009. These contracts stipulated formulas for the calculation of gas sales prices and transit fees each quarter. The gas sales contract agreed at that time
introduced a European-style oil-indexed gas price formula in Ukraine. The Ukrainian 2009 gas contract formula, however, is linear and leads to gas price escalation in a high oil price environment. In contrast, many other oil-linked gas contracts in Europe do not have purely linear formulas, but rather have “ceilings” that limit gas price escalation in the event prices for reference refined products increase over a certain level. In addition, just at the time the 2009 gas agreement between Russia and Ukraine was signed, European gas prices became rather volatile, for the reasons explained in Chapter 7—lower demand in Europe coupled with global liquefied natural gas (LNG) oversupply. In this context, many major European buyers managed to negotiate the inclusion of a 10% to 15% spot element into their contracts with
Gas price is calculated every quarter based on a formula. The contract price changes every quarter; it depends on the average change in low sulfur fuel oil and gasoil average prices over preceding nine months.

Ukraine Special Report Natural Gas and Ukraine’s Energy Future
Chapter 5 5-3
© 2012 IHS No portion of this report may be reproduced, reused, or otherwise distributed in any form without prior written consent.
Gazprom, bringing down their long-term contract gas price under the market conditions prevailing at the time (which continue today).
Partly as a result, Ukraine’s current average import price for Russian gas—agreed before the round of European price revisions—now exceeds the export parity value of this gas at the Russian-Ukrainian border (see Figure 5-2). (The export parity value represents the German border price minus Czech, Slovak, and Ukrainian transit charges.)
Domestic Gas Price Regulation
The regulator for the Ukrainian gas sector, the National Electricity Regulatory Commission (NERC), sets domestic tariffs on the basis of cost-plus methodology, taking into account categories of users and volume of consumption (for residential users). A domestic transportation tariff is calculated separately and set according to a “postage stamp” principle that applies the same transmission fee for all deliveries to final users in Ukraine, irrespective of transportation distance.
There are three distinctly different regulated gas price tiers in Ukraine: for industrial users, for residential users (population), and for district heating utilities providing heat to the population. The evolution of these three prices is shown in Figure 5-3.
This tiered system for regulated domestic gas pricing reflects an attempt on part of NERC to link sources of supply with categories of users on the basis of ability to pay. Industrial consumers, which are perceived to have the ability to pass on their gas costs to final consumers (mainly in export markets), pay a price linked to the imported gas price. At the other end of the spectrum, prices for residential consumers are linked with the cost dynamics of domestically produced gas—which historically has been relatively low-cost. As the volumes of gas production by Naftogaz and its majority-owned subsidiaries have roughly corresponded to total residential demand in terms of volumes, this element of the system has functioned reasonably well thus far.
Figure 5-2
Ukraine’s Gas Import Price versus Export Parity Value, 2000–11
0
50
100
150
200
250
300
350
400
Q1-2
000
Q3-2
000
Q1-2
001
Q3-2
001
Q1-2
002
Q3-2
002
Q1-2
003
Q3-2
003
Q1-2
004
Q3-2
004
Q1-2
005
Q3-2
005
Q1-2
006
Q3-3
006
Q1-2
007
Q3-2
007
Q1-2
008
Q3-2
008
Q1-2
009
Q3-2
009
Q1-2
010
Q3-2
010
Q1-2
011
Q3-2
011
Dollars per
Mcm
Ukraine's Average Import Price
Export Parity Value at Russia-Ukrainian Border
Source: IHS CERA.

Natural Gas and Ukraine’s Energy Future Ukraine Special Report
5-4 Chapter 5
© 2012 IHS No portion of this report may be reproduced, reused, or otherwise distributed in any form without prior written consent.
Figure 5-3
Domestic Gas Prices by Tier, 2000–11
In theory, pricing for district heating utilities should also be driven by costs, taking into account the appropriate proportions of expensive imported gas and cheap local supply. However, over time, most of the notional supply to district heating utilities has consisted of imported gas, while the regulated gas price to this sector low has been kept low by NERC. It is this slice of the market that is the weak link in the overall pricing strategy, as the gap between the import price paid by Naftogaz and the low regulated price for district heating has grown to very high levels, causing Naftogaz to sustain significant financial losses and requiring state financing of this deficit. During 2010, cash inflows from the state budget related to this compensation amounted to $423 million. This problem has grown over time and has been particularly pronounced in 2011: according to the latest news data, district heating companies run into debt of $585 million for the 2010/11 heating season.
Other aspects of the present system contribute to Naftogaz’s losses. Its subsidiary Ukrnafta, which is supposed to sell at least half of its production (slightly less than 1 Bcm per year) to Naftogaz at a regulated price for domestic sector needs, has been avoiding this obligation to a certain extent. Meanwhile a private company, Ostchem Holding, began to supply Central Asian gas directly to its associated fertilizer plants in April 2011. This reduced the size of the market niche available to Naftogaz in the most attractive sector of sales to industrial consumers. Independent gas producers along with Ostchem Holding control about 20% of supply to the industrial sector at present.
Apart from these losses resulting from price mismatches, Naftogaz also faces problems of nonpayment and increasing indebtedness. Nonpayment arrears of district heating utilities and
0
100
200
300
400
500
600
Jan-2000
Jan-2001
Jan-2002
Jan-2003
Jan-2004
Jan-2005
Jan-2006
Jan-2007
Jan-2008
Jan-2009
Jan-2010
Jan-2011
Dollars per
Mcm, Net of
VAT
Industry
District heating
Residential
Source: IHS CERA.

Ukraine Special Report Natural Gas and Ukraine’s Energy Future
Chapter 5 5-5
© 2012 IHS No portion of this report may be reproduced, reused, or otherwise distributed in any form without prior written consent.
other end users are close to $1 billion, and Naftogaz’s long-term debt obligations reached $4.74 billion at the end of 2010 and have continued to grow, and Naftogaz must draw down
more debt financing almost every month as payments for imported gas come due. For 2010,
Naftogaz’s operating losses amounted to $230 million.
Gas Prices and the Economy
High gas prices represent some danger to the Ukrainian economy in its current state. Roughly half of Ukrainian economic output is based on major gas-consuming industries: mainly metals and fertilizers, as well as power generation. Industries sensitive to the gas price account for about 60% of GDP and half of country’s export earnings (see Figures 5-4 and 5-5).
These export-based industries have remained competitive despite higher gas prices—after all, their competitors in the global market are generally facing higher energy costs themselves. But the high cost of gas imports remains in any case a drag on the country’s economy and its balance of payments. Gas imports currently amount to about 24% of country’s total export earnings (see Figure 5-6).
At the same time, high gas prices have prompted Ukrainian firms to invest in energy efficiency measures and thus decrease gas consumption, as described in Chapter 3 (and shown below in Figure 5-7).
Higher prices have had the additional positive effect of making the Ukrainian gas market potentially very profitable for domestic producers able to sell at unregulated prices (i.e., independent producers in which Ukrainian state companies have a share of less than 50%). This is helping to attract the attention of international gas companies for exploration and production projects focused on gas.
Figure 5-4
Ukraine’s Major Gas-Consuming Industries: Share of GDP
Figure 5-5
Ukraine’s Major Gas-Consuming Industries: Share of Export Earnings
Naftogaz Consolidated Financial Statement for 2010 (auditor BDO).
Ibid.
Metals 35%
Power 15%
Chemi-cals 7%
Other 43%
Source: IHS CERA.
Metals 40%
Mineral Products
9%
Chemi-cals 8%
Other, 43%
Source: IHS CERA.

Natural Gas and Ukraine’s Energy Future Ukraine Special Report
5-6 Chapter 5
© 2012 IHS No portion of this report may be reproduced, reused, or otherwise distributed in any form without prior written consent.
Figure 5-6
Ukraine’s Gas Import Bill versus Total Export Earnings, 2005–11
Figure 5-7
Ukrainian Gas Deliveries and Prices, 2000–11
8%
13% 13% 13%
18% 18%
24%
0%
7%
14%
21%
28%
0
20
40
60
80
2005 2006 2007 2008 2009 2010 1H_2011
Billion US
Dollars
Value of Gas Imports ($ billion [lhs])
Total Export Earnings ($ billion [lhs])
Ratio of Gas Import Bill to Total Export Earnings (% [rhs])
Source: IHS CERA.
17.2
17.3 17.0
18.0 17.1 18.0 18.9 17.1
17.6
16.8
17.6 17.4
8.6 10.8
12.8
14.4 13.9 13.7 12.9
10.5 10.1
10.2
11.1 10.9
8.3 7.6 8.1
8.3 8.8 8.7 8.2
7.2 7.2
5.8
5.3 5.3
73.4 70.5 69.8
76.3 75.8 76.4 74.0
69.9 66.4
52.0
57.7 59.3
38.3
33.8 30.9
34.5 35.0 34.9 32.9 34.1
30.5
18.4
22.7 24.7
0
50
100
150
200
250
300
350
400
450
0
10
20
30
40
50
60
70
80
90
2000 2001 2002 2003 2004 2005 2006 2007 2008 2009 2010 1H2011
$/M
cm
wit
h V
AT
Bcm
Internal Use by Gas Sector* Heat Producers** Budgetary Organizations Population Other Chemicals Metals and Mining Power Sector Total Industry, Total Gas Price for Industry, Rhs Gas Price for Population, Rhs Gas Price for District Heating, Rhs
Source: IHS CERA. *Includes internal gas use by transporting, distributing, and gas-producting companies. **For the needs of population, budgetary organizations, and other residential users.

Ukraine Special Report Natural Gas and Ukraine’s Energy Future
Chapter 5 5-7
© 2012 IHS No portion of this report may be reproduced, reused, or otherwise distributed in any form without prior written consent.
Price-Setting Methodology for Different Consumption Sectors
Industry
Industry represented about 45% of total consumption in 2010 (25 Bcm).
The maximum wholesale price (excluding transportation, supply costs, and markup) is set by NERC on the basis of the import parity principle: it is calculated from the average import price and exchange rate for the period, plus Naftogaz expenses for purchase and sale.
The same methodology is applied to “budget-financed entities” which represent about 2% of total consumption.
Households
Residential households represented about 33% of total consumption in 2010 (17.5 Bcm).
The maximum retail prices are set by NERC on the basis of cost-plus methodology applied to Naftogaz domestic gas production, including supply costs, investment markup, and transport costs (both trunk and distribution pipelines), based on the principles of monopoly regulation and long-run marginal supply costs for domestically produced conventional gas
Prices are differentiated among consumers based on volumes of consumption and existence of a gas meter.
District Heating
District heating represented about 20% of total consumption in 2010 (10.5 Bcm).
The maximum sale price is set by NERC; price-setting in theory should be based on a blended price reflecting both import prices and domestic supply costs, plus transport because domestically produced gas is not sufficient to cover demand by this sector; but in actuality prices have been held lower, and NERC has used the same price-setting principles as for households (see above).
Naftogaz losses on sales in this segment are financed from the state budget.
Ukraine and the Energy Community
In February 2011, Ukraine became a full member of the Energy Community, an organization formed at the initiative of the European Union to extend the EU internal energy market to southeastern Europe and beyond. In 2010, Ukraine’s accession protocol for the Energy Community was signed by President Viktor Yanukovych and ratified by the Verkhovna Rada. To stay in compliance with the goals and rules of the organization, Ukraine should now proceed to design and implement competitive energy market structures along the lines of EU regulatory principles.
The key piece of legislation that Ukraine adopted as part of bringing its legislation up to European standards—as a precondition of membership in the Energy Community—was a new gas market law, which sets out the basic principles for an EU-style gas market. The relevant piece of legislation, entitled “On Foundations of Natural Gas Market Functioning,” was adopted on July 8, 2010, and took effect on July 24, 2010. It establishes three key principles for the Ukrainian gas market:
Free choice of gas supplies by consumers
Nondiscriminatory access to gas transportation network and to gas storage
Horizontal unbundling and separation of production, transportation, and marketing functions
Natural Gas and Ukraine’s Energy Future Ukraine Special Report
5-8 Chapter 5
© 2012 IHS No portion of this report may be reproduced, reused, or otherwise distributed in any form without prior written consent.
Below, each principle is considered in turn.
Free Consumer Choice of Suppliers
According to the Energy Community protocol, this measure should have been fully implemented by January 1, 2012, for all consumers except residential users, and by January 1, 2015, for residential users. However, the text of the legislation contains a somewhat ambiguous definition of “gas consumers” that might not, in practice, allow residential users to choose their gas suppliers. Meanwhile, the future of regional distribution companies (oblgazy and gorgazy) is far from clear in this context.
Nondiscriminatory Access to Gas Transportation System
The Ukrainian gas grid has been utilized at levels well below its nameplate capacity during the past decade, and access to the gas network has not been considered a problem. This is in sharp contrast to the situation in Russia, where third-party access (TPA) to the pipeline system has been a major problem for independents. Ukraine, nevertheless, committed to adopting EU-style nondiscriminatory rules for TPA. NERC has not yet adopted normative acts to realize this commitment, although some exist in draft form. It does not appear that the January 1, 2012, deadline has been met. One positive step is that the Naftogaz monopoly on customs clearance of imported gas has been abolished (in April 2011).
Horizontal Unbundling
In September 2010, an interministerial group was created to take responsibility for the restructuring of Naftogaz. This working group has taken certain decisions—such as the abolition of the Naftogaz subsidiary Gaz of Ukraine—but many questions remain. In particular, there may be some legal conflicts between the Law on the Gas Transportation System and the principle of restructuring Naftogaz.
Recommendations for Gas Market Policy
From IHS CERA’s perspective, the need for liberal reform of Ukraine’s domestic gas market—along the lines of EU and Energy Community practice—is clear. The only questions concern the character and timing of transition mechanisms so as to ensure as smooth a transition as possible to a more competitive market and a market that can help stimulate domestic upstream investment.
It seems obvious that Ukraine, like many other European countries before it, will need to maintain some vertical integration in the near term, while building in appropriate regulatory structures for this transition phase.
Specific recommendations can be grouped in the following way:
Restructuring agenda. Ukraine should proceed with the horizontal unbundling of the gas sector, separating the competitive segments (gas production and marketing) from the “natural monopoly” segments (transportation) to begin with.
Deregulation agenda. Ukraine should effectively implement the principle of free choice of suppliers, possibly with a phased approach toward full implementation for residential and certain industrial gas users.
Competition agenda. So long as Naftogaz remains a legal monopoly in some sectors, stronger regulatory oversight is needed to ensure a level playing field for new entrants into the market—in particular independent upstream gas producers.
Ukraine Special Report Natural Gas and Ukraine’s Energy Future
Chapter 5 5-9
© 2012 IHS No portion of this report may be reproduced, reused, or otherwise distributed in any form without prior written consent.
Price liberalization agenda. At the maximum, Ukraine could proceed with full price liberalization for all categories of consumers, including residential customers, combined with cash grants to vulnerable categories of consumers. These support payments could be financed in part by higher upstream taxes (see below). At the minimum, regulated prices for district heating utilities should be restructured so as to move away from the present situation wherein Naftogaz finds itself sustaining large losses on domestic sales. The absolute level of any price increases will be determined to a significant extent by prices for imported Russian gas, which in turn will depend to some extent on Ukraine’s ability to renegotiate import gas prices in its supply deal with Russia.
Upstream taxation agenda. Under gas price liberalization, the tax take from the sector should be adjusted to take into account a new setting for mineral rent distribution among the state, gas producers, and gas consumers. Currently mineral rents are transferred to certain consumers (population and district heating) through price subsidies. In a liberalized market, these rents would initially accrue to gas producers, and it becomes the state’s task to rebalance the system by introducing a new tax deal. The aim of this deal would be to take away mineral rents resulting from price liberalization for some relatively low-cost producers. At the same time, upstream gas royalties should be differentiated to reflect the various mineral rents from different properties with wide ranges of profitability (relatively low-cost conventional gas development versus high-cost unconventional gas or high-cost, difficult-to-recover new gas).
Indicative Scenarios
Ukraine’s gas market is currently at a crossroads, with its policymakers facing a range of potential paths ahead. In order to help understand future trajectories for the gas sector, we have sketched out three scenarios (see Table 5-1). The two scenarios on either end—“With Europe” and “With Russia”—are meant to be extreme; they are not predictions but rather scenarios that are meant to test the range of possible outcomes. In reality, Ukraine’s path will resemble some variation on the “Between Two Worlds” scenario, leaning either in the European or Russian direction on the basis of that framework.

Natural Gas and Ukraine’s Energy Future Ukraine Special Report
5-10 Chapter 5
© 2012 IHS No portion of this report may be reproduced, reused, or otherwise distributed in any form without prior written consent.
Table 5-1
Ukraine Gas Market Scenarios
With Europe With Russia Between Two Worlds
General description
Fast reforms and full implementation of the EU model for gas industry structure and regulation.
Slow and tightly controlled transition, with reforms delayed.
A balanced approach toward liberalization, with reforms taking place but with form prevailing over substance; Naftogaz is restructured but not reformed.
Pricing of imported gas for Ukraine
Current contract formula continues for Russian gas; possible non-Russian supplies of imported LNG, compressed natural gas, or pipeline gas emerge at marginally competitive prices
Significant discount granted by Gazprom, tied to Ukraine joining Customs Union and Gazprom taking substantial ownership of Ukrainian trunk pipelines and gaining more access to final gas market.
Relatively small price discount for Ukraine (reduction of base price or introduction of adjustment coefficient) in exchange for Gazprom’s participation in a transportation consortium and some greater access for Gazprom in the Ukrainian market.
Pricing of gas for Ukrainian consumers
Import parity principle; liberalization of prices for all categories of consumers (including population) by 2015 along with monetization of subsidies.
Prices for industrial consumers and district heating tied to import parity levels, but with import prices much cheaper; multispeed price liberalization for different categories of gas users.
Price dynamics for industrial consumers and district heating tied to import parity levels, thus reflecting small Russian gas discount; multispeed price liberalization for different categories of gas users.
Upstream Fiscal Terms
Initial transfer of rent from consumers to producers is followed by introduction of higher upstream taxes to finance monetization of subsidies. Fast increase of royalty rates.
Current tax regime maintained, indexation of royalty linked to import price; relatively slow pace of royalty rate increases.
Current tax regime maintained; indexation of royalty linked to import price, relatively moderate pace of royalty rate increases.
Gas transportation system
Pipeline system unbundled and adopts common carrier model; nondiscriminatory TPA introduced.
Substantial Gazprom ownership of Gas Transportation System, possible problems with TPA.
Trilateral consortium (including Gazprom and EU partners), nondiscriminatory TPA introduced
Transportation tariff (domestic)
Rapid tariff growth owing to gas price increase and higher share of technical gas in tariff cost structure.
Low tariff growth. Moderate tariff growth.
Export opportunity
Free export. No export for independents.
Some export opportunities for independents (production-sharing agreements).
Source: IHS CERA.

Ukraine Special Report Natural Gas and Ukraine’s Energy Future
Chapter 6 6-1
© 2012 IHS No portion of this report may be reproduced, reused, or otherwise distributed in any form without prior written consent.
CHAPTER 6: REGULATORY ENVIRONMENT
Over the past 18 months Ukraine has introduced many positive changes to the legislation and regulation governing licensing for oil and gas exploration and production (E&P). The government’s Program of Economic Reforms for 2010–14 outlined measures and steps to be taken to reform the oil and gas sector, including key developments in the subsoil licensing regime:
Harmonization and improvement of licensing and other regulatory procedures for exploration and production of hydrocarbons
Establishment of equal rules for national and foreign investors in this sector
The Ukrainian regulatory environment remains complex, however, making some interactions with the state complicated, lengthy, and at times rather costly. Recognizing this, the World Bank and International Finance Corporation in 2011 rated Ukraine at 152 out of 183 countries on the ease of doing business, which is 3 places lower than in 2010 and significantly lower than the regional average level of 77 for Eastern Europe and Central Asia. The low Ukrainian rating is attributable to difficulties associated with starting a new business, paying taxes, dealing with permits, and registering property. The rapidly evolving legal environment and terms and conditions of doing business also create some uncertainty for potential investors. Furthermore, permitting rules, tax regulations, and regulations from local/district governments have changed substantially since the latest presidential elections.
Legislation governing oil and gas remains ambiguous and inconsistent, and it can be difficult for operators to remain in compliance. For example, the Law on Oil and Gas prohibits contributing subsoil special permit rights (e.g., ownership of produced gas) to joint-activity agreements (JAAs; a common form of business partnership); at the same time the Law on Fundamentals and Functioning of the Natural Gas Market expressly states that companies, irrespective of their form of ownership, are considered owners of produced gas including rights arising out of JAAs. Another example was an inconsistency, which has recently been corrected, related to the stability clause—a guarantee provided to investors that legislation would not worsening their obligations, including regarding taxes, during the life of a project. The guarantee was canceled by the Production Sharing Agreements (PSA) Amendment Law, but was still present in the Law of Investment Activities and Tax Code.
Executive and judicial actions also were not necessarily favorable toward gas business development in the past. In a number of cases the decisions and agreements of the previous government regarding cooperation with foreign investors were inconsistent. For example, the revocation of Vanco International’s permit as well as disputes around licensing/permitting of CBM Oil, Marathon, and Shelton illustrate the uncertain regulatory environment of the previous government.
Judicial power does not often provide the required protection of investors’ interests in the gas business in Ukraine; it offers insufficiently strong protection against the state with regard to maintaining contractual and property rights, consistent treatment of tax provisions by different government bodies, and transparent interactions with federal and local authorities. Local litigation is time consuming, with a need for appeal of court decisions in many cases. Extensive litigation procedures could result in costly and long delays for companies. International arbitration awards are in principle enforceable inside Ukraine in accordance with terms of the New York Convention on Recognition and Enforcement of Foreign Arbitral Awards.
The Public-Private Partnership (PPP) Law provides incentives for cooperation in oil and gas E&P; however, it has some serious limitations. The PPP Law explicitly lists E&P of

Natural Gas and Ukraine’s Energy Future Ukraine Special Report
6-2 Chapter 6
© 2012 IHS No portion of this report may be reproduced, reused, or otherwise distributed in any form without prior written consent.
mineral deposits as one of the core areas of activity and defines the time frame for PPP relationships as from 5 to 50 years, providing certain guarantees. The guarantees include protection against national/local authorities interfering with private partners’ activities; application of some rights, laws, and obligations of parties valid for the duration of the PPP (with some exceptions); and compensation for damages as a result of unlawful decisions by national or local authorities. At the same time, the law fails to guarantee that laws valid at the date of signing of a PPP agreement apply to critical areas of environmental protection, quality and permitting standards, taxes, currency issues, customs, defense, national security, public order, and other areas.
PERMITTING
Stagnation in oil and gas E&P permitting from the end of 2010 to the beginning of 2011 created a roadblock to sector development. The complicated nature of the permitting regime, the constantly changing procedures for issuing permits, and contradictory regulations led to a halt in the permitting process—only four auctions for sale of special permits were held in 2010 and no permit was issued in the first half of 2011. Procedures for granting special permits changed every year during 2008–11 and in recent years were regulated by Permitting Regulations adopted by the Cabinet of Ministers:
June 17, 2009: Resolutions for granting special permits by the Cabinet of Ministers
June 23, 2010: Procedure of granting special permits to use subsoil in 2010
July 21, 2010: Procedure for holding auctions for sale of special permits to use subsoil in 2010
May 30, 2011: Procedure for holding auctions for sale of special permits to use subsoil
Before 2011, procedures for granting special permits were drafted in a way that mainly favored state-controlled companies, and some decisions were not even published.
Ukraine currently has four types of oil and gas special permits:
An exploration special permit, including pilot production, which can be granted for up to 5 years onshore and up to 10 years offshore
Combined exploration, pilot production, and commercial production special permit, which can be granted for a period matching individual E&P special permits, but for not longer than 20 years onshore and 30 years offshore
A production special permit, which can be granted for not more than 20 years onshore and 30 years offshore
Special permit for construction and operation of underground storage facilities not directly related to oil and gas E&P, which can be granted for up to 50 years
Duration of special permits can be extended subject to compliance with established requirements.
Some features of Ukraine’s permitting regime appear to be less advantageous than that of other countries. For example, acreage size offered in Ukraine is hardly sufficient for exploration and appraisal purposes, especially for unconventional gas: under the subsoil special permit regime, acreage size is limited to 500 square kilometers (sq km) for onshore and 1,000 sq km offshore. In contrast, onshore acreage in Poland can be up to 1,200 sq km and in Bulgaria, 1,000 sq km. In the United States, the acreage sizes for shale gas development vary widely across and between the plays, with reported acreage of up to 3,642

Ukraine Special Report Natural Gas and Ukraine’s Energy Future
Chapter 6 6-3
© 2012 IHS No portion of this report may be reproduced, reused, or otherwise distributed in any form without prior written consent.
sq km. The duration of Ukrainian special permits is also not long enough for project development: special permits for gas exploration onshore extend only for up to 5 years, and production permits are issued for up to 20 years. At the same time Romanian concession agreements are concluded initially for up to 30 years with a possible 15-year extension, while agreements in Bulgaria are for up to 35 years, also with a possible 15-year extension. Terms and conditions for permit extensions are not specifically defined by law, but rather follow the procedure for granting special permits. It is understood that Ukrainian authorities rarely issue special permits for combined E&P, although there is a system for converting exploration permits into production special permits, with a complex structure regarding the cost of such a conversion. Lack of guidance and of regulatory provisions covering E&P of unconventional resources (other than for coalbed methane) makes it unclear whether subsoil special permits specifically for shale gas E&P can be obtained; shale gas seems to be outside of scope of the legislation that applies to conventional resources.
It was reported that in the course of conducting due diligence activities, possible issues arose regarding how special permits were issued and how the authorizations for the execution of relevant agreements were conducted, for example, the act delegating signature authority earlier for a license agreement cannot now be found. It is understood that Ukrainian oil and gas activities are subject to such technical problems, which practically speaking would not prevent operations by the Ukrainian party but could inhibit Western investors, lenders, and joint venture partners from providing funding.
E&P special permits for subsoil use are supposed to be granted mainly via auctions, with only some exceptions. Auctions for subsoil blocks offered for E&P are organized by the State Service for Geology and Subsoil, with approvals from other relevant state authorities and ministries. Companies submit bids and pay participation fees to the organizer, bids are reviewed, and the awards go to the ―most attractive bid‖ (although criteria are vague). The winner is granted a license, pays the state a previously determined bonus, and starts the application process for land rights and local operation permits. However, potential auction participants must submit documents within 15 days of the auction announcement, a relatively short period, and the list of required documents includes documents that can only be provided by companies established in Ukraine and not foreign investors.
The 2001 Oil and Gas Law allows a permit to be temporarily suspended or withdrawn in certain cases such as violations of security, environmental standards, and production obligations set in the contract. Several more specific reasons are listed: operations becoming an immediate threat to the health and safety of employees and/or the local population, multiple violations of environmental legislation, noncompliance with requirements for efficient exploitation of resources, failure to conduct the required development and production operations, and not taking remedial action upon permit suspension. Some of these provisions are loosely defined and by themselves not necessarily materially sufficient.
The auction procedure introduced in May 2011 does give participants more clarity and guidelines. This procedure was approved without time restriction and applies to all agreements going forward, and it is a positive move that should reduce significant delays in issuing special permits. In addition, the following amendments make permit applications and issuance easier and more transparent:
Fewer state authorities are now required to approve the list of offered blocks
Conversion of an E&P license is now possible without conducting a new auction, provided exploration activity leads to approved estimates of hydrocarbon reserves.

Natural Gas and Ukraine’s Energy Future Ukraine Special Report
6-4 Chapter 6
© 2012 IHS No portion of this report may be reproduced, reused, or otherwise distributed in any form without prior written consent.
Auction results must be published on the State Service for Geology and Subsoil website and can be challenged only in court (previously, the Cabinet of Ministers could cancel such results arbitrarily).
Model terms and conditions were adopted for licensing agreements that must accompany and are integral to every subsoil license, which also makes such licensing agreements more transparent.
However, despite the many recent positive changes in procedures, there are still a number of significant drawbacks:
Special permits can still be granted without an auction in certain cases.
Auctions are announced only 30 days in advance, and participants have only 15 days to submit their applications, which makes it almost impossible to prepare.
Special permits can only be renewed twice, and renewal is not guaranteed.
The fee for extension of an exploration subsoil license was increased considerably, from 1% to 5% of the initial auction sale price, and the fee for extension of a production subsoil license was raised to 20% (in contrast to 10% in 2009).
Ukrainian legislation also requires additional permits and approvals for various activities, apart from receipt of a special E&P permit. Such permits cover emissions, water use (including intake and discharge), waste storage or disposal, use of hazardous substances, construction, and various approvals of technical documentation as well as an activity license.
In many cases, obtaining a permit from one authority may require preapproval from other state authorities. Application procedures for these permits are established by legislation and likely to be nonnegotiable. Compliance with all permitting requirements and procedures may cause unnecessary project delays while a comprehensive package of documents is developed and submitted, followed by further delays as authorities review the permit applications and accompanying documentation. For example, obtaining land allotment permission is extremely bureaucratic; it could take between 6 and 12 months to receive approvals for drilling a new well that will take only 3 to 4 months to drill. Obtaining approval for technical programs is also often challenging even if, for example, well accepted international technical methods do not match current Ukraine practices. For this reason, operators may select suboptimal alternatives to be certain to receive approvals, which will not improve field efficiency and productivity.
While some permits can be obtained by declaration or silent consent, others cannot, for example, permits for special water use and waste handling. Yet the current list of permits is a major improvement compared with the previous list of requirements, which was almost twice as long as the current list; and the government plans to decrease the number of required approvals and permits even further.
Simplification of the permitting procedures will benefit Ukraine, making operations more efficient, increasing production, and offering greater profitability. Ukraine will become more attractive to foreign direct investment, bringing new employment and increased state tax revenues.
Fiscal Regime
Both a standard fiscal regime and PSAs are used in Ukraine. Under the concessionary/standard regime, the investor receives title to produced hydrocarbons at the wellhead, receives income from the sales of produced volumes, and pays all applicable taxes and fees. Under PSAs, the state retains title to the produced volumes of hydrocarbons; the

Ukraine Special Report Natural Gas and Ukraine’s Energy Future
Chapter 6 6-5
© 2012 IHS No portion of this report may be reproduced, reused, or otherwise distributed in any form without prior written consent.
investor receives income after sharing with the state the proceeds from oil and gas sales; only certain taxes are applicable; and special terms and conditions, different from the concessionary tax regime, apply. The investor must fulfill certain E&P obligations and targets in both the standard regime and the PSA system.
Most operations fall under the standard fiscal regime, as the Ukraine government favors state companies by providing tax subsidies and exemptions (subsoil rental fee, royalties). Only one PSA deal has been concluded in Ukraine: in 2007 the country signed a PSA contract with Vanco, but no PSA tenders have been held since then. The Vanco license, however, was challenged in the courts in 2009–11, which led to a negative perception regarding how Ukraine applies PSA terms. The state appears to have an interest in signing more PSAs, but their widespread use will depend on real, positive practical experiences for foreign companies rather than just restated PSA-related laws and regulations. At the same time, PSA tender provisions were established 2001 and have not been reviewed since 2003. This procedure also may need to be changed to ensure a transparent tender process and swift evaluation of submitted bids.
The PSA law provides greater flexibility and benefits to investors than under the standard concessions regime. The advantages are in both operational and financial areas. It allows a joint E&P special permit for up to 50 years with a possible extension and does not limit the acreage for E&P special permits. The PSA Law also simplifies acquisition of land rights and interactions with the state by removing local authorities as counterparties. However, in practice it appears that approval of the local authorities is still needed to finalize a PSA contract.
On the financial side, the PSA law, along with the tax code, has a stability clause that guarantees investors a stable tax rate during the life of the agreement. The law also adjusts some specifics in the standard tax system. For example, capital costs can be depreciated much more rapidly: in 1 to 2 years, compared with 10 to 12 years for activities in the standard regime; imported equipment is exempt from import duties and value-added tax (VAT); and certain amounts of production are exempt from export taxes.
As a general observation, however, the Ukrainian fiscal legislation and regulations are complex and open to interpretation, which in some cases falls not to the benefit of the tax payer. There are some limitations on taxation that are disadvantages for foreign companies, for example, taxes on funding, limits on dealing with tax loses, increased royalty payments (in essence a tax), and difficulty in recovery of VAT.
Customs regulations and procedures may also have a negative effect on operations. Customs clearance procedures for new equipment imports are complicated, with tax and temporary import fees making up about 20%–30% of the equipment’s actual value. Although the new Tax Code of Ukraine positively resolved the matter of VAT for temporary import of equipment for oil and gas facilities, import duties on temporary imports often make up 5%, 10 %, or even 15% of the equipment’s value. This creates additional expenditures and may significantly increase well costs, for example. Under the Istanbul Convention it is possible to bring some equipment into the country temporarily without paying the full import duties; however, the list of such equipment is quite limited and is challenged by the customs officers.
Operational Concerns
Many fields that produce the bulk of Ukraine’s gas appear to be depleting, hence lowering the state resource potential. The mineral resource base could be deteriorating because of both objective factors and inefficient subsurface management. Therefore, geological surveys and appraisal drilling should be conducted on a regular basis. State promotion of geological surveys and appraisal drilling (mainly by simplifying the procedures
Natural Gas and Ukraine’s Energy Future Ukraine Special Report
6-6 Chapter 6
© 2012 IHS No portion of this report may be reproduced, reused, or otherwise distributed in any form without prior written consent.
for special permits acquisition, for import and operation of the modern equipment, and for certifying and placing foreign equipment into operation) would create favorable conditions and stimulate companies to invest funds in these activities. Acquiring historical geological and well data is currently challenging, and procedures to export such data for analysis are complicated; thus a more straightforward process for acquiring state-held information will be beneficial.
Ukraine has complex reservoirs that require new technology to optimize production and recovery. Considerable potential reserves remain in the ground, and modern technologies and equipment could improve extraction significantly. At the same time, production assets are aging. Outdated technology (methods of production) and equipment contribute to the efficiency problems and accident risks. The majority of existing drilling equipment used by local contractors has been in operation on average for 20–25 years. Procedures for importing new equipment are prohibitive, however, with complicated procedures for customs clearance; compulsory certification of the equipment; and required operational permits, operational licenses, etc., that slow down the implementation of innovative technologies and the use of modern equipment in Ukraine’s oil and gas industry. Simplifying these processes as well as encouraging joint ventures and partnerships between international and local service providers could expand the service market and improve the transfer of technology and application of best techniques.
Functioning of Natural Gas Market
Last year Ukraine adopted the Law on Functioning of Natural Gas Market which attempts to harmonize Ukrainian legislation with provisions of EU gas market regulation and to support a more competitive gas market in country. This law was a prerequisite for Ukraine to join the European Energy Community. It is understood that the law incorporates the EU Second Gas Directive but does not necessarily address specifics introduced by the third EU Energy Package that came into force in March 2011. The law contains principles such as unbundling of gas exploration, transportation, and supply activities; guarantees of equal access to gas networks; free choice of distributor and supplier by customers; and free access to the pipeline system and underground gas storage facilities.
The law also contains provisions for a transition period but lacks specific guidelines that differentiate between transitional provisions of the law and final provisions that apply to a liberalized market after the transition period; nor does it detail the parameters of the transition period. This creates uncertainty among potential investors regarding the current and future operating environment.
Although the law established favorable market principles, the current framework lacks specific implementation mechanisms. The key principle that grants equal access to the unified gas transportation systems and storage facilities must be followed up with adoption of an implementation procedure. Procedures to connect gas-producing fields to the transportation system need to be standardized to provide efficient access.
An effective regulatory framework also involves mechanisms that support and facilitate gas exports. Although the principles appear to be implied by the law, there are no specific provisions covering gas export rights for private companies.
In a further impediment, the law establishes a regulated price for certain producers, including for JAAs with participation of state-owned companies. Regulated gas prices and so-called domestic market obligations hinder broader investment in gas production. Prices determined by government authorities often do not reflect market fundamentals but are motivated instead by social needs, which can create unintended long-term consequences such as disincentives to invest in infrastructure and gas supply projects. The social component of a
Ukraine Special Report Natural Gas and Ukraine’s Energy Future
Chapter 6 6-7
© 2012 IHS No portion of this report may be reproduced, reused, or otherwise distributed in any form without prior written consent.
regulated price mechanism can be acknowledged, but market-based pricing for all gas producers and a competitive gas industry overall should benefit Ukraine in the long term, and an independent regulator can control abusive pricing behavior.
Any changes should be introduced step by step to allow all market participants to adapt accordingly.
Main Policy and Legislation Concerns
Many positive changes were introduced in Ukrainian legislation over the past 18 months. International investors reacted positively to such changes.
At the same time, the following key issues were identified as areas for policy and regulatory improvements for the state’s consideration:
Duration of special permits should be increased.
Acreage should be expanded beyond the current 500 and 1,000 sq km for onshore and offshore, respectively.
Combined E&P special permits should be favored over separate permits.
Conversion of an exploration special permit to a production permit should be automatic.
Special procedures and methodologies for permit cost calculations for difficult (unconventional) resources should be developed that take into account low geological knowledge and the high risk associated with this type of resource.
Confirmation of the legal status of a JAA is needed for the issue and use of special permits as well as for consistent tax treatment.
Provisions should be introduced in legislation to guarantee that special permits, licenses, and contracts issued in the past remain valid.
Investors’ PSA bidding proposals should be evaluated in a quick, fair, and transparent manner.
The purpose and the potential outcomes from the recently introduced shale gas classification as a separate type of resource should be clarified to avoid limitation of licensees’ rights.
The time for submitting documents for auctions should be extended beyond 15 days for special permits and 30 days for PSA tenders.
Easier access to exploration data is required.
Simplification for import procedures and for putting equipment into operation could ensure application of best available technologies in energy resource E&P.
Simplified permitting methods for all project approvals could lead to more efficient operations and more rapid production.
Definition of the transitional and the permanent provisions of the Law on Functioning of Natural Gas Market should be addressed.
The Law on Natural Gas Market should explicitly allow for export of produced gas.
Private investors and those who are parties to JAAs with state participation and joint ventures should be allowed to sell their share of produced gas at a market price.

Natural Gas and Ukraine’s Energy Future Ukraine Special Report
6-8 Chapter 6
© 2012 IHS No portion of this report may be reproduced, reused, or otherwise distributed in any form without prior written consent.
Secondary legislation is required to implement the principle of nondiscriminatory access to the national gas transportation system and storage facilities.
Taxation issues associated with tax treatment of foreign companies should be addressed.
The detailed list of concerns and specific recommendations are summarized in the Appendix to this Special Report.
It is understood that there are no obvious solutions to all of the above concerns. It is strongly recommended that prompt action be taken to address some of these concerns in order to encourage foreign investment and accelerate the development of Ukraine’s natural gas resources.

Ukraine Special Report Natural Gas and Ukraine’s Energy Future
Chapter 7 7-1
© 2012 IHS No portion of this report may be reproduced, reused, or otherwise distributed in any form without prior written consent.
CHAPTER 7: THE EUROPEAN GAS MARKET AND ITS IMPLICATIONS FOR UKRAINE
The events of the past three years have put the traditional structures of the European gas market under great stress. In the economic recession of 2009 European gas demand declined sharply just as the global liquefied natural gas (LNG) market was going into oversupply. The result was the appearance of a large pricing differential between gas delivered at (high) oil-linked prices under long-term contracts on the one hand and the (low) spot prices for gas traded at the Continent’s emerging hubs on the other hand.
This situation put enormous pressure on the long-term contracts that have for some time formed the basis for long-term gas sales into Europe by major suppliers such as Gazprom. It also put huge financial pressure on the traditional leading companies of the European gas midstream, which found themselves buying gas at high prices and selling it at low prices.
Although the market has largely returned to balance in 2011, it is clear that the European gas industry has changed in some fundamental ways, most notably with the growing relevance of traded market prices for gas.
These developments are not, however, likely to have a major impact on Ukraine’s position with respect to the European gas market. The key elements of the market most relevant for Ukraine should remain relatively stable going forward.
Imports very likely to increase. First, European gas imports are very likely to continue growing over time owing to slow but steady demand growth as well as declining indigenous production. It is true that Europe has considerable potential for production of shale gas and coalbed methane, but for reasons of cost and environment IHS CERA believes that unconventional gas will emerge only gradually in Europe.
Second, Russia will remain a major source of gas for Europe imports under
any plausible scenario. Indeed it is virtually certain that European imports of Russian gas will continue to grow over time.
European Gas Demand Outlook
Our outlook for gas demand in the European market is based on IHS CERA’s base case scenario for global energy. This scenario, called Global Redesign, foresees the expansion of globalization and a gradual change in the global energy mix toward renewable energy sources (rather than a more radical and rapid shift toward renewables). This creates a positive climate for continued growth—albeit not particularly rapid growth—in the European gas market over the long term.
The starting point for our outlook is the economic crisis of 2009, which caused gas consumption in Europe to collapse by 6 percent relative to 2008 levels—the sharpest demand
drop in the history of the European gas industry. All of this lost demand was restored in 2010, but to a significant extent this was driven by unusually cold weather at the start and end of the year. For 2012 and beyond, the picture is one of slow demand growth due partly to the continuing sluggishness of the European economy, itself caused by problems within the eurozone. IHS CERA does not expect European gas demand to exceed 2008 levels until 2014–15.
Europe is defined here as the EU27 plus Norway, Switzerland, all of former Yugoslavia, Albania, and Turkey.

Natural Gas and Ukraine’s Energy Future Ukraine Special Report
7-2 Chapter 7
© 2012 IHS No portion of this report may be reproduced, reused, or otherwise distributed in any form without prior written consent.
From 2015 onward, in this base case, IHS CERA expects European gas consumption to continue to grow through 2035, albeit at a lower average rate of growth than previously. Whereas demand grew by an average of 1.8 percent annually between 2000 and 2008, we expect demand growth to average just 0.8 percent per year from 2015 to 2035. This would bring European gas demand to 621 billion cubic meters (Bcm) by 2025 and to 673 Bcm by 2035, up from 561 Bcm in 2010 (see Figure 7-1). The sectoral drivers for these aggregate figures are as follows:
Power generation will be the key driver of gas demand growth, with average annual growth between 2012 and 2035 of 1.0 percent, to bring gas consumption in the sectorfrom 181 Bcm in 2011 to 227 Bcm in 2035.
Residential and commercial demand will grow sluggishly at 0.5%, gowing from 222 Bcm in 2011 to 252 Bcm in 2035.
Gas demand in industry is expected to grow even more slowly at only 0.3% annually, growing from 131 Bcm in 2011 to 139 Bcm in 2035.
It is important to note that these figures mask significant differences among Europe’s subregions. Demand in the more mature markets of core Europe will remain almost flat between 2010 and 2025, for two reasons. There is little room for further grid penetration, and also a strong policy-driven push of renewables into power generation will limit growth of gas consumption in the power sector.
Southeastern Europe (including Turkey), however, will show much more robust growth; indeed fully 41 percent of European demand growth between 2011 and 2035 is expected to come from Turkey alone in our base case.
Figure 7-1:
IHS CERA Base Case Outlook for European Gas Demand
Residential/ Commercial
Industrial
Power Generation
Other (Transport, Own Use, Losses)
0
100
200
300
400
500
600
700
800
2005 2010 2015 2020 2025 2030 2035
Bcm
Source: IHS CERA.
Ukraine Special Report Natural Gas and Ukraine’s Energy Future
Chapter 7 7-3
© 2012 IHS No portion of this report may be reproduced, reused, or otherwise distributed in any form without prior written consent.
European Gas Supply Outlook
Even with relatively modest levels of growth assumed, Europe faces a considerable gas supply challenge; existing indigenous gas production is already declining. In 2010 Europe produced almost 200 Bcm, which accounted for 35 percent of required supply, leaving a
demand gap of over 360 Bcm to be met by imports. IHS CERA’s detailed supply outlook shows European conventional gas production falling to around 60 Bcm by 2030, leaving a gap of about 585 Bcm to be filled by 2030. Thus external suppliers along with potential producers of unconventional gas within Europe face the challenge of supplying an additional 200 Bcm per year by 2030—with all of the investment in upstream development and transportation infrastructure that this entails.
Indigenous Supply, Conventional, and Unconventional
Europe’s projected production decline in conventional gas in the coming years will be driven chiefly by lower production in the United Kingdom and the Netherlands. Declines are also anticipated from other, smaller gas producers—mainly Denmark, Germany, Italy, and Romania.
Unconventional gas still represents a major uncertainty for the European gas market. Although it is still very early days in Europe, it is unlikely that the unconventional production will be as transformative in Europe as it has been in North America, despite a similar resource base. Crucially, the development of shale gas in Europe will need to be done with a much smaller environmental footprint than in the earliest North American developments. This is certainly manageable, given that technological advances have dramatically reduced the aboveground impact of shale drilling. A variety of licensing and regulatory issues pose further complications and constraints for the emergence of unconventional gas in Europe, however. As a result IHS CERA does not expect material unconventional production before 2020.
In our base case scenario, we assume that 20 Bcm of unconventional gas could be developed by 2020, rising to almost 70 Bcm by 2030. This would reduce the need for increased imports but not come close to eliminating it.
LNG
LNG imports into Europe have boomed in the past two years, growing from 57 Bcm in 2008 to 87 Bcm in 2010. The top two suppliers are Qatar and Algeria, with Nigeria, Egypt, Trinidad & Tobago, and a handful of others making up the balance. With North America having retreated from the global LNG market thanks to its shale gas boom, Europe (and in particular the United Kingdom, where regasification capacity has surged) has been acting as the backstop market globally for spot LNG cargoes.
Looking ahead, IHS CERA sees steady growth in LNG imports into Europe. LNG imports are expected to grow to 143 Bcm by 2030, with the lion’s share of additional supplies coming from Qatar and West Africa.
Russia
Significant growth in Russian gas exports to Europe will be required to meet the Continent’s long-term needs as assumed in IHS CERA’s base case scenario. It is extremely likely that Russia will remain the largest single gas supplier to Europe through at least 2030,
This figure excludes production from Norway.

Natural Gas and Ukraine’s Energy Future Ukraine Special Report
7-4 Chapter 7
© 2012 IHS No portion of this report may be reproduced, reused, or otherwise distributed in any form without prior written consent.
with its exports to Europe growing from the current 130 Bcm annually to something in the neighborhood of 200 Bcm by 2020.
Alternative Scenarios
IHS CERA has also considered much more radical scenarios for the European gas industry. In the Metamorphosis scenario, European gas demand declines sharply over the next 25 years owing to a powerful policy-driven low-carbon agenda, which leads to a dramatic push toward renewable energy sources. Another alternative scenario projects a much more rapid and substantial shale gas boom in Europe, likely led by Poland, which could reduce the required growth in European gas imports over this period.
These scenarios, even if IHS CERA does not consider them to be the most likely ones, are possible, and they would lead to a different set of circumstances in the European gas market. However, they would not change one key factor: Russia’s role as a major gas supplier to Europe.
Implications for Ukraine
Europe and its gas market are significant for the Ukrainian gas industry for a number of reasons, of which two stand out in particular.
Russia still a major supplier. Russia’s role as a leading supplier of gas to the European market—something that will not change in the years ahead under any scenario—puts Ukraine in a highly strategic position as a transit country, even if its importance has declined with the construction of alternative routes. Ukraine’s gas transit role is at the core of how both Europe and Russia view the Ukrainian gas industry. Europe could play an important role in the future of the Ukrainian transit route for gas, potentially in the context of the ―consortium model‖ for trunk pipeline ownership and operation, and less directly given the role that EU institutions can play in supporting or complicating the proposed South Stream pipeline.
EU-driven changes in Ukraine’s gas industry. Ukraine’s European perspective, focused at present on the EU-Ukraine Association Agenda and for energy the country’s membership in the Energy Community, means that the steps the European Union has taken toward liberalization of its gas industry since the late 1990s are now the default blueprint for Ukrainian gas industry reforms. Perhaps the single most important factor for the future of Ukrainian gas is whether and how Ukraine continues down this European reform path.
These conclusions highlight again the centrality of the Ukrainian pipeline system for Europe as well as Russia, even in the context of declining transit volumes. They also suggest that the core issues in European-Ukrainian relations in terms of natural gas are related to politics and policy much more than to gas industry fundamentals.

Ukraine Special Report Natural Gas and Ukraine’s Energy Future
Chapter 8 8-1
© 2012 IHS No portion of this report may be reproduced, reused, or otherwise distributed in any form without prior written consent.
CHAPTER 8: UKRAINE COMPARED WITH ALTERNATIVE AREAS FOR INVESTMENT
Approach
The comparison of Ukraine with other countries in this analysis relies on actual finding and development costs in each jurisdiction, taking into consideration varying commodity prices, price differentials, distance from liquid markets, the actual size of discoveries, well productivity, water depth, and technological challenges associated with each environment and resource type. To provide an ―apples to apples‖ comparison of fiscal systems by generating models that mirror each investment environment, IHS CERA relied on actual oil and gas discoveries made between 2000 and 2010 in each jurisdiction. A total of 30 conventional gas fields and 26 unconventional gas projects were selected for this comparative review.
We used the IHS international proprietary exploration and production (E&P) databases for field information related to cumulative production, recoverable reserves, geological formation, reservoir and water depth, well flow rates, pressure, oil/gas ratio, distance from existing facilities and infrastructure, exploration success, and other inputs.
The cost models account for abortive exploration efforts, applicable risk premiums associated with each jurisdiction, and the cost of environmental compliance. IHS data on exploration success rates for each jurisdiction were used to account for the number of exploratory wells included in each model. The cost models used for this study provide detailed information on capital expenditure and operating costs, tangible and intangible expenditure, and processing and transportation costs, which are often allowed as deductions for royalty purposes.
The economics were run in real terms to avoid the need to make assumptions about escalation rates for capital and development costs. The models do not account for price escalation or inflation. We developed three separate price and cost scenarios to analyze the impact of varying market conditions on project economics.
A set of three natural gas prices were selected for North America, Europe, and Asia, reflecting the market structures in each region. For North America the selected natural gas prices are $4, $6, and $8 per thousand cubic feet (Mcf) ($141, $212, and $282 per thousand cubic meters [Mcm], respectively) netted back to the wellhead. Gas that is sold in European markets is analyzed at $6, $8, and $10 per Mcf ($212, $282. and $353 per Mcm, respectively). For Asia the selected natural gas prices are $8, $10, and $12 per Mcf ($282, $353, and $424 per Mcm, respectively), relying on long-term liquefied natural gas (LNG) contract prices.
We developed three cost scenarios to match the low, base, and high price cases for each region. For the base case scenario, we used costs prevailing in third quarter 2011 along with the respective natural gas price for each region. High and low cost scenarios were developed using IHS CERA’s proprietary Upstream Capital Costs Index and Operating Costs Index based on the outlook to 2018.
Ranking of Fiscal Systems
Rather than relying on one single measure, such as government take, to compare fiscal systems, IHS CERA uses an index that includes indicators of profitability, measures of fiscal system flexibility, revenue risk, and fiscal stability. Economic indicators such as net present value of a project’s cash flow, internal rate of return (IRR), the profit-to-investment ratio, the government take statistics, and other factors are not intended to be interpreted on a standalone basis. Since each indicator has its own limitations, it needs to be carefully interpreted to

Natural Gas and Ukraine’s Energy Future Ukraine Special Report
8-2 Chapter 8
© 2012 IHS No portion of this report may be reproduced, reused, or otherwise distributed in any form without prior written consent.
account for such limitations, i.e., the things they do not show. A combination of indicators is necessary for adequate comparison and assessment of fiscal systems.
This study compares fiscal systems based on three main indexes: fiscal terms, revenue risk, and fiscal stability.
Fiscal Terms Index
The fiscal terms index combines comparison of government take statistics with profitability indicators such as after-tax rate of return to investors and measures of capital efficiency such as profit-to-investment ratio, as well as measures of fiscal system neutrality (i.e., whether government take is progressive or regressive, or alternately remains stable with increases or declines in project profitability). Each of the four variables is assigned an equal weight of 25% (see Figure 8-1).
In a ranking of fiscal systems based on equal weighting of all four variables, the Ukraine deepwater fiscal system placed second-highest on the list—which is to say, second-worst from the perspective of investors—after Texas conventional gas, and Ukraine shallow gas ranked in seventh place. Analysis of government take shows that on average the take in Ukraine for both offshore gas—in both shallow and deep water—is higher than the worldwide average of 72%, at 78% and 80%, respectively. By itself this metric fails to reveal whether the system is attractive to investors. The average profit-to-investment ratio at a discount factor of 10% is 1.17, which means that for every dollar invested, the total value created is $1.17. In Ukraine PI is 1.07 for deepwater gas and 1.15 for shallow. The IRR indicator for shallow-water gas in Ukraine is 16% and for deepwater gas it is 14%, straddling the group’s average of 15%. With regard to progressivity/regressivity versus fiscal neutrality, Ukraine had the most regressive fiscal system.
A combination of low IRR, high government take, a highly regressive fiscal system is likely to result in loss of competitive edge for the Ukrainian E&P sector compared with that of Poland, which has the lowest (i.e., most attractive for investors) fiscal index of the group.
Figure 8-1
Fiscal Terms Index for Selected E&P Plays
0.00 1.00 2.00 3.00 4.00 5.00
Poland
British Columbia
Queensland CBM
Algeria
Indonesia CBM
Louisiana shale gas
Texas shale gas
Libya
Wyoming
Russia
Ukraine shallow water
Indonesia conventional gas
Venezuela
Alaska
Germany shale gas
Ukraine deep water
Texas conventional
Government Take
Profit-to-Investment Ratio
IRR
Progressivity/Regressivity
Source: IHS CERA.

Ukraine Special Report Natural Gas and Ukraine’s Energy Future
Chapter 8 8-3
© 2012 IHS No portion of this report may be reproduced, reused, or otherwise distributed in any form without prior written consent.
Revenue Risk Index
The revenue risk index analyzes the timing of revenue accruing to the government as a measure of risk sharing between resource owners and private investors. This index distinguishes between fiscal systems where the government bears relatively low revenue risk compared with investors and those where the government bears a larger share of the revenue risk (see Figure 8-2).
The revenue risk score indicates the share of total government revenue that was collected early on in the producing life of the field. To this end the revenue accruing to the government when the field reached one-quarter of its producing life was compared with the total revenue accruing to the government from each individual project (see Figure 8-3). The Ukrainian fiscal system is designed with numerous front-end–loaded levies that reduce significantly the government’s revenue risk. This risk allocation is largely because the Ukrainian fiscal system relies on a variety of front-end–loaded payments, such as signature bonuses, royalties, rentals, and severance and production taxes. Thus when the field reaches a quarter of its producing life, the government receives on average 45% of its total revenue from the respective field, leaving the investor very vulnerable to shifts in commodity prices throughout the project life.
Fiscal Stability Index
This last of our comparative indexes focuses on changes in fiscal terms over the past five years and assesses stability of fiscal terms on the basis of
Whether the change led to an increase or decline in government take
Whether the change applied to new investments or all investments
Figure 8-2
Revenue Risk Index for Selected E&P Plays
0.00 1.00 2.00 3.00 4.00 5.00 6.00
Texas conventional
Venezuela
Alaska
Russia
Wyoming
Ukraine deep water
Ukraine shallow water
Texas shale gas
Louisiana shale gas
Germany shale gas
Indonesia conventional gas
Algeria
Queensland CBM
Libya
Poland
Indonesia CBM
Revenue Risk Score
Source: IHS CERA.

Natural Gas and Ukraine’s Energy Future Ukraine Special Report
8-4 Chapter 8
© 2012 IHS No portion of this report may be reproduced, reused, or otherwise distributed in any form without prior written consent.
Figure 8-3
Share of Government Benefit at 25% of Field Life for Selected E&P Plays
The degree of the change, considering the percentage increase in government take
Frequency of the change (several jurisdictions changed the terms more than once during the past five years)
The results of this analysis are shown in Figure 8-4.
When considering where to invest, investors often consider the stability and predictability of the prevailing fiscal and regulatory environment. Stability affects the confidence of investors in government policy. A fiscal system that is subject to frequent change increases political risk and reduces the value investors put on future income streams. Oil price volatility has brought instability to oil and gas fiscal systems. The desire to capture the upside when commodity prices are high has resulted in a competitive race to increase government take and assert greater control over natural resources.
This fiscal stability index takes into account all the various measures introduced by governments around the globe and assigns risk scores from zero to five to each fiscal system depending on the type of change (increase versus decrease of the fiscal burden), the nature of change (application to future investments versus all investments or renegotiation of existing contracts), the degree of change, and the frequency of change.
Ukraine shows the highest degree of instability over the past five years, followed by Libya and Russia. The degree of change in government take has been the highest in Libya and Queensland for coalbed methane; it is not possible to estimate the degree of change for Ukraine at present because of limited data points.
0% 10% 20% 30% 40% 50% 60%
Texas conventional
Venezuela
Alaska
Russia
Wyoming
Ukraine deep water
Ukraine shallow water
Texas shale gas
Louisiana shale gas
Germany shale gas
Indonesia conventional gas
Algeria
Queensland CBM
Libya
Poland
Indonesia CBM
Share of Government Benefit at 25% of Producing Field Life
Source: IHS CERA.

Ukraine Special Report Natural Gas and Ukraine’s Energy Future
Chapter 8 8-5
© 2012 IHS No portion of this report may be reproduced, reused, or otherwise distributed in any form without prior written consent.
Figure 8-4
Fiscal Stability Score for Selected E&P Plays
Composite Index
To provide consistent comparison and ranking of government take, rate of return, profit-to-investment ratio, and progressivity/regressivity of fiscal systems with other factors such as risk of return and flexibility and stability of fiscal systems, we developed a relative rating and ranking system. The system assigned each variable a score of zero to five, where a score of five indicates a high government take, highly progressive or regressive fiscal system, low rate of return to investors, low profit-to-investment ratio, low risk of return to the government, and unstable fiscal terms. On the other end of the spectrum, a score of zero indicates low government take, high rates of return and profit-to-investment ratios, a neutral fiscal system, high risk of return to the government, and stable fiscal terms.
The composite index is a combination of the index of fiscal terms, revenue risk, and fiscal stability; it captures various dimensions of project economics and fiscal system competitiveness (see Figure 8-5). According to this composite index, Ukraine’s deepwater and shallow gas placed right next to each other at scores of 2.8 and 2.6, respectively, reflecting high government take (80% and 78%), low rates of return and profit-to-investment ratio, low revenue risk for the government, and somewhat unstable fiscal terms.
0.00 1.00 2.00 3.00 4.00 5.00
Libya
Russia
Queensland CBM
Alaska
Algeria
Ukraine deep water
Ukraine shallow water
Poland
Indonesia conventional gas
Fiscal Stability Score
Type of Change
Applicability of Change
Degree of Change
Frequency of Change
Source: IHS CERA. Note: British Columbia, Germany, Indonesia CBM, Louisiana, Texas, Venezuela gas, and Wyoming have zero scores and have not been presented in the chart
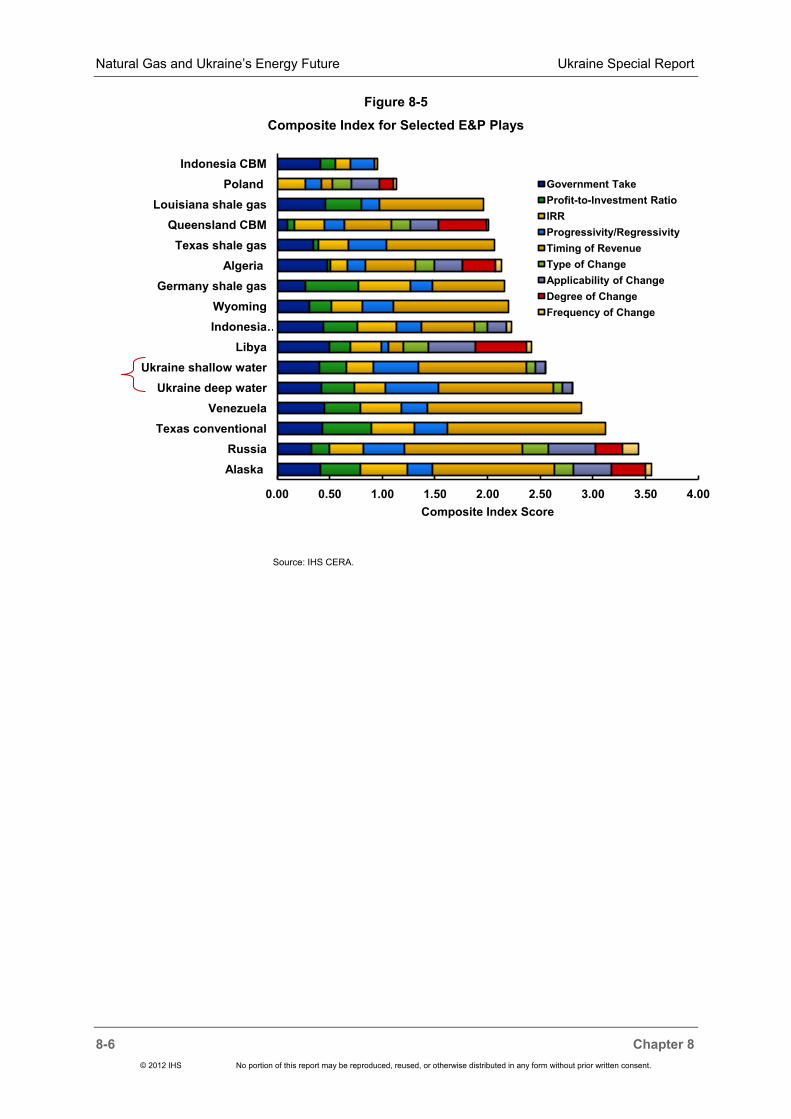
Natural Gas and Ukraine’s Energy Future Ukraine Special Report
8-6 Chapter 8
© 2012 IHS No portion of this report may be reproduced, reused, or otherwise distributed in any form without prior written consent.
Figure 8-5
Composite Index for Selected E&P Plays
0.00 0.50 1.00 1.50 2.00 2.50 3.00 3.50 4.00
Alaska
Russia
Texas conventional
Venezuela
Ukraine deep water
Ukraine shallow water
Libya
Indonesia …
Wyoming
Germany shale gas
Algeria
Texas shale gas
Queensland CBM
Louisiana shale gas
Poland
Indonesia CBM
Composite Index Score
Government Take
Profit-to-Investment Ratio
IRR
Progressivity/Regressivity
Timing of Revenue
Type of Change
Applicability of Change
Degree of Change
Frequency of Change
Source: IHS CERA.

Ukraine Special Report Natural Gas and Ukraine‘s Energy Future
Appendix A-1
© 2012 IHS No portion of this report may be reproduced, reused, or otherwise distributed in any form without prior written consent.
APPENDIX: LIST OF REGULATORY RECOMMENDATIONS
Introduction
The recommendations presented in this appendix are based on IHS CERA’s own research as well as discussions held during and following Ukraine Policy Dialogue Workshops 1 and 2 among sponsoring international oil and gas companies, the legal firm B.C. Toms & Co., and representatives of Ukrainian government. They are proposed for review and consideration by the Ukrainian government in order to improve existing Ukrainian legislation, policies, and practices, thereby strengthening interest of potential investors in investing in the development of Ukraine’s energy resources. There is a special emphasis placed on unconventional resources, in line with the Ukrainian Energy Strategy.
This list of recommendations represents a snapshot of key issues identified during the Ukraine Policy Dialogue initiative and does not represent a comprehensive review and analysis of Ukrainian legislation. Additional review of legal and regulatory legal acts of Ukraine would be required in order to produce a comprehensive examination of legislation.
The majority of IHS CERA recommendations are summarized below under the following headings:
Subsoil Regime as enforced by Subsoil Code No. 132/94-VR dated July, 27, 1994,
with further amendments (Subsoil Code) and Law on Oil and Gas No. 2665-III
dated July 12, 2001, with further amendments (Oil and Gas Law)
PSA Regime as enforced by the Law on Production Sharing Agreement No. 1039-XIV dated September 14, 1999, with further amendments (pursuant to which the
Subsoil Regime is also used) (PSA Law)
Difficult (unconventional) resources
Functioning of Natural Gas Market, as enforced by the Law on Natural Gas Market Functioning, No. 2467-VI dated July 8, 2010, with further amendments
(Natural Gas Market Law)
Tax regulations
Other recommendations
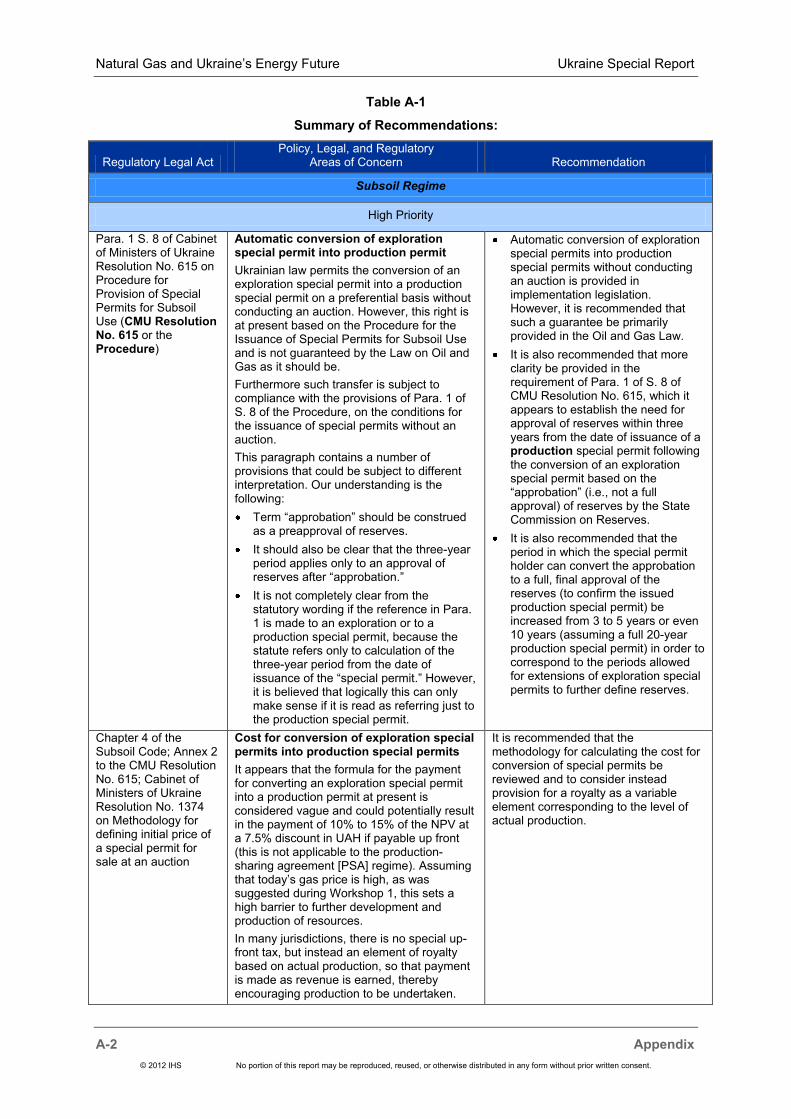
Natural Gas and Ukraine‘s Energy Future Ukraine Special Report
A-2 Appendix
© 2012 IHS No portion of this report may be reproduced, reused, or otherwise distributed in any form without prior written consent.
Table A-1
Summary of Recommendations:
Regulatory Legal Act Policy, Legal, and Regulatory
Areas of Concern Recommendation
Subsoil Regime
High Priority
Para. 1 S. 8 of Cabinet of Ministers of Ukraine Resolution No. 615 on Procedure for Provision of Special Permits for Subsoil Use (CMU Resolution No. 615 or the Procedure)
Automatic conversion of exploration special permit into production permit
Ukrainian law permits the conversion of an exploration special permit into a production special permit on a preferential basis without conducting an auction. However, this right is at present based on the Procedure for the Issuance of Special Permits for Subsoil Use and is not guaranteed by the Law on Oil and Gas as it should be.
Furthermore such transfer is subject to compliance with the provisions of Para. 1 of S. 8 of the Procedure, on the conditions for the issuance of special permits without an auction.
This paragraph contains a number of provisions that could be subject to different interpretation. Our understanding is the following:
Term ―approbation‖ should be construed as a preapproval of reserves.
It should also be clear that the three-year period applies only to an approval of reserves after ―approbation.‖
It is not completely clear from the statutory wording if the reference in Para. 1 is made to an exploration or to a production special permit, because the statute refers only to calculation of the three-year period from the date of issuance of the ―special permit.‖ However, it is believed that logically this can only make sense if it is read as referring just to the production special permit.
Automatic conversion of exploration special permits into production special permits without conducting an auction is provided in implementation legislation. However, it is recommended that such a guarantee be primarily provided in the Oil and Gas Law.
It is also recommended that more clarity be provided in the requirement of Para. 1 of S. 8 of CMU Resolution No. 615, which it appears to establish the need for approval of reserves within three years from the date of issuance of a production special permit following the conversion of an exploration special permit based on the ―approbation‖ (i.e., not a full approval) of reserves by the State Commission on Reserves.
It is also recommended that the period in which the special permit holder can convert the approbation to a full, final approval of the reserves (to confirm the issued production special permit) be increased from 3 to 5 years or even 10 years (assuming a full 20-year production special permit) in order to correspond to the periods allowed for extensions of exploration special permits to further define reserves.
Chapter 4 of the Subsoil Code; Annex 2 to the CMU Resolution No. 615; Cabinet of Ministers of Ukraine Resolution No. 1374 on Methodology for defining initial price of a special permit for sale at an auction
Cost for conversion of exploration special permits into production special permits
It appears that the formula for the payment for converting an exploration special permit into a production permit at present is considered vague and could potentially result in the payment of 10% to 15% of the NPV at a 7.5% discount in UAH if payable up front (this is not applicable to the production-sharing agreement [PSA] regime). Assuming that today‘s gas price is high, as was suggested during Workshop 1, this sets a high barrier to further development and production of resources.
In many jurisdictions, there is no special up-front tax, but instead an element of royalty based on actual production, so that payment is made as revenue is earned, thereby encouraging production to be undertaken.
It is recommended that the methodology for calculating the cost for conversion of special permits be reviewed and to consider instead provision for a royalty as a variable element corresponding to the level of actual production.

Ukraine Special Report Natural Gas and Ukraine‘s Energy Future
Appendix A-3
© 2012 IHS No portion of this report may be reproduced, reused, or otherwise distributed in any form without prior written consent.
Regulatory Legal Act Policy, Legal, and Regulatory
Areas of Concern Recommendation
Art. 17 of the Oil and Gas Law
Duration of special permits
The duration of a special permit as currently established by legislation does not appear long enough for development of unconventional resources.
Furthermore, the duration of a combined exploration and production special permit appears to always be shorter than the duration of individual special permits given separately for exploration and production.
In Romania, for example, concession agreements are concluded for 30 years onshore, with the possibility to extend for 15 years and up to a maximum of 49 years. In Bulgaria, the maximum term of concession agreements is 35 years, with the option for extension up to 15 years. In the United Kingdom, the Petroleum Exploration and Development Licence expires after 31 years.
It is recommended that the maximum ceiling for the duration of separate special permits for exploration and production be reviewed, taking into account the specifics of unconventional gas and to consider increasing their duration to reflect best practices, where unconventional gas is the principal object, without limiting the recovery of other hydrocarbons. Further analysis should determine optimal time for special permit duration.
It is also recommended to consider extending the maximum term of a combined exploration and production special permit to not less than the combined duration of the separate special permits for exploration and production, taking into account, where relevant, the specifics for the development of unconventional resources.
Para. 5 Art. 19 of the Oil and Gas Law
Acreage size
The maximum acreage for exploration and production is currently limited by legislation to 500 square kilometers (sq km) onshore and 1,000 sq km offshore.
In Poland onshore acreage appears to be limited to 1,200 sq km per one license. In Romania, contract areas typically range between 1,000 sq km and 5,000 sq km, although it was reported that significantly larger areas have been awarded in the past. In the United States, the acreage sizes for shale gas development vary widely across and between the plays, with reported acreage of up to 3,642 sq km.
It is recommended that the acreage for exploration and production of resources be generally increased, in particular to take into account applicable exploration and production methods and best practices in neighboring countries as well as the specifics of unconventional resources development, to maintain attractiveness of investments for potential players.
The acreage size should take into account the specifics of shale gas exploration and production.

Natural Gas and Ukraine‘s Energy Future Ukraine Special Report
A-4 Appendix
© 2012 IHS No portion of this report may be reproduced, reused, or otherwise distributed in any form without prior written consent.
Regulatory Legal Act Policy, Legal, and Regulatory
Areas of Concern Recommendation
Art. 14 of the Oil and Gas Law; Item 5, S. 17 of the Resolution No. 615
The legality of joint activity agreements (JAAs) in Ukraine
Article 14 of the Oil and Gas Law expressly prohibits the holder of a special permit for oil and gas subsoil use from contributing its rights to the charter capital of a company established with the participation of the permit holder or as a contribution to a joint activity. On the other hand, Article 49 of the Oil and Gas Law provides that if a joint activity related to oil and gas subsoil use is performed under the terms of an agreement on joint investment activity, joint production or joint cooperation, one of the parties should hold a special permit for oil and gas subsoil use. The seeming conflict between these provisions has not been resolved.
Furthermore, Item 5 of S. 17 of CMU Resolution No. 615 on the procedure for granting subsoil use rights stipulates that if a special permit holder establishes a new company, the latter may continue to operate on the basis of the previously granted special permit, provided that the special permit holder transfers to the new company all assets required to perform the activities under the special permit. The holder must own at least 50% of the new company. If the above-mentioned conditions are met, the necessary amendments can be made to the special permit.
It is recommended that the government‘s position should be clarified on the legality of JAAs to ensure their recognition and consistent treatment, including with taxation. It is recommended that Art. 14 of the Oil and Gas Law be revised to expressly allow the transfer of special permits to joint venture (JV) companies and as a contribution to JAAs.
It is also recommended that the requirements of Art. 14 of the Oil and Gas Law be aligned with provisions of Item 5 of S. 17 of CMU Resolution No. 615 to expressly allow the transfer of a subsoil permit to an affiliate company.
S. 7 of the Cabinet of Ministers of Ukraine Resolution No. 594 on Auction Procedure for Sale of Special Permits for Subsoil Use (CMU Resolution No. 594)
Time for submitting application documents for an auction
Potential participants are required to submit an application form and documentation within 15 days of the auction notice being published. This appears to provide insufficient time for potential auction participants to prepare an adequate package of documents.
In Norway, the United Kingdom, and Poland, for example, the time period allowed for submitting applications is not less than 90 days.
It is recommended that these requirements should be amended, and the allowed time for submitting documents to participate in an auction be extended to at least 60 days.
Based on the practices established in some countries, another recommendation is to consider publishing an annual auction schedule on the website of the competent authority, to be revised quarterly or as soon as changes occur, so all interested parties have access to this information, which might be very helpful in the preparation for auctions.

Ukraine Special Report Natural Gas and Ukraine‘s Energy Future
Appendix A-5
© 2012 IHS No portion of this report may be reproduced, reused, or otherwise distributed in any form without prior written consent.
Regulatory Legal Act Policy, Legal, and Regulatory
Areas of Concern Recommendation
NA Legality of earlier issued special permits
In conducting due diligence on Ukrainian oil and gas companies regarding investments and loans from Western companies and banks, possible issues often arise with how special permits have been issued and the authorizations for execution of relevant agreements have been conducted, such as when the act earlier delegating signature authority for a license agreement cannot now be found. Many Ukrainian oil and gas activities are subject to such technical problems, which while not preventing operations by the Ukrainian party as a practical matter, inhibit Western investors, lenders and JV partners from providing funding. Thus, such problems are a limiting factor for oil and gas development in much of Ukraine.
Unfortunately, even where a Ukrainian operator has spent years and large sums to develop a field, if such possible problems arise during a Western party‘s due diligence, there is no mechanism under Ukrainian law to definitively cure or provide other reassurance on such issues. Court proceedings can sometimes help, but even if a case is resolved positively, there may remain the technical possibility that another entity could later bring the same claim again, which, in view of foreign concerns about the risk of inconsistent results in Ukrainian court proceedings, means that victories in court may not sufficiently reassure Western investors and lenders.
Where very large amounts are involved, as is typically the case for oil and gas projects, Western investors need legal certainty so that the projects can be evaluated based purely on geological/technical risk. The legal risk from such past technical issues is a significant obstacle to the development of much of the Ukrainian territory.
It is recommended that this issue be addressed. A potential solution would be to adopt by statute a limited mechanism that allows such problems to be definitively solved. Such a solution would result from the following concept being adopted into law:
Where a legal issue possibly exists concerning the prior issuance of a special permit or the execution of an Agreement on the Terms from Subsoil Use (Subsoil Use Agreement) or a PSA, and the circumstances resulting in such issue arose 18 months previously, then the State Geological and Subsoil Service of Ukraine shall have the power definitely to eliminate the issues by confirming the validity of the special permit or of the state authorization of the execution of the subsoil use agreement or PSA through promulgating an Act. This would be subject in each case to Cabinet of Ministers‘ ratification of such confirmation, or if the issue was previously decided in favor of confirming the special permit or the execution of the subsoil use agreement or PSA in any litigation brought by any state party in a Ukrainian court having jurisdiction over the parties; only if there is no outstanding litigation (including any appeals) concerning the special permit, subsoil use agreement or PSA.
S.6 of the Resolution of the Cabinet of Ministers No. 594 on Auction Procedure for Sale of Special Permits for Subsoil Use
Approval time for potential blocks for an auction
The auction procedure does not specify whether requests for the approval of potential blocks are sent to various authorities for simultaneous approval within 30 days or whether the review by one authority depends on the decisions taken by another authority. Therefore, the entire approval time for potential blocks for an auction appears to be lengthy. Furthermore, the resolution is silent on when an application for putting an area up for auction should be considered. The resolution does not impose any time constraints on the approval process.
It is recommended that authorities define a maximum period of time required for inclusion of potential blocks for an auction and that this be limited to no more than 60 days.

Natural Gas and Ukraine‘s Energy Future Ukraine Special Report
A-6 Appendix
© 2012 IHS No portion of this report may be reproduced, reused, or otherwise distributed in any form without prior written consent.
Regulatory Legal Act Policy, Legal, and Regulatory
Areas of Concern Recommendation
Medium Priority
Art. 30 of the Oil and Gas Law
Geological exploration in the permit area of oil and gas producer
Art. 30 of the Oil and Gas Law stipulates that the state can ask the subsoil user conducting oil and gas production to undertake geological exploration. If the subsoil user refuses to undertake the requested work, the Central Executive Authority for geologic exploration can instigate a bidding process for such exploration, including pilot production on the special permit area.
It is recommended that Art. 30 be reviewed and amended to protect special permit holder rights granted in line with legislation for the contract area.
Art. 13 of the Oil and Gas Law; S. 4, 5 Cabinet Resolution No. 615 on Procedure for Provision of Special Permits for Subsoil Use
Issue of combined exploration and production special permits
Despite their availability under legislation, it appears to be uncommon under current special permit issuance practices to offer combined special permits for exploration and production, as the requirements to apply for this special permit mirror those for a production special permit, which are usually difficult to satisfy at the outset.
Furthermore, the application of S. 4 of CMU Resolution No. 615 is unclear regarding applications for combined exploration and production special permits.
In some jurisdictions,such as the United Kingdom, Russia, Kazakhstan, and elsewhere, the option of issuing combined permits for both exploration and production is established in legislation and widely applied. It is therefore recommended that where practical, a combined exploration and production permit should be made available for the development of energy resources, based on exploration criteria. The applicant also should also have to demonstrate its capabilities for carrying out production activity, and within a five-year period (subject to extensions as for exploration special permits), meet the requirements for production licenses by filing data on estimated reserves and achieving other targets.
Clarity in CMU Resolution No. 615 is required on whether the S.4 requirement only applies to the issuance of separate special permits for production, in particular to confirm that it should not prevent the issuance of combined special permits for exploration and production.
Art. 5, S.2 Point 18.L of the Law on the Management of State Assets No. 185-V dated 21 September 2006 (Law on the Management of State Assets)
Procedure for the conclusion of JAAs with state-owned companies
The Cabinet of Ministers is empowered to determine the procedure for state-controlled companies to enter into a JAA. However, such a procedure does not appear to exist, making the process not transparent.
It is recommended that secondary legislation be adopted to establish procedures for state-controlled companies to enter into a JAA. Such procedures should be clear and transparent.

Ukraine Special Report Natural Gas and Ukraine‘s Energy Future
Appendix A-7
© 2012 IHS No portion of this report may be reproduced, reused, or otherwise distributed in any form without prior written consent.
Regulatory Legal Act Policy, Legal, and Regulatory
Areas of Concern Recommendation
Art. 25 and 27 of the Oil and Gas Law
Late adoption of regulations on the provision of special permits
Previously, resolutions on the procedure for allocating special permits and for extending them were adopted with considerable delay. These oil and gas procedures also adopted for only one calendar year at a time. Consequently, the oil and gas industry has often had to function without a subsoil procedure in place,, including last year when the relevant regulation was only passed on May 30, 2011, five months after the previous 2010 regulation ceased to be effective. In these circumstances, some special permits, for which extensions had been applied for in time, expired without being extended because of the absence of a new procedure. Although the 2011 Regulation No. 615 considerably minimizes the risk for the future, as it will function in 2011 and thereafter until it is amended, the issue should be resolved for those special permits that were extended in the past after their expiration.
It is recommended tnat Art. 27 of Oil and Gas Law be amended to confirm the validity of the past extension of special permits (when applied for in time)that had expired before their extension because of the lack of an appropriate CMU resolution or other delay caused by the state.
S. 8 of the Cabinet of Ministers Resolution No. 594 on Auction Procedure for Sale of Special Permits for Subsoil Use; Art. 13 of the Subsoil Code
Documents that foreign legal entities are required to submit to participate in an auction for the sale of special permits
The Subsoil Code in Art. 13 provides that foreign companies and individuals can be subsoil users.
At the same time, in line with S. 8 of CMU Resolution No. 549, in order for a foreign applicant to participate in an auction for subsoil special permits, among the documents required is an extract from the Uniform State Register of Legal Entities and Individual Entrepreneurs and the EDRPOU code. It is understood that such code cannot be assigned to a foreign company.
It is therefore recommended that the auction procedure be clarified and amended to clearly state that foreign entities can participate in auctions/tenders for special permits and are exempt from requirements that solely apply to companies established in Ukraine‘ and in particular to state expressly that foreign companies can provide documents evidencing their foreign registration, including any registration number.
Art. 26 of the Oil and Gas Law; Art. 26 of the Subsoil Code
Suspension and cancellation of special permits
Some provisions within the legal framework covering suspension and cancellation of special permits are loosely defined. For example, cancellation or suspension can occur for any violation of the special permit terms, for threats to the health of workers and for causing ―negative influences‖ to the subsoil or environmental pollution.
It is recommended that such conditions should have materiality criteria, both before a suspension or termination can occur, and to further define vague terminology (e.g., ―negative influences‖ should be more precisely defined).
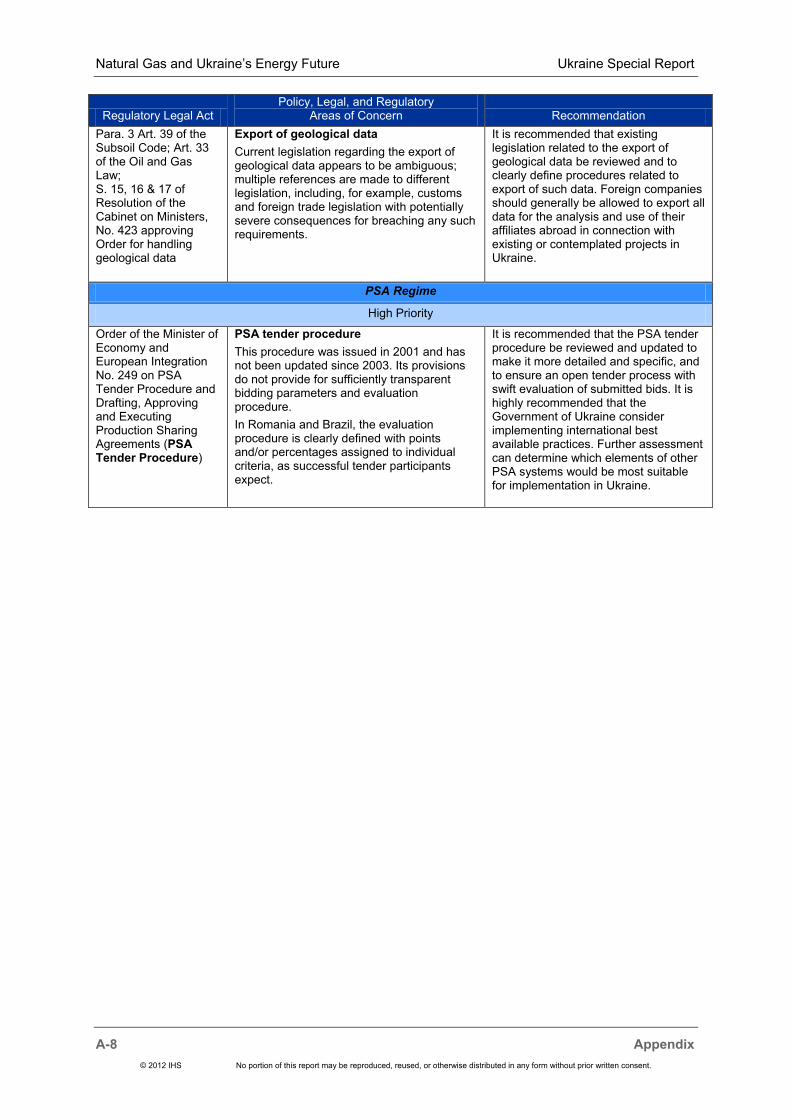
Natural Gas and Ukraine‘s Energy Future Ukraine Special Report
A-8 Appendix
© 2012 IHS No portion of this report may be reproduced, reused, or otherwise distributed in any form without prior written consent.
Regulatory Legal Act Policy, Legal, and Regulatory
Areas of Concern Recommendation
Para. 3 Art. 39 of the Subsoil Code; Art. 33 of the Oil and Gas Law; S. 15, 16 & 17 of Resolution of the Cabinet on Ministers, No. 423 approving Order for handling geological data
Export of geological data
Current legislation regarding the export of geological data appears to be ambiguous; multiple references are made to different legislation, including, for example, customs and foreign trade legislation with potentially severe consequences for breaching any such requirements.
It is recommended that existing legislation related to the export of geological data be reviewed and to clearly define procedures related to export of such data. Foreign companies should generally be allowed to export all data for the analysis and use of their affiliates abroad in connection with existing or contemplated projects in Ukraine.
PSA Regime
High Priority
Order of the Minister of Economy and European Integration No. 249 on PSA Tender Procedure and Drafting, Approving and Executing Production Sharing Agreements (PSA Tender Procedure)
PSA tender procedure
This procedure was issued in 2001 and has not been updated since 2003. Its provisions do not provide for sufficiently transparent bidding parameters and evaluation procedure.
In Romania and Brazil, the evaluation procedure is clearly defined with points and/or percentages assigned to individual criteria, as successful tender participants expect.
It is recommended that the PSA tender procedure be reviewed and updated to make it more detailed and specific, and to ensure an open tender process with swift evaluation of submitted bids. It is highly recommended that the Government of Ukraine consider implementing international best available practices. Further assessment can determine which elements of other PSA systems would be most suitable for implementation in Ukraine.

Ukraine Special Report Natural Gas and Ukraine‘s Energy Future
Appendix A-9
© 2012 IHS No portion of this report may be reproduced, reused, or otherwise distributed in any form without prior written consent.
Regulatory Legal Act Policy, Legal, and Regulatory
Areas of Concern Recommendation
Art. 6 of the PSA Law; Art. 10 of Law of Ukraine ―On the Condemnation of Land Plots, Other Subjects of Real Estate Which are Placed on Them, Which are Private Property, for Public Needs or as Motivated by Public Necessity‖ (Expropriation Law)
Land required for PSA
The current wording of the PSA Law may lead the state authorities to acquire land falling within a PSA area that the PSA tender winner does not agree with and which could have an adverse effect on the investors‘ access to such land.
According to Article 6 of the PSA Law:―subsoil areas shall be provided for use together with the land belonging to state or communal property. If land that is required for subsoil use under production-sharing agreements is owned by individuals or legal entities or belongs to communal ownership, acquisition of the ownership to such land is carried out by the state ‗according to the law‘.‖
Article 10 of the Expropriation Law states that state executive authorities or local self-governmental bodies; the special administrations for the management of the areas and objects belonging to the reserved areas; persons who have obtained a special permit for subsoil use; and certain companies engaged in construction, repair, reconstruction, operation of the objects of transport and energy infrastructure and who have agreed the location of such, can initiate the process for seizure of land. And in response to such a proposal, the relevant executive authority or local self-governmental body must within one month of receiving of such proposal (including if made themselves) make a decision concerning the purchase of land, buildings, and other real estate located on it, for such public needs.
Thus, there is a risk that a PSA area might be acquired by the state against the wishes of the PSA tender winner, for example expropriating land from private owners (and the farmers leasing from them) who might have already agreed to make such land available to the oil and gas companies on reasonable terms. The oil and gas companies involved might then find themselves faced with delays and/or state lessors requiring much greater amounts as land rental.
It is recommended that provisions of Article 6 of the PSA Law be amended so that (1) notwithstanding Article 10 of the Expropriation Law, the purchase/expropriation of land under Ukrainian law (including under the Expropriation Law) for subsoil use within a PSA area could only be requested by the winner of the relevant PSA tender, and (2) to replace the cited words, that the ―acquisition of the ownership to such land is carried out by the state according to the law‖ by the ―acquisition of the ownership to such land can be carried out by the state according to the law and only upon the request of the PSA tender winner.‖
Similar conforming changes should be made to the Expropriation Law.
Medium Priority
S. 4 Art. 7 of the PSA Law
Time for submission of application documents for a tender
According with the current revision of the PSA Law, a potential tender participant should be given not less than 30 days to submit an application for participation in a tender, once information about the tender is published. This period was reduced from ―not less than 90 days,‖ the norm to June 2011, but is usually insufficient to allow potential tender participants to prepare applications and adequate packages of supporting documents.
It is recommended that these requirements be amended and the time permitted to submit documents for participation in a tender to be extended to be not less than 60, and preferably 90, days.

Natural Gas and Ukraine‘s Energy Future Ukraine Special Report
A-10 Appendix
© 2012 IHS No portion of this report may be reproduced, reused, or otherwise distributed in any form without prior written consent.
Regulatory Legal Act Policy, Legal, and Regulatory
Areas of Concern Recommendation
Order of the Minister of Economy No. 278/969 on temporary methodology for calculation of balance of interests of the state and investors in concluding PSA
The calculation of the balance of interests document for a PSA
This methodology appears to establish some economic calculations as a basis for a PSA profit share split. It is not clear whether the government adopted the methodology to negotiate PSA terms or instead to impose profitability calculations on potential investors in a PSA framework.
It is recommended that the procedure‘s purpose be clarified in this document and confirm that it does not set requirements on the calculation of profitability by investors.
Low Priority
Para 2. Art. 18 of the PSA Law
Title to equipment
Title to equipment and certain property under a PSA is passed to the state, where the cost has been covered by Cost Compensation Production; but the PSA Law is somewhat vague on the inventor‘s right thereafter to use the property.
It is recommended that the PSA law be revised to make clear that the investor has the right to use such property on reasonable terms until the PSA is terminated.
Specifics of Difficult (Unconventional) resources
High Priority
NA Special procedure and methodology for calculating the cost for a special permit for difficult (unconventional) gas
At present, there appears to be no mechanisms for the calculation of special permit costs for either subsoil or PSA regimes for difficult resources.
It is recommended that special methodology be considered for the calculating the cost of special permits for difficult resources, which would address the limited understanding on the development of such resources in Ukraine and the associated high levels of investment risk compared with the development of conventional resources, and that these uncertainties be reflected in the special permit prices.
Law on Coal Bed Methane, Oil and Gas Law
Relationship of Law on Coal Bed Methane (CBM) to other legislation concerning the exploration and production of hydrocarbons
It appears that the Law on CBM does not treat CBM and natural gas as the same; the Oil and Gas Law makes no references to CBM, thus making CBM and natural gas subject to potentially separate regulation. This could potentially lead to licensing issues where CBM and other forms of natural gas are to be exploited in the same area.
It is recommended that this legislation on the exploration and production of hydrocarbons be amended to ensure consistency among the acts of legislation covering natural gas and CBM and to avoid any potential issues related to licensing.
In particular, there should be no restriction on the production of associated hydrocarbons by a project falling under the Law on CBM.
Medium Priority
NA Classification of difficult (unconventional) gas resources
During the workshop, discussions took place on the possibility of introducing classifications that will distinguish conventional from difficult (unconventional) resources and enable the introduction of a special permit for the exploration and production of such resources.
At present, shale gas is included in the list of minerals for which a special permit may be granted. (Shale gas is at present defined as a regular mineral, and the regular rules for methodology apply.)
It is recommended that in classifying difficult resouces, the purpose and reasons for the classification are clearly defined so that it will not limit the licensees‘ rights under special permits. Subsoil special permit rights should always be granted for all types of hydrocarbons (oil, gas, and condensate) regardless of their origin and trapping mechanism.
Functioning of the Natural Gas Market
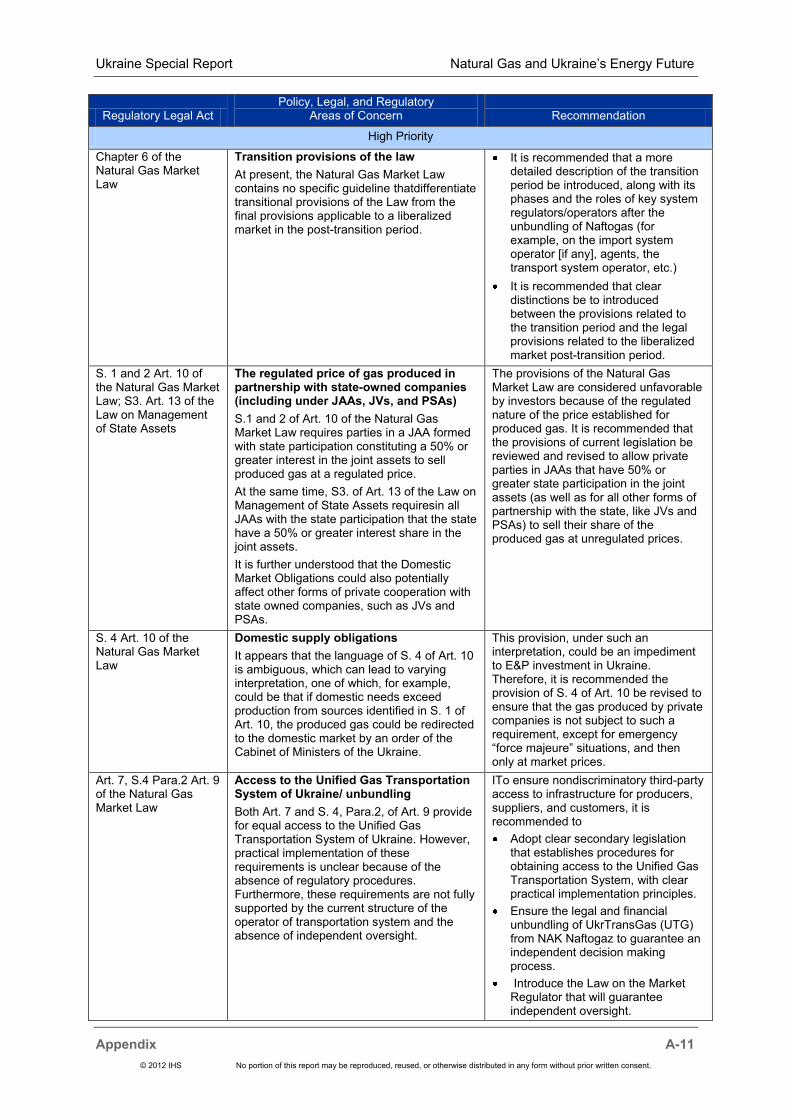
Ukraine Special Report Natural Gas and Ukraine‘s Energy Future
Appendix A-11
© 2012 IHS No portion of this report may be reproduced, reused, or otherwise distributed in any form without prior written consent.
Regulatory Legal Act Policy, Legal, and Regulatory
Areas of Concern Recommendation
High Priority
Chapter 6 of the Natural Gas Market Law
Transition provisions of the law
At present, the Natural Gas Market Law contains no specific guideline thatdifferentiate transitional provisions of the Law from the final provisions applicable to a liberalized market in the post-transition period.
It is recommended that a more detailed description of the transition period be introduced, along with its phases and the roles of key system regulators/operators after the unbundling of Naftogas (for example, on the import system operator [if any], agents, the transport system operator, etc.)
It is recommended that clear distinctions be to introduced between the provisions related to the transition period and the legal provisions related to the liberalized market post-transition period.
S. 1 and 2 Art. 10 of the Natural Gas Market Law; S3. Art. 13 of the Law on Management of State Assets
The regulated price of gas produced in partnership with state-owned companies (including under JAAs, JVs, and PSAs)
S.1 and 2 of Art. 10 of the Natural Gas Market Law requires parties in a JAA formed with state participation constituting a 50% or greater interest in the joint assets to sell produced gas at a regulated price.
At the same time, S3. of Art. 13 of the Law on Management of State Assets requiresin all JAAs with the state participation that the state have a 50% or greater interest share in the joint assets.
It is further understood that the Domestic Market Obligations could also potentially affect other forms of private cooperation with state owned companies, such as JVs and PSAs.
The provisions of the Natural Gas Market Law are considered unfavorable by investors because of the regulated nature of the price established for produced gas. It is recommended that the provisions of current legislation be reviewed and revised to allow private parties in JAAs that have 50% or greater state participation in the joint assets (as well as for all other forms of partnership with the state, like JVs and PSAs) to sell their share of the produced gas at unregulated prices.
S. 4 Art. 10 of the Natural Gas Market Law
Domestic supply obligations
It appears that the language of S. 4 of Art. 10 is ambiguous, which can lead to varying interpretation, one of which, for example, could be that if domestic needs exceed production from sources identified in S. 1 of Art. 10, the produced gas could be redirected to the domestic market by an order of the Cabinet of Ministers of the Ukraine.
This provision, under such an interpretation, could be an impediment to E&P investment in Ukraine. Therefore, it is recommended the provision of S. 4 of Art. 10 be revised to ensure that the gas produced by private companies is not subject to such a requirement, except for emergency ―force majeure‖ situations, and then only at market prices.
Art. 7, S.4 Para.2 Art. 9 of the Natural Gas Market Law
Access to the Unified Gas Transportation System of Ukraine/ unbundling
Both Art. 7 and S. 4, Para.2, of Art. 9 provide for equal access to the Unified Gas Transportation System of Ukraine. However, practical implementation of these requirements is unclear because of the absence of regulatory procedures. Furthermore, these requirements are not fully supported by the current structure of the operator of transportation system and the absence of independent oversight.
ITo ensure nondiscriminatory third-party access to infrastructure for producers, suppliers, and customers, it is recommended to
Adopt clear secondary legislation that establishes procedures for obtaining access to the Unified Gas Transportation System, with clear practical implementation principles.
Ensure the legal and financial unbundling of UkrTransGas (UTG) from NAK Naftogaz to guarantee an independent decision making process.
Introduce the Law on the Market Regulator that will guarantee independent oversight.

Natural Gas and Ukraine‘s Energy Future Ukraine Special Report
A-12 Appendix
© 2012 IHS No portion of this report may be reproduced, reused, or otherwise distributed in any form without prior written consent.
Regulatory Legal Act Policy, Legal, and Regulatory
Areas of Concern Recommendation
Art. 22 S. 2, Point 3 of the Natural Gas Market Law
Obligations of gas producers to submit cost information to NERC
Currently t gas procedures must submit to NERC information on the cost of produced gas, rental payments, and volume of produced gas planned for next year.
This requirement is considered a strongly disincentive to investment in new upstream gas production. If gas prices are to be commercially negotiated, as confirmed in Art. 22 of S.1 Point 2, then the requirement that gas producers provide the State Regulator (NERC) with their costs of production, rental fees, etc. is unclear, as such business information is considered confidential.
It is therefore recommended Article 22 of S. 2, Point 3 be amended and brought into compliance with EU directives.
Interpretation of this requirement might imply that NERC will set a ―cost-plus‖ type regime for domestic gas prices; but this is not a common practice in open, deregulated gas markets around the world, and it does not conform to the principles and requirements of 2003/55/EC (EU Second Gas Directive).
Where this requirement is only applicable to producers subject to Art. 10 of the Law, amendments are also required to clarify this requirement.
S 6. Art. 10 of the Natural Gas Market Law
Rights to export produced gas
Although it appears to be implied in the Natural Gas Market Law and is not explicitly prohibited, there no specific requirements in this law confirming the rights of companies to export produced gas.
It is recommended that an additional statement be introduced in the Natural Gas Market Law specifying that, with the exception of the conditions imposed in Article 10, Point 4, producers within Ukraine are permitted to export their production. Any secondary legislation (regulations) on import/export rules should be brought into compliance with this right to export.
Medium Priority
Art. 16 of the Law Natural Gas Market Law
Unbundling activities on the transportation, distribution, and supply of natural gas
The requirement in this Article appears to need to be modified to be brought into compliance with the new requirements imposed by the EU Third Legislative Package (passed September 3, 2009, which became effective on March 3, 2011) and not only those of the Second Gas Directive (2003/55/EC).
Point 6 states that the terms of Article 16 do not apply to ―small-scale gas distribution and gas supply companies‖; the size of these entities needs to be defined.
It is recommended in due course Art. 16 be amended to bring it into compliance with the EU Third Legislative Package.
It is recommended that the size of small gas distribution and gas supply companies be defined for the exemptions in Art. 16 of the Law Natural Gas Market Law.
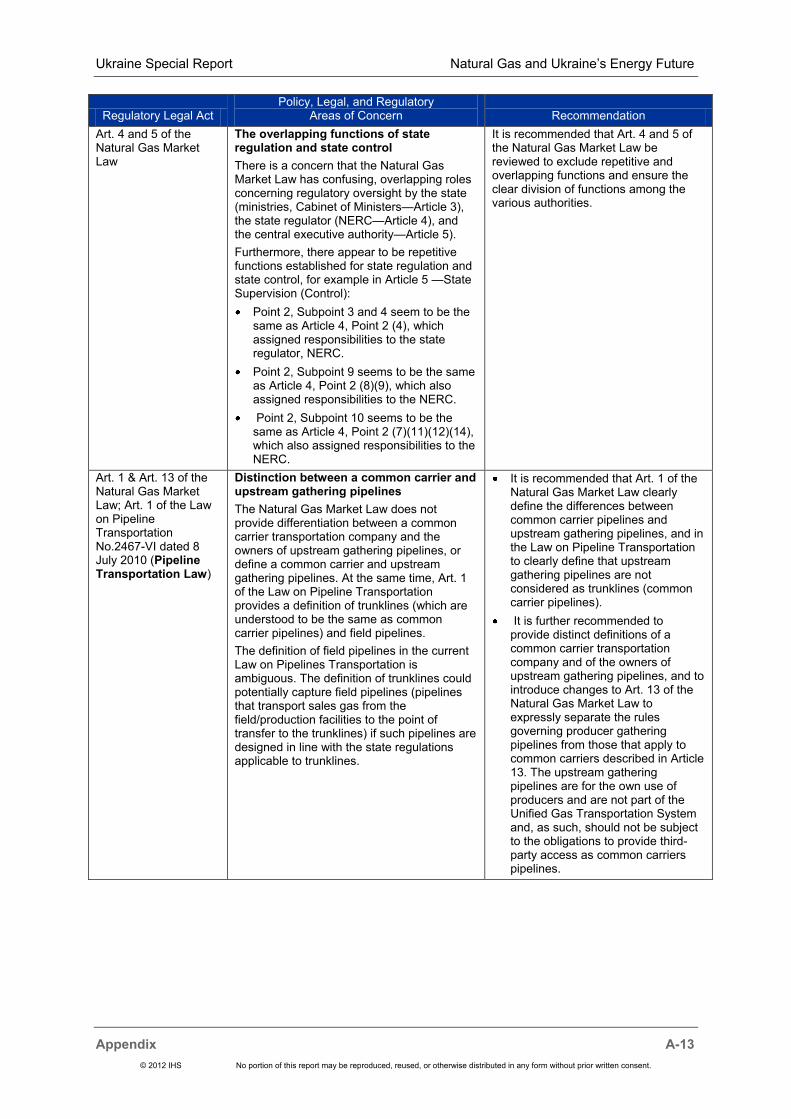
Ukraine Special Report Natural Gas and Ukraine‘s Energy Future
Appendix A-13
© 2012 IHS No portion of this report may be reproduced, reused, or otherwise distributed in any form without prior written consent.
Regulatory Legal Act Policy, Legal, and Regulatory
Areas of Concern Recommendation
Art. 4 and 5 of the Natural Gas Market Law
The overlapping functions of state regulation and state control
There is a concern that the Natural Gas Market Law has confusing, overlapping roles concerning regulatory oversight by the state (ministries, Cabinet of Ministers—Article 3), the state regulator (NERC—Article 4), and the central executive authority—Article 5).
Furthermore, there appear to be repetitive functions established for state regulation and state control, for example in Article 5 —State Supervision (Control):
Point 2, Subpoint 3 and 4 seem to be the same as Article 4, Point 2 (4), which assigned responsibilities to the state regulator, NERC.
Point 2, Subpoint 9 seems to be the same as Article 4, Point 2 (8)(9), which also assigned responsibilities to the NERC.
Point 2, Subpoint 10 seems to be the same as Article 4, Point 2 (7)(11)(12)(14), which also assigned responsibilities to the NERC.
It is recommended that Art. 4 and 5 of the Natural Gas Market Law be reviewed to exclude repetitive and overlapping functions and ensure the clear division of functions among the various authorities.
Art. 1 & Art. 13 of the Natural Gas Market Law; Art. 1 of the Law on Pipeline Transportation No.2467-VI dated 8 July 2010 (Pipeline Transportation Law)
Distinction between a common carrier and upstream gathering pipelines
The Natural Gas Market Law does not provide differentiation between a common carrier transportation company and the owners of upstream gathering pipelines, or define a common carrier and upstream gathering pipelines. At the same time, Art. 1 of the Law on Pipeline Transportation provides a definition of trunklines (which are understood to be the same as common carrier pipelines) and field pipelines.
The definition of field pipelines in the current Law on Pipelines Transportation is ambiguous. The definition of trunklines could potentially capture field pipelines (pipelines that transport sales gas from the field/production facilities to the point of transfer to the trunklines) if such pipelines are designed in line with the state regulations applicable to trunklines.
It is recommended that Art. 1 of the Natural Gas Market Law clearly define the differences between common carrier pipelines and upstream gathering pipelines, and in the Law on Pipeline Transportation to clearly define that upstream gathering pipelines are not considered as trunklines (common carrier pipelines).
It is further recommended to provide distinct definitions of a common carrier transportation company and of the owners of upstream gathering pipelines, and to introduce changes to Art. 13 of the Natural Gas Market Law to expressly separate the rules governing producer gathering pipelines from those that apply to common carriers described in Article 13. The upstream gathering pipelines are for the own use of producers and are not part of the Unified Gas Transportation System and, as such, should not be subject to the obligations to provide third-party access as common carriers pipelines.

Natural Gas and Ukraine‘s Energy Future Ukraine Special Report
A-14 Appendix
© 2012 IHS No portion of this report may be reproduced, reused, or otherwise distributed in any form without prior written consent.
Regulatory Legal Act Policy, Legal, and Regulatory
Areas of Concern Recommendation
Art.4 of the Natural Gas Market Law
Right to appeal against regulatory decision or ruling of state regulator
While it appears to be implied by Natural Gas Market Law in general, and there are provisions of S.6 of Art. 23 of the law providing for the right to appeal to a court having jurisdiction against a fine levied on a party, there are no specific provisions in this law stipulating that any other decisions made by the state regulator, including operational, etc., may be appealed to a court.
It is recommended to the Natural Gas Market Law include provisions to expressly confirm that decisions made by the state regulator may be appealed to a court having jurisdiction over the state regulator.
Art.7 of the Law on Pipeline Transportation
Ownership of Common Carrier Pipelines
At present, in line with the requirements of Art. 7 of the Law on Pipeline Transportation, common carrier pipelines can only be owned by the state.
It is recommended that these restrictions be reviewed to provide an exception from this general rule in certain cases to allow other parties to build, operate, and own common carrier pipelines.
NA Infrastructure access rules (Network Code)
At present there does not appear to be any formal set of procedures for infrastructure access rules (a ―Network Code‖).
It is recommended that provisions should be introduced into the Law on Pipeline Transportation stipulating that NECR approves such Network Code. The code is to be prepared jointly by the eegulator, the operator of the Unified Gas Transportation System, and the rest of the gas industry including producers.
Taxation
High Priority
General comment Difficulty and continuous uncertainty in recovery of tax assets
The tax authorities‘ interpretations of the requirements of the Tax Code of Ukraine and secondary tax legislation in general, and specifically the requirements related to recovery of tax assets, varies in different parts of Ukraine, and it is not uncommon when authorities are looking for ambiguous interpretations to avoid confirming VAT recoverable balances to which the companies might be entitled. For example, interpretations of the same articles of the laws and regulations issued by different offices of tax inspection not only lack consistency, but significantly diverge from each other. The industry finds it quite difficult to operate in the environment where tax authorities work mainly with the aim of delivering the state budget regardless of the long-term damages it may cause to the industry and the economy of the Ukraine. Moreover, interpretations of Tax Code, secondary tax legislation, and other laws indirectly related to governing taxation practices issued by different state bodies (including, but not limited to tax authorities) may vary significantly, thus even further complicating economic activity for oil and gas companies.
It is recommended that consistency in legislation, in its interpretation, and in implementation practices is ensured. Where valid negative feedback is received from the industry regarding ambiguous interpretations and instructions in the tax legislation, the state authorities should work to provide interpretations/instructions that are clear, acceptable, and workable for both the industry and the government, providing for an open dialogue between the parties.
When new laws and regulations are introduced, the authorities should provide consistent interpretations and instructions prior to such new laws coming into force.

Ukraine Special Report Natural Gas and Ukraine‘s Energy Future
Appendix A-15
© 2012 IHS No portion of this report may be reproduced, reused, or otherwise distributed in any form without prior written consent.
Regulatory Legal Act Policy, Legal, and Regulatory
Areas of Concern Recommendation
General comment Taxation of Foreign Companies
It is understood that a foreign company owning a special permit or having entered into a JAA or PSA will be viewed as having a permanent establishment (PE) in Ukraine for tax purposes. Our further understanding is that local tax authorities most likely will argue that any funding provided by the foreign company related to activities under a special permit or a JAA should be treated as taxable income for the PE and may also be subject to VAT. Such tax treatment will be detrimental to investments made through a foreign company. The funding of activities under a PSA will most likely not face similar issues, while a resident subsidiary of a foreign entity will not be subject to taxation on funding received from its foreign parent.
Irrespective of the above, it appears that a PE of a foreign company cannot carry forward tax losses, as such right is restricted to Ukrainian resident companies, including subsidiaries of foreign companies.
While any distributions from a JAA previously were excluded from the income tax basis of the recipient (whether the receiver was a PE of a foreign company or a company resident in Ukraine), current tax legislation is unclear in this area, resulting in the risk of double taxation.
Both remittance from a PE to its home office and the distribution of dividends from a Ukrainian resident company to its foreign parent may be exempt from withholding tax under a tax treaty. However, the distribution of dividends may be subject to an advance corporation tax (ACT). ACT is in principle creditable against corporate income tax payable by the distributing company, but this may not be achievable in practice. In relation to JAAs, unless double taxation is imposed (see the previous paragraph), which is certainly not desirable, a resident subsidiary of a foreign company may not have sufficient taxes payable related to other activities to fully utilize the credit. Under PSAs, there is uncertainty whether ACT is creditable against all taxes payable. ACT therefore may effectively become another form of double taxation under both JAAs and PSAs.
The uncertainty and structural issues highlighted here represent significant challenges for a foreign investor considering activities in Ukraine. The restrictions on the transfer of special permits add further complexity and costs, as the most tax efficient structure may not be possible to implement in all circumstances and may make an otherwise sound investment uneconomical.
It is recommended to enact legislation that
– will exempt foreign companies from taxation/VAT on funding
– will provide the PEs of foreign entities equal rights with regard to carrying tax losses forward
– reintroduces provisions to exclude distributions from a JAA from the income tax basis of the recipient
– in relation to JAAs, exempts dividends from the subsidiaries of foreign entities from ACT, in order to provide for a ―pass through‖ of JAA distributions
– in relation to PSAs, clarifies that any ACT is fully creditable against all taxes related to a PSA
It is further recommended that some of the restrictions on the transfer of special permits be removed to make it possible for foreign investors to implement efficient tax structures.
Other areas of concern

Natural Gas and Ukraine‘s Energy Future Ukraine Special Report
A-16 Appendix
© 2012 IHS No portion of this report may be reproduced, reused, or otherwise distributed in any form without prior written consent.
Regulatory Legal Act Policy, Legal, and Regulatory
Areas of Concern Recommendation
High Priority
NA Requirements related to the import and putting into operation of new equipment/technology
Technology (methods of production) and equipment currently at resource sites contribute significantly to efficiency problems and accident risks. Existing equipment, like drilling equipment, is out-of-date, having been on average in operation for 20 to 25 years. To successfully develop fields, Ukraine needs to import new technology to effectively increase oil and gas production, but this appears to be discouraged by the high customs duty and complicated procedures attached to importing foreign equipment and the putting it into operation. For example, import tax, the amount of commitments required for the temporary import of equipment, the complicated customs clearance procedures, the compulsory certification of equipment, the need to obtain the operational permits and operational licenses etc., all slow down the implementation of innovative technologies and the use of modern foreign equipment in oil and gas operations in Ukraine.
It is recommended to review the current provisions related to the import and putting equipment into operation in order to introduce simplifications and reduce costs. This should expand the service market and could become a spur for the development of the production capacities of Ukraine.
In other countries, a system of temporary importation is permitted and fully implemented, whereby no duty is charged provided the equipment is reexported at a later date. This appears to be part of the PSA regime, but does not appear to be included all special permits other than those involved in a PSA. There appears to be a possibility to temporarily bring some equipment into Ukraine without paying the full import duties under the Istanbul Convention; however, the list of such equipment is quite limited and very often is subjectively challenged by Ukrainian customs officers.
Medium Priority
NA Use of new equipment/technology/skilled personnel in Ukraine
Ukrainian equipment appears to be outdated. Some local contractors do not have the equipment or personnel capable of successfully drilling to depths of 6,000 meters. Furthermore, Ukraine has complex reservoirs that require new technology to optimize production and recovery.
As modern technologies and equipment are needed in Ukraine to improve resource extraction, it is suggested that the associated cost and complexity is reflected and considered in fiscal terms for petroleum extraction.
To allow for transfers of technology, one option for consideration could be to encourage JVs and partnerships between local and international service providers to use highly qualified service companies that have modern technology for key operations, such as directional drilling, well logging and drilling fluids control, which could significantly reduce formation damage and increase production potential as well as transfer key knowledge for the successful development of Ukrainian capabilities.
NA Historical geological and well data
Acquiring historical geological and well data appears to be challenging in Ukraine, although there is a high demand for acquiring such data by oil and gas companies that are considering investing into Ukraine.
It is recommended that current procedures associated with the procurement of such information be reviewed to make improvements that allow the prompt purchase of state-held information.

Ukraine Special Report Natural Gas and Ukraine‘s Energy Future
Appendix A-17
© 2012 IHS No portion of this report may be reproduced, reused, or otherwise distributed in any form without prior written consent.
Regulatory Legal Act Policy, Legal, and Regulatory
Areas of Concern Recommendation
NA Operation licensing/permitting administrative regulations
The regulations on permitting and licensing activities are complex and bureaucratic, involving many government departments, and can cause project delays and result in suboptimum engineering choices. As an example
Obtaining land allotment permissions is time consuming; it takes between 6 to 12 months, possibly longer, to receive approvals for drilling a new well that will take only 3 to 4 months to drill.
To obtain approval of technical programs involving well accepted international technical methods that do not match current Ukrainian practices is difficult. For this reason, operators may select suboptimal variants to be certain to receive approvals, although this will not benefit the field efficiency and productivity.
As a general observation, it appears that the simplification of operating permitting procedures will be beneficial for Ukraine; it should lead to more efficient operations and increased production, and make Ukraine more attractive for foreign direct investment, resulting in new employment and higher state tax revenues. Further review of legislation should identify additional shortcomings of the current permitting procedures and facilitate the development of specific recommendations to address them.
NA Regulations on foreign currency transactions
The current regulations on foreign currency transactions and the movement of monies into and out of Ukraine are very complex.
For example, to settle a contract payment with nonresidents who worked on oil and gas facilities in Ukraine, if the amount of the contract exceeds €100,000 or if the amount of the total payments for all of the contracts with a nonresident during the current year exceeds that amount, an act on a pricing expertise must requested and received from the Derzhzovnishinform Center. In practice, that means that each contractual payment over €100,000 to nonresidents within a year, must be approved by the Derzhzovnishinform Center. Although, according to official information, the act of pricing expertise is supposed to be issued within two working days, and the average time to review a particular contract is said to take seven working days, in practice it takes two weeks or longer to receive approval (and sometimes much longer) —or permission is refused.
As a general observation, the simplification and streamlining of foreign currency legislation and regulations could assist parties involved in Ukrainian transactions fulfill their obligations. A further review of legislation could determine specific shortcomings and facilitate specific recommendations to address them.
NA Work Permits for Directors
Work permits for directors of Ukrainian companies can only be applied for once a company is formally established. Therefore, a foreign company establishing a Ukrainian company must trust limited information on its Ukrainian subsidiary‘s assets and accept the risk of unknown unlimited liabilities being incurred by a local individual appointed to initially act for the subsidiary company as its director.
It is recommended that current immigration practices be reviewed to allow a company being formed to apply in advance for a temporary work permit, to be effective upon the company‘s formation (by requiring subsequent confirmation by proving the completion of the company formation process).

Natural Gas and Ukraine‘s Energy Future Ukraine Special Report
A-18 Appendix
© 2012 IHS No portion of this report may be reproduced, reused, or otherwise distributed in any form without prior written consent.
Regulatory Legal Act Policy, Legal, and Regulatory
Areas of Concern Recommendation
Low Priority
NA Authority of directors of oil and gas companies
The director of a Ukrainian company has virtually unlimited powers vis-a-vis third parties, without the need to confirm actions with the shareholders or the board and irrespective of restrictions in charters, shareholder and board resolutions, etc., which for large oil and gas companies exposes assets to misbehavior by the director.
It is recommended that provisions of civil legislation of Ukraine be reviewed, in particular to allow an LLC to have the option to have a director with no powers by law, so that all powers arise only from the charter, and thus, third parties will have to confirm actual powers, as is the case by law for acts by all other employees of companies.
NA Status of Operators
Current legislation does not provide for a clear definition of the status of an operator. References to Operatorship, however, are given in the Law on PSA in S2. of Art. 9.
As JAAs are formally recognized by Ukraine for subsoil operations, it appears to be reasonable to introduce appropriate provisions in legislation formally establishing the status of an operator in such JAAs.

IHS CERA 1150 Connecticut Avenue NW Suite 400 Washington, DC 20036