UKIP candidates and policy positions in the 2013 local ... candidates and... · UKIP candidates and...
21
UKIP candidates and policy positions in the 2013 local elections Michael Thrasher, Galina Borisyuk, Colin Rallings, Mary Shears and Michael Turner The Elections Centre, School of Government Plymouth University Paper presented to the Elections, Public Opinion and Parties Annual Conference, University of Lancaster, September 13 th -15 th September, 2013.
Transcript of UKIP candidates and policy positions in the 2013 local ... candidates and... · UKIP candidates and...
UKIP candidates and policy positions in the 2013 local elections
Michael Thrasher, Galina Borisyuk, Colin Rallings,
Mary Shears and Michael Turner
The Elections Centre, School of Government
Plymouth University
Paper presented to the Elections, Public Opinion and Parties Annual Conference,
University of Lancaster, September 13th
-15th
September, 2013.

1
Introduction In early spring 2013, members of the United Kingdom Independence Party (UKIP) received a letter
from William Legge, the 10th Earl of Dartmouth and one of the party’s MEP’s for the South West
region. This letter amounted to a ‘call to arms’, a request for volunteers to come forward and stand as
candidates (even, if only as ‘paper’ candidates) for the forthcoming county and unitary council
elections. The appeal was so successful that when the nominations closed UKIP had come within a
hairsbreadth of contesting more seats than the Liberal Democrats.
In the weeks prior to voting the party’s national poll ratings ranged between 9-16% with pollsters
undecided whether UKIP had overtaken the Liberal Democrats. In the event UKIP exceeded its
national polling, capturing one in five votes cast across the English shires. The Sunday Times’
national equivalent vote published the following week saw UKIP placed on 22%, only four points
lower than the Conservative estimate but nine points higher than that for the Liberal Democrats.
Labour failed to mobilise much of the anti-coalition sentiment, its own performance less than it might
have expected at this stage of the parliament.
The UKIP performance, both the successful candidate recruitment drive and the battle for votes and
seats, proved a great surprise; this even extended to some of the party’s own candidates who had not
expected to be elected! During the local campaign the national party was forced to disown some
candidates (although too late to remove them from the nomination lists), mostly for publically
declaring some rather unsavoury political opinions. During July 2013 the Crown Prosecution Service
announced it was charging one of its candidates with falsifying details on his nomination forms.
Of course, UKIP is not alone in recruiting candidates whose views, when more widely circulated,
embarrass the national leadership. But, what makes the UKIP performance noteworthy is that in May
2013, a party with little track record of competing for local votes, somehow succeeded in recruiting
large numbers of people to stand (many of whom had little or no previous electoral experience),
campaign attract votes and in more than a hundred cases, win seats.
The aim here is to shed light on those that responded to the party’s call for candidates. What types of
people answered the appeal and how do they compare to the types of people that contest on behalf of
the established parties? Political scientists have tried to unlock the puzzle of UKIP, generally
regarding it as a right-wing party in terms of both its outlook and its electoral strategy (Abedi and
Lundberg 2009; John and Margetts 2009; Lynch, Whittaker and Loomes 2012;). A series of papers
examining the party’s performance at particular elections (Borisyuk, Rallings, Thrasher and van der
Kolk 2007, Ford, Goodwin and Cutts 2012; Hayton 2010; Margetts, John and Weir 2004) have also
cast light on the types of electoral situations that favour the party but generalising from such studies
has proved difficult.
Two types of data are used to describe UKIP’s impact on the local elections. First, aggregate election
results describe the nature and scale of UKIP’s success. Following this, we use individual-level data
obtained from a census of candidates that stood in 2013 to compare and contrast UKIP candidates
with those that were selected by the three main parties. On the weekend after the results were
announced the UKIP leader, Nigel Farage, believed his party had delivered a heavy blow against the
party political establishment. It is certainly true that UKIP took every advantage of an electoral mood
2
that suggested voters were turning against the party mainstream. It is also true that his candidates
were notably different from those they were facing.
Counting the votes Table 1 shows that UKIP fielded 1,742 candidates (72.8%). The party won 147 seats (6.1%) after
receiving 19.9% of votes across 27 English shire counties, 7 unitary councils and a single council in
Wales. Not only was UKIP easily the most successful of the minor parties and won more votes and
seats than Independents its popular vote was six-points higher than that received by the Liberal
Democrats. However, its vote distribution was highly inefficient, resulting in a poor translation of
votes into seats (a ratio of just 0.3), recalling the early forays of the Liberal/Social Democratic Party
Alliance in the early 1980s; the 1985 county elections saw the Alliance parties with 28% of vote share
but only 20% of seats). Structural changes to the composition of local authorities and boundary
changes affecting others, make it difficult to make direct comparisons between the 2013 elections and
those held four years previously but in 2009 UKIP won only 8 seats (0.3%) and received the same
percentage of votes (4.6%) as did the Green party.
Table 1: Summary data for the 2013 local elections
Vote
%
Candidates
N=
Contested
Seats (%)
Seats won
N=
% Seats
/votes
Conservative 34.4 2,274 95.1 1,117 46.7 1.4
Labour 21.2 2,191 91.6 541 22.6 1.1
LD 13.9 1,761 73.6 353 14.8 1.1
Green 3.5 890 37.2 22 0.9 0.3
BNP 0.2 100 4.2 0 0.0 0.0
UKIP 19.9 1,742 72.8 147 6.1 0.3
PC 0.2 26 1.1 12 0.5 2.5
Ind 4.6 516 21.6 155 6.5 1.4
Other 2.1 357 14.9 45 1.9 0.9
The increase in the number of UKIP candidates meant that some voters in the shires were
being given a first opportunity to cast a local vote for a party whose policy platform of
withdrawal from the EU and stronger control over immigration appeared to have little to do
with the concerns of local government. But many of these voters had also previously
supported the Liberal Democrats and as the 2011 shire district elections had demonstrated
that party’s support had declined considerably after it joined the coalition government. There
was too a sizeable decline in support for the Conservative party and although the Labour
party had improved its position from 2009 it certainly could not claim to be the obvious
choice for disaffected Conservative/Liberal Democrat voters.
3
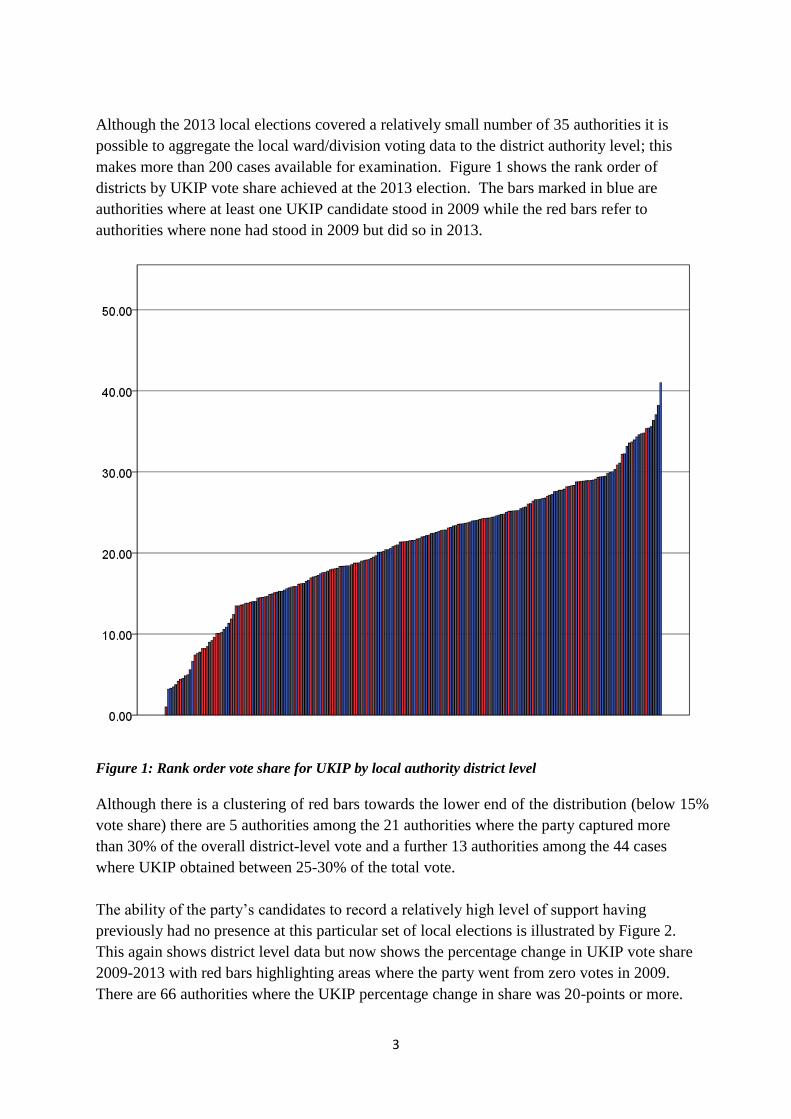
Although the 2013 local elections covered a relatively small number of 35 authorities it is
possible to aggregate the local ward/division voting data to the district authority level; this
makes more than 200 cases available for examination. Figure 1 shows the rank order of
districts by UKIP vote share achieved at the 2013 election. The bars marked in blue are
authorities where at least one UKIP candidate stood in 2009 while the red bars refer to
authorities where none had stood in 2009 but did so in 2013.
Figure 1: Rank order vote share for UKIP by local authority district level
Although there is a clustering of red bars towards the lower end of the distribution (below 15%
vote share) there are 5 authorities among the 21 authorities where the party captured more
than 30% of the overall district-level vote and a further 13 authorities among the 44 cases
where UKIP obtained between 25-30% of the total vote.
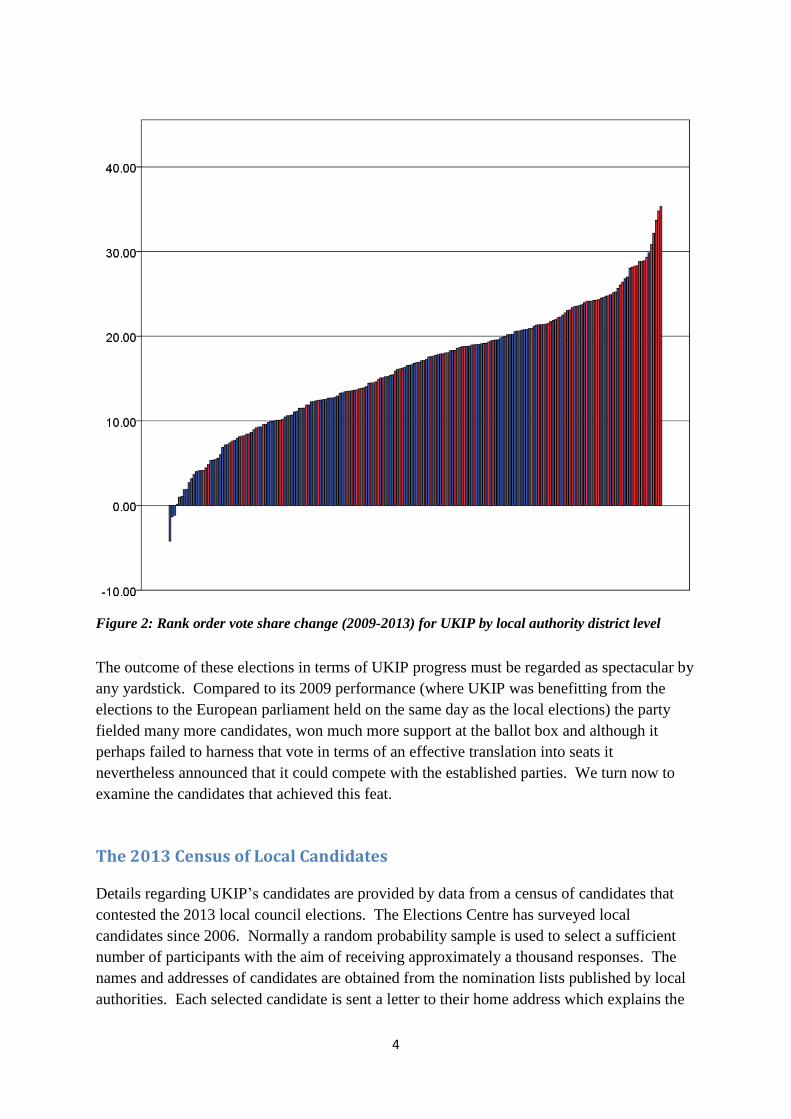
The ability of the party’s candidates to record a relatively high level of support having
previously had no presence at this particular set of local elections is illustrated by Figure 2.
This again shows district level data but now shows the percentage change in UKIP vote share
2009-2013 with red bars highlighting areas where the party went from zero votes in 2009.
There are 66 authorities where the UKIP percentage change in share was 20-points or more.
4
Figure 2: Rank order vote share change (2009-2013) for UKIP by local authority district level
The outcome of these elections in terms of UKIP progress must be regarded as spectacular by
any yardstick. Compared to its 2009 performance (where UKIP was benefitting from the
elections to the European parliament held on the same day as the local elections) the party
fielded many more candidates, won much more support at the ballot box and although it
perhaps failed to harness that vote in terms of an effective translation into seats it
nevertheless announced that it could compete with the established parties. We turn now to
examine the candidates that achieved this feat.
The 2013 Census of Local Candidates
Details regarding UKIP’s candidates are provided by data from a census of candidates that
contested the 2013 local council elections. The Elections Centre has surveyed local
candidates since 2006. Normally a random probability sample is used to select a sufficient
number of participants with the aim of receiving approximately a thousand responses. The
names and addresses of candidates are obtained from the nomination lists published by local
authorities. Each selected candidate is sent a letter to their home address which explains the
5
nature and purpose of the survey. The letter is timed to arrive on the days immediately
following polling day.
Between 2006-2010 the survey was conducted using postal questionnaires. Since 2011 it has
been conducted as an online survey with the letter providing each candidate with their own
code number and a web address where the questionnaire can be found. The response rate fell
from above 30% using postal methods to approximately 20% using the online approach.
Anticipating this lower response rate we increased the frequency of the sampling procedure,
thereby maintaining the total number of responses received.
Because the 2013 local electoral cycle involved only the remaining 27 English shire counties
and some former counties that had become unitary councils, the number of candidates
contesting is relatively small. The added interest in surveying UKIP candidates prompted the
Centre to conduct a census in 2013 rather than sampling. Letters were sent to the almost ten
thousand candidates. A total of 1,989 candidates responded, a response rate of 20%.
Following examination of these responses the data are weighted by party (after comparison
with the actual number of candidates contesting) and by the response rate for each local
authority.
Since the analysis in this paper seeks to compare UKIP candidates with those standing for
one of the three main parties the responses from candidates standing as Independents or for
one of the smaller parties are excluded. This reduces the number of available cases to 1,588
(Conservatives comprise 454 respondents or 29%, Labour 438/28%, Liberal Democrats
350/22% and UKIP 346/22%).
Who answered the UKIP call to arms?
When the process of nominating candidates opened in early April it became clear that the
appeal for volunteers among UKIP members had been successful. Were these volunteers
seasoned veterans, possibly former Conservative candidates for whom the European issue
had convinced them to switch allegiance? Or were these candidates rank and file members
who felt that this was an ideal opportunity to broaden the base of what is widely regarded as a
one-issue party?
Survey respondents are allocated to one of four categories that describes their experience as
candidates. First-time candidates are those that have not stood for election to any principal
local authority (i.e. excluding parish and town council contests) before the current election.
Incumbents are former councillors seeking re-election although not necessarily for the same
ward/division. A separate category identifies candidates that have previously been elected
but were not incumbents at the time of the 2013 election. Finally, the term ‘serial’ is used to
describe those candidates standing at more than one election but who have never been elected.
6
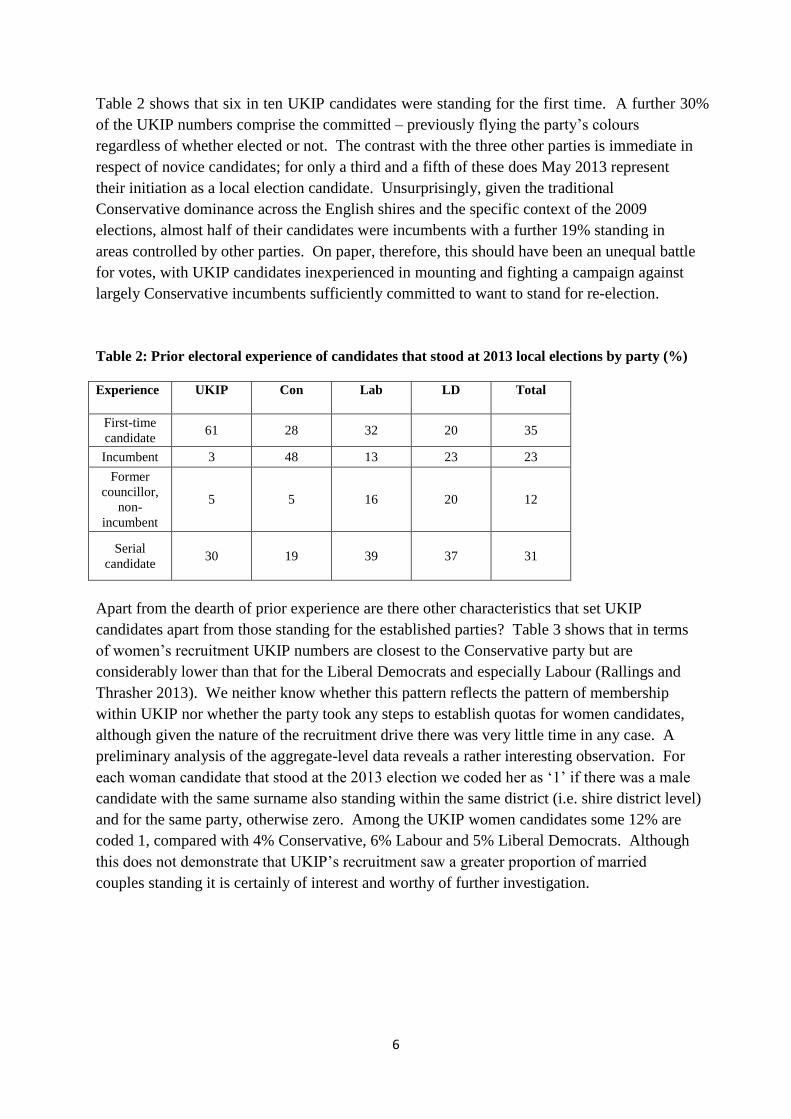
Table 2 shows that six in ten UKIP candidates were standing for the first time. A further 30%
of the UKIP numbers comprise the committed – previously flying the party’s colours
regardless of whether elected or not. The contrast with the three other parties is immediate in
respect of novice candidates; for only a third and a fifth of these does May 2013 represent
their initiation as a local election candidate. Unsurprisingly, given the traditional
Conservative dominance across the English shires and the specific context of the 2009
elections, almost half of their candidates were incumbents with a further 19% standing in
areas controlled by other parties. On paper, therefore, this should have been an unequal battle
for votes, with UKIP candidates inexperienced in mounting and fighting a campaign against
largely Conservative incumbents sufficiently committed to want to stand for re-election.
Table 2: Prior electoral experience of candidates that stood at 2013 local elections by party (%)
Experience UKIP Con Lab LD Total
First-time
candidate 61 28 32 20 35
Incumbent 3 48 13 23 23
Former
councillor,
non-
incumbent
5 5 16 20 12
Serial
candidate 30 19 39 37 31
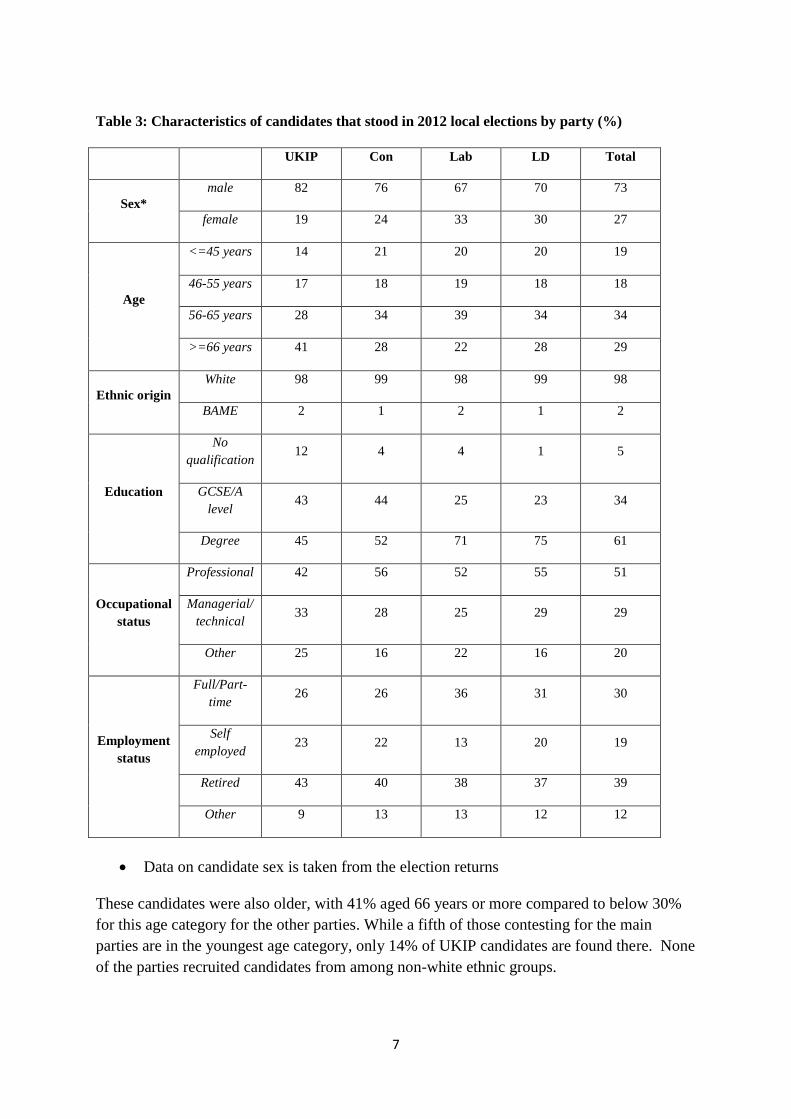
Apart from the dearth of prior experience are there other characteristics that set UKIP
candidates apart from those standing for the established parties? Table 3 shows that in terms
of women’s recruitment UKIP numbers are closest to the Conservative party but are
considerably lower than that for the Liberal Democrats and especially Labour (Rallings and
Thrasher 2013). We neither know whether this pattern reflects the pattern of membership
within UKIP nor whether the party took any steps to establish quotas for women candidates,
although given the nature of the recruitment drive there was very little time in any case. A
preliminary analysis of the aggregate-level data reveals a rather interesting observation. For
each woman candidate that stood at the 2013 election we coded her as ‘1’ if there was a male
candidate with the same surname also standing within the same district (i.e. shire district level)
and for the same party, otherwise zero. Among the UKIP women candidates some 12% are
coded 1, compared with 4% Conservative, 6% Labour and 5% Liberal Democrats. Although
this does not demonstrate that UKIP’s recruitment saw a greater proportion of married
couples standing it is certainly of interest and worthy of further investigation.
7
Table 3: Characteristics of candidates that stood in 2012 local elections by party (%)
UKIP Con Lab LD Total
Sex*
male 82 76 67 70 73
female 19 24 33 30 27
Age
<=45 years 14 21 20 20 19
46-55 years 17 18 19 18 18
56-65 years 28 34 39 34 34
>=66 years 41 28 22 28 29
Ethnic origin
White 98 99 98 99 98
BAME 2 1 2 1 2
Education
No
qualification 12 4 4 1 5
GCSE/A
level 43 44 25 23 34
Degree 45 52 71 75 61
Occupational
status
Professional 42 56 52 55 51
Managerial/
technical 33 28 25 29 29
Other 25 16 22 16 20
Employment
status
Full/Part-
time 26 26 36 31 30
Self
employed 23 22 13 20 19
Retired 43 40 38 37 39
Other 9 13 13 12 12
Data on candidate sex is taken from the election returns
These candidates were also older, with 41% aged 66 years or more compared to below 30%
for this age category for the other parties. While a fifth of those contesting for the main
parties are in the youngest age category, only 14% of UKIP candidates are found there. None
of the parties recruited candidates from among non-white ethnic groups.
8
Although it is true a majority of candidates that stand for local election possesses a university
degree qualification there are some differences that emerge from the survey evidence. Three-
quarters of Liberal Democrat candidates hold a degree, closely followed by Labour but just
over half of the Conservatives and 45% of UKIP candidates do so. One in eight of the UKIP
candidates has no formal educational qualification. It is, perhaps, unsurprising that fewer
UKIP candidates are to be found among the professional occupations although they are just
as likely to be encountered among those describing themselves as having a managerial or
technical occupation.
Finally, and despite the older age profile among UKIP candidates, it is interesting to discover
that the stereotype of white-haired older, retired men with no previous electoral experience
but time on their hands is not entirely true. Admittedly, the largest category among UKIP is
the retired but 43% compares with a range of 37-40% for the other parties. In other respects
the similarity with the Conservative party candidates is worth noting.
The recruitment and selection process
Many of the people that volunteered to stand for UKIP were experiencing a local election for
the first time and were doing so at a relatively old age. Had these soon-to-be candidates been
regular fixtures within their local party organisations, building and maintaining an
infrastructure but leaving the battle for votes to other more confident and committed
members? Or was this volunteer army hastily assembled by a party scrabbling to find any
name to put on the ballot paper?
The answer would appear to lie closer to the second than the first of these questions. On each
survey we ask questions about a person’s place of residence and whether it is located within
the electoral district that they are contesting. This provides a sense of whether a not a party is
preferring to draft in ‘outsiders’ to fill vacancies, leaving itself vulnerable to the accusation
that it is not picking locals. Although all candidates are invariably party members, because
party rules largely preclude the selection of non-members, what can be revealing is both the
duration of that membership and the extent to which the individual has perhaps become
socialised within the party by holding some official responsibility. Finally, in order to gauge
a sense of the level of internal party activity, candidates are asked if they faced competition
for the nomination and whether they personally had sought the nomination for more than one
seat.
9
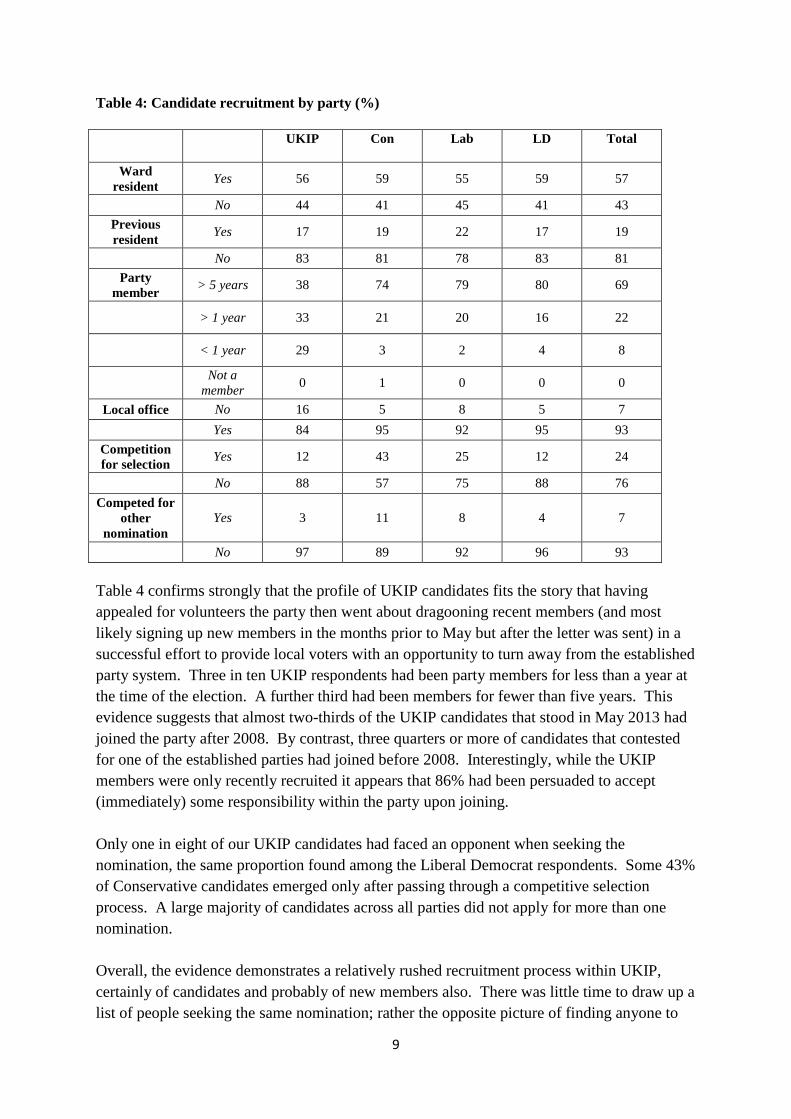
Table 4: Candidate recruitment by party (%)
UKIP Con Lab LD Total
Ward
resident Yes 56 59 55 59 57
No 44 41 45 41 43
Previous
resident Yes 17 19 22 17 19
No 83 81 78 83 81
Party
member > 5 years 38 74 79 80 69
> 1 year 33 21 20 16 22
< 1 year 29 3 2 4 8
Not a
member 0 1 0 0 0
Local office No 16 5 8 5 7
Yes 84 95 92 95 93
Competition
for selection Yes 12 43 25 12 24
No 88 57 75 88 76
Competed for
other
nomination
Yes 3 11 8 4 7
No 97 89 92 96 93
Table 4 confirms strongly that the profile of UKIP candidates fits the story that having
appealed for volunteers the party then went about dragooning recent members (and most
likely signing up new members in the months prior to May but after the letter was sent) in a
successful effort to provide local voters with an opportunity to turn away from the established
party system. Three in ten UKIP respondents had been party members for less than a year at
the time of the election. A further third had been members for fewer than five years. This
evidence suggests that almost two-thirds of the UKIP candidates that stood in May 2013 had
joined the party after 2008. By contrast, three quarters or more of candidates that contested
for one of the established parties had joined before 2008. Interestingly, while the UKIP
members were only recently recruited it appears that 86% had been persuaded to accept
(immediately) some responsibility within the party upon joining.
Only one in eight of our UKIP candidates had faced an opponent when seeking the
nomination, the same proportion found among the Liberal Democrat respondents. Some 43%
of Conservative candidates emerged only after passing through a competitive selection
process. A large majority of candidates across all parties did not apply for more than one
nomination.
Overall, the evidence demonstrates a relatively rushed recruitment process within UKIP,
certainly of candidates and probably of new members also. There was little time to draw up a
list of people seeking the same nomination; rather the opposite picture of finding anyone to
10
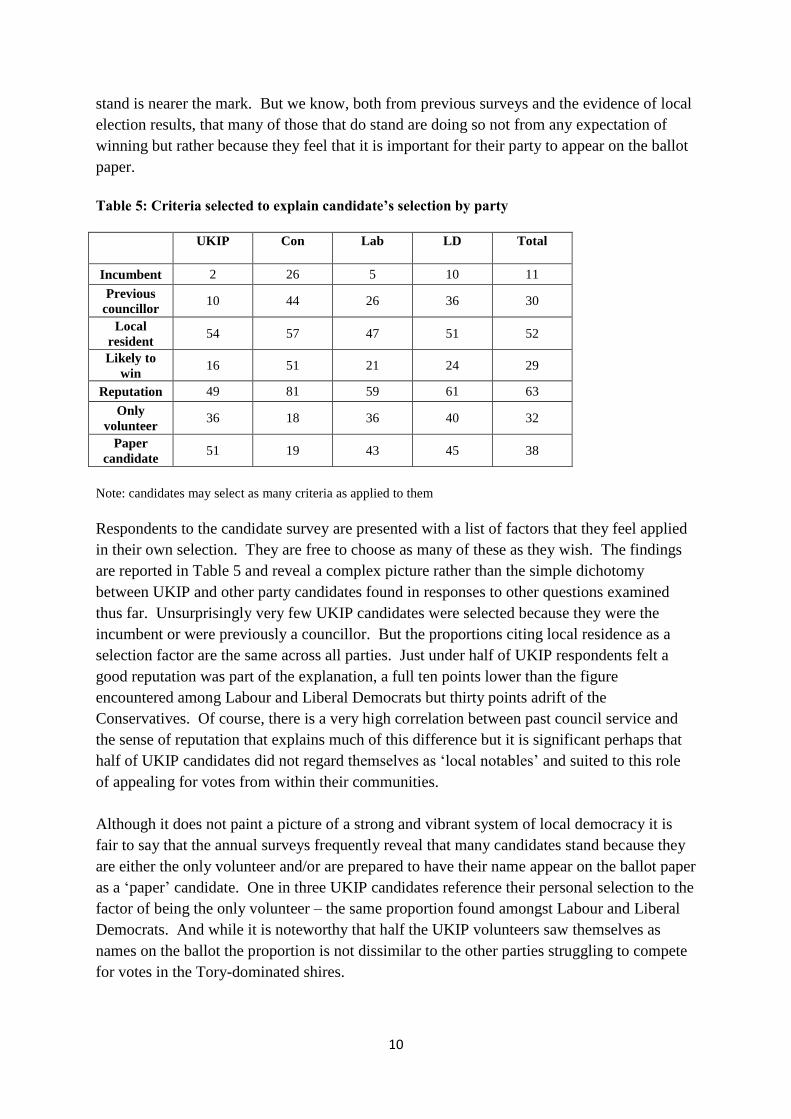
stand is nearer the mark. But we know, both from previous surveys and the evidence of local
election results, that many of those that do stand are doing so not from any expectation of
winning but rather because they feel that it is important for their party to appear on the ballot
paper.
Table 5: Criteria selected to explain candidate’s selection by party
UKIP Con Lab LD Total
Incumbent 2 26 5 10 11
Previous
councillor 10 44 26 36 30
Local
resident 54 57 47 51 52
Likely to
win 16 51 21 24 29
Reputation 49 81 59 61 63
Only
volunteer 36 18 36 40 32
Paper
candidate 51 19 43 45 38
Note: candidates may select as many criteria as applied to them
Respondents to the candidate survey are presented with a list of factors that they feel applied
in their own selection. They are free to choose as many of these as they wish. The findings
are reported in Table 5 and reveal a complex picture rather than the simple dichotomy
between UKIP and other party candidates found in responses to other questions examined
thus far. Unsurprisingly very few UKIP candidates were selected because they were the
incumbent or were previously a councillor. But the proportions citing local residence as a
selection factor are the same across all parties. Just under half of UKIP respondents felt a
good reputation was part of the explanation, a full ten points lower than the figure
encountered among Labour and Liberal Democrats but thirty points adrift of the
Conservatives. Of course, there is a very high correlation between past council service and
the sense of reputation that explains much of this difference but it is significant perhaps that
half of UKIP candidates did not regard themselves as ‘local notables’ and suited to this role
of appealing for votes from within their communities.
Although it does not paint a picture of a strong and vibrant system of local democracy it is
fair to say that the annual surveys frequently reveal that many candidates stand because they
are either the only volunteer and/or are prepared to have their name appear on the ballot paper
as a ‘paper’ candidate. One in three UKIP candidates reference their personal selection to the
factor of being the only volunteer – the same proportion found amongst Labour and Liberal
Democrats. And while it is noteworthy that half the UKIP volunteers saw themselves as
names on the ballot the proportion is not dissimilar to the other parties struggling to compete
for votes in the Tory-dominated shires.
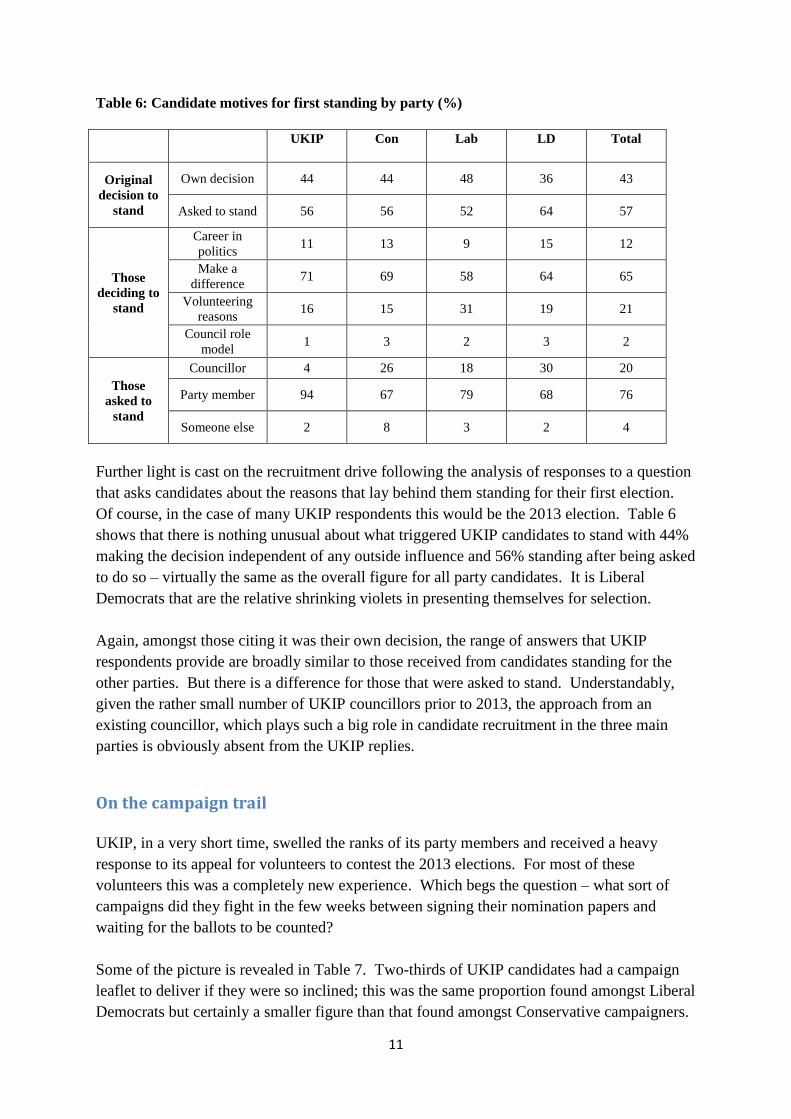
11
Table 6: Candidate motives for first standing by party (%)
UKIP Con Lab LD Total
Original
decision to
stand
Own decision 44 44 48 36 43
Asked to stand 56 56 52 64 57
Those
deciding to
stand
Career in
politics 11 13 9 15 12
Make a
difference 71 69 58 64 65
Volunteering
reasons 16 15 31 19 21
Council role
model 1 3 2 3 2
Those
asked to
stand
Councillor 4 26 18 30 20
Party member 94 67 79 68 76
Someone else 2 8 3 2 4
Further light is cast on the recruitment drive following the analysis of responses to a question
that asks candidates about the reasons that lay behind them standing for their first election.
Of course, in the case of many UKIP respondents this would be the 2013 election. Table 6
shows that there is nothing unusual about what triggered UKIP candidates to stand with 44%
making the decision independent of any outside influence and 56% standing after being asked
to do so – virtually the same as the overall figure for all party candidates. It is Liberal
Democrats that are the relative shrinking violets in presenting themselves for selection.
Again, amongst those citing it was their own decision, the range of answers that UKIP
respondents provide are broadly similar to those received from candidates standing for the
other parties. But there is a difference for those that were asked to stand. Understandably,
given the rather small number of UKIP councillors prior to 2013, the approach from an
existing councillor, which plays such a big role in candidate recruitment in the three main
parties is obviously absent from the UKIP replies.
On the campaign trail
UKIP, in a very short time, swelled the ranks of its party members and received a heavy
response to its appeal for volunteers to contest the 2013 elections. For most of these
volunteers this was a completely new experience. Which begs the question – what sort of
campaigns did they fight in the few weeks between signing their nomination papers and
waiting for the ballots to be counted?
Some of the picture is revealed in Table 7. Two-thirds of UKIP candidates had a campaign
leaflet to deliver if they were so inclined; this was the same proportion found amongst Liberal
Democrats but certainly a smaller figure than that found amongst Conservative campaigners.
12
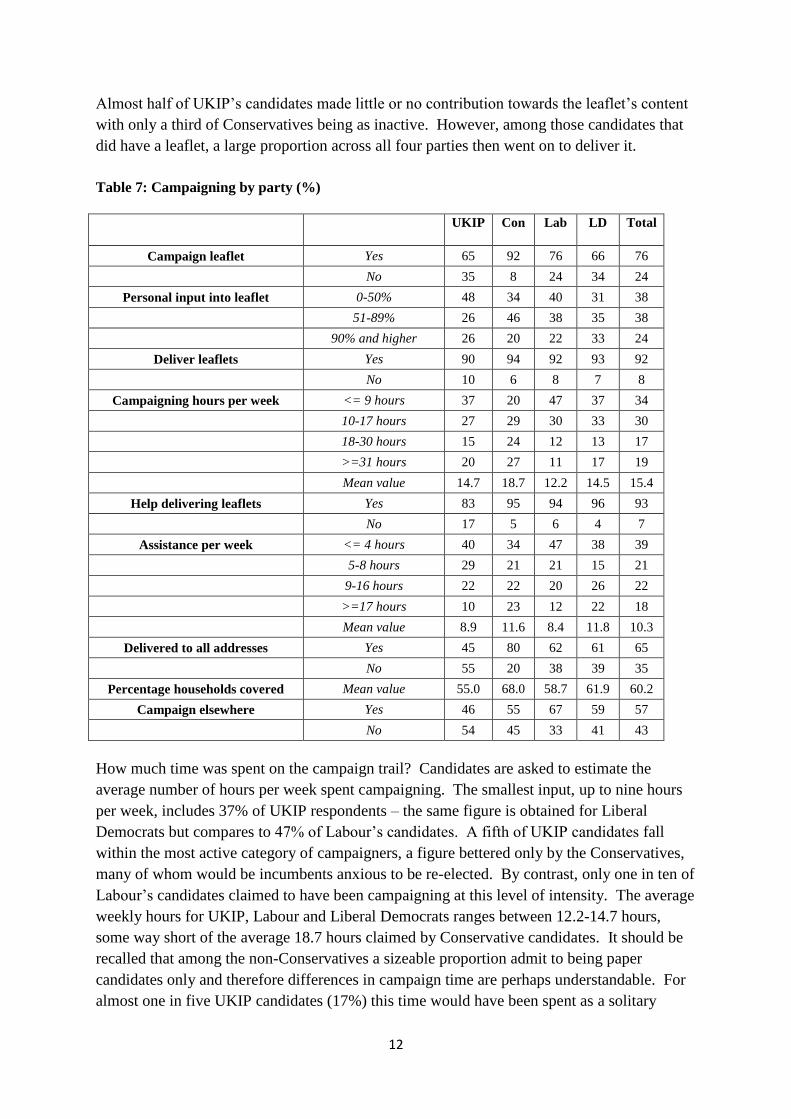
Almost half of UKIP’s candidates made little or no contribution towards the leaflet’s content
with only a third of Conservatives being as inactive. However, among those candidates that
did have a leaflet, a large proportion across all four parties then went on to deliver it.
Table 7: Campaigning by party (%)
UKIP Con Lab LD Total
Campaign leaflet Yes 65 92 76 66 76
No 35 8 24 34 24
Personal input into leaflet 0-50% 48 34 40 31 38
51-89% 26 46 38 35 38
90% and higher 26 20 22 33 24
Deliver leaflets Yes 90 94 92 93 92
No 10 6 8 7 8
Campaigning hours per week <= 9 hours 37 20 47 37 34
10-17 hours 27 29 30 33 30
18-30 hours 15 24 12 13 17
>=31 hours 20 27 11 17 19
Mean value 14.7 18.7 12.2 14.5 15.4
Help delivering leaflets Yes 83 95 94 96 93
No 17 5 6 4 7
Assistance per week <= 4 hours 40 34 47 38 39
5-8 hours 29 21 21 15 21
9-16 hours 22 22 20 26 22
>=17 hours 10 23 12 22 18
Mean value 8.9 11.6 8.4 11.8 10.3
Delivered to all addresses Yes 45 80 62 61 65
No 55 20 38 39 35
Percentage households covered Mean value 55.0 68.0 58.7 61.9 60.2
Campaign elsewhere Yes 46 55 67 59 57
No 54 45 33 41 43
How much time was spent on the campaign trail? Candidates are asked to estimate the
average number of hours per week spent campaigning. The smallest input, up to nine hours
per week, includes 37% of UKIP respondents – the same figure is obtained for Liberal
Democrats but compares to 47% of Labour’s candidates. A fifth of UKIP candidates fall
within the most active category of campaigners, a figure bettered only by the Conservatives,
many of whom would be incumbents anxious to be re-elected. By contrast, only one in ten of
Labour’s candidates claimed to have been campaigning at this level of intensity. The average
weekly hours for UKIP, Labour and Liberal Democrats ranges between 12.2-14.7 hours,
some way short of the average 18.7 hours claimed by Conservative candidates. It should be
recalled that among the non-Conservatives a sizeable proportion admit to being paper
candidates only and therefore differences in campaign time are perhaps understandable. For
almost one in five UKIP candidates (17%) this time would have been spent as a solitary
13
activity – three times the number of candidates campaigning alone that stood for the main
parties. Only Labour candidates reported receiving as little additional support as did UKIP
contestants.
Eight in ten Conservatives delivered leaflets to every household while almost two-thirds of
Labour and Liberal Democrats reported this level of blanket coverage. Fewer than half of the
UKIP candidates succeeded in reaching the voters in this way. Among those that leafleted
only a fraction of electors the UKIP coverage was again the lowest but the average of 55% of
all households is quite similar to both Labour and the Liberal Democrats. One regular feature
of local election campaigning is that many respondents assist with colleagues’ campaigning
efforts. While a majority of main party candidates did this only 46% of UKIP’s candidates
did so.
Although UKIP candidates were not as well-resourced during the campaign as the
Conservatives, the dominant party of shire England, their efforts compare alongside those of
both Labour and the Liberal Democrats. What they almost certainly did not possess to the
same extent as the other parties was an appreciation of where supporters were located and
campaign assistance to assist in voter mobilisation. But, this is unsurprising given the speed
with which candidates were assembled to fight these elections.
Candidate attitudes
Having identified the type of person that stepped forward to sport UKIP’s colours at the 2013
elections we now provide evidence about their political views and how these compare to
candidates representing the party political mainstream. Candidates were asked to locate
themselves on the standard left-right political spectrum on a scale that went from extreme left
(zero) to extreme right (ten). The same scales were used to calibrate candidates on other
policy-oriented issues although the scales were sometimes reversed in direction to maintain
respondents’ attention. In these cases (migration and tax/public expenditure) the data were
re-coded so that the scales all run in the same direction, i.e. from left to right where a low
value equates to a left-wing position and a high value corresponds to a viewpoint further to
the right.
Table 8 reports for each party the mean score and standard deviation on the left/right
dimension and five policy scales. In terms of the main left/right orientation UKIP candidates
places themselves at 6.7, a virtually identical position to Conservatives. Liberal Democrats
report a mean score of 4.1 (just left of centre) with Labour at 2.6.
In a sense the remaining questions serve as the explanation for these general ideological
positions. For example, in respect of the scale for delivery of local services which runs from
services should be the same everywhere to complete diversity there are no differences
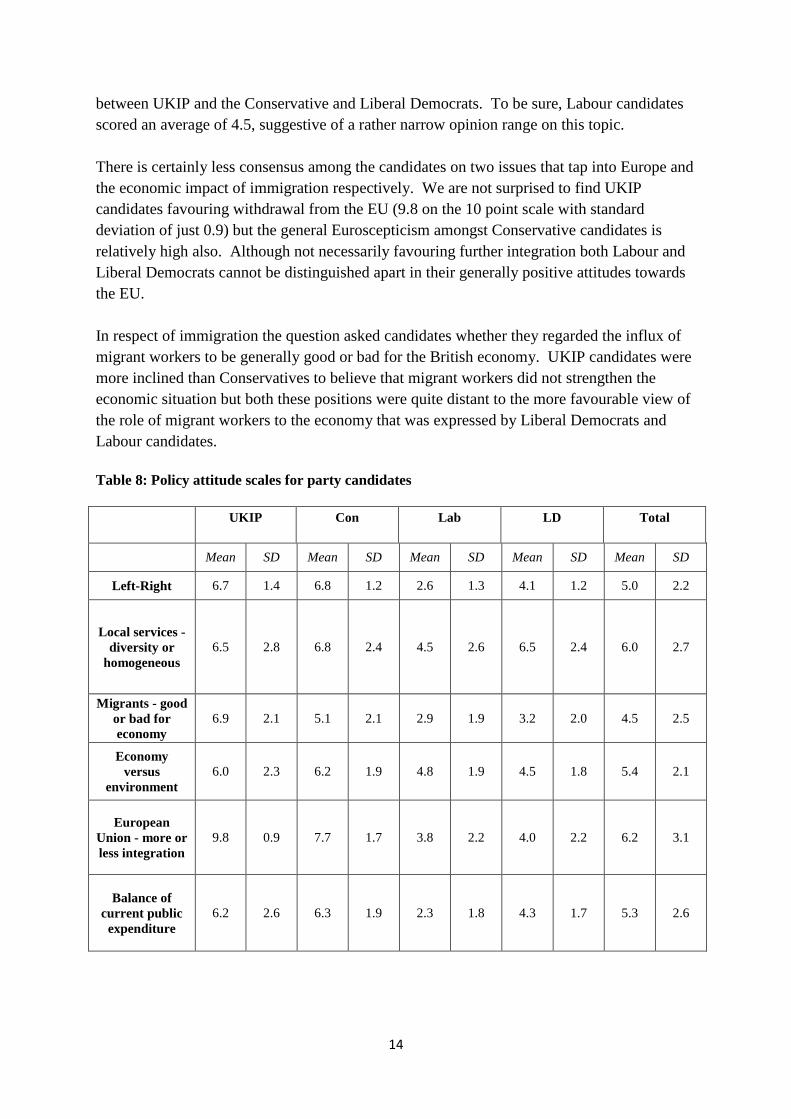
14
between UKIP and the Conservative and Liberal Democrats. To be sure, Labour candidates
scored an average of 4.5, suggestive of a rather narrow opinion range on this topic.
There is certainly less consensus among the candidates on two issues that tap into Europe and
the economic impact of immigration respectively. We are not surprised to find UKIP
candidates favouring withdrawal from the EU (9.8 on the 10 point scale with standard
deviation of just 0.9) but the general Euroscepticism amongst Conservative candidates is
relatively high also. Although not necessarily favouring further integration both Labour and
Liberal Democrats cannot be distinguished apart in their generally positive attitudes towards
the EU.
In respect of immigration the question asked candidates whether they regarded the influx of
migrant workers to be generally good or bad for the British economy. UKIP candidates were
more inclined than Conservatives to believe that migrant workers did not strengthen the
economic situation but both these positions were quite distant to the more favourable view of
the role of migrant workers to the economy that was expressed by Liberal Democrats and
Labour candidates.
Table 8: Policy attitude scales for party candidates
UKIP Con Lab LD Total
Mean SD Mean SD Mean SD Mean SD Mean SD
Left-Right 6.7 1.4 6.8 1.2 2.6 1.3 4.1 1.2 5.0 2.2
Local services -
diversity or
homogeneous
6.5 2.8 6.8 2.4 4.5 2.6 6.5 2.4 6.0 2.7
Migrants - good
or bad for
economy
6.9 2.1 5.1 2.1 2.9 1.9 3.2 2.0 4.5 2.5
Economy
versus
environment
6.0 2.3 6.2 1.9 4.8 1.9 4.5 1.8 5.4 2.1
European
Union - more or
less integration
9.8 0.9 7.7 1.7 3.8 2.2 4.0 2.2 6.2 3.1
Balance of
current public
expenditure
6.2 2.6 6.3 1.9 2.3 1.8 4.3 1.7 5.3 2.6
15
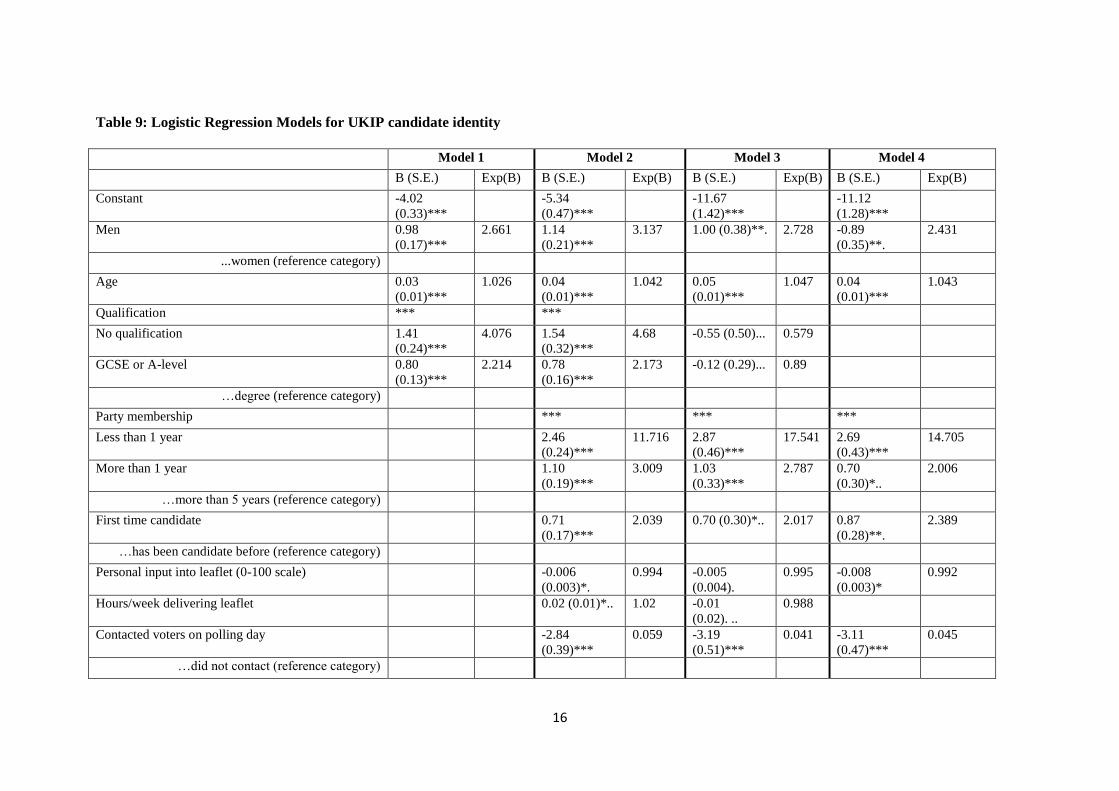
Identifying UKIP candidates
Having identified some similarities and differences between candidates that stood for UKIP
and others representing the three established parties it should be feasible using a multivariate
analysis to assess the relative weight of these factors in determining the profile of those that
answered the call for volunteers. Table 9 shows the results of a series of logistic regression
models where candidates are coded as 1 if UKIP, 0 otherwise. The basic model 1 contains
only three predictor variables – a candidate’s gender, age and highest educational
qualification, which Table 2 suggested were characteristics that might be used to identify the
likelihood of a candidate representing UKIP. Although each of the included explanatory
variables makes a statistically significant contribution, this model does not fit the data
particularly well(R2 value of just 0.12). Only 8% of the UKIP candidates are correctly
classified.
Model 2 adds to these demographic characteristics a set of variables that relate to the
candidate’s political/electoral experience and his/her effort expended on campaigning.
Information about length of party membership is the single factor that helps to distinguish
UKIP from other party candidates. The odds of locating a UKIP candidate increase
dramatically as the length of party membership shortens; the odds of finding a UKIP
candidate among those with less than 1 year party membership is almost 13 times the odds
among those with party membership of more than 5 years. A similar although smaller effect
is found when comparing the odds for the first-time candidates with those for candidates with
prior experience of contesting local elections. Although we noted from Table 7 that the mean
number of campaigning hours per week for UKIP candidates compares to the hours
committed to by Labour and Liberal Democrats, Model 2 suggests that UKIP’s lack of
infrastructure, evidenced here by a reduced ability to contact voters on polling day and to
help with the campaigning effort in other wards, sets their candidates apart from the more
established parties. The addition of these experience/campaign variables certainly helps the
model fit (R2 = 0.43, correct classification of 45% of UKIP candidates).
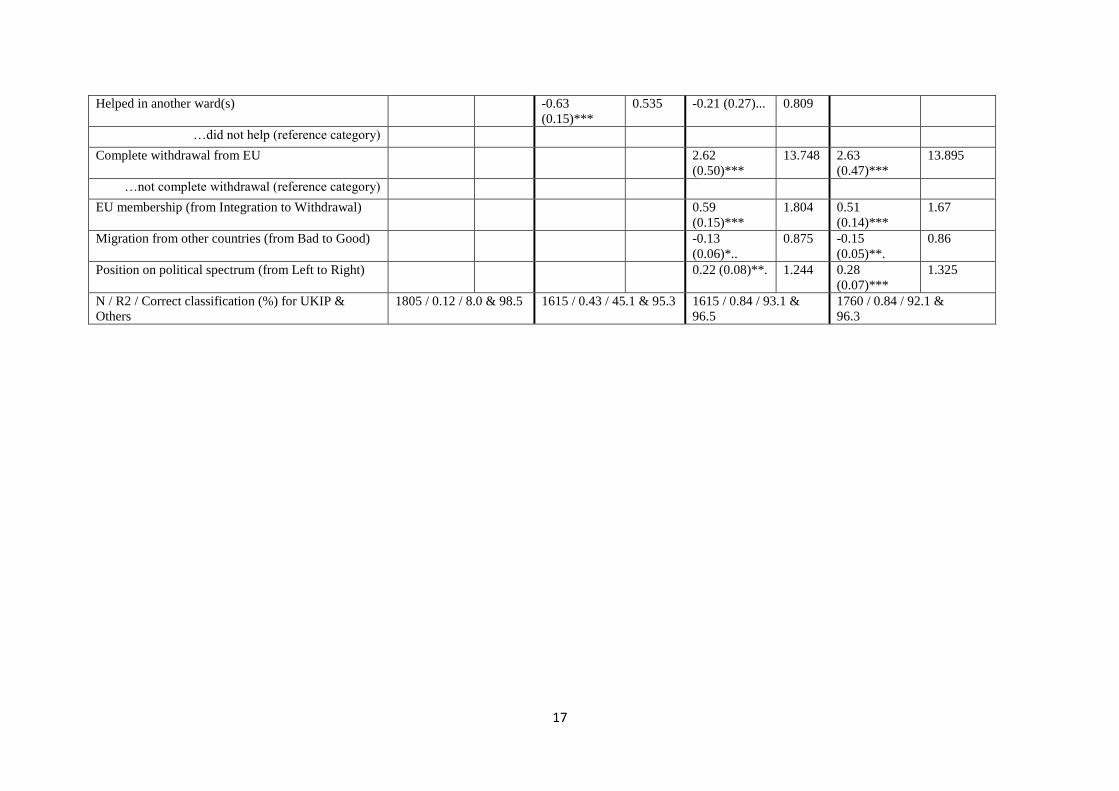
It was clear from Table 8, however, that an extremely important distinguishing characteristic
of UKIP candidates lies with their attitudes towards the European Union. For this purpose
the responses to the question on EU membership were recoded as a binary variable, with
those selecting 10 on the scale coded as wanting complete withdrawal, otherwise zero. The
odds of locating UKIP candidates increase considerably when the comparison is made
between those who prefer complete withdrawal with those who selected options short of
withdrawal. Model 3 improves the fit (R2 = 0.84, 93% correct classification of UKIP
candidates) to the data considerably.
Finally, model 4 includes all variables that reached significance in the previous models and
shows that overall 92% of UKIP and 96% of other parties’ candidates could be correctly
classified (R2 = 0.84).
16
Table 9: Logistic Regression Models for UKIP candidate identity
Model 1 Model 2 Model 3 Model 4
B (S.E.) Exp(B) B (S.E.) Exp(B) B (S.E.) Exp(B) B (S.E.) Exp(B)
Constant -4.02
(0.33)***
-5.34
(0.47)***
-11.67
(1.42)***
-11.12
(1.28)***
Men 0.98
(0.17)***
2.661 1.14
(0.21)***
3.137 1.00 (0.38)**. 2.728 -0.89
(0.35)**.
2.431
...women (reference category)
Age 0.03
(0.01)***
1.026 0.04
(0.01)***
1.042 0.05
(0.01)***
1.047 0.04
(0.01)***
1.043
Qualification *** ***
No qualification 1.41
(0.24)***
4.076 1.54
(0.32)***
4.68 -0.55 (0.50)... 0.579
GCSE or A-level 0.80
(0.13)***
2.214 0.78
(0.16)***
2.173 -0.12 (0.29)... 0.89
…degree (reference category)
Party membership *** *** ***
Less than 1 year 2.46
(0.24)***
11.716 2.87
(0.46)***
17.541 2.69
(0.43)***
14.705
More than 1 year 1.10
(0.19)***
3.009 1.03
(0.33)***
2.787 0.70
(0.30)*..
2.006
…more than 5 years (reference category)
First time candidate 0.71
(0.17)***
2.039 0.70 (0.30)*.. 2.017 0.87
(0.28)**.
2.389
…has been candidate before (reference category)
Personal input into leaflet (0-100 scale) -0.006
(0.003)*.
0.994 -0.005
(0.004).
0.995 -0.008
(0.003)*
0.992
Hours/week delivering leaflet 0.02 (0.01)*.. 1.02 -0.01
(0.02). ..
0.988
Contacted voters on polling day -2.84
(0.39)***
0.059 -3.19
(0.51)***
0.041 -3.11
(0.47)***
0.045
…did not contact (reference category)
17
Helped in another ward(s) -0.63
(0.15)***
0.535 -0.21 (0.27)... 0.809
…did not help (reference category)
Complete withdrawal from EU 2.62
(0.50)***
13.748 2.63
(0.47)***
13.895
…not complete withdrawal (reference category)
EU membership (from Integration to Withdrawal) 0.59
(0.15)***
1.804 0.51
(0.14)***
1.67
Migration from other countries (from Bad to Good) -0.13
(0.06)*..
0.875 -0.15
(0.05)**.
0.86
Position on political spectrum (from Left to Right) 0.22 (0.08)**. 1.244 0.28
(0.07)***
1.325
N / R2 / Correct classification (%) for UKIP &
Others
1805 / 0.12 / 8.0 & 98.5 1615 / 0.43 / 45.1 & 95.3 1615 / 0.84 / 93.1 &
96.5
1760 / 0.84 / 92.1 &
96.3
18
Conclusions
There is no doubt that UKIP and its candidates performed remarkably well at the 2013 local
elections. Although the party had succeeded in reaping the benefits of its anti-European
stance at European Parliament elections it had failed hitherto at convincing significant
numbers of local voters to support it. This changed following a major recruitment drive and
it became commonplace for UKIP candidates to appear on the ballot paper alongside
candidates standing for one of the three established parties. The combination of voters
disaffected by the parties sharing coalition government at Westminster and a reluctance to
regard Labour as the sole recipient of any protest vote led to UKIP capturing a fifth of the
popular vote and slightly fewer than 150 seats.
The survey of these candidates that answered the request for volunteers shows them to be
different to the other parties’ candidates in some important respects. UKIP candidates are
more likely to be men, more likely to be older and less likely to hold high levels of
educational qualifications. And while they are less likely to be drawn from might be termed
the professional classes they are certainly not representative of the general population in
terms of occupational status. But these differences are rather small when set alongside the
biggest difference which relates to their relative political and electoral inexperience when
compared alongside more seasoned campaigners for local votes that stood for the
Conservatives especially as well as Labour and the Liberal Democrats.
But although they lacked experience they appeared to have set out on the campaign trail with
a fair degree of enthusiasm and did not lack for effort. Putting to one side the understandable
disadvantageous comparison with the Conservatives, the incumbent party of the English
shires, UKIP’s candidates, many of whom were fighting their first campaigns, sometimes
eclipsed the efforts of the more seasoned Labour and Liberal Democrats. The evidence
points to a hastily assembled collection of old and new party members who proved more than
capable of taking the party’s message to local voters despite the apparent lack of a well-
organised party infrastructure.
It seems that this message, regardless of its relevance to the day to day responsibilities
undertaken by these particular elected authorities, resonated with voters who appeared
reluctant to embrace one or other of the three main parties. Only time will tell whether this
performance marks the pinnacle of UKIP’s achievement or instead a springboard into the
2014 European election campaign and beyond.
19
References
Abedi, A., and T. C. Lundberg. 2009. "Doomed to Failure? UKIP and the Organisational Challenges
Facing Right-Wing Populist Anti-Political Establishment Parties." Parliamentary Affairs 62:
72-87.
Borisyuk, G., C. Rallings, M. Thrasher, and H. van der Kolk. 2007. "Voter Support for Minor Parties
- Assessing the Social and Political Context of Voting at the 2004 European Elections in
Greater London." Party Politics 13: 669-93.
Ford, R., M. J. Goodwin, and D. Cutts. 2012. "Strategic Eurosceptics and Polite Xenophobes:
Support for the United Kingdom Independence Party (UKIP) in the 2009 European
Parliament Elections." European Journal of Political Research 51: 204-34.
Hayton, R. 2010. "Towards the Mainstream? UKIP and the 2009 Elections to the European
Parliament." Politics 30: 26-35.
John, P., and H. Margetts. 2009. "The Latent Support for the Extreme Right in British Politics."
West European politics 32: 496-513.
Lynch, P., R. Whitaker, and G. Loomes. 2012. "The UK Independence Party: Understanding a Niche
Party’s Strategy, Candidates and Supporters." Parliamentary Affairs 65: 733-57.
Margetts, H, P John, and S Weir. 2004. "Latent Support for the Far-Right in British Politics: The
BNP and UKIP in the 2004 European and London Elections." Paper presented at the EPOP
annual conference, University of Oxford.
Rallings, C., and M. Thrasher. 2013. Local Elections Handbook 2013. Plymouth: Biteback
Publishing.