UK State Action Plan on CO2 Emissions Reduction … State Action Plan on CO2 Emissions Reduction...
50
June 2015 UK State Action Plan on CO2 Emissi ons Reduction Activities Moving Britain Ahead
Transcript of UK State Action Plan on CO2 Emissions Reduction … State Action Plan on CO2 Emissions Reduction...
June 2015
UK State Action Plan on
CO2 Emissions Reduction
Activities Moving Britain Ahead

3
Contents
Contact Information 4
List of abbreviations used 5
1. Introduction 7
2. Current state of aviation in the UK 9
Background on UK policy on aviation and climate change 9
State of UK aviation 9
UK Airports 10
UK aviation governance 11
3. Actions taken at the supra-national level 13
Aircraft related technology development 13
Alternative fuels 17
Improved air traffic management and infrastructure use 21
Economic/market-based measures 29
EU initiatives in third countries 32
Support to voluntary actions: ACI airport carbon accreditation 33
4. UK national actions 37
Historic emissions and baselines 37
UK aviation forecasts 38
UK mitigation 41
5. Conclusion 50
4
Contact Information
Name of Authority: UK Department for Transport
Point of Contact: Patricia Hayes (DGCA)
Address: Great Minster House, 33 Horseferry Road, London, SW1P 4DR
Country: United Kingdom
Telephone: +44 (0)207 944 2400
Email: [email protected]
Point of Contact: Michael Clark (International Aviation, Safety and Environment
Division)
Email: [email protected]
Point of Contact: Edward Donaldson-Balan (Policy Adviser – International
Aviation and Climate Change)
Email: [email protected]
5
List of abbreviations used
ACARE – Advisory Council for Research and Innovation in Europe
ACARS – Aircraft Communications Addressing and Reporting System
ACI – Airports Council International
ALPS – Advanced Low Pressure System
ANS – Air Navigation Service
ATM – Air Traffic Movement
BAU – Business as Usual
CDM – Collaborative Decision Making
CDO – Continuous Descent Operations
CPDLC – Controller-Pilot Data Link Communications
EASA – European Aviation Safety Agency
ECAC – European Civil Aviation Conference
EEA – European Economic Area
EFTA – European Free Trade Association
EU – European Union
EU ETS – European Union Emissions Trading System
FAB – Functional Airspace Block
FANS – Future Air Navigation System
GHG – Greenhouse Gas
IADP – Innovative Aircraft Demonstrator Platform
ILUC – Indirect Land Use Change
ITD – Integrated Technology Demonstrator
JTI – Joint Technology Initiative
LSHX – Liquid Skin Heat Exchanger
LTO cycle – Landing/Take-off Cycle
MAC – Marginal Abatement Cost
OFA – Operational Focus Area
RED – Renewable Energy Directive (EU Directive 2009/28/EC)
RNP AR – Required Navigation Performance Authorization Required
RNP STAR – Required Navigation Performance Standard Arrival
6
SES – Single European Sky
SESAR – Single European Sky ATM Research
SESAR JU or SJU – Single European Sky ATM Research Joint Undertaking
SME – Small and Medium-sized Enterprises
SWAFEA - Sustainable Ways for Alternative Fuels and Energy for Aviation
TA – Transverse Activities
TE – Technology Evaluator
TMA – Terminal Manoeuvring Area
ToD – Top of Descent
TRL – Technology Readiness Level
7
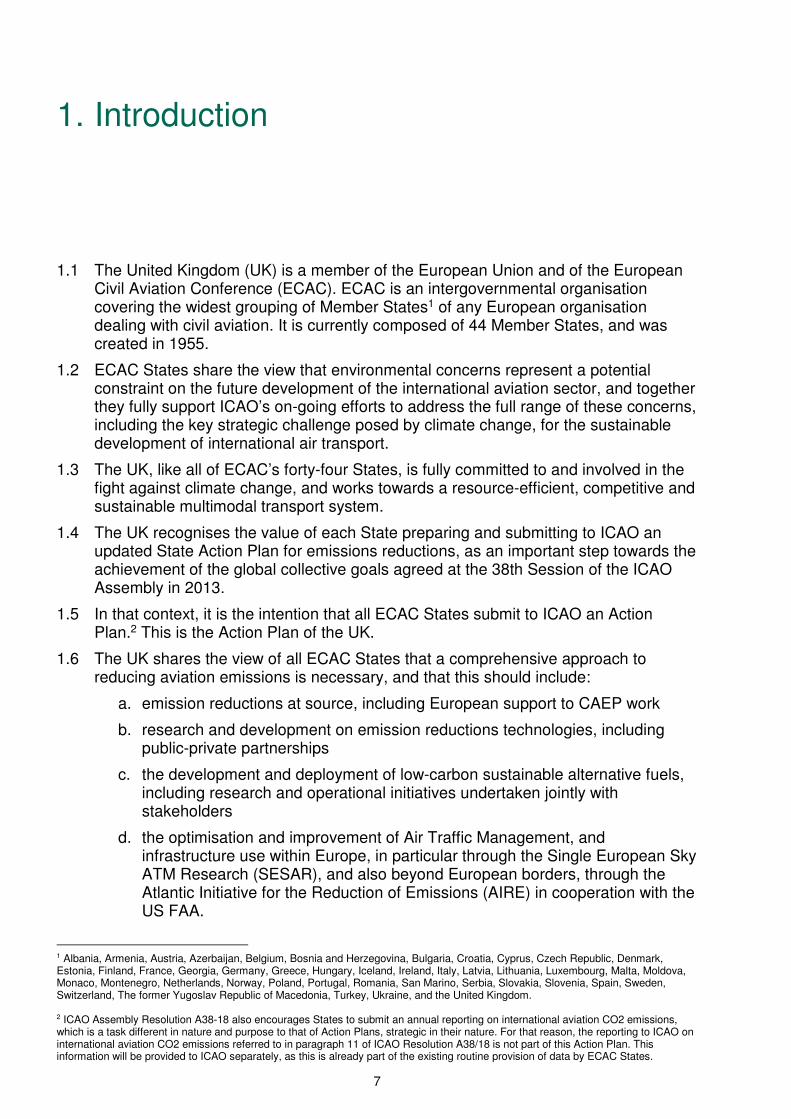
1. Introduction
1.1 The United Kingdom (UK) is a member of the European Union and of the European Civil Aviation Conference (ECAC). ECAC is an intergovernmental organisation covering the widest grouping of Member States1 of any European organisation dealing with civil aviation. It is currently composed of 44 Member States, and was created in 1955.
1.2 ECAC States share the view that environmental concerns represent a potential constraint on the future development of the international aviation sector, and together they fully support ICAO’s on-going efforts to address the full range of these concerns, including the key strategic challenge posed by climate change, for the sustainable development of international air transport.
1.3 The UK, like all of ECAC’s forty-four States, is fully committed to and involved in the fight against climate change, and works towards a resource-efficient, competitive and sustainable multimodal transport system.
1.4 The UK recognises the value of each State preparing and submitting to ICAO an updated State Action Plan for emissions reductions, as an important step towards the achievement of the global collective goals agreed at the 38th Session of the ICAO Assembly in 2013.
1.5 In that context, it is the intention that all ECAC States submit to ICAO an Action Plan.2 This is the Action Plan of the UK.
1.6 The UK shares the view of all ECAC States that a comprehensive approach to reducing aviation emissions is necessary, and that this should include:
a. emission reductions at source, including European support to CAEP work
b. research and development on emission reductions technologies, including public-private partnerships
c. the development and deployment of low-carbon sustainable alternative fuels, including research and operational initiatives undertaken jointly with stakeholders
d. the optimisation and improvement of Air Traffic Management, and infrastructure use within Europe, in particular through the Single European Sky ATM Research (SESAR), and also beyond European borders, through the Atlantic Initiative for the Reduction of Emissions (AIRE) in cooperation with the US FAA.
1 Albania, Armenia, Austria, Azerbaijan, Belgium, Bosnia and Herzegovina, Bulgaria, Croatia, Cyprus, Czech Republic, Denmark, Estonia, Finland, France, Georgia, Germany, Greece, Hungary, Iceland, Ireland, Italy, Latvia, Lithuania, Luxembourg, Malta, Moldova, Monaco, Montenegro, Netherlands, Norway, Poland, Portugal, Romania, San Marino, Serbia, Slovakia, Slovenia, Spain, Sweden, Switzerland, The former Yugoslav Republic of Macedonia, Turkey, Ukraine, and the United Kingdom. 2 ICAO Assembly Resolution A38-18 also encourages States to submit an annual reporting on international aviation CO2 emissions, which is a task different in nature and purpose to that of Action Plans, strategic in their nature. For that reason, the reporting to ICAO on international aviation CO2 emissions referred to in paragraph 11 of ICAO Resolution A38/18 is not part of this Action Plan. This information will be provided to ICAO separately, as this is already part of the existing routine provision of data by ECAC States.
8
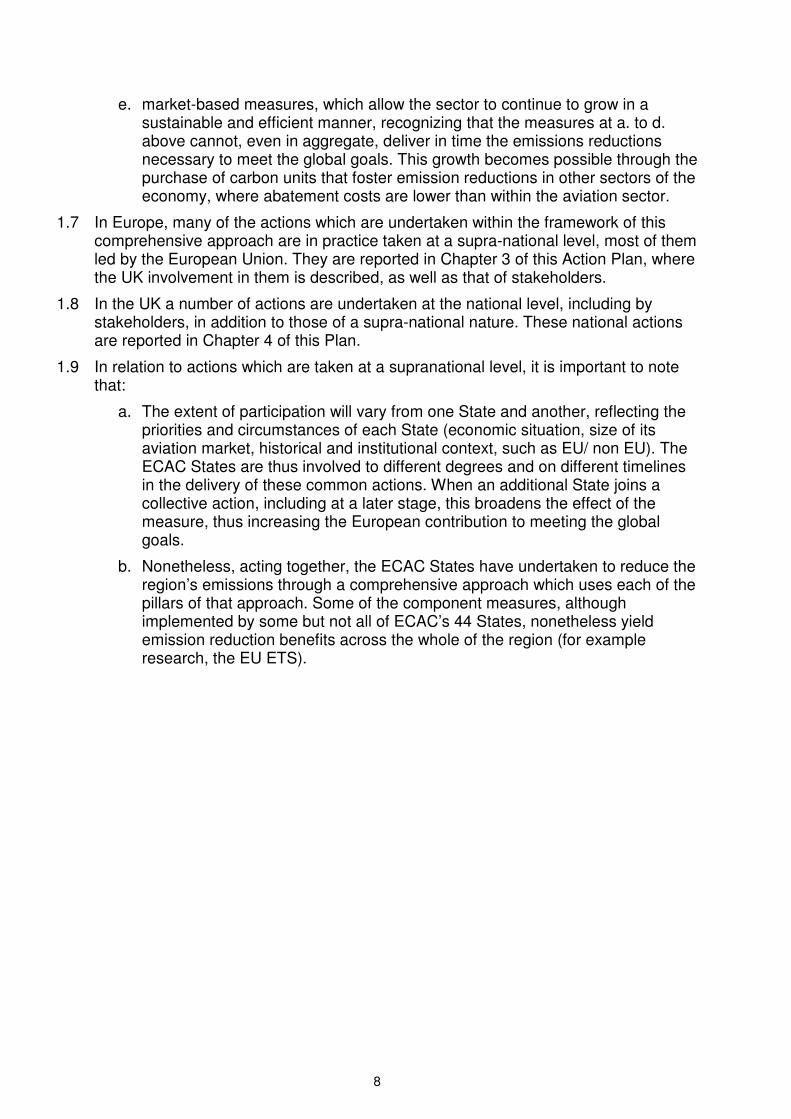
e. market-based measures, which allow the sector to continue to grow in a sustainable and efficient manner, recognizing that the measures at a. to d. above cannot, even in aggregate, deliver in time the emissions reductions necessary to meet the global goals. This growth becomes possible through the purchase of carbon units that foster emission reductions in other sectors of the economy, where abatement costs are lower than within the aviation sector.
1.7 In Europe, many of the actions which are undertaken within the framework of this comprehensive approach are in practice taken at a supra-national level, most of them led by the European Union. They are reported in Chapter 3 of this Action Plan, where the UK involvement in them is described, as well as that of stakeholders.
1.8 In the UK a number of actions are undertaken at the national level, including by stakeholders, in addition to those of a supra-national nature. These national actions are reported in Chapter 4 of this Plan.
1.9 In relation to actions which are taken at a supranational level, it is important to note that:
a. The extent of participation will vary from one State and another, reflecting the priorities and circumstances of each State (economic situation, size of its aviation market, historical and institutional context, such as EU/ non EU). The ECAC States are thus involved to different degrees and on different timelines in the delivery of these common actions. When an additional State joins a collective action, including at a later stage, this broadens the effect of the measure, thus increasing the European contribution to meeting the global goals.
b. Nonetheless, acting together, the ECAC States have undertaken to reduce the region’s emissions through a comprehensive approach which uses each of the pillars of that approach. Some of the component measures, although implemented by some but not all of ECAC’s 44 States, nonetheless yield emission reduction benefits across the whole of the region (for example research, the EU ETS).
9
2. Current state of aviation in the UK
Background on UK policy on aviation and climate change
2.1 The UK is an outward-looking nation: an island economy that for centuries has owed its prosperity to the transport and trade routes linking it with the rest of the world. Historically, it has been a leader in the aviation sector and its air links make it one of the best connected countries in the world. The UK has been keen to drive international action on climate change across all sectors and there is a growing public expectation that sustainable growth is incorporated into all growth models, including aviation. The UK government and its officials carry out analysis and research to the highest quality to inform its policy.
State of UK aviation
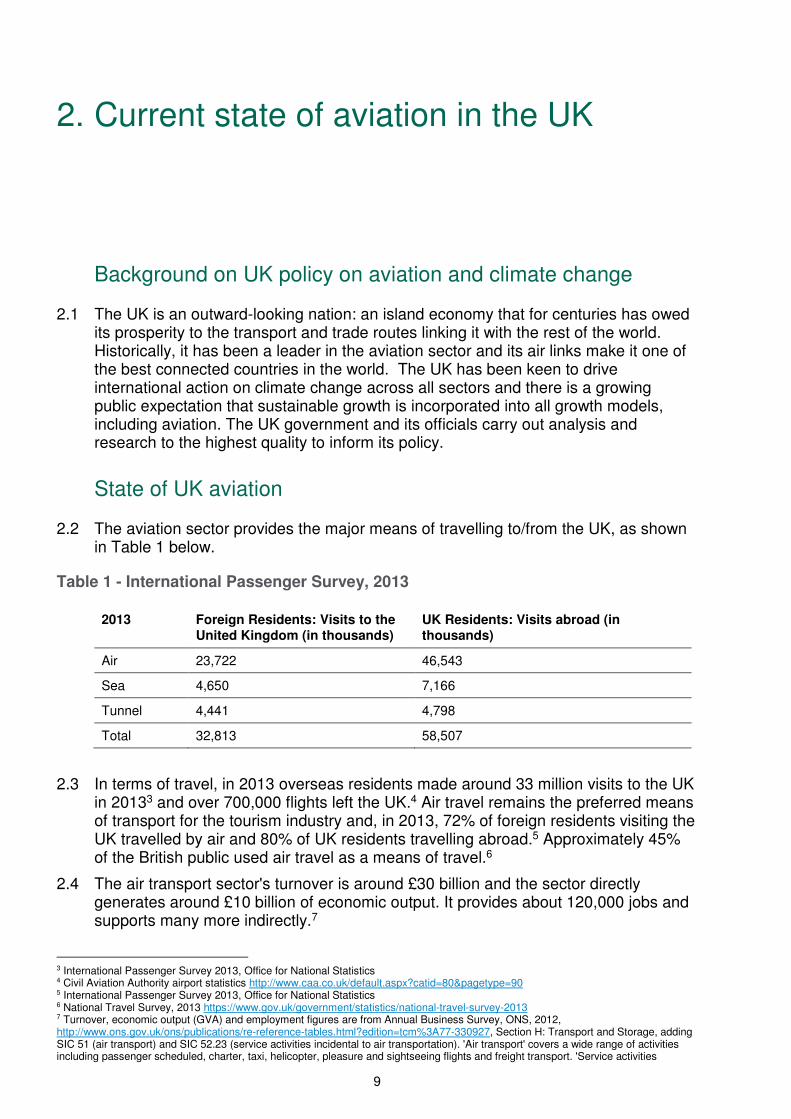
2.2 The aviation sector provides the major means of travelling to/from the UK, as shown in Table 1 below.
Table 1 - International Passenger Survey, 2013
2013 Foreign Residents: Visits to the United Kingdom (in thousands)
UK Residents: Visits abroad (in thousands)
Air 23,722 46,543
Sea 4,650 7,166
Tunnel 4,441 4,798
Total 32,813 58,507
2.3 In terms of travel, in 2013 overseas residents made around 33 million visits to the UK in 20133 and over 700,000 flights left the UK.4 Air travel remains the preferred means of transport for the tourism industry and, in 2013, 72% of foreign residents visiting the UK travelled by air and 80% of UK residents travelling abroad.5 Approximately 45% of the British public used air travel as a means of travel.6
2.4 The air transport sector's turnover is around £30 billion and the sector directly generates around £10 billion of economic output. It provides about 120,000 jobs and supports many more indirectly.7
3 International Passenger Survey 2013, Office for National Statistics 4 Civil Aviation Authority airport statistics http://www.caa.co.uk/default.aspx?catid=80&pagetype=90 5 International Passenger Survey 2013, Office for National Statistics 6 National Travel Survey, 2013 https://www.gov.uk/government/statistics/national-travel-survey-2013 7 Turnover, economic output (GVA) and employment figures are from Annual Business Survey, ONS, 2012, http://www.ons.gov.uk/ons/publications/re-reference-tables.html?edition=tcm%3A77-330927, Section H: Transport and Storage, adding SIC 51 (air transport) and SIC 52.23 (service activities incidental to air transportation). 'Air transport' covers a wide range of activities including passenger scheduled, charter, taxi, helicopter, pleasure and sightseeing flights and freight transport. 'Service activities
10
2.5 In 2013 goods worth £174 billion were shipped by air freight between the UK and non-EU countries representing over 40 per cent of the UK’s extra-EU trade by value.8
UK Airports
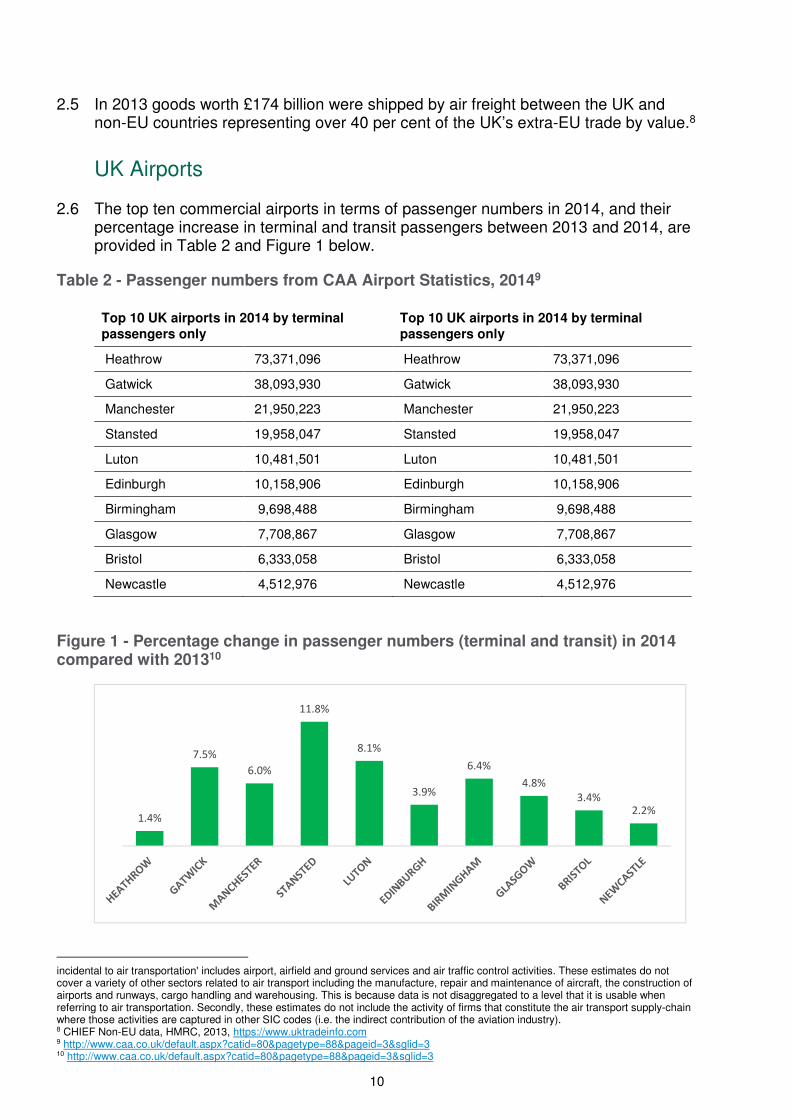
2.6 The top ten commercial airports in terms of passenger numbers in 2014, and their percentage increase in terminal and transit passengers between 2013 and 2014, are provided in Table 2 and Figure 1 below.
Table 2 - Passenger numbers from CAA Airport Statistics, 20149
Top 10 UK airports in 2014 by terminal
passengers only
Top 10 UK airports in 2014 by terminal
passengers only
Heathrow 73,371,096 Heathrow 73,371,096
Gatwick 38,093,930 Gatwick 38,093,930
Manchester 21,950,223 Manchester 21,950,223
Stansted 19,958,047 Stansted 19,958,047
Luton 10,481,501 Luton 10,481,501
Edinburgh 10,158,906 Edinburgh 10,158,906
Birmingham 9,698,488 Birmingham 9,698,488
Glasgow 7,708,867 Glasgow 7,708,867
Bristol 6,333,058 Bristol 6,333,058
Newcastle 4,512,976 Newcastle 4,512,976
Figure 1 - Percentage change in passenger numbers (terminal and transit) in 2014 compared with 201310
incidental to air transportation' includes airport, airfield and ground services and air traffic control activities. These estimates do not cover a variety of other sectors related to air transport including the manufacture, repair and maintenance of aircraft, the construction of airports and runways, cargo handling and warehousing. This is because data is not disaggregated to a level that it is usable when referring to air transportation. Secondly, these estimates do not include the activity of firms that constitute the air transport supply-chain where those activities are captured in other SIC codes (i.e. the indirect contribution of the aviation industry). 8 CHIEF Non-EU data, HMRC, 2013, https://www.uktradeinfo.com 9 http://www.caa.co.uk/default.aspx?catid=80&pagetype=88&pageid=3&sglid=3 10 http://www.caa.co.uk/default.aspx?catid=80&pagetype=88&pageid=3&sglid=3
1.4%
7.5%
6.0%
11.8%
8.1%
3.9%
6.4%
4.8%
3.4%
2.2%
11
UK aviation governance
2.7 The Department for Transport (DfT) is the Government Department which sets policy and carries out international and European negotiations. The Civil Aviation Authority (CAA) is the UK’s specialist aviation regulator. Much of the UK aviation sector is not state owned: for example the UK en-route air navigation services provider, NATS, is a public-private partnership. There is more information on governance below.
CAA11
2.8 The CAA is a public corporation established by Parliament in 1972 as an independent specialist aviation regulator and (at the time) provider of air traffic services. The UK Government requires that the CAA’s costs are met entirely from its charges on those whom it regulates. Unlike many other countries, there is no direct Government funding of the CAA’s work. The CAA has responsibility for economic, safety and consumer protection regulation, and airspace policy. In addition, it advises the Government on aviation issues, represents consumer interests, conducts economic and scientific research and produces statistical data.
2.9 The CAA's work is focused on:
a. Enhancing aviation safety performance by pursuing targeted and continuous improvements in systems, culture, processes and capability.
b. Improving choice and value for aviation consumers now and in the future by promoting competitive markets, contributing to consumers' ability to make informed decisions and protecting them where appropriate.
c. Improving environmental performance through more efficient use of airspace and make an efficient contribution to reducing the aviation industry's environmental impacts.
d. Ensuring that the CAA is an efficient and effective organisation which meets Better Regulation principles.
Department for Transport (DfT)12
2.10 The Aviation Directorate in DfT sets aviation policy and leads on aviation-related EU and global negotiations. The Directorate is also the lead on international climate change policy and liaises directly with the European Commission, foreign governments and ICAO.
NATS13
2.11 National Air Traffic Services (NATS) is the UK’s sole provider of en-route air traffic services and also provides aerodrome air traffic control at some airports. In May 2015 NATS published its latest Corporate Responsibility report, which outlines its commitment to driving the sustainable aviation agenda in the UK.14
11 http://www.caa.co.uk/ 12 https://www.gov.uk/government/organisations/department-for-transport 13 http://www.nats.co.uk/ 14 http://www.nats.aero/wp-content/uploads/2015/06/NATS-Corporate-Responsibility-report-2014-15.pdf
12
Overseas Territories and Crown Dependencies
2.12 The UK has a number of Overseas Territories and Crown Dependencies which are covered by the UK’s ratification of the Chicago Convention. DfT is responsible for ensuring that the UK’s obligations under the Convention are implemented in these territories.
2.13 The territories are:
1 Anguilla
2 Bermuda
3 British Indian Ocean Territory
4 British Virgin Islands
5 Cayman Islands
6 Falkland Islands
7 Gibraltar
8 Bailiwick of Guernsey
9 Isle of Man
10 Bailiwick of Jersey
11 Montserrat
12 Pitcairn, Henderson, Ducie and Oeno Islands
13 South Georgia and South Sandwich Islands
14 St Helena, Ascension and Tristan da Cunha
15 Turks and Caicos Islands
The UK encourages the overseas territories to consider climate change impacts when making decisions on aviation policy and where appropriate to share best practice. However, for the purposes of reporting greenhouse gas emissions for the UK’s carbon budgets the Crown Dependencies and Overseas Territories15 are excluded - only emissions within the UK are reported. While under the European Union Emissions Trading System, the overseas territories (except Gibraltar) and Crown Dependencies are considered as non-EU states.
15 https://www.gov.uk/government/uploads/system/uploads/attachment_data/file/407432/20150203_2013_Final_Emissions_statistics.pdf
13
3. Actions taken at the supra-national level
Aircraft related technology development
Aircraft emissions standards
3.1 European Member States fully support the ongoing work in ICAO’s Committee on Aviation Environmental Protection (CAEP), and welcomed the agreement of certification requirements for a global aeroplane CO2 Standard at CAEP/9 in 2013. Assembly Resolution A38-18 requests the Council to develop a global CO2 standard for aircraft aiming to finalize analyses by late 2015 and adoption by the Council in 2016. Europe continues to make a significant contribution to this task notably through the European Aviation Safety Agency (EASA) which co-leads the CO2 Task Group within CAEP’s Working Group 3, and which provides extensive technical and analytical support.
3.2 In the event that a standard, comprising of certification requirements and regulatory level, is adopted in 2016, it is expected to have an applicability date set at 2020 or beyond. In addition to being applicable to new aeroplane types, CAEP is discussing potential applicability options for in-production types. The contribution that such a standard will make towards the global aspirational goals will of course depend on the final applicability requirements and associated regulatory level that is set.
Research and development
3.3 Clean Sky is an EU Joint Technology Initiative (JTI) that aims to develop and mature breakthrough “clean technologies” for air transport. By accelerating their deployment, the JTI will contribute to Europe’s strategic environmental and social priorities, and simultaneously promote competitiveness and sustainable economic growth.
3.4 Joint Technology Initiatives are specific large scale EU research projects created by the European Commission within the 7th Framework Programme (FP7) and continued within the Horizon 2020 Framework Programme in order to allow the achievement of ambitious and complex research goals. Set up as a Public-Private Partnership between the European Commission and the European aeronautical industry, Clean Sky pulls together the research and technology resources of the European Union in a coherent programme, and contribute significantly to the ’greening’ of aviation.
14
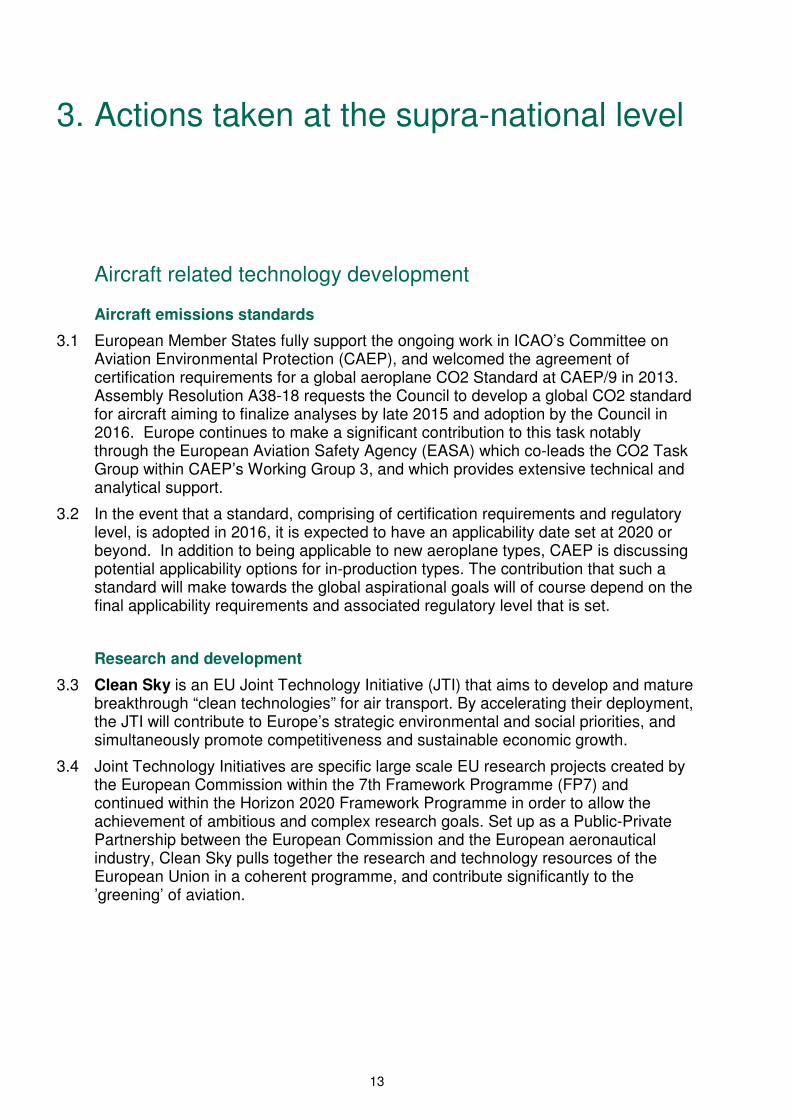
3.5 The first Clean Sky programme was set up in 2011 for a period up to 31 December 2017, with a budget of € 1.6 billion, equally shared between the European Commission and the aeronautics industry, and the aim to develop environmentally friendly technologies impacting all flying segments of commercial aviation. Clean Sky objectives for the whole programme at aircraft level are to reduce CO2 aircraft emission between 20-40%, NOx by around 60% and noise by up to 10dB compared to year 2000 aircraft.
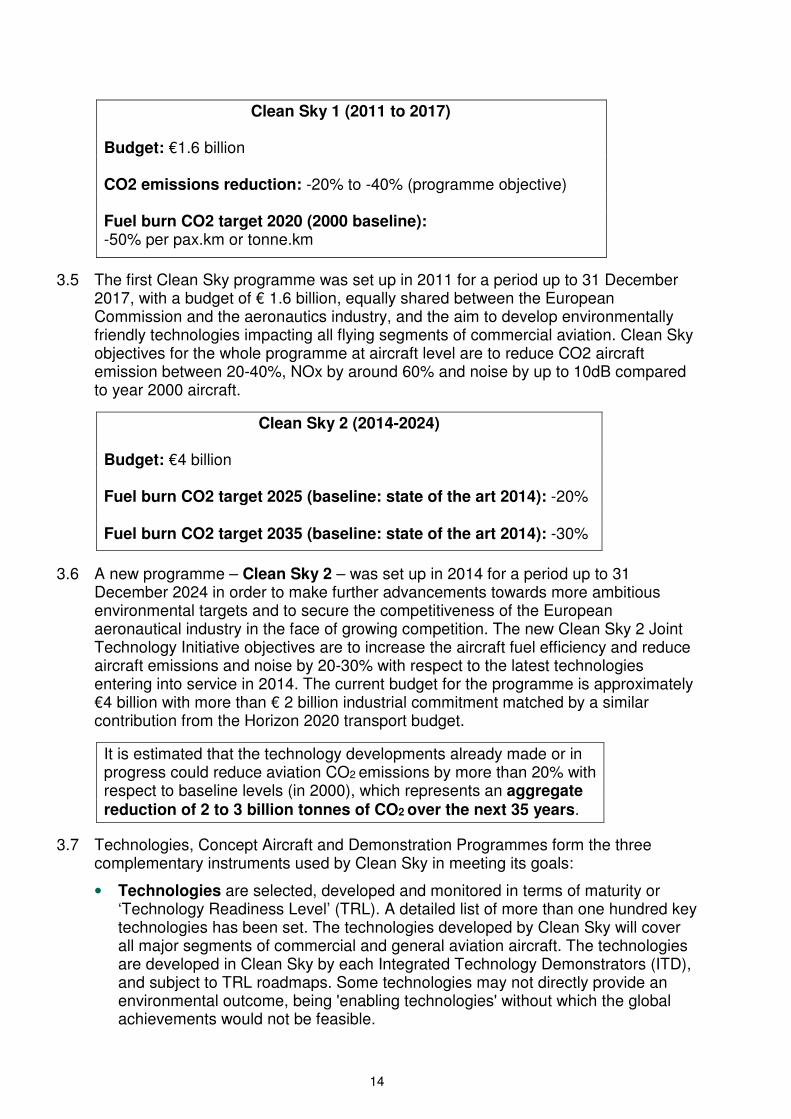
3.6 A new programme – Clean Sky 2 – was set up in 2014 for a period up to 31 December 2024 in order to make further advancements towards more ambitious environmental targets and to secure the competitiveness of the European aeronautical industry in the face of growing competition. The new Clean Sky 2 Joint Technology Initiative objectives are to increase the aircraft fuel efficiency and reduce aircraft emissions and noise by 20-30% with respect to the latest technologies entering into service in 2014. The current budget for the programme is approximately €4 billion with more than € 2 billion industrial commitment matched by a similar contribution from the Horizon 2020 transport budget.
3.7 Technologies, Concept Aircraft and Demonstration Programmes form the three complementary instruments used by Clean Sky in meeting its goals:
• Technologies are selected, developed and monitored in terms of maturity or ‘Technology Readiness Level’ (TRL). A detailed list of more than one hundred key technologies has been set. The technologies developed by Clean Sky will cover all major segments of commercial and general aviation aircraft. The technologies are developed in Clean Sky by each Integrated Technology Demonstrators (ITD), and subject to TRL roadmaps. Some technologies may not directly provide an environmental outcome, being 'enabling technologies' without which the global achievements would not be feasible.
Clean Sky 1 (2011 to 2017) Budget: €1.6 billion CO2 emissions reduction: -20% to -40% (programme objective) Fuel burn CO2 target 2020 (2000 baseline): -50% per pax.km or tonne.km
Clean Sky 2 (2014-2024) Budget: €4 billion Fuel burn CO2 target 2025 (baseline: state of the art 2014): -20% Fuel burn CO2 target 2035 (baseline: state of the art 2014): -30%
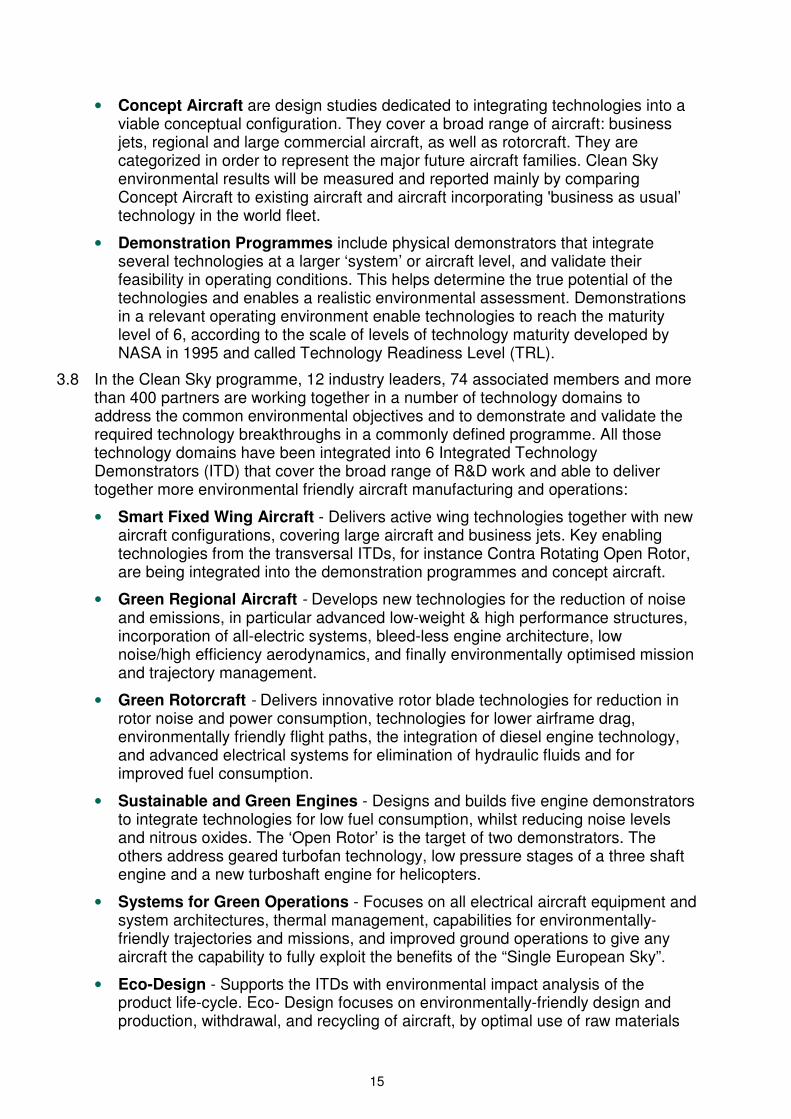
It is estimated that the technology developments already made or in progress could reduce aviation CO2 emissions by more than 20% with respect to baseline levels (in 2000), which represents an aggregate reduction of 2 to 3 billion tonnes of CO2 over the next 35 years.
15
• Concept Aircraft are design studies dedicated to integrating technologies into a viable conceptual configuration. They cover a broad range of aircraft: business jets, regional and large commercial aircraft, as well as rotorcraft. They are categorized in order to represent the major future aircraft families. Clean Sky environmental results will be measured and reported mainly by comparing Concept Aircraft to existing aircraft and aircraft incorporating 'business as usual’ technology in the world fleet.
• Demonstration Programmes include physical demonstrators that integrate several technologies at a larger ‘system’ or aircraft level, and validate their feasibility in operating conditions. This helps determine the true potential of the technologies and enables a realistic environmental assessment. Demonstrations in a relevant operating environment enable technologies to reach the maturity level of 6, according to the scale of levels of technology maturity developed by NASA in 1995 and called Technology Readiness Level (TRL).
3.8 In the Clean Sky programme, 12 industry leaders, 74 associated members and more than 400 partners are working together in a number of technology domains to address the common environmental objectives and to demonstrate and validate the required technology breakthroughs in a commonly defined programme. All those technology domains have been integrated into 6 Integrated Technology Demonstrators (ITD) that cover the broad range of R&D work and able to deliver together more environmental friendly aircraft manufacturing and operations:
• Smart Fixed Wing Aircraft - Delivers active wing technologies together with new aircraft configurations, covering large aircraft and business jets. Key enabling technologies from the transversal ITDs, for instance Contra Rotating Open Rotor, are being integrated into the demonstration programmes and concept aircraft.
• Green Regional Aircraft - Develops new technologies for the reduction of noise and emissions, in particular advanced low-weight & high performance structures, incorporation of all-electric systems, bleed-less engine architecture, low noise/high efficiency aerodynamics, and finally environmentally optimised mission and trajectory management.
• Green Rotorcraft - Delivers innovative rotor blade technologies for reduction in rotor noise and power consumption, technologies for lower airframe drag, environmentally friendly flight paths, the integration of diesel engine technology, and advanced electrical systems for elimination of hydraulic fluids and for improved fuel consumption.
• Sustainable and Green Engines - Designs and builds five engine demonstrators to integrate technologies for low fuel consumption, whilst reducing noise levels and nitrous oxides. The ‘Open Rotor’ is the target of two demonstrators. The others address geared turbofan technology, low pressure stages of a three shaft engine and a new turboshaft engine for helicopters.
• Systems for Green Operations - Focuses on all electrical aircraft equipment and system architectures, thermal management, capabilities for environmentally-friendly trajectories and missions, and improved ground operations to give any aircraft the capability to fully exploit the benefits of the “Single European Sky”.
• Eco-Design - Supports the ITDs with environmental impact analysis of the product life-cycle. Eco- Design focuses on environmentally-friendly design and production, withdrawal, and recycling of aircraft, by optimal use of raw materials
16
and energies, thus improving the environmental impact of the entire aircraft life-cycle.
3.9 In addition, the Technology Evaluator programme, co-led by DLR and Thales, is a set of numerical models predicting the local and global environmental impact of developed technologies and allows independent analysis of the projects. Part of the Clean Sky programme is performed by partners selected through open calls for proposals addressing specific tasks which fit into the overall technical Work Programme and time schedule.
3.10 By 2014 most down-selections of key technologies have been completed for integration in demonstrators that will enter the phase of detailed design, manufacturing and testing. Several demonstrators have passed the design phase and have started testing successfully. An Advanced Lip Extended Acoustic Panel, the technology to reduce the Fan noise of large turbofan engine was flown and validated in operational conditions in 2010 with an Airbus A380-800 aircraft. A flight test with Falcon F7X, which validated the technology to visualize laminar flow structure in flight by an infrared camera, was already performed in 2010. Two flight tests started in the last quarter of 2014, namely in the Sustainable and Green Engines ITD with SAGE 3 flight testing on Advanced Low Pressure System (ALPS) configuration and the flight tests of an experimental Liquid Skin Heat Exchanger (LSHX) in the System for Green Operations ITD.
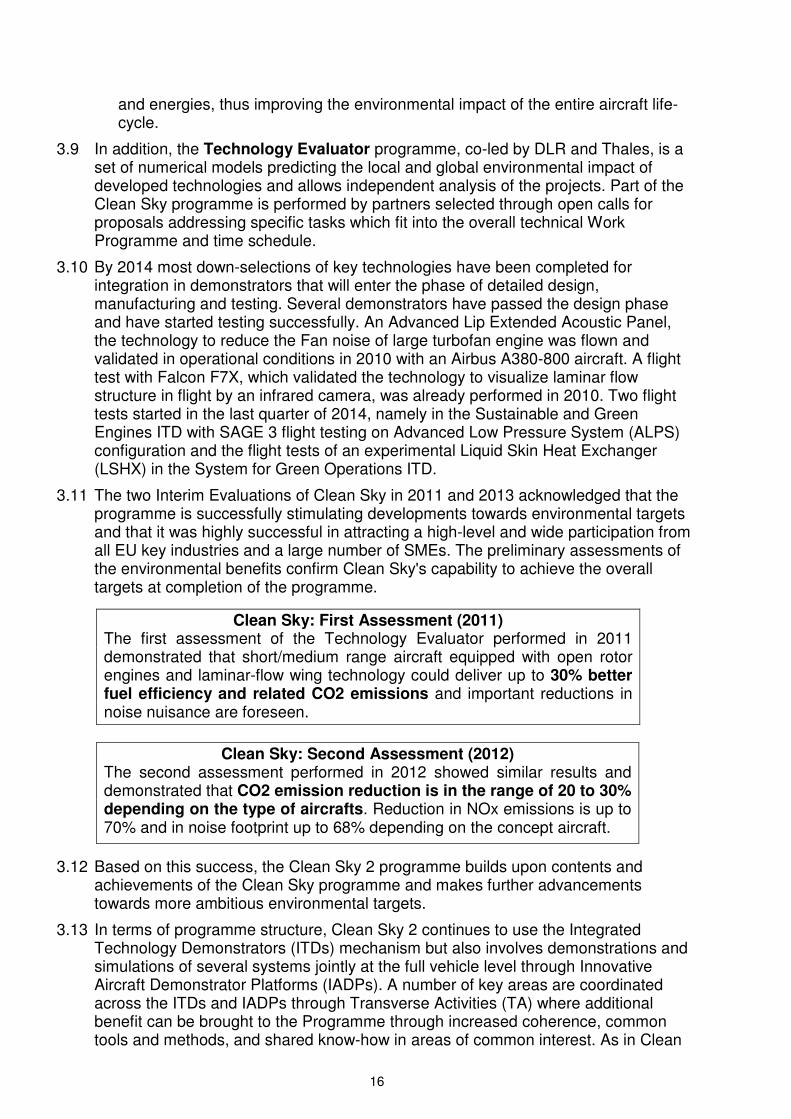
3.11 The two Interim Evaluations of Clean Sky in 2011 and 2013 acknowledged that the programme is successfully stimulating developments towards environmental targets and that it was highly successful in attracting a high-level and wide participation from all EU key industries and a large number of SMEs. The preliminary assessments of the environmental benefits confirm Clean Sky's capability to achieve the overall targets at completion of the programme.
3.12 Based on this success, the Clean Sky 2 programme builds upon contents and achievements of the Clean Sky programme and makes further advancements towards more ambitious environmental targets.
3.13 In terms of programme structure, Clean Sky 2 continues to use the Integrated Technology Demonstrators (ITDs) mechanism but also involves demonstrations and simulations of several systems jointly at the full vehicle level through Innovative Aircraft Demonstrator Platforms (IADPs). A number of key areas are coordinated across the ITDs and IADPs through Transverse Activities (TA) where additional benefit can be brought to the Programme through increased coherence, common tools and methods, and shared know-how in areas of common interest. As in Clean
Clean Sky: First Assessment (2011) The first assessment of the Technology Evaluator performed in 2011 demonstrated that short/medium range aircraft equipped with open rotor engines and laminar-flow wing technology could deliver up to 30% better fuel efficiency and related CO2 emissions and important reductions in noise nuisance are foreseen.
Clean Sky: Second Assessment (2012) The second assessment performed in 2012 showed similar results and demonstrated that CO2 emission reduction is in the range of 20 to 30% depending on the type of aircrafts. Reduction in NOx emissions is up to 70% and in noise footprint up to 68% depending on the concept aircraft.
17
Sky, a dedicated monitoring function - the Technology Evaluator (TE) - is incorporated in Clean Sky 2.
• Large Passenger Aircraft IADP – A TRL demonstration of the best technologies to accomplish the combined key ACARE goals with respect to the environment, fulfilling future market needs and improving the competitiveness of future products.
• Regional Aircraft IADP – Focuses on demonstrating and validating key technologies that will enable a 90-seat class turboprop aircraft to deliver breakthrough economic and environmental performance and superior passenger experience.
• Fast Rotorcraft IADP – Consists of two separate demonstrators, the NextGenCTR tilt-rotor and the FastCraft compound helicopter. These two fast rotorcraft concepts aim to deliver superior vehicle versatility and performance.
• Airframe ITD – Demonstrates, as one of the key contributors to the different IADPs flight demonstrators, advanced and innovative airframe structures like a more efficient wing with natural laminar flow, optimised control surfaces, control systems and embedded systems, highly integrated in metallic and advanced composites structures. It will also test novel engine integration strategies and investigate innovative fuselage structures.
• Engines ITD – Focuses on activities to validate advanced and more radical engine architectures.
• Systems ITD – Develops and builds highly integrated, high TRL demonstrators in major areas such as power management, cockpit, wing, landing gear, to address the needs of future generation aircraft in terms of maturation, demonstration and Innovation.
• Small Air Transport TA – Aims at developing, validating and integrating key technologies on small aircraft demonstrators up to TRL6 and to revitalise an important segment of the aeronautics sector that can bring key new mobility solutions.
• Eco-Design TA – Coordinating research geared towards high eco-compliance in air vehicles over their product life and heightening the stewardship in intelligent Re-use, Recycling and advanced services.
3.14 In addition, the Technology Evaluator will continue and be upgraded to assess technological progress routinely and to evaluate the performance potential of Clean Sky 2 technologies at both vehicle and aggregate levels (airports and air traffic systems).
Alternative fuels
European Advanced Biofuels Flightpath
3.15 Within the European Union, Directive 2009/28/EC on the promotion of the use of energy from renewable sources (“the Renewable Energy Directive” – RED) established mandatory targets to be achieved by 2020 for a 20% overall share of renewable energy in the EU and a 10% share for renewable energy in the transport
18
sector. Furthermore, sustainability criteria for biofuels to be counted towards that target were established.16
3.16 In February 2009, the European Commission's Directorate General for Energy and Transport initiated the SWAFEA (Sustainable Ways for Alternative Fuels and Energy for Aviation) study to investigate the feasibility and the impact of the use of alternative fuels in aviation.
3.17 The SWAFEA final report was published in July 2011. It provides a comprehensive analysis on the prospects for alternative fuels in aviation, including an integrated analysis of technical feasibility, environmental sustainability (based on the sustainability criteria of the EU Directive on renewable energy17) and economic aspects. It includes a number of recommendations on the steps that should be taken to promote the take-up of sustainable biofuels for aviation in Europe.
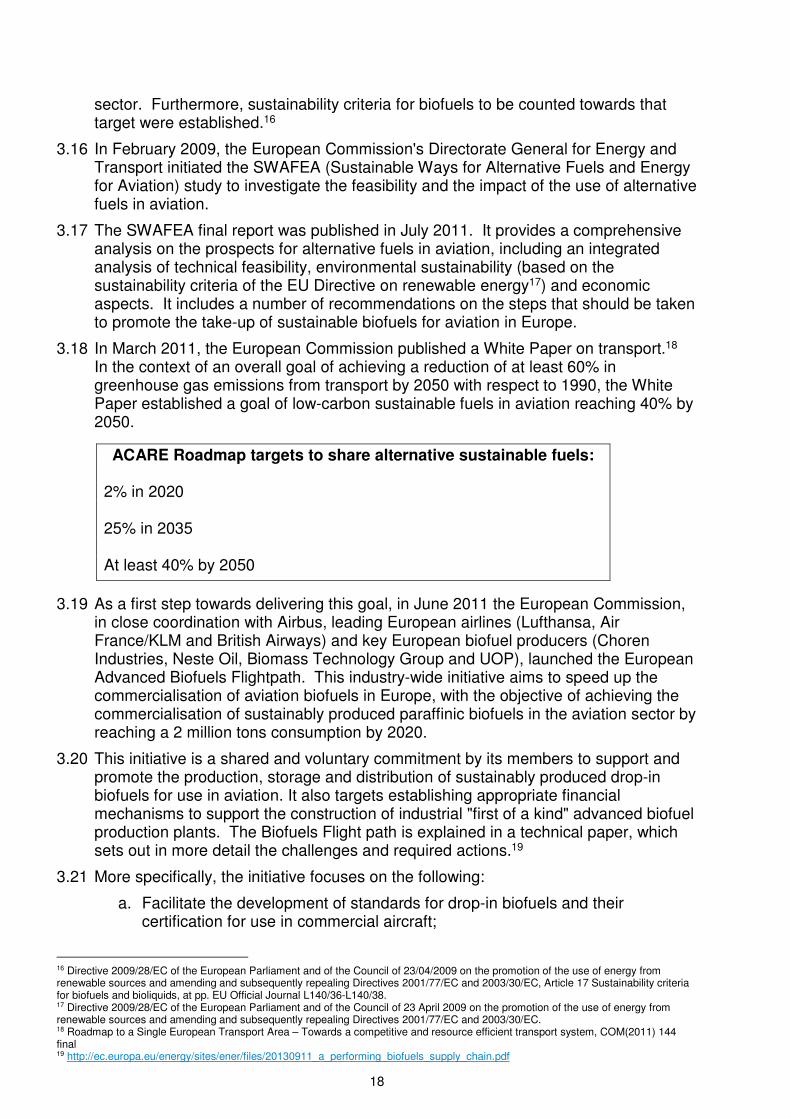
3.18 In March 2011, the European Commission published a White Paper on transport.18 In the context of an overall goal of achieving a reduction of at least 60% in greenhouse gas emissions from transport by 2050 with respect to 1990, the White Paper established a goal of low-carbon sustainable fuels in aviation reaching 40% by 2050.
3.19 As a first step towards delivering this goal, in June 2011 the European Commission, in close coordination with Airbus, leading European airlines (Lufthansa, Air France/KLM and British Airways) and key European biofuel producers (Choren Industries, Neste Oil, Biomass Technology Group and UOP), launched the European Advanced Biofuels Flightpath. This industry-wide initiative aims to speed up the commercialisation of aviation biofuels in Europe, with the objective of achieving the commercialisation of sustainably produced paraffinic biofuels in the aviation sector by reaching a 2 million tons consumption by 2020.
3.20 This initiative is a shared and voluntary commitment by its members to support and promote the production, storage and distribution of sustainably produced drop-in biofuels for use in aviation. It also targets establishing appropriate financial mechanisms to support the construction of industrial "first of a kind" advanced biofuel production plants. The Biofuels Flight path is explained in a technical paper, which sets out in more detail the challenges and required actions.19
3.21 More specifically, the initiative focuses on the following:
a. Facilitate the development of standards for drop-in biofuels and their certification for use in commercial aircraft;
16 Directive 2009/28/EC of the European Parliament and of the Council of 23/04/2009 on the promotion of the use of energy from renewable sources and amending and subsequently repealing Directives 2001/77/EC and 2003/30/EC, Article 17 Sustainability criteria for biofuels and bioliquids, at pp. EU Official Journal L140/36-L140/38. 17 Directive 2009/28/EC of the European Parliament and of the Council of 23 April 2009 on the promotion of the use of energy from renewable sources and amending and subsequently repealing Directives 2001/77/EC and 2003/30/EC. 18 Roadmap to a Single European Transport Area – Towards a competitive and resource efficient transport system, COM(2011) 144 final 19 http://ec.europa.eu/energy/sites/ener/files/20130911_a_performing_biofuels_supply_chain.pdf
ACARE Roadmap targets to share alternative sustainable fuels: 2% in 2020 25% in 2035 At least 40% by 2050
19
b. Work together with the full supply chain to further develop worldwide accepted sustainability certification frameworks
c. Agree on biofuel take-off arrangements over a defined period of time and at a reasonable cost;
d. Promote appropriate public and private actions to ensure the market uptake of paraffinic biofuels by the aviation sector;
e. Establish financing structures to facilitate the realisation of 2nd Generation biofuel projects;
f. Accelerate targeted research and innovation for advanced biofuel technologies, and especially algae.
g. Take concrete actions to inform the European citizen of the benefits of replacing kerosene by certified sustainable biofuels.
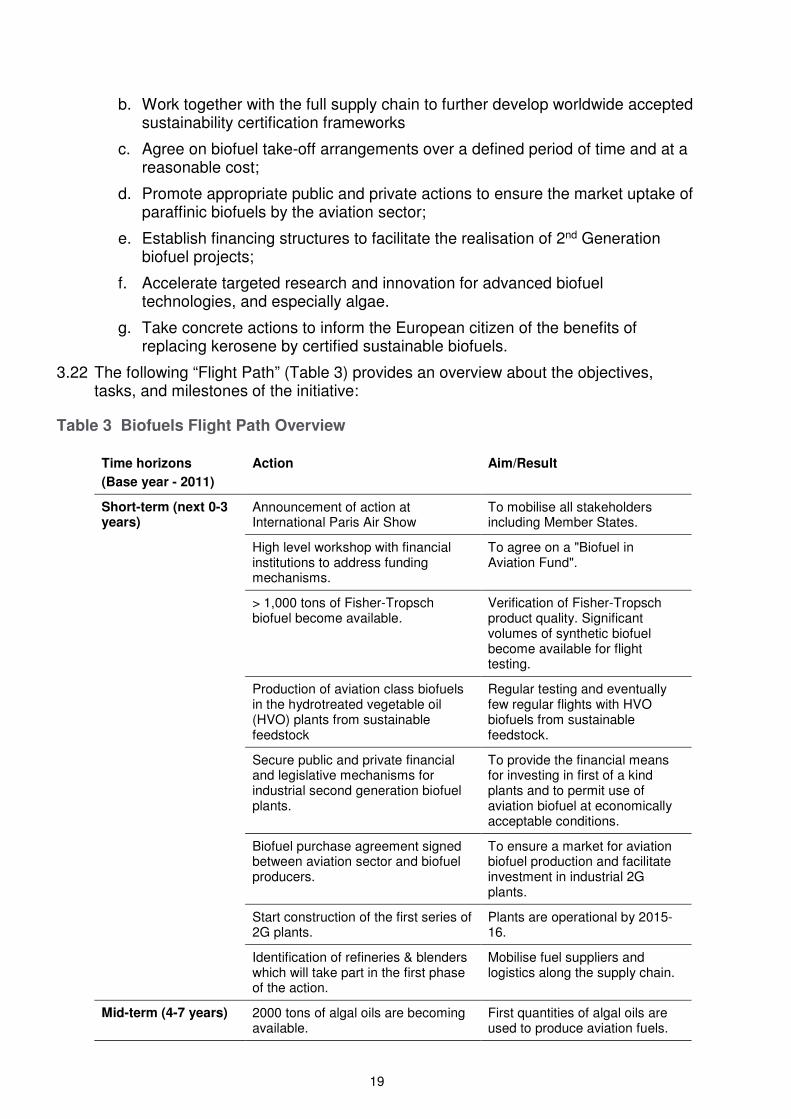
3.22 The following “Flight Path” (Table 3) provides an overview about the objectives, tasks, and milestones of the initiative:
Table 3 Biofuels Flight Path Overview
Time horizons
(Base year - 2011)
Action Aim/Result
Short-term (next 0-3 years)
Announcement of action at International Paris Air Show
To mobilise all stakeholders including Member States.
High level workshop with financial institutions to address funding mechanisms.
To agree on a "Biofuel in Aviation Fund".
> 1,000 tons of Fisher-Tropsch biofuel become available.
Verification of Fisher-Tropsch product quality. Significant volumes of synthetic biofuel become available for flight testing.
Production of aviation class biofuels in the hydrotreated vegetable oil (HVO) plants from sustainable feedstock
Regular testing and eventually few regular flights with HVO biofuels from sustainable feedstock.
Secure public and private financial and legislative mechanisms for industrial second generation biofuel plants.
To provide the financial means for investing in first of a kind plants and to permit use of aviation biofuel at economically acceptable conditions.
Biofuel purchase agreement signed between aviation sector and biofuel producers.
To ensure a market for aviation biofuel production and facilitate investment in industrial 2G plants.
Start construction of the first series of 2G plants.
Plants are operational by 2015-16.
Identification of refineries & blenders which will take part in the first phase of the action.
Mobilise fuel suppliers and logistics along the supply chain.
Mid-term (4-7 years) 2000 tons of algal oils are becoming available.
First quantities of algal oils are used to produce aviation fuels.
20
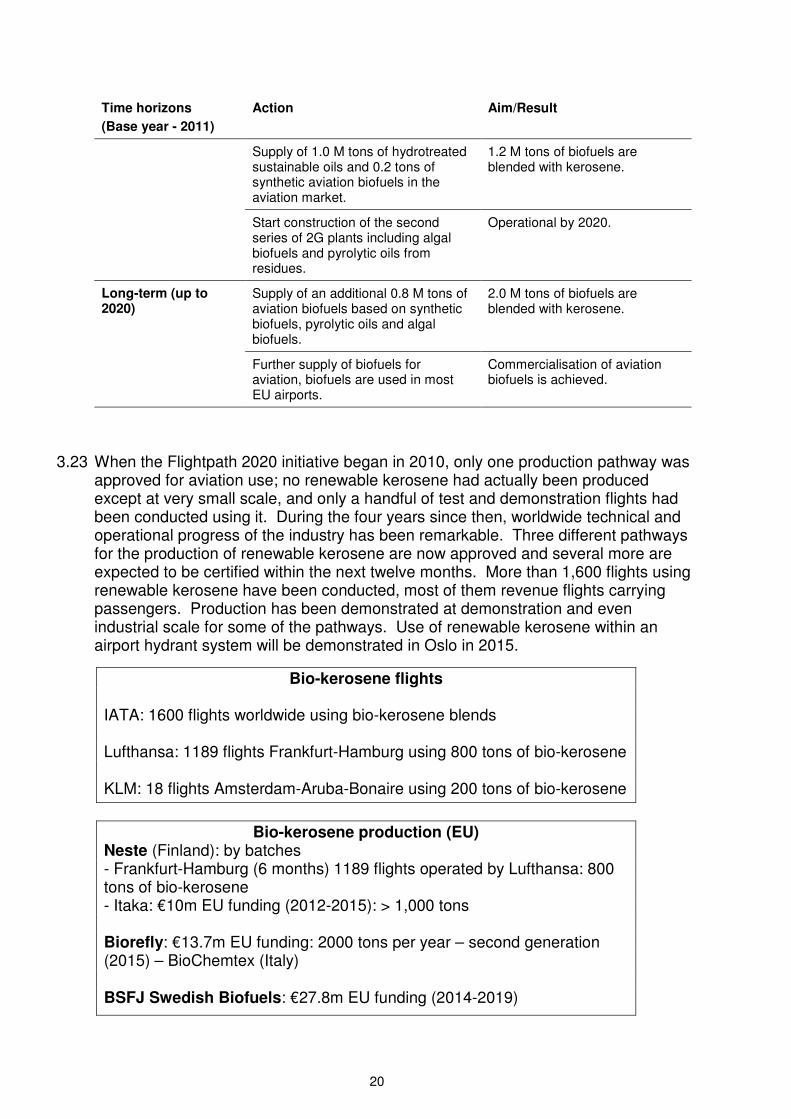
Time horizons
(Base year - 2011)
Action Aim/Result
Supply of 1.0 M tons of hydrotreated sustainable oils and 0.2 tons of synthetic aviation biofuels in the aviation market.
1.2 M tons of biofuels are blended with kerosene.
Start construction of the second series of 2G plants including algal biofuels and pyrolytic oils from residues.
Operational by 2020.
Long-term (up to 2020)
Supply of an additional 0.8 M tons of aviation biofuels based on synthetic biofuels, pyrolytic oils and algal biofuels.
2.0 M tons of biofuels are blended with kerosene.
Further supply of biofuels for aviation, biofuels are used in most EU airports.
Commercialisation of aviation biofuels is achieved.
3.23 When the Flightpath 2020 initiative began in 2010, only one production pathway was approved for aviation use; no renewable kerosene had actually been produced except at very small scale, and only a handful of test and demonstration flights had been conducted using it. During the four years since then, worldwide technical and operational progress of the industry has been remarkable. Three different pathways for the production of renewable kerosene are now approved and several more are expected to be certified within the next twelve months. More than 1,600 flights using renewable kerosene have been conducted, most of them revenue flights carrying passengers. Production has been demonstrated at demonstration and even industrial scale for some of the pathways. Use of renewable kerosene within an airport hydrant system will be demonstrated in Oslo in 2015.
Bio-kerosene flights IATA: 1600 flights worldwide using bio-kerosene blends Lufthansa: 1189 flights Frankfurt-Hamburg using 800 tons of bio-kerosene KLM: 18 flights Amsterdam-Aruba-Bonaire using 200 tons of bio-kerosene
Bio-kerosene production (EU) Neste (Finland): by batches - Frankfurt-Hamburg (6 months) 1189 flights operated by Lufthansa: 800 tons of bio-kerosene - Itaka: €10m EU funding (2012-2015): > 1,000 tons Biorefly: €13.7m EU funding: 2000 tons per year – second generation (2015) – BioChemtex (Italy) BSFJ Swedish Biofuels: €27.8m EU funding (2014-2019)
21
Research and Development projects on alternative fuels in aviation
3.24 In the time frame 2011-2016, 3 projects have been funded by the FP7 Research and Innovation program of the EU.
3.25 ITAKA: €10m EU funding (2012-2015) with the aim of assessing the potential of a specific crop (camelina) for providing jet fuel. The project aims entail the testing of the whole chain from field to fly, assessing the potential beyond the data gathered in lab experiments, gathering experiences on related certification, distribution and on economic aspects. As feedstock, ITAKA targets European camelina oil and used cooking oil, in order to meet a minimum of 60% GHG emissions savings compared to the fossil fuel jetA1.
3.26 SOLAR-JET: this project has demonstrated the possibility of producing jet-fuel from CO2 and water. This was done by coupling a two-step solar thermochemical cycle based on non-stoichiometric ceria redox reactions with the Fischer-Tropsch process. This successful demonstration is further complemented by assessments of the chemical suitability of the solar kerosene, identification of technological gaps, and determination of the technological and economical potentials.
3.27 Core-JetFuel: €1.2m EU funding (2013-2017) this action evaluates the research and innovation “landscape” in order to develop and implement a strategy for sharing information, for coordinating initiatives, projects and results and to identify needs in research, standardisation, innovation/deployment, and policy measures at European level. Bottlenecks of research and innovation will be identified and, where appropriate, recommendations for the European Commission will be elaborated with respect to re-orientation and re-definition of priorities in the funding strategy. The consortium covers the entire alternative fuel production chain in four domains: Feedstock and sustainability; conversion technologies and radical concepts; technical compatibility, certification and deployment; policies, incentives and regulation. CORE-JetFuel ensures cooperation with other European, international and national initiatives and with the key stakeholders in the field. The expected benefits are enhanced knowledge of decision makers, support for maintaining coherent research policies and the promotion of a better understanding of future investments in aviation fuel research and innovation.
3.28 In 2015, the European Commission is launching projects under the Horizon 2020 research programme with capacities of the order of several 1000 tons per year.
Improved air traffic management and infrastructure use
The EU's Single European Sky Initiative and SESAR
SESAR Project
3.29 The European Union's Single European Sky (SES) policy aims to reform Air Traffic Management (ATM) in Europe in order to enhance its performance in terms of its capacity to manage larger volume of flights in a safer, more cost-efficient and environmental friendly manner.
3.30 The SES aims at achieving 4 high level performance objectives (referred to 2005 context):
• Triple capacity of ATM systems
• Reduce ATM costs by 50%
22
• Increase safety by a factor of 10
• Reduce the environmental impact by 10% per flight
3.31 SESAR, the technological pillar of the Single European Sky, contributes to the Single Sky's performance targets by defining, developing, validating and deploying innovative technological and operational solutions for managing air traffic in a more efficient manner.
3.32 SESAR contribution to the SES high-level goals set by the Commission are continuously reviewed by the SESAR JU and kept up to date in the ATM Master Plan.
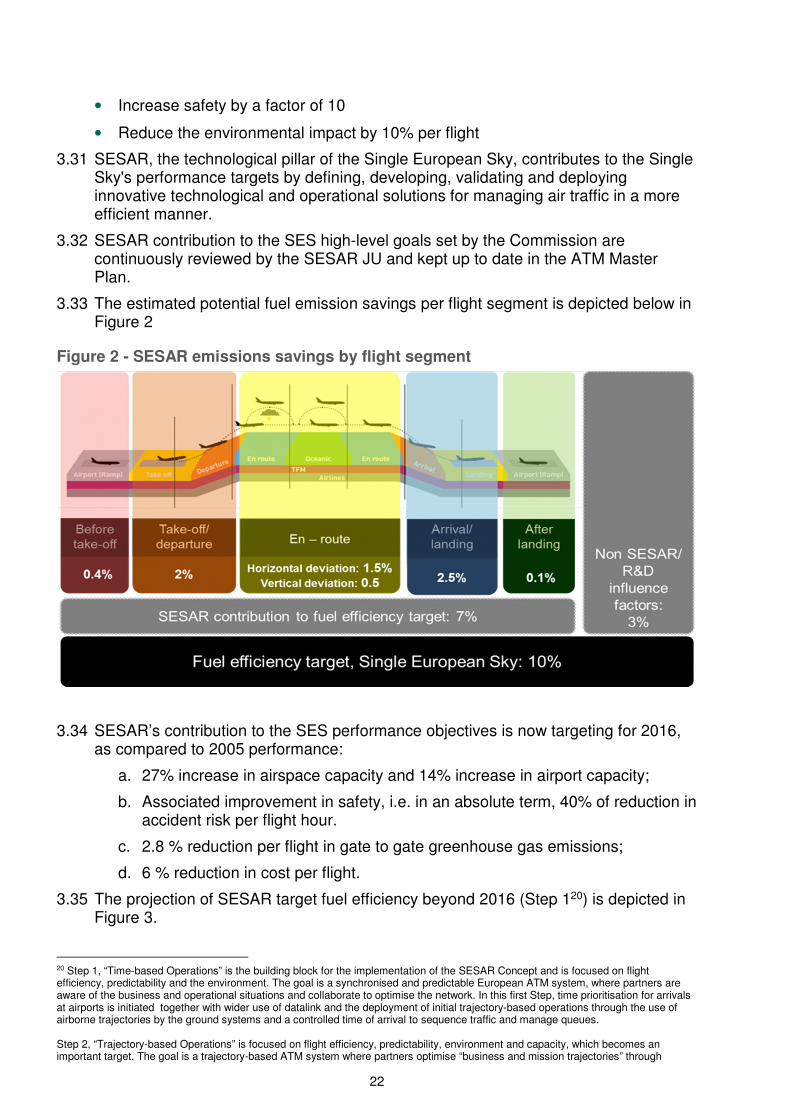
3.33 The estimated potential fuel emission savings per flight segment is depicted below in Figure 2
Figure 2 - SESAR emissions savings by flight segment
3.34 SESAR’s contribution to the SES performance objectives is now targeting for 2016, as compared to 2005 performance:
a. 27% increase in airspace capacity and 14% increase in airport capacity;
b. Associated improvement in safety, i.e. in an absolute term, 40% of reduction in accident risk per flight hour.
c. 2.8 % reduction per flight in gate to gate greenhouse gas emissions;
d. 6 % reduction in cost per flight.
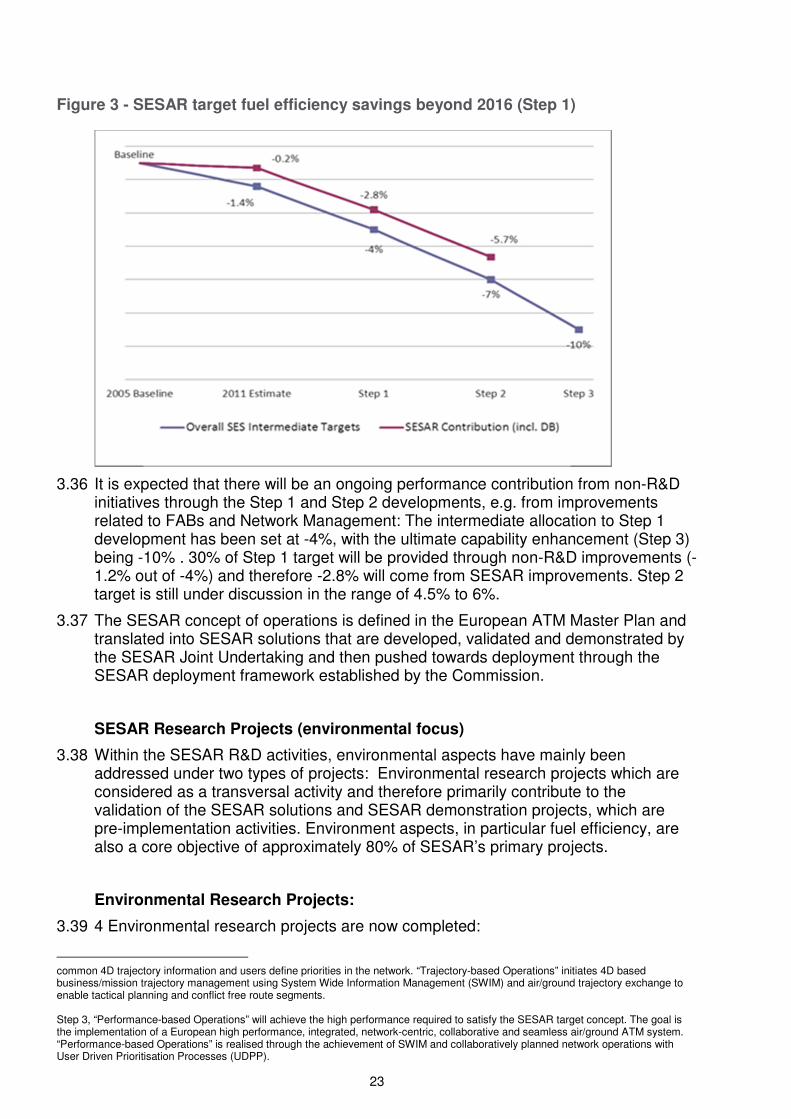
3.35 The projection of SESAR target fuel efficiency beyond 2016 (Step 120) is depicted in Figure 3.
20 Step 1, “Time-based Operations” is the building block for the implementation of the SESAR Concept and is focused on flight efficiency, predictability and the environment. The goal is a synchronised and predictable European ATM system, where partners are aware of the business and operational situations and collaborate to optimise the network. In this first Step, time prioritisation for arrivals at airports is initiated together with wider use of datalink and the deployment of initial trajectory-based operations through the use of airborne trajectories by the ground systems and a controlled time of arrival to sequence traffic and manage queues. Step 2, “Trajectory-based Operations” is focused on flight efficiency, predictability, environment and capacity, which becomes an important target. The goal is a trajectory-based ATM system where partners optimise “business and mission trajectories” through
23
Figure 3 - SESAR target fuel efficiency savings beyond 2016 (Step 1)
3.36 It is expected that there will be an ongoing performance contribution from non-R&D initiatives through the Step 1 and Step 2 developments, e.g. from improvements related to FABs and Network Management: The intermediate allocation to Step 1 development has been set at -4%, with the ultimate capability enhancement (Step 3) being -10% . 30% of Step 1 target will be provided through non-R&D improvements (-1.2% out of -4%) and therefore -2.8% will come from SESAR improvements. Step 2 target is still under discussion in the range of 4.5% to 6%.
3.37 The SESAR concept of operations is defined in the European ATM Master Plan and translated into SESAR solutions that are developed, validated and demonstrated by the SESAR Joint Undertaking and then pushed towards deployment through the SESAR deployment framework established by the Commission.
SESAR Research Projects (environmental focus)
3.38 Within the SESAR R&D activities, environmental aspects have mainly been addressed under two types of projects: Environmental research projects which are considered as a transversal activity and therefore primarily contribute to the validation of the SESAR solutions and SESAR demonstration projects, which are pre-implementation activities. Environment aspects, in particular fuel efficiency, are also a core objective of approximately 80% of SESAR’s primary projects.
Environmental Research Projects:
3.39 4 Environmental research projects are now completed:
common 4D trajectory information and users define priorities in the network. “Trajectory-based Operations” initiates 4D based business/mission trajectory management using System Wide Information Management (SWIM) and air/ground trajectory exchange to enable tactical planning and conflict free route segments. Step 3, “Performance-based Operations” will achieve the high performance required to satisfy the SESAR target concept. The goal is the implementation of a European high performance, integrated, network-centric, collaborative and seamless air/ground ATM system. “Performance-based Operations” is realised through the achievement of SWIM and collaboratively planned network operations with User Driven Prioritisation Processes (UDPP).
24
• Project 16.03.01 dealing with Development of the Environment validation framework (Models and Tools);
• Project 16.03.02 dealing with the Development of environmental metrics;
• Project 16.03.03 dealing with the Development of a framework to establish interdependencies and trade-off with other performance areas;
• Project 16.03.07 dealing with Future regulatory scenarios and risks.
3.40 In the context of 16.03.01 the IMPACT tool was developed providing SESAR primary projects with the means to conduct fuel efficiency, aircraft emissions and noise assessments at the same time, from a web based platform, using the same aircraft performance assumptions. IMPACT successfully passed the CAEP MDG V&V process (Modelling and Database Group Verification and Validation process). Project 16.06.03 has also ensured the continuous development/maintenance of other tools covering aircraft GHG assessment (AEM), and local air quality issues (Open-ALAQS). It should be noted that these tools have been developed for covering the research and the future deployment phase of SESAR.
3.41 In the context of 16.03.02 a set of metrics for assessing GHG emissions, noise and airport local air quality has been documented. The metrics identified by 16.03.02 and not subject of specific IPRs will be gradually implemented into IMPACT.
3.42 Project 16.03.03 has produced a comprehensive analysis on the issues related to environmental interdependencies and trade-offs.
3.43 Project 16.03.07 has conducted a review of current environmental regulatory measures as applicable to ATM and SESAR deployment, and another report presenting an analysis of environmental regulatory and physical risk scenarios in the form of user guidance. It identifies both those Operation Focus Areas (OFA) and Key Performance Areas which are most affected by these risks and those OFAs which can contribute to mitigating them. It also provides a gap analysis identifying knowledge gaps or uncertainties which require further monitoring, research or analysis.
3.44 The only Environmental Research project that is still ongoing in the current SESAR project is the SESAR Environment support and coordination project which ensures the coordination and facilitation of all the Environmental research projects activities while supporting the SESAR/AIRE/DEMO projects in the application of the material produced by the research projects. In particular, this project delivered an Environment Impact Assessment methodology providing guidance on how to conduct an assessment, which metrics to use and do and don’ts for each type of validation exercise with specific emphasis on flight trials.
3.45 New environmental research projects will be defined in the scope of SESAR 2020 work programme to meet the SESAR environmental targets in accordance to the ATM Master Plan.
Other Research Projects which contribute to SESAR's environmental target:
3.46 A large number of SESAR research concepts and projects from exploratory research to preindustrial phase can bring environmental benefits. Full 4D trajectory taking due account of meteorological conditions, integrated departure, surface and arrival manager, airport optimised green taxiing trajectories, combined xLS RNAV operations in particular should bring significant reduction in fuel consumption. Also to
25
be further investigated the potential for remote control towers to contribute positively to the aviation environmental footprint.
3.47 Remotely Piloted Aircraft (RPAS) systems integration in controlled airspace will be an important area of SESAR 2020 work programme and although the safety aspects are considered to be the most challenging ones and will therefore mobilise most of research effort, the environmental aspects of these new operations operating from and to non-airport locations would also deserve specific attention in terms of emissions, noise and potentially visual annoyance.
SESAR demonstration projects:
3.48 AIRE: The Atlantic Interoperability Initiative to Reduce Emissions (AIRE) is a programme designed to improve energy efficiency and lower engine emissions and aircraft noise in cooperation with the US FAA based on existing technologies. The SESAR JU is responsible for its management from a European perspective.
3.49 Under this initiative ATM stakeholders work collaboratively to perform integrated flight trials and demonstrations validating solutions for the reduction of CO2 emissions for surface, terminal and oceanic operations to substantially accelerate the pace of change.
3.50 3 AIRE demonstration campaigns took place between 2007 and 2014:
3.51 The AIRE 1 campaign (2008-2009), has demonstrated, with 1,152 trials performed, that significant savings can already be achieved using existing technology. CO2 savings per flight ranged from 90kg to 1250kg and the accumulated savings during trials were equivalent to 400 tons of CO2. Another positive aspect of such pre implementation demonstrations is the human dimension. Indeed the demonstration flight strategy established in AIRE is to produce constant step-based improvements, to be implemented by each partner in order to contribute to reaching the common objective. Hence the AIRE projects boost crew and controller's motivation to pioneer new ways of working together focusing on environmental aspects, and enables cooperative decision making towards a common goal.
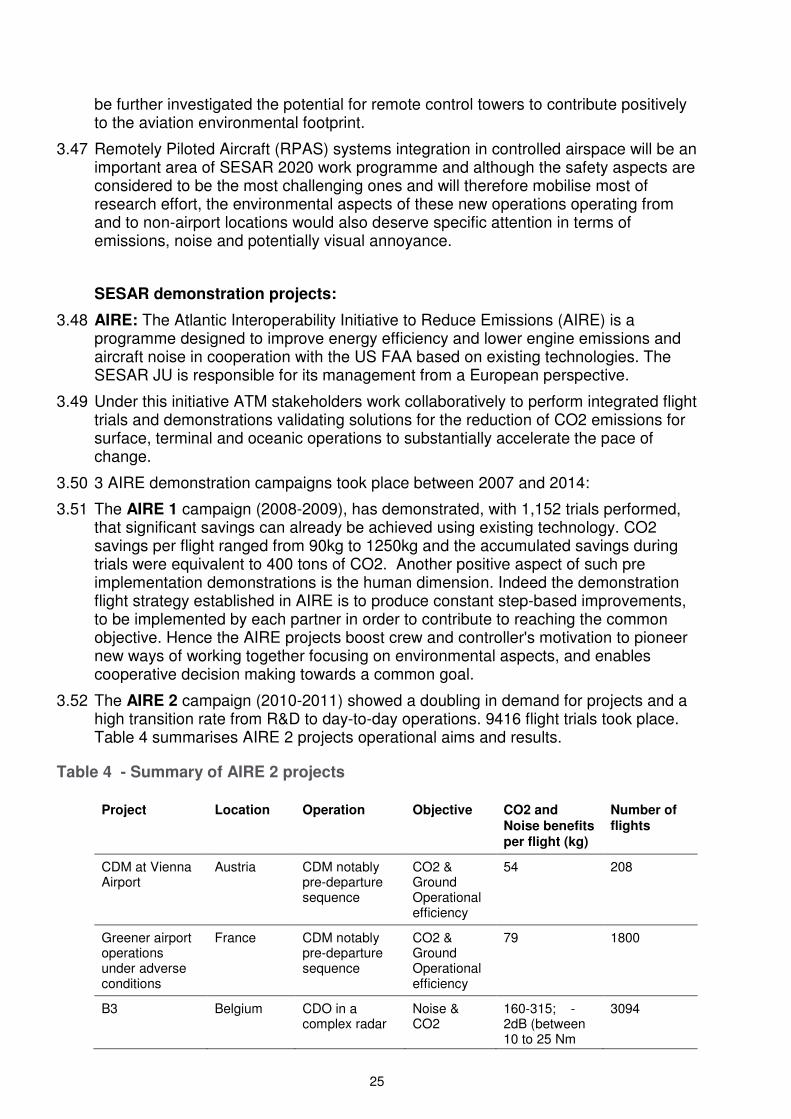
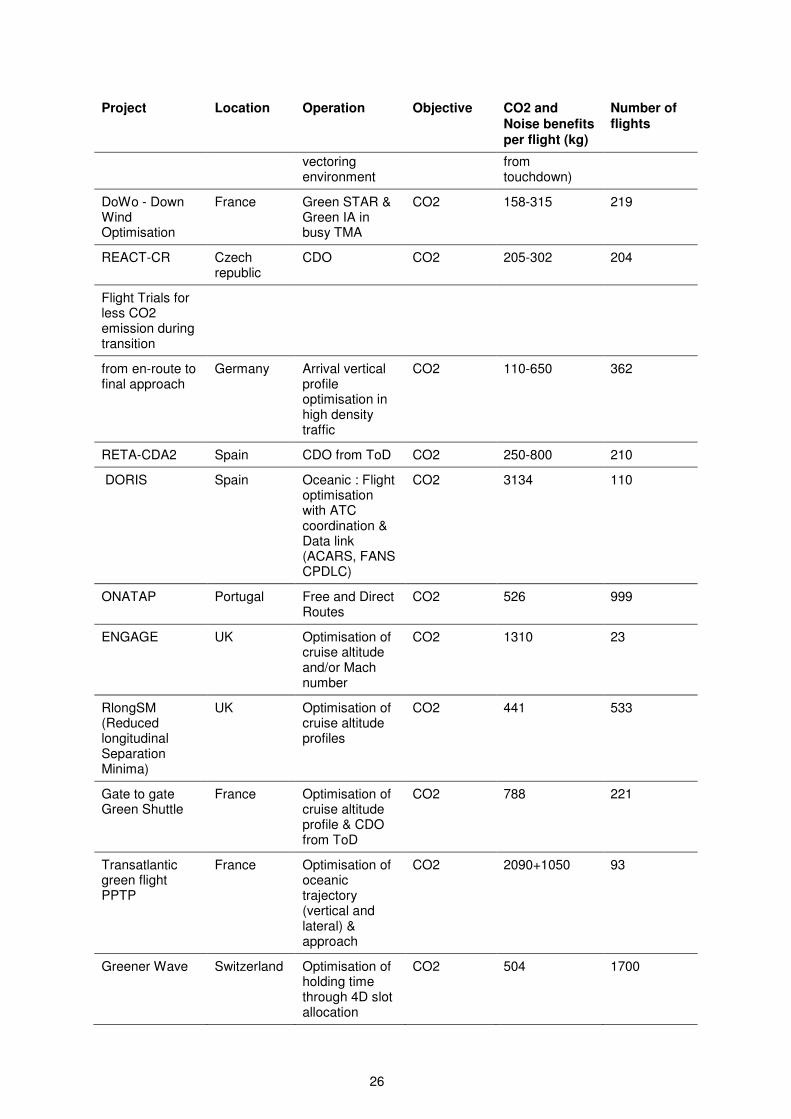
3.52 The AIRE 2 campaign (2010-2011) showed a doubling in demand for projects and a high transition rate from R&D to day-to-day operations. 9416 flight trials took place. Table 4 summarises AIRE 2 projects operational aims and results.
Table 4 - Summary of AIRE 2 projects
Project Location Operation Objective CO2 and
Noise benefits per flight (kg)
Number of flights
CDM at Vienna Airport
Austria CDM notably pre-departure sequence
CO2 & Ground Operational efficiency
54 208
Greener airport operations under adverse conditions
France CDM notably pre-departure sequence
CO2 & Ground Operational efficiency
79 1800
B3 Belgium CDO in a complex radar
Noise & CO2
160-315; -2dB (between 10 to 25 Nm
3094
26
Project Location Operation Objective CO2 and
Noise benefits per flight (kg)
Number of flights
vectoring environment
from touchdown)
DoWo - Down Wind Optimisation
France Green STAR & Green IA in busy TMA
CO2 158-315 219
REACT-CR Czech republic
CDO CO2 205-302 204
Flight Trials for less CO2 emission during transition
from en-route to final approach
Germany Arrival vertical profile optimisation in high density traffic
CO2 110-650 362
RETA-CDA2 Spain CDO from ToD CO2 250-800 210
DORIS Spain Oceanic : Flight optimisation with ATC coordination & Data link (ACARS, FANS CPDLC)
CO2 3134 110
ONATAP Portugal Free and Direct Routes
CO2 526 999
ENGAGE UK Optimisation of cruise altitude and/or Mach number
CO2 1310 23
RlongSM (Reduced longitudinal Separation Minima)
UK Optimisation of cruise altitude profiles
CO2 441 533
Gate to gate Green Shuttle
France Optimisation of cruise altitude profile & CDO from ToD
CO2 788 221
Transatlantic green flight PPTP
France Optimisation of oceanic trajectory (vertical and lateral) & approach
CO2 2090+1050 93
Greener Wave Switzerland Optimisation of holding time through 4D slot allocation
CO2 504 1700
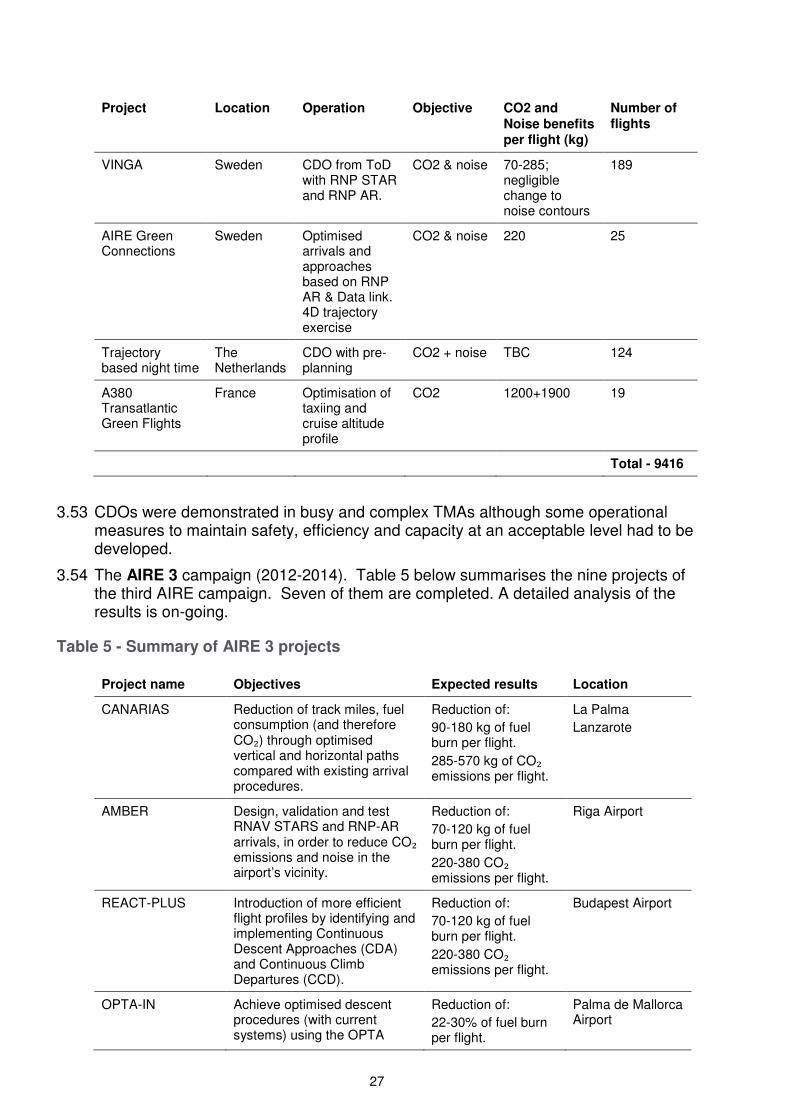
27
Project Location Operation Objective CO2 and
Noise benefits per flight (kg)
Number of flights
VINGA Sweden CDO from ToD with RNP STAR and RNP AR.
CO2 & noise 70-285; negligible change to noise contours
189
AIRE Green Connections
Sweden Optimised arrivals and approaches based on RNP AR & Data link. 4D trajectory exercise
CO2 & noise 220 25
Trajectory based night time
The Netherlands
CDO with pre-planning
CO2 + noise TBC 124
A380 Transatlantic Green Flights
France Optimisation of taxiing and cruise altitude profile
CO2 1200+1900 19
Total - 9416
3.53 CDOs were demonstrated in busy and complex TMAs although some operational measures to maintain safety, efficiency and capacity at an acceptable level had to be developed.
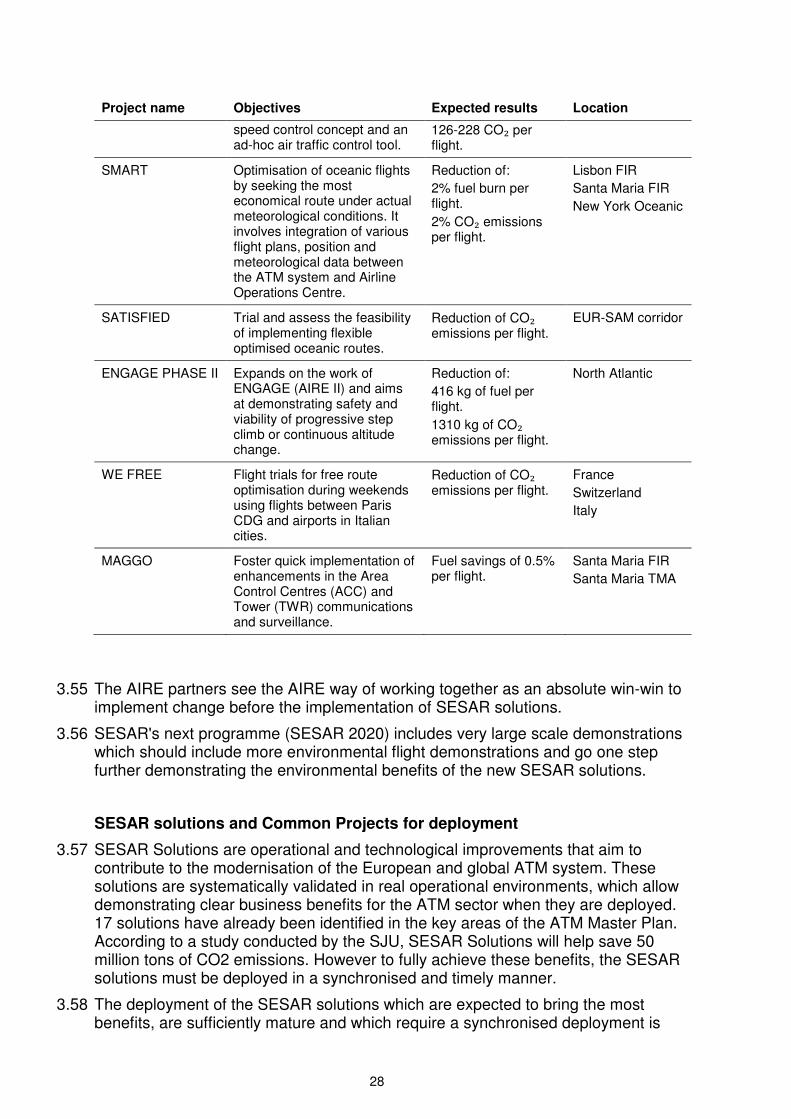
3.54 The AIRE 3 campaign (2012-2014). Table 5 below summarises the nine projects of the third AIRE campaign. Seven of them are completed. A detailed analysis of the results is on-going.
Table 5 - Summary of AIRE 3 projects
Project name Objectives Expected results Location
CANARIAS Reduction of track miles, fuel consumption (and therefore CO₂) through optimised vertical and horizontal paths compared with existing arrival procedures.
Reduction of:
90-180 kg of fuel burn per flight.
285-570 kg of CO₂ emissions per flight.
La Palma
Lanzarote
AMBER Design, validation and test RNAV STARS and RNP-AR arrivals, in order to reduce CO₂ emissions and noise in the airport’s vicinity.
Reduction of:
70-120 kg of fuel burn per flight.
220-380 CO₂ emissions per flight.
Riga Airport
REACT-PLUS Introduction of more efficient flight profiles by identifying and implementing Continuous Descent Approaches (CDA) and Continuous Climb Departures (CCD).
Reduction of:
70-120 kg of fuel burn per flight.
220-380 CO₂ emissions per flight.
Budapest Airport
OPTA-IN Achieve optimised descent procedures (with current systems) using the OPTA
Reduction of:
22-30% of fuel burn per flight.
Palma de Mallorca Airport
28
Project name Objectives Expected results Location
speed control concept and an ad-hoc air traffic control tool.
126-228 CO₂ per flight.
SMART Optimisation of oceanic flights by seeking the most economical route under actual meteorological conditions. It involves integration of various flight plans, position and meteorological data between the ATM system and Airline Operations Centre.
Reduction of:
2% fuel burn per flight.
2% CO₂ emissions per flight.
Lisbon FIR
Santa Maria FIR
New York Oceanic
SATISFIED Trial and assess the feasibility of implementing flexible optimised oceanic routes.
Reduction of CO₂ emissions per flight.
EUR-SAM corridor
ENGAGE PHASE II Expands on the work of ENGAGE (AIRE II) and aims at demonstrating safety and viability of progressive step climb or continuous altitude change.
Reduction of:
416 kg of fuel per flight.
1310 kg of CO₂ emissions per flight.
North Atlantic
WE FREE Flight trials for free route optimisation during weekends using flights between Paris CDG and airports in Italian cities.
Reduction of CO₂ emissions per flight.
France
Switzerland
Italy
MAGGO Foster quick implementation of enhancements in the Area Control Centres (ACC) and Tower (TWR) communications and surveillance.
Fuel savings of 0.5% per flight.
Santa Maria FIR
Santa Maria TMA
3.55 The AIRE partners see the AIRE way of working together as an absolute win-win to implement change before the implementation of SESAR solutions.
3.56 SESAR's next programme (SESAR 2020) includes very large scale demonstrations which should include more environmental flight demonstrations and go one step further demonstrating the environmental benefits of the new SESAR solutions.
SESAR solutions and Common Projects for deployment
3.57 SESAR Solutions are operational and technological improvements that aim to contribute to the modernisation of the European and global ATM system. These solutions are systematically validated in real operational environments, which allow demonstrating clear business benefits for the ATM sector when they are deployed. 17 solutions have already been identified in the key areas of the ATM Master Plan. According to a study conducted by the SJU, SESAR Solutions will help save 50 million tons of CO2 emissions. However to fully achieve these benefits, the SESAR solutions must be deployed in a synchronised and timely manner.
3.58 The deployment of the SESAR solutions which are expected to bring the most benefits, are sufficiently mature and which require a synchronised deployment is
29
mandated by the Commission through legally binding instruments called Common Projects.
3.59 The first Common Projects identify six ATM functionalities, namely Extended Arrival Management and Performance Based Navigation in the High Density Terminal Manoeuvring Areas; Airport Integration and Throughput; Flexible Airspace Management and Free Route; Network Collaborative Management; Initial System Wide Information Management; and Initial Trajectory Information Sharing. The deployment of these six ATM functionalities should be made mandatory.
a. The Extended Arrival Management and Performance Based Navigation in the High Density Terminal Manoeuvring Areas functionality is expected to improve the precision of approach trajectory as well as facilitate traffic sequencing at an earlier stage, thus allowing reducing fuel consumption and environmental impact in descent/arrival phases.
b. The Airport Integration and Throughput functionality is expected to improve runway safety and throughput, ensuring benefits in terms of fuel consumption and delay reduction as well as airport capacity.
c. The Flexible Airspace Management and Free Route functionality is expected to enable a more efficient use of airspace, thus providing significant benefits linked to fuel consumption and delay reduction.
d. The Network Collaborative Management functionality is expected to improve the quality and the timeliness of the network information shared by all ATM stakeholders, thus ensuring significant benefits in terms of Air Navigation Services productivity gains and delay cost savings.
e. The Initial System Wide Information Management functionality, consisting of a set of services that are delivered and consumed through an internet protocol-based network by System Wide Information Management (SWIM) enabled systems, is expected to bring significant benefits in terms of ANS productivity.
f. The Initial Trajectory Information Sharing functionality with enhanced flight data processing performances is expected to improve predictability of aircraft trajectory for the benefit of airspace users, the network manager and ANS providers, implying less tactical interventions and improved de-confliction situation. This is expected to have a positive impact on ANS productivity, fuel saving and delay variability.
3.60 The fuel efficiency expected benefits from the deployment of these solutions is 66% reduction of fuel burn resulting in EUR 0.8 billion (6%) CO2 credit savings.
Economic/market-based measures
The EU Emissions Trading System
3.61 The EU Emissions Trading System (EU ETS) is the cornerstone of the European Union's policy to tackle climate change, and a key tool for reducing greenhouse gas emissions cost-effectively, including from the aviation sector. It operates in 31 countries: the 28 EU Member States, Iceland, Liechtenstein and Norway. The EU ETS is the first and so far the biggest international system capping greenhouse gas emissions; it currently covers half of the EU's CO2 emissions, encompassing those from around 12,000 power stations and industrial plants in 31 countries, and, under
30
its current scope, around 640 commercial and non-commercial aircraft operators that have flown between airports in the European Economic Area (EEA).
3.62 The EU ETS began operation in 2005; a series of important changes to the way it works took effect in 2013, strengthening the system. The EU ETS works on the "cap and trade" principle. This means there is a "cap", or limit, on the total amount of certain greenhouse gases that can be emitted by the factories, power plants, other installations and aircraft operators in the system. Within this cap, companies can sell or buy emission allowances to and from one another. The limit on allowances available provides certainty that the environmental objective is achieved and gives allowances a market value.
3.63 By the 30th April each year, companies, including aircraft operators, have to surrender allowances to cover their emissions from the previous calendar year. If a company reduces its emissions, it can keep the spare allowances to cover its future needs or sell them to another company that is short of allowances. The flexibility that trading brings ensures that emissions are cut where it costs least to do so. The number of allowances reduces over time so that total emissions fall.
3.64 With regard to aviation, following more than a decade of inaction with respect to the introduction of a global market-based measure aiming at reducing the impact of aviation on climate change on the level of the International Civil Aviation Organization (ICAO), legislation to include aviation in the EU ETS was adopted in 2008 by the European Parliament and the Council.21 The 2006 proposal to include aviation in the EU ETS was accompanied by detailed impact assessment.22 After careful analysis of the different options, it was concluded that this was the most cost-efficient and environmentally effective option for addressing aviation emissions.
3.65 In October 2013, the Assembly of the International Civil Aviation Organization (ICAO) decided to develop a global market-based mechanism (MBM) for international aviation emissions. This is an important step and follows years of pressure from the EU for advancing global action. The global MBM design is to be decided at the next ICAO Assembly in 2016, including the mechanisms for the implementation of the scheme from 2020. In order to sustain momentum towards the establishment of the global MBM, the European Parliament and Council have decided to temporarily limit the scope of the aviation activities covered by the EU ETS, to intra-European flights.23 The temporary limitation applies for 2013-2016, following on from the April 2013 'stop the clock' Decision24 adopted to promote progress on global action at the 2013 ICAO Assembly.
3.66 The legislation requires the European Commission to report to the European Parliament and Council regularly on the progress of ICAO discussions as well as of its efforts to promote the international acceptance of market-based mechanisms among third countries. Following the 2016 ICAO Assembly, the Commission shall report to the European Parliament and to the Council on actions to implement an international agreement on a global market-based measure from 2020, that will reduce greenhouse gas emissions from aviation in a non-discriminatory manner. In
21 Directive 2008/101/EC of the European Parliament and of the Council of 19 November 2008 amending Directive 2003/87/EC so as to include aviation activities in the scheme for greenhouse gas emission allowance trading within the Community, http://eur-lex.europa.eu/legal-content/EN/TXT/?uri=CELEX:32008L0101 22 http://ec.europa.eu/clima/policies/transport/aviation/documentation_en.htm 23 Regulation (EU) No 421/2014 of the European Parliament and of the Council of 16 April 2014 amending Directive 2003/87/EC establishing a scheme for greenhouse gas emission allowance trading within the Community, in view of the implementation by 2020 of an international agreement applying a single global market-based measure to international aviation emissions http://eur-lex.europa.eu/legal-content/EN/ALL/?uri=CELEX:32014R0421 24 Decision No. 377/2013/EU derogating temporarily from Directive 2003/87/EC establishing a scheme for greenhouse gas emission allowance trading within the Community, http://eur-lex.europa.eu/LexUriServ/LexUriServ.do?uri=CELEX:32013D0377:EN:NOT
31
its report, the Commission shall consider and, if appropriate, include proposals on the appropriate scope for coverage of aviation within the EU ETS from 2017 onwards.
3.67 Between 2013 and 2016, the EU ETS only covers emissions from flights between airports which are both in the EEA. Some flight routes within the EEA are also exempted, notably flights involving outermost regions.
3.68 The complete, consistent, transparent and accurate monitoring, reporting and verification of greenhouse gas emissions remain fundamental for the effective operation of the EU ETS. Aviation operators, verifiers and competent authorities have already gained experience with monitoring and reporting during the first aviation trading period; detailed rules are prescribed by Regulations (EU) N°600/201225 and 601/2012.26
3.69 The EU legislation establishes exemptions and simplifications to avoid excessive administrative burden for the smallest aircraft operators. Since the EU ETS for aviation took effect in 2012 a de minimis exemption for commercial operators – with either fewer than 243 flights per period for three consecutive four-month periods or flights with total annual emissions lower than 10,000 tonnes CO2 per year –applies, which means that many aircraft operators from developing countries are exempted from the EU ETS. Indeed, over 90 States have no commercial aircraft operators included in the scope of the EU ETS. From 2013 also flights by non-commercial aircraft operators with total annual emissions lower than 1,000 tonnes CO2 per year are excluded from the EU ETS up to 2020. A further administrative simplification applies to small aircraft operators emitting less than 25,000 tonnes of CO2 per year, who can choose to use the small emitter`s tool rather than independent verification of their emissions. In addition, small emitter aircraft operators can use the simplified reporting procedures under the existing legislation.
3.70 The EU legislation foresees that, where a third country takes measures to reduce the climate change impact of flights departing from its airports, the EU will consider options available in order to provide for optimal interaction between the EU scheme and that country’s measures. In such a case, flights arriving from the third country could be excluded from the scope of the EU ETS. The EU therefore encourages other countries to adopt measures of their own and is ready to engage in bilateral discussions with any country that has done so. The legislation also makes it clear that if there is agreement on global measures, the EU shall consider whether amendments to the EU legislation regarding aviation under the EU ETS are necessary.
Impact on fuel consumption and/or CO2 emissions
3.71 The environmental outcome of an emissions trading system is determined by the emissions cap. Aircraft operators are able to use allowances from outside the aviation sector to cover their emissions. The absolute level of CO2 emissions from the aviation sector itself can exceed the number of allowances allocated to it, as the increase is offset by CO2 emissions reductions in other sectors of the economy.
3.72 Over 2013-16, with the inclusion of only intra-European flights in the EU ETS, the total amount of annual allowances to be issued will be around 39 million. Verified
25 Commission Regulation (EU) No 600/2012 of 21 June 2012 on the verification of greenhouse gas emission reports and tonne-kilometre reports and the accreditation of verifiers pursuant to Directive 2003/87/EC of the European Parliament and of the Council, http://eur-lex.europa.eu/legal-content/EN/TXT/PDF/?uri=CELEX:32012R0600&from=EN 26 Regulation (EU) No 601/2012 of the European Parliament and of the Council of 21 June 2012 on the monitoring and reporting of greenhouse gas emissions pursuant to Directive 2003/87/EC of the European Parliament and of the Council, http://eur-lex.europa.eu/legal-content/EN/ALL/?uri=CELEX:32012R0601
32
CO2 emissions from aviation activities carried out between aerodromes located in the EEA amounted to 54.9 million tonnes of CO2 in 2014. This means that the EU ETS will contribute to achieve around 16 million tonnes of emission reductions annually, or almost 65 million over 2013-2016, partly within the sector (airlines reduce their emissions to avoid paying for additional units) or in other sectors (airlines purchase units from other sectors, which would have to reduce their emissions consistently). While some reductions are likely to be within the aviation sector, encouraged by the EU ETS's economic incentive for limiting emissions or use of aviation biofuels, the majority of reductions are expected to occur in other sectors.
3.73 Putting a price on greenhouse gas emissions is important for harnessing market forces and achieving cost-effective emission reductions. In parallel to providing a carbon price, which incentivises emission reductions, the EU ETS also supports the reduction of greenhouse gas emissions through €2.1 billion funding for the deployment of innovative renewables and carbon capture and storage. This funding has been raised from the sale of 300 million emission allowances from the New Entrants' Reserve of the third phase of the EU ETS. This includes over €900 million for supporting bioenergy projects, including advanced biofuels.27
3.74 In addition, through Member States' use of EU ETS auction revenue in 2013, over €3 billion has been reported by them as being used to address climate change.28 The purposes for which revenues from allowances should be used encompass mitigation of greenhouse gas emissions and adaptation to the inevitable impacts of climate change in the EU and third countries, to reduce emissions through low-emission transport, to fund research and development, including in particular in the fields of aeronautics and air transport, to fund contributions to the Global Energy Efficiency and Renewable Energy Fund, and measures to avoid deforestation.
3.75 In terms of contribution towards the ICAO global goals, the States implementing the EU ETS will together deliver, in “net” terms, a reduction of at least 5% below 2005 levels of aviation CO2 emissions for the scope that is covered. Other emissions reduction measures taken, either at supra-national level in Europe or by any of the 31 individual states implementing the EU ETS, will also contribute towards the ICAO global goals. Such measures are likely to moderate the anticipated growth in aviation emissions.
EU initiatives in third countries
Multilateral projects
3.76 At the end of 2013 the European Commission launched a project of a total budget of €6.5 million under the name "Capacity building for CO2 mitigation from international aviation". The 42-month project, implemented by the ICAO, boosts less developed countries’ ability to track, manage and reduce their aviation emissions. In line with the call from the 2010 ICAO Assembly, beneficiary countries will submit meaningful state action plans for reducing aviation emissions, and also receive assistance for establishing emissions inventories and piloting new ways of reducing fuel consumption. Through the wide range of activities in these countries, the project contributes to international, regional and national efforts to address growing emissions from international aviation. The beneficiary countries are the following:
27 For further information, see http://ec.europa.eu/clima/policies/lowcarbon/ner300/index_en.htm 28 For further information, see http://ec.europa.eu/clima/news/articles/news_2014102801_en.htm
33
3.77 In Africa: Burkina Faso, Kenya and Economic Community of Central African States (ECCAS) Member States: Angola, Burundi, Cameroon, Central African Republic, Chad, Republic of Congo, Democratic Republic of Congo, Equatorial Guinea, Gabon, Sao Tome and Principe.
3.78 In the Caribbean: Dominican Republic and Trinidad and Tobago.
Support to voluntary actions: ACI airport carbon accreditation
3.79 Airport Carbon Accreditation is a certification programme for carbon management at airports, based on carbon mapping and management standard specifically designed for the airport industry. It was launched in 2009 by ACI EUROPE, the trade association for European airports.
3.80 The underlying aim of the programme is to encourage and enable airports to implement best practice carbon and energy management processes and to gain public recognition of their achievements. It requires airports to measure their CO2 emissions in accordance with the World Resources Institute and World Business Council for Sustainable Development GHG Protocol and to get their emissions inventory assured by an independent third party.
3.81 This industry-driven initiative was officially endorsed by Eurocontrol and the European Civil Aviation Conference (ECAC). It is also officially supported by the United Nations Environmental Programme (UNEP). The programme is overseen by an independent Advisory Board.
3.82 Now covering ACI member airports in three ACI regions, Europe, Asia-Pacific, Africa, it is poised to move to Latin America and North America in the coming years. The number of airports participating in the programme has grown from 17 in Year 1 (2009-2010) to 102 at the end of Year 5 – an increase of 85 airports or 500% in participation. Airport participation in the programme now covers 23.2% of world passenger traffic.
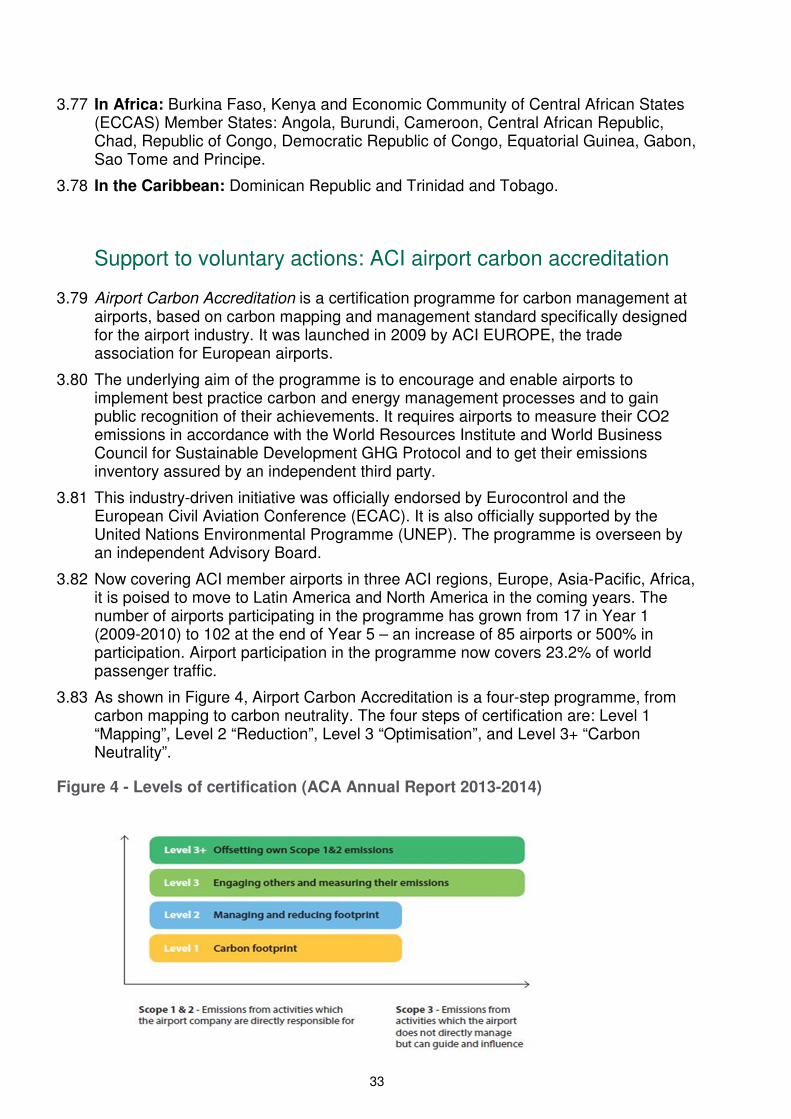
3.83 As shown in Figure 4, Airport Carbon Accreditation is a four-step programme, from carbon mapping to carbon neutrality. The four steps of certification are: Level 1 “Mapping”, Level 2 “Reduction”, Level 3 “Optimisation”, and Level 3+ “Carbon Neutrality”.
Figure 4 - Levels of certification (ACA Annual Report 2013-2014)
34
3.84 One of its essential requirements is the verification by external and independent auditors of the data provided by airports. Aggregated data are included in the Airport Carbon Accreditation Annual Report thus ensuring transparent and accurate carbon reporting. At level 2 of the programme and above (Reduction, Optimisation and Carbon Neutrality), airport operators are required to demonstrate CO2 reduction associated with the activities they control.
3.85 In 2014, 5 years after the launch of the programme, 85 European airports were accredited, representing 62.8% of European passenger traffic.
Anticipated benefits
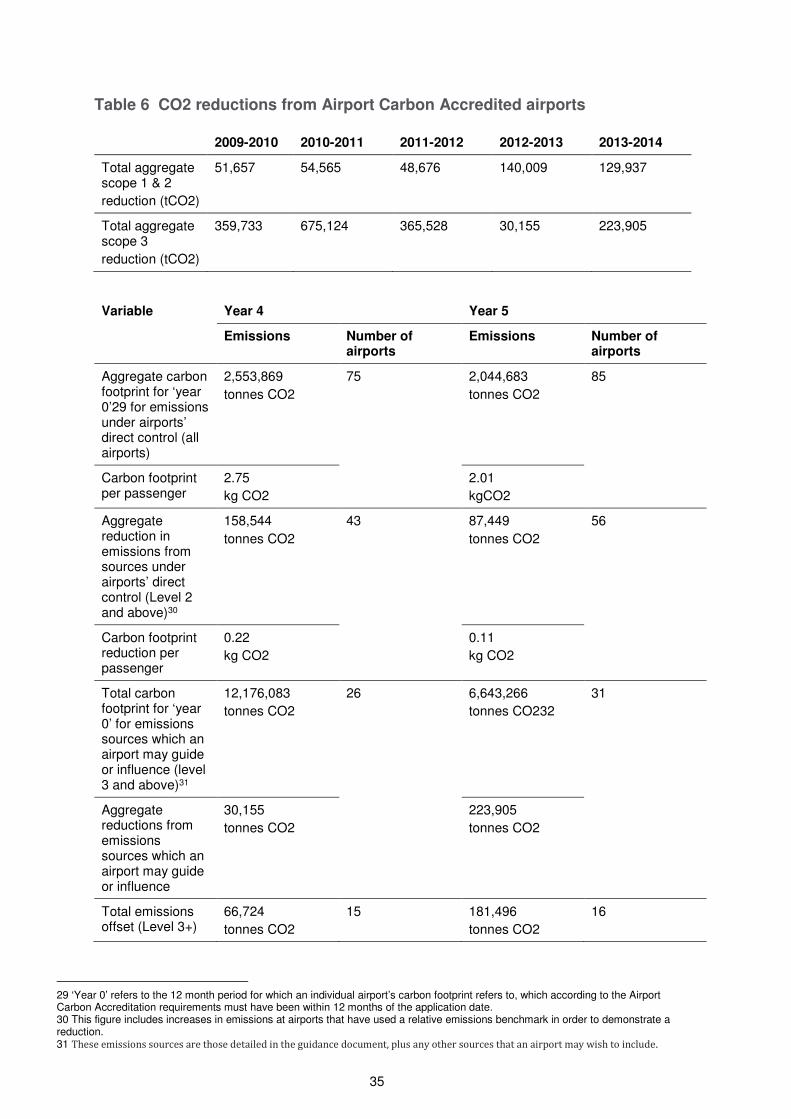
3.86 The Administrator of the programme has been collecting CO2 data from participating airports over the past five years. This has allowed the absolute CO2 reduction from the participation in the programme to be quantified, as shown in Table 6.
35
Table 6 CO2 reductions from Airport Carbon Accredited airports
2009-2010 2010-2011 2011-2012 2012-2013 2013-2014
Total aggregate scope 1 & 2
reduction (tCO2)
51,657 54,565 48,676 140,009 129,937
Total aggregate scope 3
reduction (tCO2)
359,733 675,124 365,528 30,155 223,905
Variable Year 4 Year 5
Emissions Number of airports
Emissions Number of airports
Aggregate carbon footprint for ‘year 0’29 for emissions under airports’ direct control (all airports)
2,553,869
tonnes CO2
75
2,044,683
tonnes CO2
85
Carbon footprint per passenger
2.75
kg CO2
2.01
kgCO2
Aggregate reduction in emissions from sources under airports’ direct control (Level 2 and above)30
158,544
tonnes CO2
43 87,449
tonnes CO2
56
Carbon footprint reduction per passenger
0.22
kg CO2
0.11
kg CO2
Total carbon footprint for ‘year 0’ for emissions sources which an airport may guide or influence (level 3 and above)31
12,176,083
tonnes CO2
26 6,643,266
tonnes CO232
31
Aggregate reductions from emissions sources which an airport may guide or influence
30,155
tonnes CO2
223,905
tonnes CO2
Total emissions offset (Level 3+)
66,724
tonnes CO2
15 181,496
tonnes CO2
16
29 ‘Year 0’ refers to the 12 month period for which an individual airport’s carbon footprint refers to, which according to the Airport Carbon Accreditation requirements must have been within 12 months of the application date. 30 This figure includes increases in emissions at airports that have used a relative emissions benchmark in order to demonstrate a reduction. 31 These emissions sources are those detailed in the guidance document, plus any other sources that an airport may wish to include.
36
3.87 Its main immediate environmental co-benefit is the improvement of local air quality.
3.88 Costs for design, development and implementation of Airport Carbon Accreditation have been borne by ACI EUROPE. Airport Carbon Accreditation is a non-for-profit initiative, with participation fees set at a level aimed at allowing for the recovery of the aforementioned costs.
3.89 The scope of Airport Carbon Accreditation, i.e. emissions that an airport operator can control, guide and influence, implies that aircraft emissions in the LTO cycle are also covered. Thus, airlines can benefit from the gains made by more efficient airport operations to see a decrease in their emissions during the LTO cycle. This is coherent with the objectives pursued with the inclusion of aviation in the EU ETS as of 1 January 2012 (Directive 2008/101/EC) and can support the efforts of airlines to reduce these emissions.
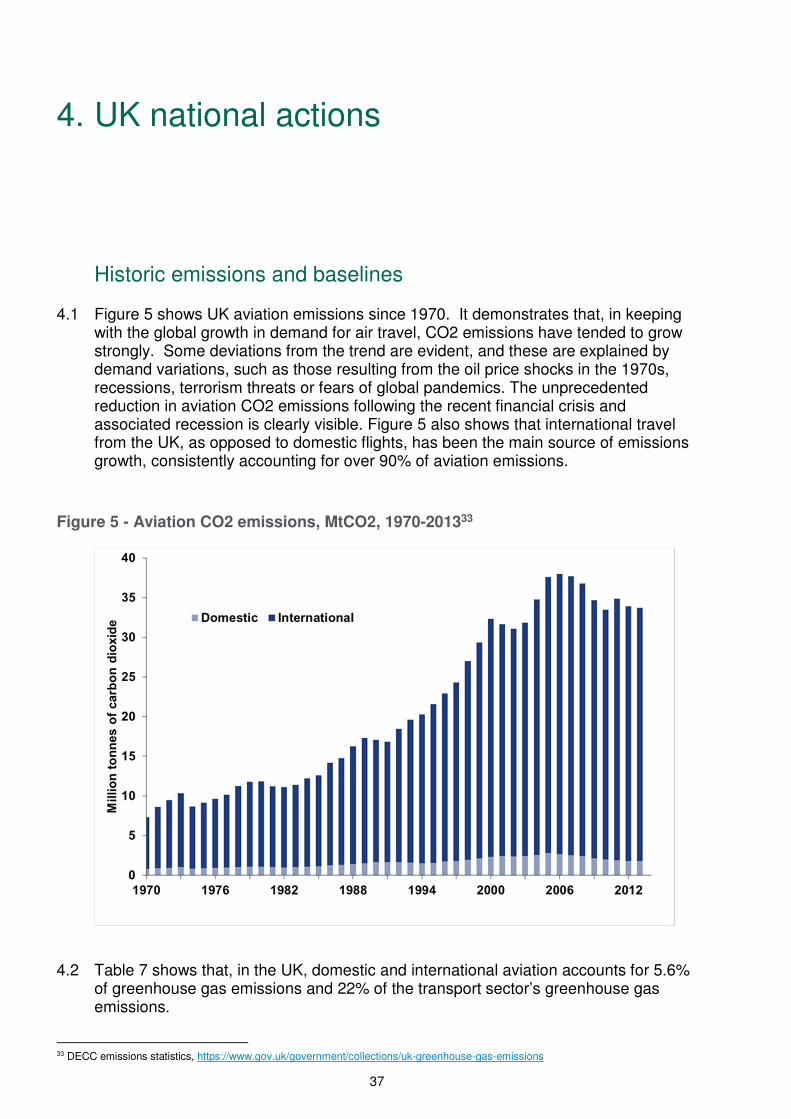
37
4. UK national actions
Historic emissions and baselines
4.1 Figure 5 shows UK aviation emissions since 1970. It demonstrates that, in keeping with the global growth in demand for air travel, CO2 emissions have tended to grow strongly. Some deviations from the trend are evident, and these are explained by demand variations, such as those resulting from the oil price shocks in the 1970s, recessions, terrorism threats or fears of global pandemics. The unprecedented reduction in aviation CO2 emissions following the recent financial crisis and associated recession is clearly visible. Figure 5 also shows that international travel from the UK, as opposed to domestic flights, has been the main source of emissions growth, consistently accounting for over 90% of aviation emissions.
Figure 5 - Aviation CO2 emissions, MtCO2, 1970-201333
4.2 Table 7 shows that, in the UK, domestic and international aviation accounts for 5.6% of greenhouse gas emissions and 22% of the transport sector’s greenhouse gas emissions.
33 DECC emissions statistics, https://www.gov.uk/government/collections/uk-greenhouse-gas-emissions
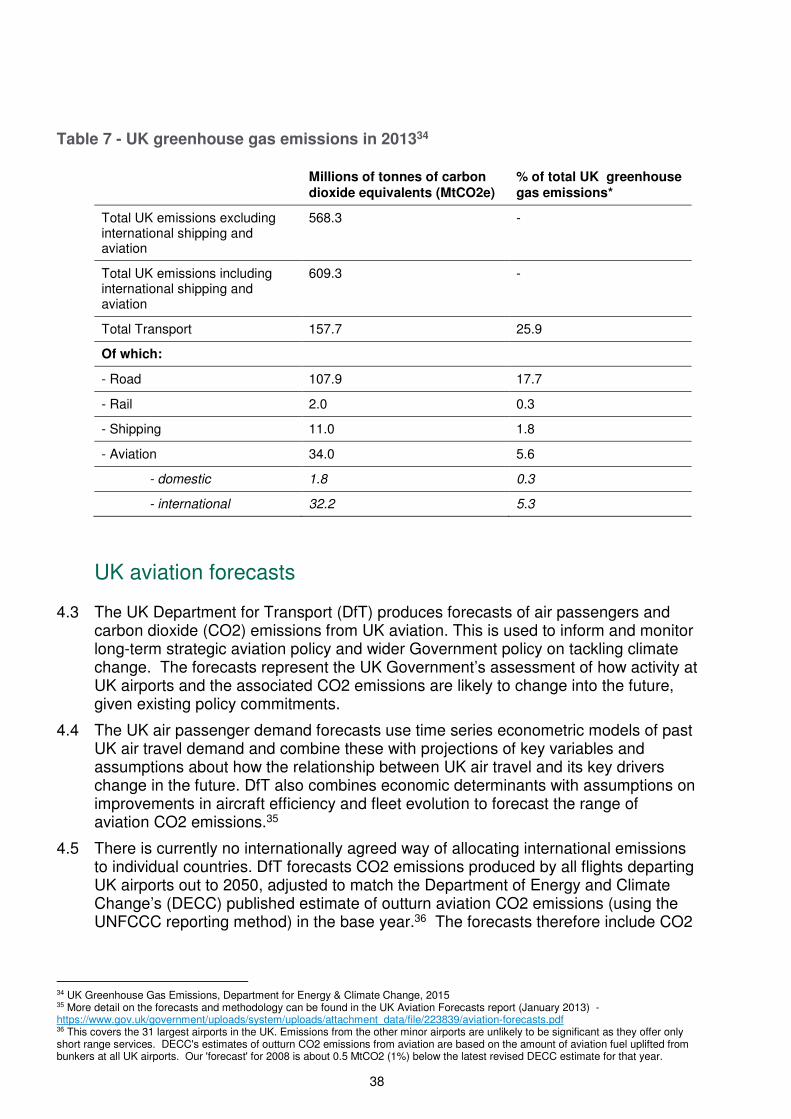
38
Table 7 - UK greenhouse gas emissions in 201334
Millions of tonnes of carbon
dioxide equivalents (MtCO2e)
% of total UK greenhouse
gas emissions*
Total UK emissions excluding international shipping and aviation
568.3 -
Total UK emissions including international shipping and aviation
609.3 -
Total Transport 157.7 25.9
Of which:
- Road 107.9 17.7
- Rail 2.0 0.3
- Shipping 11.0 1.8
- Aviation 34.0 5.6
- domestic 1.8 0.3
- international 32.2 5.3
UK aviation forecasts
4.3 The UK Department for Transport (DfT) produces forecasts of air passengers and carbon dioxide (CO2) emissions from UK aviation. This is used to inform and monitor long-term strategic aviation policy and wider Government policy on tackling climate change. The forecasts represent the UK Government’s assessment of how activity at UK airports and the associated CO2 emissions are likely to change into the future, given existing policy commitments.
4.4 The UK air passenger demand forecasts use time series econometric models of past UK air travel demand and combine these with projections of key variables and assumptions about how the relationship between UK air travel and its key drivers change in the future. DfT also combines economic determinants with assumptions on improvements in aircraft efficiency and fleet evolution to forecast the range of aviation CO2 emissions.35
4.5 There is currently no internationally agreed way of allocating international emissions to individual countries. DfT forecasts CO2 emissions produced by all flights departing UK airports out to 2050, adjusted to match the Department of Energy and Climate Change’s (DECC) published estimate of outturn aviation CO2 emissions (using the UNFCCC reporting method) in the base year.36 The forecasts therefore include CO2
34 UK Greenhouse Gas Emissions, Department for Energy & Climate Change, 2015 35 More detail on the forecasts and methodology can be found in the UK Aviation Forecasts report (January 2013) - https://www.gov.uk/government/uploads/system/uploads/attachment_data/file/223839/aviation-forecasts.pdf 36 This covers the 31 largest airports in the UK. Emissions from the other minor airports are unlikely to be significant as they offer only short range services. DECC's estimates of outturn CO2 emissions from aviation are based on the amount of aviation fuel uplifted from bunkers at all UK airports. Our 'forecast' for 2008 is about 0.5 MtCO2 (1%) below the latest revised DECC estimate for that year.
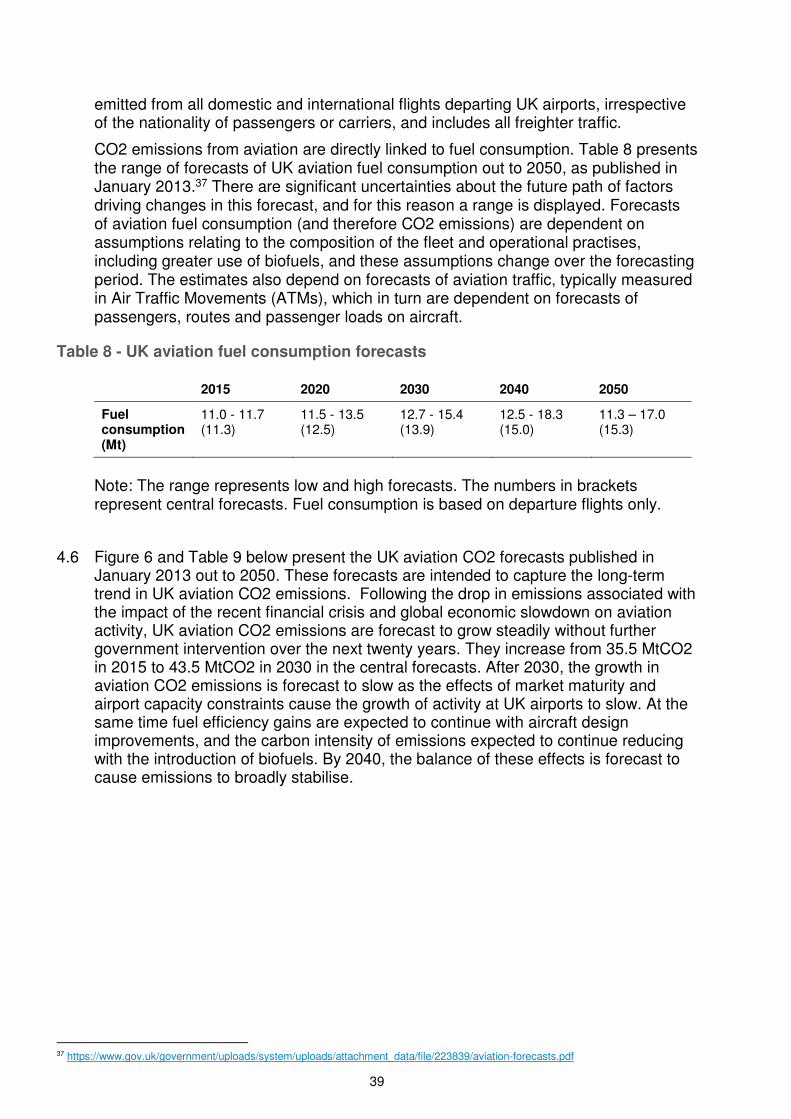
39
emitted from all domestic and international flights departing UK airports, irrespective of the nationality of passengers or carriers, and includes all freighter traffic.
CO2 emissions from aviation are directly linked to fuel consumption. Table 8 presents the range of forecasts of UK aviation fuel consumption out to 2050, as published in January 2013.37 There are significant uncertainties about the future path of factors driving changes in this forecast, and for this reason a range is displayed. Forecasts of aviation fuel consumption (and therefore CO2 emissions) are dependent on assumptions relating to the composition of the fleet and operational practises, including greater use of biofuels, and these assumptions change over the forecasting period. The estimates also depend on forecasts of aviation traffic, typically measured in Air Traffic Movements (ATMs), which in turn are dependent on forecasts of passengers, routes and passenger loads on aircraft.
Table 8 - UK aviation fuel consumption forecasts
2015 2020 2030 2040 2050
Fuel consumption (Mt)
11.0 - 11.7 (11.3)
11.5 - 13.5 (12.5)
12.7 - 15.4 (13.9)
12.5 - 18.3 (15.0)
11.3 – 17.0 (15.3)
Note: The range represents low and high forecasts. The numbers in brackets represent central forecasts. Fuel consumption is based on departure flights only.
4.6 Figure 6 and Table 9 below present the UK aviation CO2 forecasts published in January 2013 out to 2050. These forecasts are intended to capture the long-term trend in UK aviation CO2 emissions. Following the drop in emissions associated with the impact of the recent financial crisis and global economic slowdown on aviation activity, UK aviation CO2 emissions are forecast to grow steadily without further government intervention over the next twenty years. They increase from 35.5 MtCO2 in 2015 to 43.5 MtCO2 in 2030 in the central forecasts. After 2030, the growth in aviation CO2 emissions is forecast to slow as the effects of market maturity and airport capacity constraints cause the growth of activity at UK airports to slow. At the same time fuel efficiency gains are expected to continue with aircraft design improvements, and the carbon intensity of emissions expected to continue reducing with the introduction of biofuels. By 2040, the balance of these effects is forecast to cause emissions to broadly stabilise.
37 https://www.gov.uk/government/uploads/system/uploads/attachment_data/file/223839/aviation-forecasts.pdf
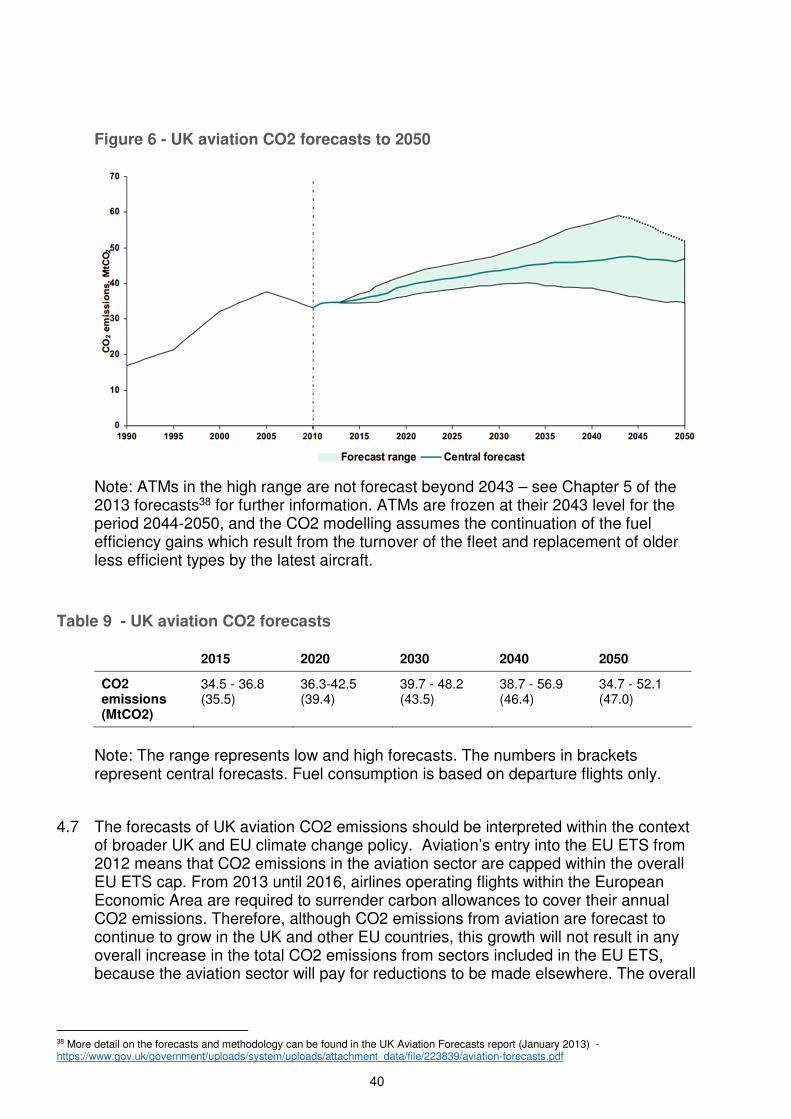
40
Figure 6 - UK aviation CO2 forecasts to 2050
Note: ATMs in the high range are not forecast beyond 2043 – see Chapter 5 of the 2013 forecasts38 for further information. ATMs are frozen at their 2043 level for the period 2044-2050, and the CO2 modelling assumes the continuation of the fuel efficiency gains which result from the turnover of the fleet and replacement of older less efficient types by the latest aircraft.
Table 9 - UK aviation CO2 forecasts
2015 2020 2030 2040 2050
CO2 emissions (MtCO2)
34.5 - 36.8 (35.5)
36.3-42.5 (39.4)
39.7 - 48.2 (43.5)
38.7 - 56.9 (46.4)
34.7 - 52.1 (47.0)
Note: The range represents low and high forecasts. The numbers in brackets represent central forecasts. Fuel consumption is based on departure flights only.
4.7 The forecasts of UK aviation CO2 emissions should be interpreted within the context of broader UK and EU climate change policy. Aviation’s entry into the EU ETS from 2012 means that CO2 emissions in the aviation sector are capped within the overall EU ETS cap. From 2013 until 2016, airlines operating flights within the European Economic Area are required to surrender carbon allowances to cover their annual CO2 emissions. Therefore, although CO2 emissions from aviation are forecast to continue to grow in the UK and other EU countries, this growth will not result in any overall increase in the total CO2 emissions from sectors included in the EU ETS, because the aviation sector will pay for reductions to be made elsewhere. The overall
38 More detail on the forecasts and methodology can be found in the UK Aviation Forecasts report (January 2013) - https://www.gov.uk/government/uploads/system/uploads/attachment_data/file/223839/aviation-forecasts.pdf
41
result will be that the net contribution of the aviation sector within Europe to CO2 emissions will not exceed the level of the cap.
4.8 A detailed copy of the 2013 forecasts is available online39 and presents the results of a series of tests to illustrate the sensitivity of the forecasts to changes in key drivers within reasonable bounds.
4.9 All aspects of the forecasting methods used to produce the 2011 forecasts were subject to independent peer review. A series of peer review reports written by the independent peer reviewer, and a covering letter summarising the conclusions of the review, were published alongside the 2011 forecasts on the DfT website.40 The forecasting method has not changed since this peer review was carried out.
UK mitigation
Why is it important to address aviation’s climate change emissions?
4.10 While aviation is currently a relatively small contributor to total greenhouse gas emissions (both at the UK and global levels), the projected continuing growth in aviation emissions alongside emissions reductions in other sectors means that aviation’s share of total emissions is likely to increase significantly in the coming decades.
4.11 Available evidence indicates that the aviation sector is currently responsible for approximately one to two per cent of global greenhouse gas emissions.41 In the UK, domestic and international aviation accounts for 6% of all greenhouse gas emissions or 22% of the transport sector’s overall greenhouse gas emissions. The Government’s objective is to ensure that the aviation sector plays a full part in reducing the UK’s contribution to climate change.
UK policy on aviation and climate change
4.12 Commercial civil aviation is fundamentally international in nature and therefore differs from other transport modes, such as road and rail, which are, for the most part, domestically focussed. Flights departing from UK airports to international destinations account for about 95% of UK aviation emissions42, and GHG emissions emitted anywhere in the world contribute to a global problem which we believe requires a global solution.
4.13 Our emphasis is therefore on action at a global level as the best means of reducing emissions from aviation, with action at an EU level a second best option and a potential step towards wider international agreement. We will also take unilateral action at a national level where that is appropriate and justified in terms of the balance between benefits and costs. This is, however, more difficult to achieve for international flights due to the risks of market distortions.
39 https://www.gov.uk/government/publications/uk-aviation-forecasts-2013 40 https://www.gov.uk/government/publications/uk-aviation-forecasts-2011 41 Reducing Transport Greenhouse Gas Emissions: Trends and Data, International Transport Forum, 2010 http://www.internationaltransportforum.org/Pub/pdf/10GHGTrends.pdf/ Aviation and Marine Transportation: GHG Mitigation Potential and Challenges, Pew Centre on Global Climate Change, 2009, http://www.pewclimate.org/docUploads/aviation-and-marine-report-2009.pdf 42 Measured on a bunker fuel sales basis. Transport Statistics Great Britain, DfT, 2011, http://www.dft.gov.uk/statistics/releases/transport-statistics-great-britain-2011
42
4.14 The UK has played a leading role in securing progress internationally, both within the International Civil Aviation Organization (ICAO), and within the European Union (EU). The global nature of the climate change challenge and the international character of the aviation industry make a strong case for a global deal on emissions that is comprehensive, non-discriminatory and ensures that CO2 emissions are not simply displaced elsewhere. We believe that the primary objective for states, in reducing aviation emissions, should be to actively support steps towards such a global deal. The UK will, therefore, continue to push for an international agreement for global action.
4.15 The 2008 Climate Change Act established a legally binding target to reduce the UK’s greenhouse gas emissions by at least 80% below base year levels by 2050.43 The Act introduced a system of carbon budgets which provide legally binding limits on the amount of emissions that may be produced in successive five-year periods, beginning in 2008. The first four carbon budgets have been set in law, covering the time period to 2027.
4.16 Domestic aviation and shipping are already included in UK carbon budgets and so will need to contribute to meeting the 2050 target. Emissions from international aviation (and international shipping) currently do not form part of the target, as defined by the Act. It is likely that a decision on whether to include international aviation and shipping emissions in the carbon budgets going forward will be taken in light of progress with negotiations on the Global Market-Based Measure taking place in ICAO.
Aviation Marginal Abatement Cost (MAC) curve
4.17 In 2011, the Government commissioned analytical work on an Aviation Marginal Abatement Cost (MAC) curve to assess the potential for reducing CO2 emissions from different policy measures and the relative costs of doing so, the results of which were published in August 2011.44
4.18 A MAC curve is an analytical tool to present and compare estimates of the emissions savings from different (policy) measures (“abatement potential”), and the net cost of the measures (costs minus benefits) per tonne of emissions saved (the “cost-effectiveness”).
4.19 The MAC curve for 2050 that was generated for the central scenario is presented in Figure 7. Each policy option is represented by a block, with the width of the block representing the estimate of emissions savings from that measure in 2050, and the height of the block representing the total net cost (cost minus benefits) of the measure per tonne of CO2 emissions that it saves over the assumed lifetime of the policy.
43 http://www.decc.gov.uk/en/content/cms/tackling/carbon_plan/carbon_plan.aspx 44 A Marginal Abatement Cost Curve Model for the UK Aviation Sector, EMRC and AEA , 2011, https://www.gov.uk/government/uploads/system/uploads/attachment_data/file/4209/mac-report.pdf
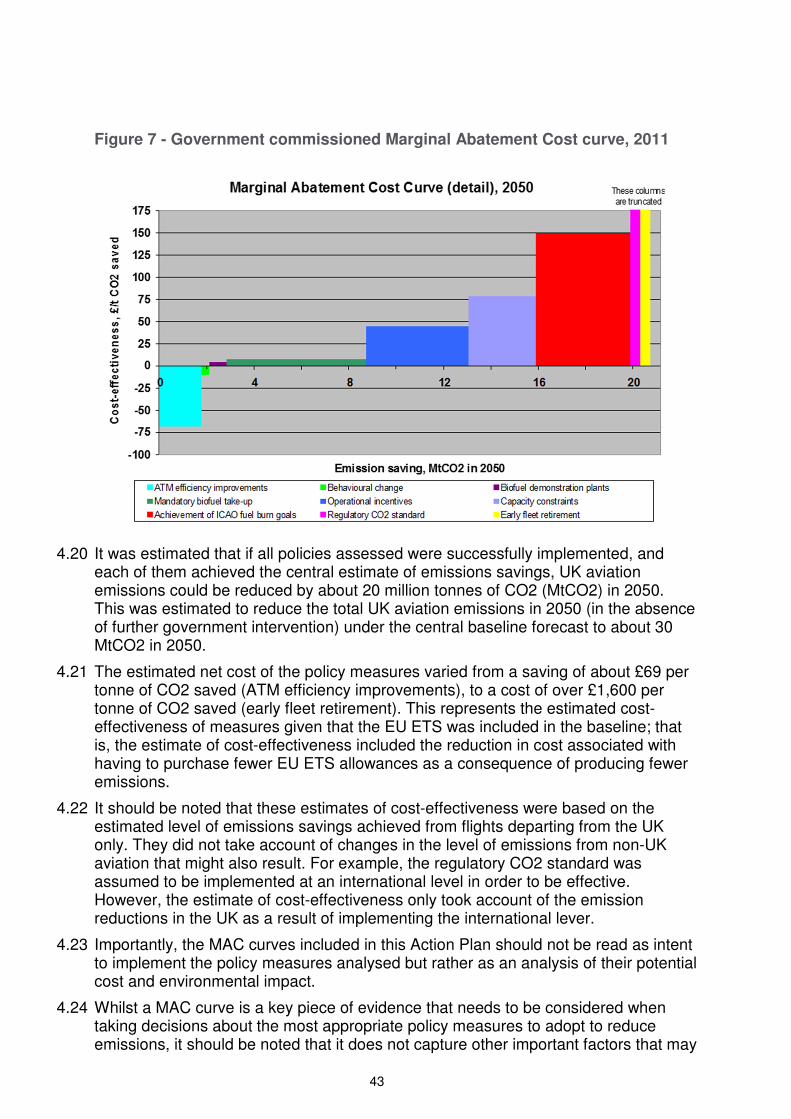
43
Figure 7 - Government commissioned Marginal Abatement Cost curve, 2011
4.20 It was estimated that if all policies assessed were successfully implemented, and each of them achieved the central estimate of emissions savings, UK aviation emissions could be reduced by about 20 million tonnes of CO2 (MtCO2) in 2050. This was estimated to reduce the total UK aviation emissions in 2050 (in the absence of further government intervention) under the central baseline forecast to about 30 MtCO2 in 2050.
4.21 The estimated net cost of the policy measures varied from a saving of about £69 per tonne of CO2 saved (ATM efficiency improvements), to a cost of over £1,600 per tonne of CO2 saved (early fleet retirement). This represents the estimated cost-effectiveness of measures given that the EU ETS was included in the baseline; that is, the estimate of cost-effectiveness included the reduction in cost associated with having to purchase fewer EU ETS allowances as a consequence of producing fewer emissions.
4.22 It should be noted that these estimates of cost-effectiveness were based on the estimated level of emissions savings achieved from flights departing from the UK only. They did not take account of changes in the level of emissions from non-UK aviation that might also result. For example, the regulatory CO2 standard was assumed to be implemented at an international level in order to be effective. However, the estimate of cost-effectiveness only took account of the emission reductions in the UK as a result of implementing the international lever.
4.23 Importantly, the MAC curves included in this Action Plan should not be read as intent to implement the policy measures analysed but rather as an analysis of their potential cost and environmental impact.
4.24 Whilst a MAC curve is a key piece of evidence that needs to be considered when taking decisions about the most appropriate policy measures to adopt to reduce emissions, it should be noted that it does not capture other important factors that may
44
also need to be considered, including impacts on the UK’s growth agenda, air quality, noise, non-CO2 emissions and consumer choice.
4.25 Furthermore, a MAC curve does not provide an answer to the question of how to deliver these measures; nor does it assess practical issues involved. Thus before any decision were taken on whether any of the options assessed in the MAC curve work should be taken forward, the feasibility and deliverability of each one would need to be considered in addition to their cost-effectiveness and the cost of implementation.
Aviation and biofuels
4.26 Sustainable biofuels have a role to play in reducing CO2 emissions from transport, particularly in sectors such as aviation where there are limited alternatives to fossil fuel. It is essential that biofuels lead to a worthwhile reduction in full life-cycle CO2 emissions, taking into account indirect land use change (ILUC), where production of biofuel from crops grown on existing agricultural land results in the displacement of production on to previously uncultivated land. The aviation sector will be competing with other sectors for limited sources of such sustainable biomass.
4.27 The inclusion of aviation within the EU ETS already provides an incentive to develop sustainable biofuels as an alternative to kerosene, as biofuel-powered flights are given a zero carbon rating under the ETS if that biofuel meets sustainability criteria set out in the Renewable Energy Directive. The Government needs to provide the right framework to ensure that only sustainable biofuels are used. In 2012 the Government published a coordinated, evidence-based bioenergy strategy45 which looks at the best use of available biomass resources for a long-term transition in technology. The European Commission came forward with a proposal designed to address ILUC in 2012 and negotiations are expected to conclude this year. Given legitimate concerns about the sustainability of some biofuels in relation to ILUC, we have not set increased targets.46 Once we have a better understanding of these issues we will be in a better position to decide where Government intervention may be justified and the extent to which biofuels offer a way forward.
4.28 Moreover, the Government launched a £25 million competition to build advanced biofuel plants on 10th December 2014.47 Funding from the Department for Transport is supported by significant private sector investment and will enable the construction of up to 3 demonstration biofuel plants, the first of their kind in the UK. Advanced biofuels are made from waste materials such as agricultural residues like straw, using complex processing techniques. They can produce a wide range of transport fuels, including aviation. This £25 million funding will be made available over 3 years. The competition will run until June 2015.
Non-CO2 emissions
4.29 While this Action Plan focuses specifically on CO2 emissions, the UK recognises that aviation’s total climate change impacts are greater than its CO2 emissions alone.
45 UK Bioenergy Strategy, Department of Energy and Climate Change, 2012, https://www.gov.uk/government/publications/uk-bioenergy-strategy 46 The UK supports the introduction of a limit on the contribution of crop based biofuels as low as possible in combination with additional incentives for the promotion of most sustainable advanced biofuels in a cost effective manner. The UK believes that ‘ILUC factors’ applied to feedstock groups should be considered when assessing the sustainability of different biofuels and should be introduced in the legislation as soon as possible. 47 Further detail on the competition can be found at https://www.gov.uk/government/speeches/advanced-biofuels-demonstration-competition
45
These other emissions such as Nitrogen oxides (NOx), sulphur oxides (SOx) and water vapour can have both cooling and warming effects on the climate, with an overall warming impact on the atmosphere. Despite advances over the past decade, considerable scientific uncertainty remains about the scale of the effect on climate change of non-CO2 emissions and there is no consensus on how to mitigate them.
4.30 The UK supports efforts to improve the understanding of the non-CO2 impacts of aviation and we participate in and help to fund a number of projects into non-CO2 impacts such as the impacts of contrails and NOx on atmospheric warming.
UK Government-funded research
4.31 The UK aerospace industry is working on a number of research and technology programmes, including some with support from the UK Government and others with European funding support. These programmes generally involve collaboration between manufacturers and their supply chains. The Government will continue to support and encourage such technological developments through industry-led projects. Key collaborative programmes involving Government support include:
• Airbus-led programmes on next generation wing design and manufacture; and electric systems and landing gear, investment totalling around £180 million;
• GKN led programmes on light weight composite material technologies and manufacture, investment to date around £58 million; and
• Rolls-Royce-led programmes of strategic investment into low carbon engine technologies, with investment to-date totalling around £200 million.
4.32 The Government also provides tax relief for certain research and development activities. Aerospace manufacturers are collaborating in complementary European programmes through the EC Framework 7 Programme and the Clean Sky Joint Technology Initiative, which are providing further access to funding.
4.33 The UK Department for Business, Innovation and Skills (BIS), is working in collaboration with industry through the Aerospace Growth Partnership (AGP), a joint initiative to support the UK aerospace sector backed with £2 billion of funding over seven years for R&D investment. The Aerospace Technology Institute (ATI) has been created to assist the AGP prioritise this investment. The ATI’s principal objective is to increase the UK’s share of work on aerospace programmes and deliver maximum funding impact.
UK aviation industry
4.34 UK industry continues to investigate innovative ways of addressing aviation’s climate change emissions through the use of new technologies, biofuels and offsetting.
4.35 Since 2012 Sustainable Aviation (SA), a coalition of UK airlines, airports, aerospace manufacturers and air traffic service provider NATS, has led a number of activities to reduce UK aviation CO2 emissions. SA’s latest progress report published in early 2014 captures the numerous activities undertaken across SA members in tackling CO2 emissions.48
48 http://www.sustainableaviation.co.uk/wp-content/uploads/SA-Prog-rept-2013-Final-Publication-v2NEW.pdf
46
4.36 The report shows that, over the last two years the number of aircraft movements operated by SA airlines has increased by over 80,000 flights or 9%.49 During this time CO2 emissions have increased by 1.6 million tonnes or 5.2%. SA argue in the report that, in line with their CO2 Road-Map’s modelling, over time UK aviation will decouple growth in air transport from an automatic growth in CO2 emissions as full fuel efficiency gains are realised. It also showed that there has been an improving trend in airline fuel efficiency per revenue tonne kilometre flown by SA airlines over the last 10 years. In the last two years fuel efficiency slightly worsened in 2011 but more than recovered in 2012 to achieve a record level. This improvement reflects the start of airline fleet replacement programmes, replacing older, less fuel efficient aircraft with newer ones and on-going aviation industry operational fuel efficiency initiatives. For example, since 2005, UK airlines have introduced more than 470 new aircraft into service representing an investment of over $49.6Bn at 2014 prices.
4.37 In December 2014, SA launched its new Sustainable Fuels Road-Map.50 Since launching this Road-Map Sustainable Aviation have been participating with the DfT Transport Energy Taskforce to explore opportunities for an ongoing public-private taskforce to enable the further development and commercial scaling up of sustainable aviation fuels.
4.38 The Airport Operators Association (AOA), the UK trade association for airports, has published the cumulative carbon footprint of the UK’s 18 busiest airports.51 The AOA finds that over a two year period carbon emissions fell by 2.9% whilst air traffic increased by 1.8% and passengers by 5.4%. The AOA’s report explains how carbon emissions are calculated (and explains which methods include emissions from aircraft in the take-off and landing cycle), and uses case studies to demonstrate how airports are achieving carbon reductions.
Civil society
4.39 The UK has an active NGO sector, which engages on aviation and climate change issues. DfT works closely with organisations like the Aviation Environment Federation, WWF, and the Royal Society for the Protection of Birds, and other environmental groups, on CO2 emissions from aviation, as well as a range of other topics including noise, air quality and natural resources.
CAA action on climate change
4.40 The UK Civil Aviation Authority (CAA) has a sustainability objective as part of its five-year Strategic Plan52 to ‘improve environmental performance through more efficient use of airspace and make an efficient contribution to reducing the aviation industry’s environmental impacts.’
4.41 The Strategic objective places the environment at the heart of the CAA’s activities. In achieving this objective the CAA will aim to improve understanding amongst consumers and the general public of aviation’s environmental impacts. The CAA has aligned its approach with that of UK Government’s high level strategic framework.
49 These figures are calculated from the CAA Airline Statistics for SA member airlines. See http://www.caa.co.uk/default.aspx?catid=80&pagetype=88&pageid=1&sglid=1 50 http://www.sustainableaviation.co.uk/wp-content/uploads/SA-SAF-Roadmap-FINAL-24-Nov.pdf 51 http://www.aoa.org.uk/wp-content/uploads/2014/09/AOA-Sustainable-Airports-Report.pdf 52 http://www.caa.co.uk/docs/33/CAP1092_Strategic_Plan_November2014.pdf
47
4.42 The CAA published its first environmental strategy in the summer of 2012 and refreshed this strategy in May 2014.
4.43 The Civil Aviation Act 2012 gave the CAA an information duty, which gives the CAA a role in promoting better public information about the environmental impact of aviation. This will improve consumer’s ability to make an informed choice.
4.44 The Act gives the CAA duties to publish or arrange for publication, information and advice that it considers appropriate relating to:
a. The environmental effects of civil aviation in the UK;
b. How human health and safety is, or may be affected by such effects; and
c. Measures taken, or proposed, for reducing, controlling or mitigating the adverse environmental effects of civil aviation in the UK.
4.45 The CAA published its policy for carrying out its information duties under the Civil Aviation Act 2012 in January 2014.
NATS action on climate change
4.46 NATS became the first air traffic service provider in the world to have challenging targets on operational CO2 emissions, and the first to benchmark the airspace system under their control. NATS is targeting a 10% CO2 reduction on average per aircraft in UK airspace by 2020 (against a 2006 baseline); this target was not set as a result of any regulatory requirement, but because NATS believes it has a key part to play in helping to deliver a sustainable future for the aviation industry.
4.47 Over the four years to December 2014, NATS have enabled a 4.3% CO2 reduction on average per flight, which equates to over £115 million in fuel savings for airline customers. The 300,000 tonnes of fuel savings (per year) that this programme has saved also equates to a reduction in aviation emissions of almost 1 million tonnes of CO2 per year.
4.48 These savings have been achieved through a combination of creating more direct routes, improving vertical profiles and making changes on the ground at airports where NATS provides the control service. In all, NATS have delivered over 250 individual improvements.
4.49 Delivering on NATS commitment required enormous effort across the business and many changes to the operation including significant investment projects such as the introduction of GAATS+ in Oceanic airspace, numerous local initiatives to reshape UK airspace and working with military colleagues to improve the sharing of training and danger areas.
4.50 The plan set out by NATS back in 2008 was to reduce aviation fuel burn by 10% per flight by 2020. Achieving 4.3% by the end of 2014 puts NATS right on track to do that. Below are some examples of the CO2 saving projects NATS has delivered:
UK Continuous Descents Campaign
4.51 Continuous descents offer triple benefits: reduced noise, reduced CO2 emissions, and reduced fuel costs. In addition, they are relatively simple to achieve and can provide tangible benefits in the short term.
4.52 The Sustainable Aviation Continuous Descent Operations (CDO) Campaign is a great example of cross-industry collaboration and should result in tangible benefits
48
for all involved. NATS, as a founder member of Sustainable Aviation, is leading on the project and has invested considerable time and effort into ensuring its success.
4.53 The unique aspect of this campaign is the large scale simultaneous effort across ATC units, airlines and airports to jointly deliver a step change in CDO performance. The campaign brings together 8 UK airlines, 23 airports and 15 air traffic approach units to collectively deliver the improvements. The aim is to achieve a 5% increase in CDOs across the UK, delivering over 30,000 individual quieter arrivals, and saving around 10,000 tonnes CO2.
4.54 Achieving this goal will require close collaboration and joint effort between pilots, air traffic controllers and airport operators. The UK aviation industry is already delivering CDOs really well in some areas, but now have an opportunity to make this consistent across the country and begin considering descent profiles from higher altitudes too.
4.55 For the first time the campaign will be monitoring CDO achievement from higher altitudes. Previously in the UK, Continuous Descent Approaches have focussed on reducing noise when aircraft are descending below 6000ft. Sustainable Aviation, is now moving to consider aircraft descent profiles from cruise to ground. Improvements at the higher altitudes have fuel and emissions benefits while the lower level improvements offer noise benefits too.
4.56 Consequently NATS are monitoring CDO achievement from the traditional 6000ft as well as from higher altitudes too. In the mid to long term, airspace improvements will facilitate CDO from cruise. The campaign however is focussed on realising improvements in the short term from wider adoption of best operational practice.
Oceanic Air Navigation Improvements
4.57 An innovative and shared oceanic air traffic control system with enhanced features has been implemented at NATS’ Control Centre in Prestwick, Scotland and NAV CANADA’s Control Centre in Gander, Newfoundland, to assist controllers as they direct aircraft across the North Atlantic – the busiest oceanic airspace in the world.
4.58 This is the latest in a series of air traffic control technology and procedural advances in this airspace, in which NATS and NAV CANADA are responsible for providing service to over 400,000 flights per year between Europe and North America.
4.59 The technology, originally installed in Gander and operational in Prestwick since February 2015, is known as the Gander Automated Air Traffic System (GAATS+) – the world’s most advanced oceanic air traffic system.
4.60 These tools mean controllers can offer aircraft crossing the Atlantic the optimum flying altitude for their type of aircraft in order to minimise fuel burn and CO2 emissions.
Free Route Airspace
4.61 In 2015, NATS will be introducing a revolutionary way for airlines to plan their routes with a concept called Free Route airspace. Effectively this means the removal of some of the constraints currently placed on the ‘motorways’ in the sky. This will be launched first in Scottish airspace before being introduced across the rest of the UK and should result in even more fuel and CO2 savings.
49
SESAR and TOPFLIGHT
4.62 One of the most important ways in which NATS seeks to help reduce the environmental impact of aviation is through the Single European Sky ATM Research programme (SESAR).
4.63 NATS is either leading or heavily involved in a number of SESAR projects, many of which will help reduce the environmental impact of aviation. NATS leads the Work Package looking at Terminal Manoeuvring Area (TMA) Operations and on the TOPFLIGHT project, which tests sustainable gate to gate transatlantic flight optimization. NATS also leads on another project which considers the environmental implications of all SESAR programmes and is also an active contributor to a number of other projects.
50
5. Conclusion
5.1 This Action Plan provides an overview of the actions undertaken in the UK at the national and the supra-national level within Europe to address CO2 emissions from aviation and to contribute to the development of a resource‐efficient, competitive and sustainable multimodal transport system.
5.2 The UK national actions (Chapter 5) of this Action Plan were completed on 30 June 2015, and shall be considered as subject to update after that date.