UK HIGHER EDUCATION SPACE MANAGEMENT · PDF file · 2017-11-10uk higher education...
33
UK HIGHER EDUCATION SPACE MANAGEMENT PROJECT THE COST OF SPACE REPORT smg space management group
Transcript of UK HIGHER EDUCATION SPACE MANAGEMENT · PDF file · 2017-11-10uk higher education...

UK HIGHER EDUCATIONSPACE MANAGEMENT PROJECT
THE COST OF SPACE REPORT
smgspace management group

TM
ENVIRONMENTALLY FRIENDLY
Alternative formats This publication can be downloaded from theHEFCE web-site (www.hefce.ac.uk) underPublications. For readers without access to theinternet, we can also supply it on 3.5'' disk or inlarge print. Please call 0117 931 7035 foralternative format versions.
© 2005 DEL/HEFCE/HEFCW/SHEFC

Contents
Page
Executive summary 3
Introduction 6
Conceptual framework 7
Sustainable estate provision and the sustainable estate 7
The total estate provision and the optimal estate 7
The cost of space 7
Components of the sustainable estate and total estate provisions 7
Sustainable estate provision for the HE non-residential estate 11
The opportunity cost of capital 12
Total estate provision for the HE non-residential estate 16
Sustainable estate and total estate provisions by type of space 17
Benefits of charging the total estate provision 21
References 23
Annex 1 Economic theory of optimal space use 25
Annex 2 TRAC and the SMG Model of the Affordable Estate 29
List of abbreviations Inside back cover
Feedback and supportA detailed Question & Answer section is regularly updated and posted on theSpace Management Group (SMG) web-site. However, should you wish toprovide feedback on any aspect of SMG work or have questions on how touse the findings or web-site model please send an e-mail to: [email protected].
AcknowledgmentsWe would like to express our thanks to the members of the UK HigherEducation Space Management Group for their guidance and comments and toall the HEIs which shared their space management data, practices and issueswith us.
HEFCE 2005/26 1

2 HEFCE 2005/26

Executive summary 1. This summary gives readers an overview of the work undertaken indeveloping a methodology to calculate and benchmark the total cost of anyhigher education institution’s (HEI’s) non-residential estate in the UK.
Why is the cost of space important?2. Effective space management techniques and tools can help HEI managersmake more informed choices and budgeting decisions regarding the size oftheir estates. Understanding cost, what drives cost and how it can bemeasured are important elements in this decision-making process. This reportsets out a step-by-step approach to calculating the cost of an HEI estate.
3. To understand the empirical drivers of the size of an HEI’s estate readersshould consult the companion report: ‘Drivers of the size of the highereducation estate’.
4. There is also an interactive spreadsheet model on the SMG web-site(www.smg.ac.uk) that enables any HEI to construct its own estimates for thecost of its space and to benchmark the size of its estate.
Modelling the cost of space5. We have constructed two different measures for the cost of an HEI’s non-residential estate:
• the sustainable estate provision
• the total estate provision.
6. The sustainable estate provision includes the following cost components:
• operating costs such as energy, water and cleaning
• the maintenance spending necessary to keep space in good condition
• the cost of building depreciation – including the cost of replacing buildingsat the end of their lives.
7. The sustainable estate provision is the expenditure per m2 required tomaintain the non-residential estate in a good and fit for purpose conditionindefinitely.
8. The total estate provision also includes an estimate of the opportunity costof the capital which is tied up in buildings and the land beneath them. Thisopportunity cost is equal to the investment income an HEI forgoes by owninga building or land rather than selling the property and investing the proceeds.
9. The total estate provision takes into account all the explicit and implicitcosts of using space, and approximates to the rent that would be charged by alandlord. As such, it provides useful information for determining a fully cost-reflective space charge.
HEFCE 2005/26 3

4 HEFCE 2005/26
The level of non-residential estate costs10. We evaluated each of these costs for HEIs across the UK. While we tookan HEI’s operating costs directly from its spending records for energy, water,cleaning, rates and similar costs, we had to make several assumptions toestimate other costs. This report explains the basis of these assumptions.
The average sustainable estate provision is £147.40 per m2
11. We estimate the sustainable estate provision for space to average £147.40per m2 annually across UK HEIs on the basis of the Estate ManagementStatistics (EMS) data for 2002-03. This cost comprises:
• operating cost: £43.80 per m2
• maintenance cost: £53.40 per m2
• depreciation cost: £50.20 per m2
The total estate provision is £192.50 per m2
12. This figure is obtained by adding an opportunity cost of capital of£45.10 per m2 to the sustainable estate provision.
The sustainable and optimal estates
The sustainable estate provision can be used to determine the‘sustainable estate’
13. An HEI’s ‘sustainable estate’ is the ratio of its estate budget to itssustainable estate provision per m2. The sustainable estate is the amount of itsexisting space the HEI can afford to maintain in the long run. Our model ofthe sustainable estate provision, together with accurate data on total estatebudgets, allows HEIs to calculate their sustainable estates. A sustainableestate smaller than an HEI’s current estate would identify a funding shortfall.
The total estate provision can be used to determine the ‘optimal estatesize’
14. The sustainable estate will not necessarily be the optimal estate sizebecause it does not involve any assessment of the trade-offs between aninstitution’s spending on the estate and spending on other resources. Even ifan HEI can sustain its current estate, it might choose to release some space sothat it can spend more cash on other resources, such as staff salaries. Whenan HEI is at the point where it would not wish to release any space (oracquire new space) in order to spend more (or less) elsewhere, it has achievedoptimal estate size.
The model15. The interactive spreadsheet model on the SMG web-site allows an HEI tofind its own estimates of the sustainable estate and total estate provision usingeither our default values or its own institution-specific information andassumptions.

HEFCE 2005/26 5
16. The focus of the cost spreadsheet and benchmarking tool in the model onthe web-site is the net internal area of an HEI’s non-residential estate.
17. To facilitate the use of both tools, EMS data and a number of otherparameters are provided as default settings, but users are free to overridethese with their own data.
18. The cost spreadsheet allows users to calculate both the cost ofmaintaining the estate in a steady state and the total estate provision takinginto account the opportunity cost of the funds tied up in the estate.
19. An HEI can compare the size of its estate with the one that thebenchmarking tool predicts and see the effect of various different assumptionson the estate size predicted. It is important to note that, because it is based onthe average relationship across the sector, the benchmark does not reflect thebest or most efficient use of space. Moreover, the benchmark result should beviewed as space management information for an HEI determining theappropriate size of its estate but not as a normative space guide. There maybe specific reasons why a particular HEI’s estate deviates from the size thatthe benchmark tool predicts.
NoteAnnex 2 of this report clarifies the differences between the SMG Modelof the Affordable Estate and the Transparent Approach to Costing(TRAC) methodology.

6 HEFCE 2005/26
Introduction20. As part of the three-year research project on space management in thehigher education (HE) sector commissioned by the UK Funding Councils inAugust 2003, we (Kilner Planning and London Economics) undertookextensive research on:
• the factors that help explain the variation in the size of the non-residential estate across higher education institutions (HEIs)
• the cost of the non-residential estate.
21. Effective space management techniques and tools can help HEIs makemore informed choices and budgeting decisions regarding the size of theirestates. Understanding cost, what drives cost and how it can be measured isan important element in this decision-making process. This report sets out astep-by-step approach to calculating the cost of an HE estate.
22. The web-based model, that is to be used in conjunction with this report,is based on the results of our research. It will assist an HEI in determining thesize of the estate it could sustainably or optimally hold. Additionally, theresults can be used by the HEI to benchmark the size of its estate, forecastestate requirements and undertake scenario planning. The model is highlyflexible and can be adapted to a user’s specific needs.
23. In this report, we provide an in-depth discussion of two space costmeasures, the sustainable estate provision and the total estate provision.These two measures differ conceptually, but both are useful spacemanagement tools. In this report, we discuss in greater detail the two spacecost concepts, show how they can be constructed, and for illustrativepurposes, report the average sustainable estate provision and the total estateprovision across all HEIs for which we have data.
24. Sector-wide averages are based on Estate Management Statistics (EMS)data and a number of assumptions. An important variable is the insurancereplacement value (IRV) of the non-residential estate. As insurance practicesvary between HEIs, the insurance replacement value reported in EMS maynot be strictly comparable across HEIs. This in turn could affect thecalculated sector averages. We also report similar average cost estimates forvarious HE space categories such as teaching space and research space.
25. In one of our reports, ‘Drivers of the size of the higher education estate’,we present the results of our statistical analysis of the factors explaining thevariability in the size of the non-residential estates across HEIs.
26. The structure of this report is as follows:
• we present in greater detail the two cost concepts
• we then describe how the two cost measures can be estimated and reportHE sector-wide estimates of the two cost measures of the non-residentialHE estate
• we present similar sector-wide cost estimates for various non-residentialspace categories

HEFCE 2005/26 7
• finally, we describe the feedback and support systems implemented aspart of the project.
In Annex 1, we show how the optimal size of the estate can be derived usingeconomic theory and basic economic principles.
Conceptual framework27. Below, we describe in greater detail the two space cost concepts,beginning with the sustainable estate provision.
Sustainable estate provision and the sustainable estate28. We define the sustainable estate provision as the annual cost of keepingan HEI’s estate in a good and fit for purpose condition.
29. The cost of maintaining the estate in a good and fit for purpose conditionincludes operating and maintenance costs. It also requires providing for thereplacement of buildings at the end of their lives and for periodic refits toeach building.
30. The sustainable estate is the estate that, given the sustainable estateprovision, an HEI can provide on an on-going basis at a certain level of estatespending. This level of spending may be either the current estate budget orany other level chosen by the HEI.
The total estate provision and the optimal estate31. The total estate provision is the sum of the sustainable estate provisionand the opportunity cost of the funds tied up in the existing estate.
32. The optimal estate is the size of the estate at which, given the explicit orimplicit prices of estate and other teaching/research factors, an HEI does notwish to change the mix between these areas. In other words, at this optimalestate level, an HEI is happy with the status quo, neither wishing to disposeof any estate and use the proceeds elsewhere, nor wishing to reduce spendingon other areas in order to add more space.
The cost of space33. This section reviews how the sustainable estate provision and the totalestate provision can be estimated, and then constructs the costs from theircomponents.
Components of the sustainable estate and total estateprovisions34. The following discussion reviews the components of the two space costconcepts. All costs are based on costs per m2 of net internal non-residentialarea as defined in EMS.
Operating costs
35. Operating costs are the short-run costs of using a building. Using EMSdata, we defined operating costs as the sum of an HEI’s energy, rates, water,sewerage, cleaning, security and porterage costs, and its insurance premiums

8 HEFCE 2005/26
and service charges. We have also added the HEI’s internal and externalproperty management costs.
36. The EMS net service charges (i.e. the costs of leased space minus rentalincome on space let out) are not included in operating costs in the costspreadsheet, as all the costs related to rented property (buildings and land)are considered separately.
37. The 2004 EMS report provides data on all the elements of the totalestate provision for 121 HEIs in 2002-03.1 Of these 121, the mean operatingcost per m2 of the non-residential estate is £43.80. Operating costs per m2
vary greatly across HEIs; the standard deviation is £14.40. Figure 1 shows thedistribution of operating costs per m2.
Maintenance costs
38. We define the total estate provision as the cost of keeping buildings intheir current condition. Therefore, the cost of maintenance includes the costof all maintenance required to keep the quality of a building’s fittings in goodcondition.
39. The EMS includes data on actual HEI maintenance spending. Of the 121HEIs with maintenance spending data, the mean expenditure per m2 for thenon-residential estate in 2002-03 is £22.80. However, the backlog of repairsin the HE sector suggests that average HEI maintenance spending isinsufficient to maintain the HE estate in good condition. Therefore, in our
HEIs0
10
20
30
40
50
60
70
80
90
£ p
er m
2
Source: London Economics and EMS 2002-03
Figure 1 Operating cost of net internal non-residential space
1 Where data for cleaning, water or other cost elements are missing, we omit the HEI from ourcalculations. Where external property management costs or net service charges are missing, weassume these costs were zero and retain the HEI in our calculations.

HEFCE 2005/26 9
illustration of the calculation of the total estate provision we do not useactual HEI maintenance spending in our estimate of cost, but a level thatwould keep buildings in good condition throughout their life.
40. In its 2004 (and 2003) ‘Review of Maintenance Costs’, BuildingMaintenance Information (BMI) uses a benchmark building maintenance rateof 2.5 per cent of a building’s capital cost. This benchmark figure is anaverage across many sectors, and may not be appropriate for all HEIs.Moreover, the percentage reported by BMI may change from time to time.Nevertheless, in the absence of better information, we believe that this 2.5 percent figure provides a good benchmark.
41. Therefore, we have used the BMI’s finding, and applied this 2.5 per centfigure to the insurance replacement values (IRVs) given in the EMS. Webelieve IRV is the relevant measure to use for the non-residential estate’s‘capital cost’ in this context, because maintenance costs relate to the cost ofbuildings, but not to the value of the land on which the estate sits. Similarly,IRV reflects the cost of replacing the physical structures, but not the land.
42. So, for the 121 HEIs in the EMS with complete data for 2002-03, this‘full maintenance cost’ averages £53.40 per m2 of non-residential estate. Thestandard deviation is £20.20.
43. Adding this maintenance cost to the £43.80 average operating cost givesan average running cost of £97.20 per m2 of non-residential estate.
44. This average of £97.20 is somewhat higher than the £84.30 medianrunning cost per m2 of non-residential estate quoted by the EMS AnnualReport 2004 (HEFCE 2004/45) However, this £84.30 figure also includes anHEI’s rateable value in its running costs, which we omit. The two costmeasures are therefore not comparable. The EMS cost figure includes rateablevalue as a proxy of the market rent, while we make a separate explicitestimate for market rental value, which is discussed later in the report.
45. Our running-cost figure of £97.20 is substantially lower than the totalestate provision, since it omits both a depreciation charge and theopportunity cost of capital.
Depreciation costs
46. We define a building’s depreciation cost as the sum that must be savedeach year to be able to replace a building at the end of its natural life and payfor periodic refits to the building.
47. We assume the sums saved each year earn interest until they are spent.Thus, if a building had a 10-year life, we would calculate an annualdepreciation cost below 10 per cent of the replacement value, due to theinterest earned on the HEI’s depreciation fund.
48. We assume the cost of replacing a building is its IRV, as given by theEMS data. However, IRVs may not always equate to replacement costs, forthe following reasons:
• IRVs that are not regularly updated may not reflect changes inconstruction prices
10 HEFCE 2005/26
• IRVs may understate the cost of replacing HEI estates, as some HEIs maynot fully insure
• conversely, an IRV may reflect the cost of replacing like for like. In thecase of historical estates this might exceed the cost of replacing old spacewith new space of equal functionality.
49. In our illustrative example, we assume that an HEI’s buildings last 60years and undergo major refits when they are 15, 30 and 45 years old, witheach refit costing 30 per cent of each building’s IRV. We also assume thatHEIs do not wish to hold any risk in their depreciation funds. Thus, weassume these funds include only inflation-indexed UK long-term governmentbonds, which on average earn a 2 per cent real interest rate.2
50. These assumptions imply an annual depreciation cost of 2.35 per cent ofinsurance replacement value.
51. Thus, of the 121 HEIs in the 2002-03 EMS with full data, the meandepreciation cost is £50.20 per m2 of non-residential estate. The standarddeviation is £19.00.
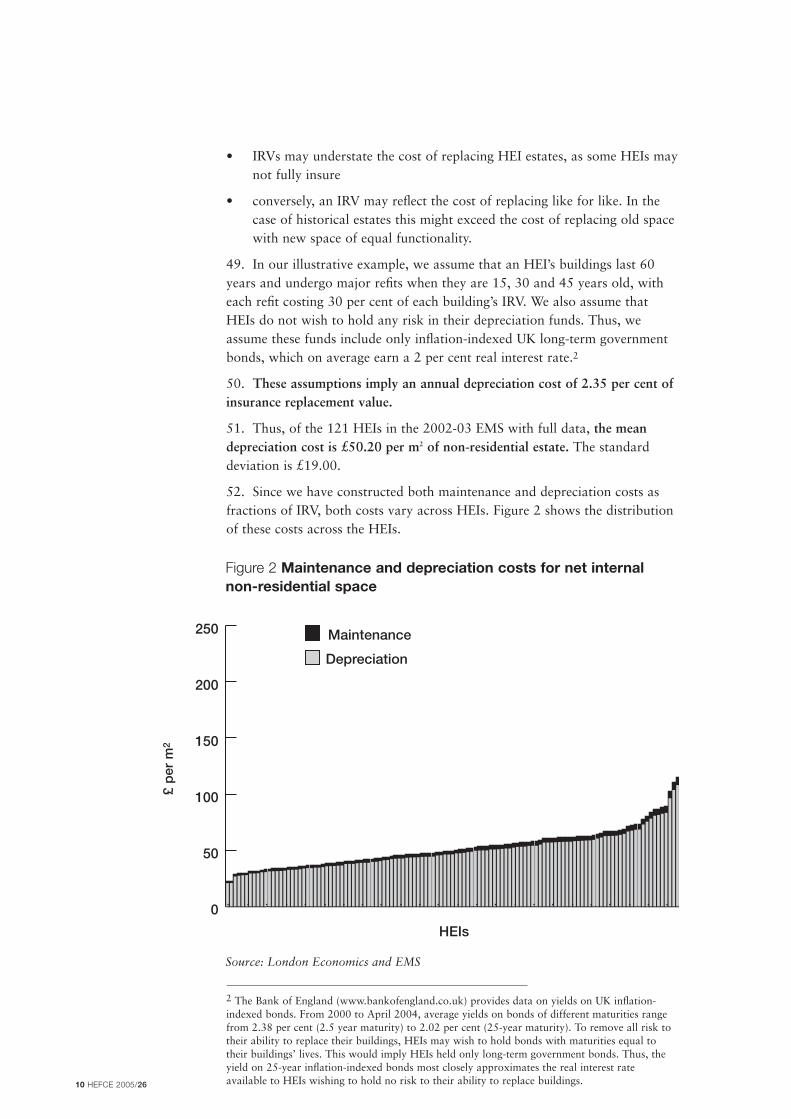
52. Since we have constructed both maintenance and depreciation costs asfractions of IRV, both costs vary across HEIs. Figure 2 shows the distributionof these costs across the HEIs.
2 The Bank of England (www.bankofengland.co.uk) provides data on yields on UK inflation-indexed bonds. From 2000 to April 2004, average yields on bonds of different maturities rangefrom 2.38 per cent (2.5 year maturity) to 2.02 per cent (25-year maturity). To remove all risk totheir ability to replace their buildings, HEIs may wish to hold bonds with maturities equal totheir buildings’ lives. This would imply HEIs held only long-term government bonds. Thus, theyield on 25-year inflation-indexed bonds most closely approximates the real interest rateavailable to HEIs wishing to hold no risk to their ability to replace buildings.
Figure 2 Maintenance and depreciation costs for net internalnon-residential space
Source: London Economics and EMS
HEIs
Depreciation
0
50
100
150
200
250 Maintenance
£ p
er m
2

HEFCE 2005/26 11
Sustainable estate provision for the HE non-residential estate
53. The sum of operating, maintenance and depreciation costs is thesustainable estate provision.
54. Full funding of the sustainable estate provision would be sufficient for anHEI to maintain its estate fit for purpose and in good condition indefinitely,since this would enable the HEI to pay its operating and maintenance costs,pay for periodic refits, and replace buildings at the end of their lives. On thebasis of our assumptions, we estimate the sustainable estate provision for theHE non-residential estate to average £147.40 per m2, that is:
£43.80 (operating cost) + £53.40 (maintenance cost) + £50.20(depreciation cost) = £147.40
It is important to note, however, that even if an HEI’s estate is of asustainable size, it may not be of an optimal size. This is because thesustainable estate provision excludes the opportunity cost of funds tied up inthe estate.
55. To determine the total estate provision for the non-residential estate, andhence its optimal size, HEIs must consider the cost of the capital that is tiedup in the estate. This rationale underlies the use of capital charging in theprivate sector. For example, the Royal Institution of Chartered Surveyors,RICS, recommends companies charge their business units the full market costof the space they use.3 Successive UK governments have also used thisrationale to introduce capital charges in the NHS (1991) and in centralgovernment (since 1999-2000), as part of the Treasury’s move to ResourceAccounting and Budgeting (RAB).
56. For example, HM Treasury (1998) states:
‘Capital charging will embody for public services the disciplines faced bythe private sector to manage assets well’ and,
the Ministry of Defence, MOD (2002) states:
‘Under RAB, the MOD’s budgets and accounts display the full cost ofholding and using capital. This means a charge for depreciation – usingup an asset – counts as part of the budget, as does a cost of capitalcharge, reflecting the fact that we have tied up in fixed assets, capitalthat could have been used elsewhere.’
57. In the next section, we discuss in greater detail how the opportunity costof capital is estimated.
3 For example, RICS (2002) states (p.51) ‘What owner-occupiers should do is firstly value theproperty they own at current market rates; secondly, calculate the appropriate market rent thatthey would be paying if they did not own the property (often referred to as the “imputed rent”);calculate all the other property costs they pay, such as taxes and facilities management; andfinally pass on the full costs of property usage to the business units via internal charging.’

12 HEFCE 2005/26
The opportunity cost of capital58. The opportunity cost of capital is the flow of earnings an HEI forgoes byowning a building rather than selling it and investing the proceeds.4
Therefore, to find the opportunity cost of the capital tied up in the estate, it isnecessary to estimate the price that the various parts of the estate would fetchin the market place.
59. Selling a building and investing the proceeds produces the flow of fundsPi, where P is a building’s market price and i is the interest rate. However,owning a building produces the capital gain Pa, where a is the expected rateof appreciation in the building’s price. Thus, the flow of earnings forgone byowning rather than selling a building is P(i-a).
60. To estimate the opportunity cost of capital, we require estimates of P, iand a.
Constructing the space value P
61. P is the open market value (OMV) of each HEI’s estate. This is thelargest amount of funds that could be gained from selling the estate.
62. Data on the market prices of HEI estates are not available across the sector,however. The EMS data do not provide market prices of estates, and HEIaccounts typically list their buildings at historical cost rather than market price.5
63. In the absence of open market values for HEI estates, alternative valuescan be used to proxy for P. Without data on P, we cannot be sure how theseproxies relate to P. We can, however, make some educated guesses, based onthe construction of these proxies.
Proxies for P – market prices of office buildings
64. Sale prices of office buildings provide a reference value for the marketprice of parts of HEI estates. Data on sale prices per m2 of office buildings in2003 show that these prices differ substantially across towns and for differentbuildings in the same town.6 Their overall range is wide, from £936 per m2 to£5,632 per m2.
65. HEI estates may have lower market prices than purpose-built officebuildings as some HEI buildings are of a specialist design that would becostly to adapt for private sector use.
Insurance replacement value
66. Our discussion of depreciation costs noted reasons why IRV may differfrom a building’s replacement costs. There are other reasons why it may differfrom the market price P:
• first, in principle IRV reflects the cost of building replacement buildings,and thus excludes the value of land beneath a building
4 We understand that some HEIs are strongly of the view that, for various reasons, their estatecould not be sold. While we present the general approach in this section, we will address suchspecial situations later on.
5 Several HEI annual accounts can be accessed via http://bufdg.niss.ac.uk/pub/accountsurls.html.
6 These prices are given in Knight Frank’s UK Research Reports at http://www.knightfrank.co.uk.

HEFCE 2005/26 13
• second, IRV may reflect the value to an HEI of its historical buildings. Thismay exceed their value to alternative users, and thus their market price
• third, and importantly, the IRV could be higher than P because it doesnot reflect the age and obsolescence of much of the HE estate.
67. The mean IRV of non-residential estate is £2,188 per m2 across theinstitutions providing IRV information in the 2002-03 EMS.
68. In some cases the IRV may be roughly comparable to what an estate’smarket value would be, but in others it could be above or below dependingon alternative use assumptions and the local property market.
Rateable value and underlying capital value
69. As noted earlier, in principle the rateable value of a property used by itsowner reflects the rent a property could fetch in the market. This rent is basedon observed market rents for similar properties if available or, in cases wherethere is little or no comparable evidence, on an estimate of the capital valueof the building and the land, which is often based on the contractor’s methodof valuation. The 1995 and 2000 rating reviews set the rateable value (RV)on HEI buildings as 3.67 per cent of capital value (Office of the Deputy PrimeMinister, ODPM 2003). Thus, we can use RVs reported in the EMS to derivethe capital value as calculated for rating purposes.
70. The contractor’s method is a depreciated replacement cost of buildings,with an addition for land value (ODPM 2003). However, the land is notincluded at its market price. Rather, the land is priced at a level with ‘a sitewhich would enable the HEI to function equally well’ (Valuation OfficeAgency, VOA, 2003). But, such a site may be some distance from the HEI’sactual location and could be cheaper.
71. For the 121 HEIs in the 2002-03 EMS with complete data, the averagecapital value underlying the rateable value is £902 per m2 of non-residentialestate. This is lower than the average IRV.
Depreciated replacement cost valuations
72. Depreciated replacement cost (DRC) valuations would provide anothermeasure of the value of HEI buildings. However, it would exclude the valueof the land beneath these buildings. We asked several HEIs for DRCvaluations of their estates, but only some have them.
73. One HEI supplied us with data on alternative valuations of its estate, asfollows:
• IRV £48.19 million
• DRC £25.72 million
• OMV £10.55 million
• capital value for rating of £25.1 million.
Conclusion
74. In our sample calculation of the total estate provision, we use the capitalvalues underlying rateable values as the basis for calculating the opportunity

cost of capital. These are readily available, estimated by third parties and easyto use. It is, in theory, an estimate of the market value of an HEI estate,though the method of valuing land in the estate suggests it may differ fromthe true market value.
75. Ideally, in their own calculations, HEIs should use accurate and up-to-date open market valuations of their estates to establish the cost of capitaltied up in them. While this may not be current practice, we note that NHScapital charges for users of the NHS estate are based on regular revaluationsof land and buildings, at market value where possible and otherwise at DRC(NHS Estates 2003).
76. Next, we address the issue of the yield (interest rate) to be used inestimating the cost of capital.
Constructing forgone interest (i-a)
77. We calculate the cost of forgone interest i-a assuming that, if an HEI soldsome of its estate, it would wish to hold the same amount of risk in itsfinancial portfolio after the sale as it had before.
a. We start by assuming the HEI holds a portfolio of real estate, equity andbonds. Our baseline assumption for our illustrative example is that itsportfolio is split 60:20:20 between the three assets.
b. Next we calculate the expected return and variance of the HEI’s portfoliogiven these portfolio shares and data on returns for real estate, equityand bonds from 1971 to 2003 from Investment Property Databank, IPD(2004).7
c. We then assume the HEI sells real estate worth 1 per cent of its portfolio,and reallocates the proceeds to a mix of equity and bonds so that thespread of its portfolio is the same as before the real-estate sale.
d. Forgone interest i-a then equals the increase in the expected return on theHEI’s portfolio (multiplied by 100 since we assume 1 per cent of theportfolio was reallocated).
e. If the typical HEI initially holds a 60:20:20 portfolio in real estate, equityand bonds respectively, then (i-a) = 5.1 per cent in real terms.
78. This approach is theoretically coherent. However, deficiencies in data onreal estate returns create some problems. For example:
a. The variable a represents expected price appreciation on an HEI’s estate.Without specific data on these price expectations, we use the averagehistorical capital gain on UK commercial real estate as a proxy for a.This average may differ from the expected price appreciation on a givenHEI’s estate.8
b. Since buildings are sold infrequently, historical data on real estate pricesdepend heavily on agents’ valuations. It is reported that these valuations
14 HEFCE 2005/26
7 In these data, the geometric mean real returns on equities and government bonds are 5.8 percent and 3.6 per cent respectively. The geometric mean capital gain on real estate is -2.1 per cent.
8 If the value of the estate is based on the contractor’s value the price appreciation will reflectboth the increase in construction costs (which affects the value of the structures) and the increasein land prices.

tend to be less volatile than actual sale prices (Booth and Matysiak2001). Thus, our data may understate the risk to holding real estate.
c. The forgone interest term (i-a) can vary greatly according to the HEI’sassumed initial portfolio. For example, if the initial portfolio is split90:5:5 between real estate, equity and bonds, i-a = 14.7 per cent. Thisshows that such an HEI has a strong motive to sell some real estate so asto reduce the overall risk of its portfolio.
d. Average future returns on financial assets may differ from their historicalaverages.
Estimates of the opportunity cost of capital in HEI estates
79. As we have just noted, our baseline assumptions imply that(i-a) = 5.1 per cent. For simplicity we have rounded this to 5 per cent. Thisimplies that, using the underlying capital values calculated for rating purposesas a proxy for P, for the 121 HEIs with complete data in the 2002-03 EMSthe average cost of capital on non-residential estate is £45.10 per m2. Thestandard deviation is £17.70. Figure 3 shows the distribution of theopportunity cost of capital per m2 across HEIs, using the capital valueunderlying rateable value as a proxy for market price.
Figure 3 Opportunity cost of capital using contractor’s value asa proxy for market price
Source: London Economics and EMS 2002-03
What if the estate cannot be sold?
80. Some representatives of the HE sector expressed concern that HEIs couldnot always dispose of space. For example, some buildings were donated toHEIs under covenants that prohibit their use for non-educational purposes.Further, it was noted that ‘Exchequer Interest’ in buildings could in principlemean all revenues from disposing of space reverted to the Treasury, rather
HEFCE 2005/26 15
HEIs
0
10
20
30
40
50
60
70
80
90
£ p
er m
2

than to the HEIs that sold them. If this were true the buildings would have novalue or only a negligible one in terms of determining the opportunity costsof the funds tied up in the estate.
81. A full investigation of HEI options for disposing of space goes beyondthe scope of this report. However, we believe that, in many cases, HEIs coulddispose of space and retain the proceeds. It is rare that buildings have novalue. HEIs may be able to change the terms of covenants on building use,although this may involve long and difficult procedures, or sell space that isnot restricted by covenants. Further, the rules of Exchequer Interest permitHEIs to retain revenues from selling or letting space, so long as these revenuesare reinvested in the HEI’s estate (HEFCE 2003d).
82. Where HEIs are unable to dispose of space, the opportunity cost of spacemay fall below the total estate provision figures this report quotes, but this isnot necessarily the case. The following hypothetical example illustrates thispoint.
83. Suppose an HEI owned some space and rented the remainder at marketrents. Ignoring the many other factors that may be in play, space users wouldbe willing to pay as much as the market rent to use the HEI’s owned space.For each unit of owned space used, space users would reduce their bill forexternal rent by the market rent for a similar unit. Thus, if an HEI rents somespace at the market rent, the opportunity cost of its owned space equals themarket rent, which in principle equals the total estate provision estimated bythis report.
84. Alternatively, an HEI may own all its space. If such an HEI had aninternal market for space, space user bidding would set a price in this marketthat reflected the willingness to pay for space. This price could either be equalto or lower than the market rent for external space. However, without aninternal market, it would be difficult for outside observers to determine userwillingness to pay for space. If the HEI set a space charge of say £100 per m2,and space users left some space empty, we would know only that space userswere willing to pay less than £100 to use marginal units of space.
85. To summarise, we believe that in many cases, HEIs can dispose of space,so that the total estate provision estimated by this report typically reflects thecost of space at these HEIs. Even if HEIs could not dispose of space, the costof their space would equal the total estate provision in some circumstances. In other cases, the cost of space would fall below the total estate provisionestimated here, but would be difficult or impossible to estimate without furtherinformation on the space users’ willingness to pay for the use of the space.
Total estate provision for the HE non-residential estate 86. To recap, the total estate provision is equal to the sustainable estateprovision plus the opportunity cost of capital. Therefore, on the basis of ourassumptions, we estimate the total estate provision for HEI space per m2 ofnon-residential estate to average £192.50 using 2002-03 data:
£43.80 (operating cost) + £53.40 (maintenance cost) + £50.20 (depreciation cost) + £45.10 (cost of capital) = £192.50.
16 HEFCE 2005/26

87. This average total estate provision of £192.50 greatly exceeds the £84.30‘total property costs’ quoted in the EMS institutional report 2004, and UKHEIs’ current internal space charges. For example, the Newcastle UniversitySpace Management Project Report (2002) found the highest space charge tobe £130 per m2 in the six HEIs it surveyed. The median space charge foundin the recent survey of space management practices carried out as part of thisSpace Management Project was £126 per m2.
88. Space users may feel that raising space charges from around £130 to thetotal estate provision of around £200 would damage HEIs. For example, theNewcastle report (2002) refers to the ‘unpalatable effects’ of chargingdepartments a cost of capital.9
89. However, as this report later explains, setting a space charge at the levelof the total estate provision could benefit HEIs and their space users. It couldalso allow HEIs to determine the optimal size of their estates.
Sustainable estate and total estate provisions bytype of space90. The following sections apply the methodology for determining thesustainable estate and total estate provisions to the following space categories:
• general purpose teaching space
• specialist teaching space
• teaching office space
• research space
• learning resource centre space
• other support space.
91. We use estimates from various sources to calculate the cost of space inthese sub-categories of the estate. These estimates are discussed moreextensively in each of the following sub-sections.
Operating costs by type of space92. In the absence of hard data on operating cost by type of space, we usedstatistical methods to arrive at total operating cost. We allocated totaloperating costs across the various space categories on the basis of the resultsof econometric regression analysis, relating an HEI’s total operating cost tothe shares of different type of space in the total non-residential estate. Table 1reports these estimates.
HEFCE 2005/26 17
9 The Newcastle report (2002) notes that higher space charges are ‘more effective’ in provokingdepartments to release space, as is to be expected. However, it would not be to an HEI’sadvantage to make space charges arbitrarily high for this reason.

Table 1 Average operating costs by type of space
Average operating costs
Type of space £ per m2
Total non-residential estate (from Section on operating 43.80
costs, paragraph 37)
General purpose teaching space 35.50
Specialist teaching space 41.20
Teaching office space 17.50
Research space 48.80
Library/Learning resource centre space 50.50
Other support space 24.40
Source: London Economics
Maintenance costs by type of space93. As in the case of the total non-residential estate, we have used the BMIbenchmark maintenance figure of 2.5 per cent of capital value. To calculaterecommended maintenance costs, we require information on IRV by type of space.
94. To estimate IRVs by type of space, we use Building Cost Information Service(BCIS) data on the cost of building different types of space (BCIS 2003). Data from2003 were used for consistency with the 2002-03 EMS data. We calculated that ifthe entire estate across the HE sector were valued at these new-build prices, the HEestate would be worth only 0.53 of its IRV. Therefore, we have divided the BCISnew-build prices by 0.53 to scale them up to the total IRV of the sector’s estate. Weestimate the required maintenance cost for each type of space to be 2.5 per cent ofthis scaled-up new-build cost. The BCIS new-build price for each type of space andthe type-specific maintenance costs we estimate are shown in Table 2.
Table 2 Average maintenance costs by type of space
New building cost, Average maintenanceType of space £ per m2 (1) cost, £ per m2
Total non-residential estate 53.40
(from Section on maintenance
costs, paragraph 42)
General purpose teaching space 920 44.20
Specialised teaching space 1,238 59.40
Teaching office space 920 44.20
Research space 1,312 63.00
Library/Learning resource centre space 1,040 49.90
Other support space 900 43.20
(1) New-build tender price from BCIS (2003).
Source: London Economics
18 HEFCE 2005/26

Depreciation costs by type of space95. As in the case of the total non-residential estate, we calculateddepreciation costs by applying a depreciation rate to our space-specific IRVs.
96. The depreciation rate itself is a function of the life of a building, the typeof space housed, the number of refits undertaken in each building’s life, andthe interest rate the accumulating funds earn.
97. In the section on depreciation costs (paragraph 49), we assumed that allbuildings have lives of 60 years and undergo three major refits. In ourexample here, we apply the same assumptions to each type of space exceptresearch space. In the example, we also assume research space has a life spanof only 30 years, and undergoes only one refit, after 15 years.
98. The depreciation costs of the various types of space obtained on the basisof these assumptions are shown in Table 3.
Table 3 Average depreciation costs by type of space
Average depreciation
Type of space costs, £ per m2
Total non-residential estate
(from Section on depreciation costs, paragraph 51) 50.20
General purpose teaching space 40.70
Specialised teaching space 55.00
Teaching office space 40.70
Research space 85.60
Library/Learning resource centre space 46.00
Other support space 39.80
Source: London Economics
Sustainable estate provision by type of space99. The sustainable estate provision by type of space is simply the sum ofoperating, maintenance and depreciation costs by type of space.
100. The estimates reported in Table 4 show that, on the basis of ourassumptions, the sector-wide average sustainable estate provision by type ofspace ranges from £102.40 per m2 in the case of teaching office space to£197.20 per m2 in the case of research space.
HEFCE 2005/26 19
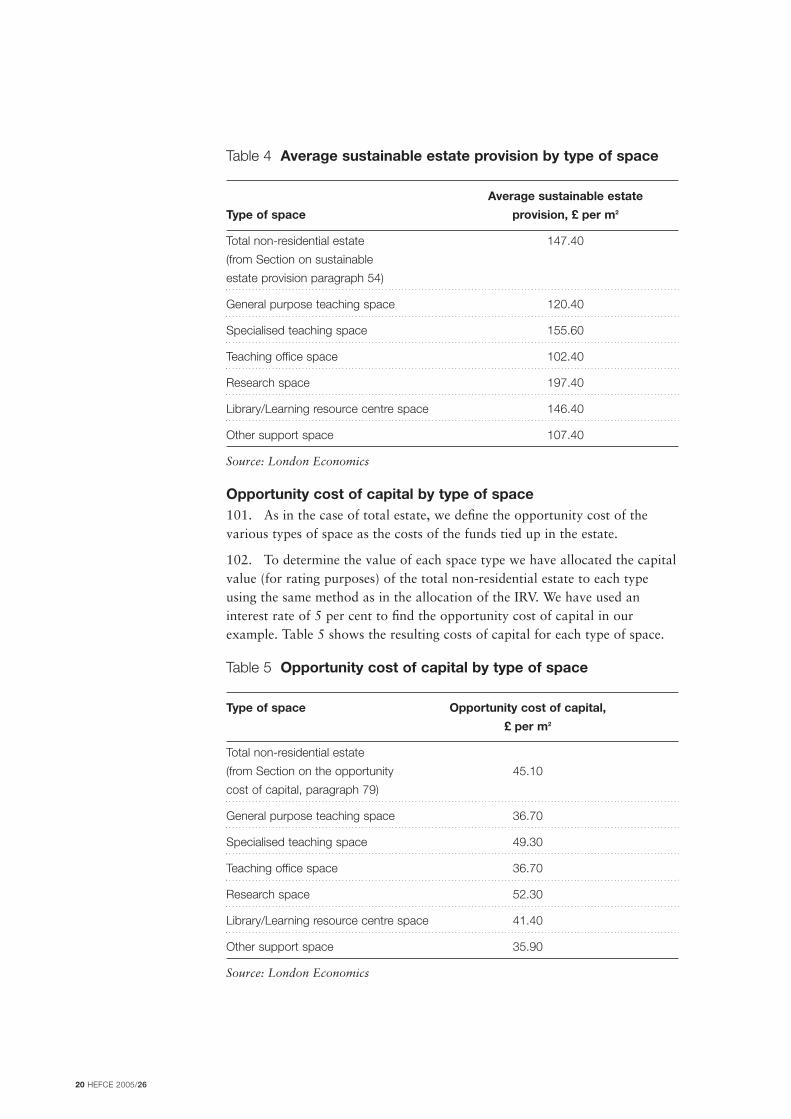
Table 4 Average sustainable estate provision by type of space
Average sustainable estate
Type of space provision, £ per m2
Total non-residential estate 147.40
(from Section on sustainable
estate provision paragraph 54)
General purpose teaching space 120.40
Specialised teaching space 155.60
Teaching office space 102.40
Research space 197.40
Library/Learning resource centre space 146.40
Other support space 107.40
Source: London Economics
Opportunity cost of capital by type of space101. As in the case of total estate, we define the opportunity cost of thevarious types of space as the costs of the funds tied up in the estate.
102. To determine the value of each space type we have allocated the capitalvalue (for rating purposes) of the total non-residential estate to each typeusing the same method as in the allocation of the IRV. We have used aninterest rate of 5 per cent to find the opportunity cost of capital in ourexample. Table 5 shows the resulting costs of capital for each type of space.
Table 5 Opportunity cost of capital by type of space
Type of space Opportunity cost of capital,
£ per m2
Total non-residential estate
(from Section on the opportunity 45.10
cost of capital, paragraph 79)
General purpose teaching space 36.70
Specialised teaching space 49.30
Teaching office space 36.70
Research space 52.30
Library/Learning resource centre space 41.40
Other support space 35.90
Source: London Economics
20 HEFCE 2005/26

Total estate provision by type of space103. Finally, Table 6 presents estimates for the total estate provision basedon our assumptions. These range from about £143.3 per m2 for teachingoffice space to £249.7 per m2 for research space.
Table 6 Total estate provision by type of space
Type of space Total estate provision, £ per m2
Total non-residential estate 192.50
(from section on total estate provision, paragraph 86)
General purpose teaching space 157.10
Specialised teaching space 204.90
Teaching office space 139.10
Research space 249.70
Library/Learning resource centre space 187.86
Other support space 143.30
Source: London Economics
Benefits of charging the total estate provision104. Raising space charges to the total estate provision could benefit allspace users provided a suitable compensation scheme accompanies the policy.Such a scheme would involve HEIs returning the cost of capital component tospace users such as departments through an increased internal grant. Thiswould exactly compensate departments for the higher space charges theyfaced. Departments would be no poorer than before, and would still be ableto afford their previous space allocation. However, departments would face ahigher reward for releasing marginal units of space, which would be to theirbenefit. Thus, a compensated price increase would make all departmentsbetter off or at least no worse off than before.
105. Annex 1 illustrates how such a compensated increase in space chargeswould work, first graphically and then in a numerical example.
Optimal choices at departmental level106. Setting space charges would also allow an HEI to determine its optimalestate size. The logic of this result is that, if departments faced the total costof space, they would face the same trade-off between buildings and otherfactors as the HEI faced as a whole. Facing this cost, a department’s optimalchoices would also be optimal for the HEI overall. By contrast, if adepartment were to face a space charge below the cost of space to the HEI, itwould tend to choose more space than was optimal for the HEI overall.
HEFCE 2005/26 21

Pros and cons of the devolved budget107. These arguments assume that departments have devolved budgets. Ifso, they could retain funds saved by releasing space, and would thus havesome incentive to do so. Sector representatives have pointed out to us,however, that creating many devolved budgets within HEIs may causeproblems. It may be difficult to ensure that funds are being used appropriatelyand there may be missed opportunities to economise by purchasing in bulk.Such problems would have to be taken into account in any move to greaterdevolution of budgets.
22 HEFCE 2005/26

ReferencesBooth, Philip and George Matysiak (2001) ‘Unsmoothing Real EstateReturns: How Should it Affect Pension Plan Asset Allocation?’ Real EstateFinance and Investment Research Paper No. 2001.06, athttp://www.cass.city.ac.uk/refig/papers/UnsmoothingRealEstateReturns.pdf
BCIS (2003) ‘Surveys of Tender Prices’, Connelly-Manton Ltd, London.Building Cost Information Services Ltd is a company of the RCIS
BMI (2003) ‘Review of Maintenance Costs 2003’, Connelly-Manton Ltd,London. Building Maintenance Information (BMI) is a division of RCISBusiness Services
City University Business School, Actium Consult and Cushman & WakefieldHealey & Baker (2002) ‘The Total Office Cost Survey July 2002’, athttp://www.downloads.bt.com/b4b/pdf/learningcentre/Total_office_costssurvey_july_2002.pdf
HEFCE (2003a) ‘Estate management statistics: annual report 2003’, HEFCE2003/56
HEFCE (2003b) ‘Developing the funding method for teaching from 2004-05’,HEFCE 2003/42
HEFCE (2003c) ‘Decisions on the funding of teaching and research’, HEFCEweb-site posting of 23 December 2003, at http://www.hefce.ac.uk/news
HEFCE (2003d) ‘Model financial memorandum between HEFCE andinstitutions’, HEFCE 2003/54
HEFCE (2004) ‘Estate management statistics: annual report 2004’, HEFCE2004/45
HEFCE reports are available at http://www.hefce.ac.uk/pubs
HM Treasury (1998) ‘Fiscal Policy: A Framework for New PublicInvestment’, at http://www.hm-treasury.gov.uk/mediastore/otherfiles/fiscal_policy_framework_for_public_investment.pdf
Investment Property Databank (2004) ‘IPD Annual Index 2004’, athttp://www.ipdindex.co.uk/downloads/indices/UKIndex2004Tables.pdf
Ministry of Defence (2002) ‘Investment Strategy 2002’, athttp://www.mod.uk/issues/investment_strategy/02/analysis.htm
National Committee of Inquiry into Higher Education (1997) ‘Report of theNational Committee’ (The Dearing Report), athttp://www.leeds.ac.uk/educol/ncihe/natrep.htm
Newcastle University Space Management Project (2002) ‘Space Managementin Higher Education’, report jointly funded by the HEFCE GoodManagement Practice Programme and Newcastle University, athttp://estates.ncl.ac.uk/documents/manpract/
NHS Estates (2003) ‘Assets in Action: An Asset-Management Guide for Non-Technical Managers’ summary athttp://www.nhsestates.gov.uk/download/publications_guidance/ES_AinA.pdf
HEFCE 2005/26 23

Office of the Deputy Prime Minister (2003) ‘Consultation Paper on theDecapitalisation rate used in Non-Domestic Rating Valuations in England andWales’
Royal Institution of Chartered Surveyors (2002) ‘Property in business – awaste of space?’ report for RICS by Capital Economics Ltd, principal authorsRoger Bootle and Sabina Kalyan
Valuation Office Agency (2003) ‘Rating Manual Volume 5, Section 1110,Universities and University Colleges’, athttp://www.voa.gov.uk/instructions/chapters/rating_manual/vol5/sect1110/frame.htm
24 HEFCE 2005/26

Graphical example1. Figure 4 depicts possible resources for an HEI department. Salaries are onthe y-axis and space on the x-axis. Thus, each point on Figure 4 represents adifferent combination of salaries and space.
2. The department prefers more of each resource to less. The arrow in Figure4 shows that this implies the department prefers points lying to the north-east(more space and higher salary).
3. The curved lines labelled U1 and U2 are ‘indifference’ curves. Thedepartment is ‘indifferent’ between the combinations of salaries and spacealong any one indifference curve. These curves are bowed in towards theorigin because departments prefer to have a roughly equal combination ofsalaries and space to having mostly salaries and little space or vice versa.
4. Since curves further to the north-east reflect greater happiness for thedepartment, it would prefer any point on curve U2 to any point on curve U1.
Figure 4 A department’s preferences for salaries and space
5. Figure 5 shows the budget of a department that faces a space charge equalto the running cost. The department can afford any point on or to the south-west of its budget line (the dotted line). At point A, the department reachesthe highest indifference curve possible under its budget. Thus, at A thedepartment is as satisfied as it can be given its budget and space charge.
HEFCE 2005/26 25
Annex 1 Economic theory of optimal space use
Salaries
Space
Increasingpreference
U2
U1
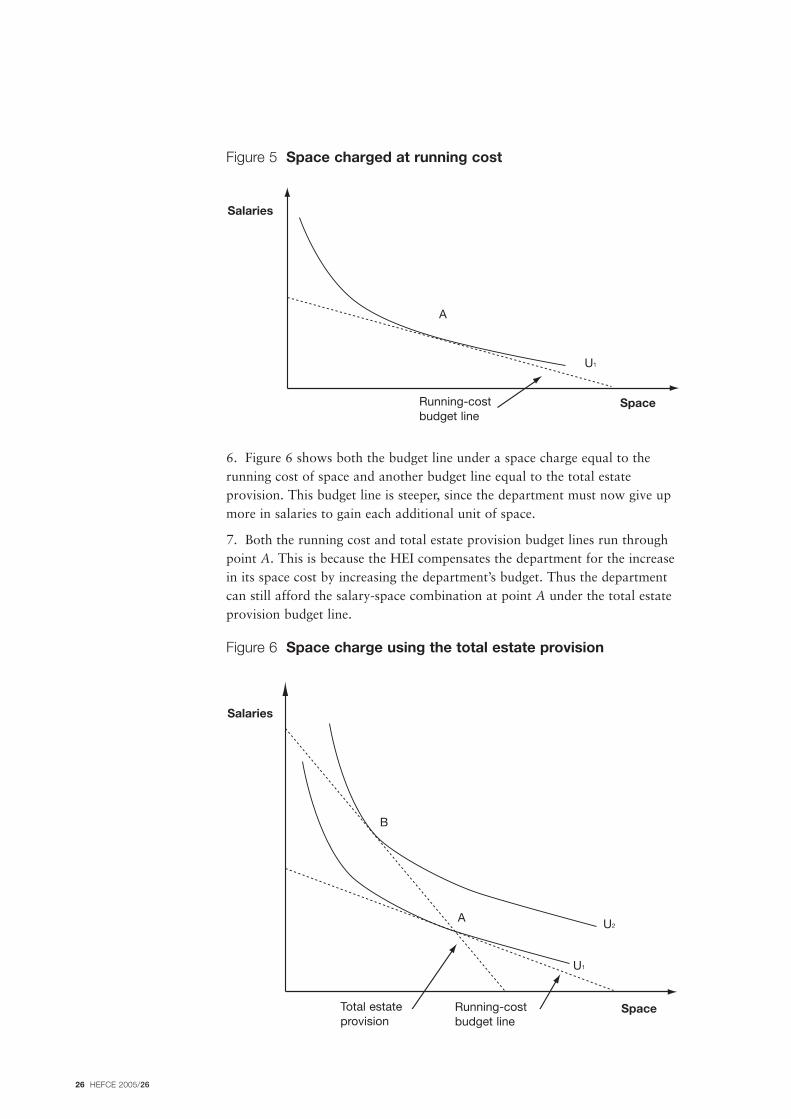
Figure 5 Space charged at running cost
6. Figure 6 shows both the budget line under a space charge equal to therunning cost of space and another budget line equal to the total estateprovision. This budget line is steeper, since the department must now give upmore in salaries to gain each additional unit of space.
7. Both the running cost and total estate provision budget lines run throughpoint A. This is because the HEI compensates the department for the increasein its space cost by increasing the department’s budget. Thus the departmentcan still afford the salary-space combination at point A under the total estateprovision budget line.
Figure 6 Space charge using the total estate provision
26 HEFCE 2005/26
Salaries
SpaceRunning-costbudget line
Total estateprovision
A
U1
U2
B
Salaries
SpaceRunning-costbudget line
A
U1

8. Under the total estate provision budget line, the department can reach thehigher indifference curve U2. It reaches this level of satisfaction at point B.Thus, if the department is charged a space charge equivalent to the totalestate provision and compensated for this higher space charge:
• the department reaches a new allocation of salaries and space that itprefers to its previous allocation. It cannot be worse off than before sinceit may still choose its old allocation
• the department will typically choose less space and more money forsalaries than it did when it had a lower space charge.
Numerical example9. This is an entirely hypothetical example.
Assumptions
10. An HEI has an annual income of £105 million and owns 100,000 m2 ofnet internal space. Depreciation costs £50 per m2 or £5 million for the HEI’sestate. The HEI places this sum into an account to pay for building refits andreplacement. Operating and maintenance costs total £100 per m2. The totalestate provision is £400 per m2.
Space charged at running cost
11. Under running-cost space charging, the HEI charges £100 per m2 forspace and gives each of its 10 departments £10 million.
12. With this income and space price, each department chooses to use10,000 m2 of space, paying £1 million in space charges (10,000 m2 @ £100per m2).
13. Each department has £9 million left for salaries.
14. The HEI’s books balance, since it recovers its running costs from itsdepartments. Its estate is sustainable, since it pays its depreciation costs. Yet itcould use space more efficiently, as the next section shows.
Space charged at the total estate provision
15. The HEI could, alternatively, charge £400 per m2 for space and give eachof its 10 departments £13 million.
16. With this income and space price, each department could still use10,000 m2 and spend £9 million on salaries. Thus, they cannot be worse offthan they were before.
17. Now that space is more expensive, however, they are likely to choose lessspace, for example 8,000 m2 each, paying the HEI £3.2 million each in spacecharges.
18. The departments would then each have £9.8 million left for salaries.
19. If departments choose this allocation over their initial allocation of spaceand salaries, they must be better off.
20. The HEI’s books would balance so long as it let the 20,000 m2 releasedby departments to the private sector at a running-cost-inclusive rent of£400 per m2.
HEFCE 2005/26 27

21. The HEI could not compensate departments for further price increases,since it cannot let released space for more than £400 per m2.
22. Thus, the HEI would now be using its space as efficiently as possible.
23. Therefore, the departments would have indicated that the HEI’s optimalestate size was 80,000 m2.
Conclusion24. If HEIs raise their space charges for departments to the total estateprovision, while compensating departments by increasing their budgets,departments will be better off than they were before.
25. We can think of the HEI as raising the reward for releasing space; this iswhat achieves the efficiency improvement.
26. This choice leads to the most efficient use of space possible; the HEIcould not afford a higher reward for releasing space.
27. The graphical and numerical examples assume an HEI could retain rentearned on space it let out. If there is Exchequer Interest in this space,however, HEIs may have to give such rental income to the Treasury.
28. If so, the HEI would not gain from charging a space cost higher than therunning cost plus the depreciation cost.
29. It is not clear that the Treasury would claim HEI rental income onbuildings with Exchequer Interest, however. The HEFCE FinancialMemorandum (HEFCE 2003d) allows HEIs to retain funds derived fromrenting or selling space with Exchequer Interest if these funds are used forcapital expenditure on estates.
28 HEFCE 2005/26

HEFCE 2005/26 29
Annex 2 TRAC and the SMG Model of theAffordable Estate This note clarifies the differences between the Space Management Group’s(SMG’s) Model of the Affordable Estate and the Transparent Approach toCosting (TRAC) methodology. The two methodologies have differentapplications and therefore we have not attempted to combine them.
In brief, the SMG model is an estates planning and forecasting tool tosupport institutional strategic development. By contrast, TRAC is aretrospective device, at institutional level, to measure full economic cost ofteaching and research. TRAC addresses all costs of HEI activity, while theSMG model deals solely with estates costs.
The SMG model uses existing Estate Management Statistics (EMS) andHigher Education Statistics Agency data sets. It does not cause additionalburden to institutions, because there is no requirement by institutions toprovide a formal submission to HEFCE.
In addition:
a. Data source – While the SMG Model of the Affordable Estate uses EMSas the core data, TRAC takes data from the audited financial statementsas its starting point. TRAC also uses Insurance Replacement (IRV) as thestart point to calculate the buildings infrastructure adjustment.
b. Routine maintenance – The SMG model uses an appropriate percentageof IRV to indicate the level of expenditure which should be allowed forunder good practice, rather than actual spend. TRAC uses actualexpenditure.
c. Depreciation – The SMG model uses an appropriate level of IRV as atheoretical aspect. In TRAC, depreciation is based on IRV too, but alsoincludes an infrastructure adjustment.
d. Cost of capital element – The SMG model recognises the cost of capitalas the flow of earnings an HEI foregoes by owning a building rather thanselling it and investing the proceeds elsewhere. SMG recognises it as anecessary future allowance and calculates it as an adjusted view ofrateable value for non-rented property. The Cost of capital element inTRAC is still under review.
Consequence of differencesThe SMG model uses a different terminology to TRAC to avoid confusionwith the TRAC definition of full economic costing (fEC). The SMG modeluses the terminology of Sustainable Estate Provision and Total EstateProvision, thus differentiating between an actual cost (the fEC in TRAC) andthe ‘provision’ which is calculated under the SMG model.

BCIS Building Cost Information Service
BMI Building Maintenance Information
DRC Depreciated replacement cost
EMS Estate Management Statistics
HE Higher education
HEFCE Higher Education Funding Council for England
HEI Higher education institution
IPD Investment Property Databank
IRV Insurance replacement value
MOD Ministry of Defence
OMV Open market value
RICS Royal Institution of Chartered Surveyors
RV Rateable value
SMG Space Management Group
SMP Space Management Project
VOA Valuation Office Agency
List of abbreviations

Further copies of this document are available from:
PublicationsHEFCENorthavon HouseColdharbour LaneBRISTOLBS16 1QD