UK Energy Statistics, Q1 2017 6 of 15 COAL: QUARTER 1 2017 Coal production and imports 0 2 4 6 8 10...
15
Page 1 of 15 PRESS NOTICE Date: 29 June 2017 STATISTICAL PRESS RELEASE UK Energy Statistics, Q1 2017 Energy Trends and Energy Prices publications are published today 29 June 2017 by the Department for Business, Energy and Industrial Strategy. Energy Trends covers statistics on energy production and consumption, in total and by fuel, and provides an analysis of the year on year changes. Energy Prices covers prices to domestic and industrial consumers, prices of oil products and comparisons of international fuel prices. An article on Renewable Energy in 2016, within Energy Trends, shows the progress made against the UK’s 15 per cent target under the 2009 EU Renewable Directive. Provisional calculations show that 8.9 per cent of final energy consumption in 2016 came from renewable sources; up from 8.2 per cent in 2015. The UK has now exceeded its third interim target; averaged over 2015 and 2016, at 8.5 per cent against its target of 7.5 per cent. There was a slight increase in the fuel used to generate electricity (up 2.4 per cent); heat and renewable transport fuels also increased. The chart below shows the use of renewable energy for heat, electricity and transport. Trends in the use of renewable energy
Transcript of UK Energy Statistics, Q1 2017 6 of 15 COAL: QUARTER 1 2017 Coal production and imports 0 2 4 6 8 10...

Page 1 of 15
PRESS NOTICE
Date: 29 June 2017
STATISTICAL PRESS RELEASE
UK Energy Statistics, Q1 2017
Energy Trends and Energy Prices publications are published today 29 June 2017 by the Department for Business, Energy and Industrial Strategy. Energy Trends covers statistics on energy production and consumption, in total and by fuel, and provides an analysis of the year on year changes. Energy Prices covers prices to domestic and industrial consumers, prices of oil products and comparisons of international fuel prices. An article on Renewable Energy in 2016, within Energy Trends, shows the progress made against the UK’s 15 per cent target under the 2009 EU Renewable Directive. Provisional calculations show that 8.9 per cent of final energy consumption in 2016 came from renewable sources; up from 8.2 per cent in 2015. The UK has now exceeded its third interim target; averaged over 2015 and 2016, at 8.5 per cent against its target of 7.5 per cent. There was a slight increase in the fuel used to generate electricity (up 2.4 per cent); heat and renewable transport fuels also increased. The chart below shows the use of renewable energy for heat, electricity and transport. Trends in the use of renewable energy

Page 2 of 15
The main points for the first quarter of 2017 are:
Total energy production was 0.1 per cent lower than in the first quarter of 2016.
Total primary energy consumption for energy fell by 2.8 per cent. However, when adjusted to take account of weather differences between the first quarter of 2016 and the first quarter of 2017, total primary energy consumption fell by 0.7 per cent.
Final energy consumption (excluding non-energy use) was 2.2 per cent lower than in the first quarter of 2016. Domestic consumption fell by 5.1 per cent due to warmer weather. The average temperature in the first quarter of 2017 was 0.7 degrees Celsius warmer than the same period a year earlier. On a temperature corrected basis, final energy consumption was down 0.1 per cent over the same period.
Of electricity generated in the first quarter of 2017, coal accounted for 11.3 per cent, whilst gas accounted for 39.9 per cent. Nuclear generation accounted for 18.9 per cent of total electricity generated in the first quarter of 2017.
Renewables’ share of electricity generation (hydro, wind and other renewables) increased from 25.6 per cent in 2016 Q1 to 26.6 per cent in 2017 Q1, mostly due to increased wind and solar capacity.
Renewable electricity generation was a record 24.8 TWh in the first quarter of 2017, an increase of 5.1 per cent on the same period a year earlier.
For more detailed information on methodology, quality assurance and use of the data, please refer to the methodology notes available by energy sector on the BEIS section of the GOV.UK website at: www.gov.uk/government/organisations/department-for-business-energy-and-industrial-strategy/about/statistics
The June 2017 edition of Energy Trends also includes articles on:
Enhancements to Energy Trends gas tables
Changes to Eurostat price tables methodology

Page 3 of 15
The following statistics are also published today 29 June 2017 by the Department for Business, Energy and Industrial Strategy:
Fuel Poverty, 2015 analysis www.gov.uk/government/collections/fuel-poverty-statistics
Fuel Poverty sub-regional, 2015 analysis www.gov.uk/government/collections/fuel-poverty-sub-regional-statistics
Local Authority carbon dioxide emissions, 2015 www.gov.uk/government/collections/uk-local-authority-and-regional-carbon-dioxide-emissions-national-statistics
Sub-national Road Transport energy consumption, 2015 www.gov.uk/government/collections/road-transport-consumption-at-regional-and-local-level
Feed-in Tariff commissioned installations, May 2017 www.gov.uk/government/statistics/monthly-small-scale-renewable-deployment
Solar photovoltaics deployment, May 2017 www.gov.uk/government/statistics/solar-photovoltaics-deployment

Page 4 of 15
TOTAL ENERGY: QUARTER 1 2017
Total Energy - Production
-6%
-4%
-2%
0%
2%
4%
6%
8%
10%
12%
14%
Q12014
Q2 Q3 Q4 Q12015
Q2 Q3 Q4 Q12016
Q2 Q3 Q4 Q12017
An
nu
al
gro
wth
rate
(1) Nuclear and wind, solar & natural flow hydro electricity
Total production in the first quarter of 2017 stood at 33.2 million tonnes of oil equivalent, 0.1 per cent lower than in the first quarter of 2016.
Production of oil fell by 4.5 per cent compared to the first quarter of 2016, due to a decrease in production at fields feeding into the Sullom Voe terminal, while production of natural gas rose by 4.7 per cent, following the start-up of the Cygnus gas field in December 2016.
Primary electricity output in the first quarter of 2017 was 3.1 per cent higher than in the first quarter of 2016, within which nuclear electricity output was 1.8 per cent higher and output from wind, solar and natural flow hydro was 7.1 per cent higher, boosted by increased wind and solar capacity.
Production of bioenergy and waste was 1.1 per cent higher compared to the first quarter in 2016.
Coal production fell by 11.7 per cent compared to the first quarter in 2016 due to falling demand, particularly for electricity generation.
Total energy quarterly tables ET 1.1 – 1.3 are available on the BEIS section of the GOV.UK website at: www.gov.uk/government/statistics/total-energy-section-1-energy-trends
2017 Q1
Million tonnes of oil equivalent
Percentage change on a year
earlier
Total production 33.2 -0.1
Oil 13.2 -4.5
Natural gas 10.7 +4.7
Primary electricity(1) 5.2 +3.1
Bioenergy & waste 3.6 +1.1
Coal 0.6 -11.7

Page 5 of 15
TOTAL ENERGY: QUARTER 1 2017
Total Energy – consumption(1)
180
185
190
195
200
205
210
Q1 Q2 Q3 Q4
Mil
lio
n t
on
nes o
f o
il e
qu
ivale
nt
2014
2015
2016
2017
0
(1) Total inland energy consumption on a primary fuel input basis (seasonally adjusted and temperature corrected annual rates).
When examining seasonally adjusted and temperature corrected annualised rates:
Total inland energy consumption on a primary fuel input basis was 195.5 million tonnes of oil equivalent in the first quarter of 2017, 0.7 per cent lower than the same quarter in 2016.
Between the first quarter of 2016 and the first quarter of 2017, coal and other solid fuel consumption fell by 23 per cent as demand fell from electricity generators.
Oil consumption fell by 0.5 per cent.
Gas consumption rose by 3.5 per cent as demand rose from electricity generators.
Primary electricity consumption fell by 1.8 per cent.
Final consumption was provisionally 2.2 per cent lower than in the first quarter of 2016, with domestic consumption down 5.1 per cent, reflecting the warmer weather, compared to the same quarter a year earlier. The average temperature in the first quarter of 2017 was 0.7 degrees Celsius warmer than the same period a year earlier. On a temperature corrected basis, final energy consumption was down 0.1 per cent over the same period.
Total energy quarterly tables ET 1.1 – 1.3 are available on the BEIS section of the GOV.UK website at: www.gov.uk/government/statistics/total-energy-section-1-energy-trends
2017 Q1
Million tonnes of oil equivalent
Percentage change on a year
earlier
Total energy consumption Unadjusted 54.8 -2.8 Seasonally adjusted and temperature
corrected – annual rate 195.5 -0.7
Final consumption: unadjusted 40.8 -2.2 temperature corrected 35.6 -0.1

Page 6 of 15
COAL: QUARTER 1 2017
Coal production and imports
0
2
4
6
8
10
12
14
16
18
Q12014
Q2 Q3 Q4 Q12015
Q2 Q3 Q4 Q12016
Q2 Q3 Q4 Q12017
Mill
ion
To
nn
es
Deep-mined Surface mining Imports
2017 Q1 Thousand tonnes
Percentage change on a year earlier
Coal production 883 -11.7 Coal imports 2,431 -9.1 Coal demand 5,383 -25.5 - Power stations 3,878 -32.2 - Coke ovens & blast furnaces 833 +9.7 - Final users 538 -12.0
Provisional figures for the first quarter of 2017 show that coal production fell to a new record low of 1.0 million tonnes, 12 per cent lower than the first quarter 2016. This was due to falling demand. Deep mined production was down 22 per cent to 5 thousand tonnes. Surface mine production was down by 12 per cent to a new record low of 1.0 million tonnes mainly due to the record low production in January 2017 when some coal mines had a seasonal shut down.
Imports of coal in the first quarter of 2017 were 9 per cent lower than in the first quarter of 2016 at 2.4 million tonnes, as demand fell, especially for use by electricity generators.
Total demand for coal in the first quarter of 2017 was 5.4 million tonnes, 25 per cent lower than in the first quarter of 2016, with consumption by electricity generators down by 32 per cent to 3.9 million tonnes.
Coal stocks showed a seasonal fall of 2.2 million tonnes during the first quarter of 2017 and stood at 6.1 million tonnes, 4.2 million tonnes lower than at the end of March 2016. . This was due to closure of coal fired power plants and generators using held stock for electricity generation while purchasing less coal from the UK and overseas.
Coal quarterly tables ET 2.1 – 2.4 are available on the BEIS section of the GOV.UK website at: www.gov.uk/government/statistics/solid-fuels-and-derived-gases-section-2-energy-trends

Page 7 of 15
OIL: QUARTER 1 2017
Demand for key transport fuels
Indigenous production of crude and NGLs was lower by 4.6 per cent in quarter 1 2017 compared with the same quarter a year earlier. There have been recent declines in fields feeding in to Sullom Voe.
Production of petroleum products was 3.0 per cent higher in the first quarter of 2017 compared with the first quarter of 2016. Lower production and increased refinery demand resulted in the large increase in imports of primary oils seen this quarter.
The UK was a net importer of oil and oil products in the first quarter of 2017 by 2.5 million tonnes. In the same period of 2016 the UK was a net importer by 2.8 million tonnes.
Overall primary demand for petroleum products in the first quarter of 2017 was 0.3 per cent lower than last year, following a period of strong demand for 10 successive quarters. Demand for road fuels has started to stabilise, with diesel up just 0.6 per cent and motor spirit down 1.8 per cent at the start of 2017.
Oil quarterly tables ET 3.1 – 3.7 are available on the BEIS section of the GOV.UK website at: www.gov.uk/government/statistics/oil-and-oil-products-section-3-energy-trends
2017 Q1 Thousand tonnes
Percentage change on a year earlier
Primary oil production 12,130 -4.6 Primary oil demand 14,653 +3.0 Net imports (primary oil) 2,598 +86.9 Net imports (oil products) 2,483 -12.9
Refinery production 15,263 +3.0 Petroleum demand 16,728 -0.3 - Motor spirit (including biofuels) 2,968 -1.8 - DERV fuel (including biofuels) 6,052 +0.6 - Aviation turbine fuel 2,543 +5.3

Page 8 of 15
GAS: QUARTER 1 2017
Production of natural gas
0
20
40
60
80
100
120
140
Q12014
Q2 Q3 Q4 Q12015
Q2 Q3 Q4 Q12016
Q2 Q3 Q4 Q12017
TW
h
2017 Q1
TWh Percentage change on a
year earlier
Gas production 124.2 +4.7
Gas imports 168.8 +3.6
Gas exports 15.4 -23.5
Gas demand 290.7 -0.7
- Electricity generation 79.2 +10.3
- Domestic 121.5 -5.9
Total indigenous UK production of natural gas in the first quarter of 2017 was 124.2 TWh, 4.7 per cent higher than a year before.
Total Imports remained fairly consistent in comparison to Q1 2016. In contrast exports decreased by over a fifth, diven by a 41 per cent decrease in exports to the Republic of Ireland, which is largely due to the production from the Corrib gas field now supplying Ireland and a 38 per cent decrease in exports to Belgium. This lead to net imports increasing by 7.4 per cent.
UK gas demand was down slightly, by 0.7 per cent compared to Q1 2016. There was an increase in demand for electricity generation, which was up 10.3 per cent on the same quarter last year. This is as a result of less coal generation. In contrast final consumption was down 4.2 per cent, with domestic use and other final users down 5.9 and 3.1 per cent respectively driven by the warmer weather in early 2017 compared to 2016.
Gas quarterly table ET 4.1 is available on the BEIS section of the GOV.UK website at: www.gov.uk/government/statistics/gas-section-4-energy-trends

Page 9 of 15
ELECTRICITY: QUARTER 1 2017
Electricity generated
Fuel used by generators in the first quarter of 2017 was 3.2 per cent lower than in the first quarter of 2016.
Generation from coal in the first quarter of 2017 fell by 28.4 per cent, while gas rose by 9.0 per cent compared with a year earlier. Nuclear increased by 1.8 per cent.
Low carbon generation accounted for 45.6 per cent of generation in Q1 2017, compared to 44.4 per cent in the same period of 2016.
Total electricity generated in the first quarter of 2017 was 1.0 per cent higher than a year earlier.
Final consumption of electricity fell by 2.3 per cent in the first quarter of 2017. Domestic use fell by 3.2 per cent, consumption by the service sector was down 2.9 per cent, and industrial use fell by 0.5 per cent.
Electricity quarterly tables ET 5.1, 5.2 & 5.6 are available on the BEIS section of the GOV.UK website at: www.gov.uk/government/statistics/electricity-section-5-energy-trends
2017 Q1 TWh
Percentage change on a year earlier
Electricity Generated from
Coal 10.52 -28.4 Nuclear 17.64 +1.8 Gas 37.16 +9.0 Renewables 24.83 +1.2 Total 93.21 +1.0 Supplied to Industry 22.98 -0.5 Domestic 30.89 -3.2 Other final consumers 26.87 -2.9
All 80.74 -2.3

Page 10 of 15
RENEWABLES: QUARTER 1 2017
Renewable electricity generation
0
5
10
15
20
25
30
Q12014
Q2 Q3 Q4 Q12015
Q2 Q3 Q4 Q12016
Q2 Q3 Q4 Q12017
Ge
ne
rati
on
(T
Wh
)
Shoreline wave / tidalSolar PVOffshore WindOnshore WindHydroBioenergy
Renewable electricity generation was a record 24.8 TWh in 2017 quarter 1, an increase of 5.1 per cent on the 23.6 TWh recorded one year earlier. Compared to 2016 quarter 1, electricity generated from onshore wind rose by 20 per cent to 7.7 TWh, due to increased capacity, while generation from offshore wind fell by 2.7 per cent to 5.0 TWh, due to low wind speeds. At 9.2 knots, wind speeds were down 0.6 knots on both 2016 quarter 1 and the long term mean. Generation from hydro fell by 15 per cent due to one quarter less rainfall (in the main hydro areas). Generation from solar photovoltaics increased by 16 per cent to 1.7 TWh, due to increased capacity, while generation from bioenergy increased by 1.4 per cent to 8.6 TWh.
Renewables’ share of total generation in 2017 quarter 1 was 26.6 per cent, an increase of 1.0 percentage point on 2016 quarter 1, reflecting increased capacity.
Renewable electricity capacity was 36.9 GW at the end of the first quarter of 2017, a 12 per cent increase (4.0 GW) on a year earlier, and a 3.3 per cent increase (1.2 GW) on 2016 quarter 4.
Liquid biofuels represented 3.1 per cent of petrol and diesel consumed in road transport in 2017 quarter 1, 0.2 percentage points up on a year earlier.
Renewables quarterly tables ET 6.1 – 6.2 are available on the BEIS section of the GOV.UK website at: www.gov.uk/government/statistics/energy-trends-section-6-renewables
2017 Q1 TWh
Percentage change on a year earlier
Renewable electricity generation
Onshore wind 7.70 +20.2 Offshore wind 5.01 -2.7 Hydro 1.77 -15.1 Solar PV 1.69 +15.6 Bioenergy (inc. co-firing) 8.65 +1.4 All renewables 24.83 +5.1

Page 11 of 15
RENEWABLES: 2016
A special feature in the June 2017 edition of Energy Trends looks at Renewable energy in 2016. It includes summary renewables statistics for 2016, which are published for the first time. A full set of renewables statistics will appear in the Digest of United Kingdom Energy Statistics 2017, which will be published on 27 July 2017. The main features of the latest statistics are: Renewable energy provisionally accounted for 8.9 per cent of final energy consumption, as measured using the 2009 Renewable Energy Directive (RED) methodology, an increase of 0.7 percentage points on 2015. The table and chart below shows progress by electricity generation, heat, and biofuels used as transport fuel.
UK progress towards the 2009 Renewable Energy Directive
2004 2010 2014 2015 2016
Percentage of electricity from renewable sources (normalised)
3.5% 7.4% 17.8% 22.3% 24.6%
Percentage of heating and cooling from renewable sources
0.7% 2.8% 4.7% 5.5% 6.2%
Percentage of transport energy from renewable sources
0.2% 3.3% 5.3% 4.4% 4.5%
Overall renewable consumption 1,2 1.1% 3.8% 7.0% 8.2% 8.9% 1Measured as a percentage of capped gross final energy consumption using net calorific values
2Cannot be directly calculated from the three separate measures
The UK has now exceeded its third interim target; averaged over 2015 and 2016, at 8.5 per cent against its target of 7.5 per cent. The UK’s the fourth interim target is 10.2 per cent averaged across 2017 and 2018 and an initial estimate will be published in June 2019
Renewable electricity generation fell by 0.2 TWh (0.2 per cent) to 83.2 TWh in 2016; despite an increase in capacity, low wind speeds and rainfall in 2016 resulted in lower generation for wind and hydro.
Solar photovoltaic generation showed the largest absolute increase of the renewable technologies (2.9 TWh or 38 per cent) due to additional capacity which increased by 25 per cent.
Total wind generation fell by 7.3 per cent to 37.4 TWh in 2016 as a result of lower wind speeds.

Page 12 of 15
INDUSTRIAL PRICES: QUARTER 1 2017
Industrial fuel price indices in real terms including the Climate Change Levy
20
40
60
80
100
120
140Q
1 2
01
5
Q2
201
5
Q3
201
5
Q4
201
5
Q1
201
6
Q2
201
6
Q3
201
6
Q4
201
6
Q1
201
7
Ind
ex 2
01
0=
10
0
Gas
Electricity
Heavy fuel oil
Fuel prices index in real terms(1) 2010=100 2017 Q1 Percentage change on a
year earlier
Coal 89.5 2.7 Heavy fuel oil 87.4 46.3 Gas 102.0 2.2 Electricity 112.8 2.4 Total fuel 106.6 6.4
(1) Deflated using the GDP implied deflator. Includes estimates of the average Climate Change Levy (CCL) paid.
Average industrial gas prices, including CCL were 2.2 per cent higher in real terms in Q1 2017 compared to Q1 2016, whilst prices excluding CCL were 2.4 per cent higher.
Average industrial electricity prices were 2.4 per cent higher including CCL and 2.0 per cent higher excluding CCL, in real terms, in Q1 2017 compared to Q1 2016.
Average coal prices were 2.7 per cent higher in real terms including CCL and 3.0 per cent higher excluding CCL in Q1 2017 compared to Q1 2016.
Heavy fuel oil prices were 46 per cent higher in real terms than a year ago.
For the period July to December 2016, UK industrial electricity prices for medium consumers including tax were the third highest in the EU 15, whilst industrial gas prices for medium consumers including tax were the lowest in the EU 15.
Industrial prices tables are available on the BEIS section of the GOV.UK website at: www.gov.uk/government/collections/industrial-energy-prices
Page 13 of 15
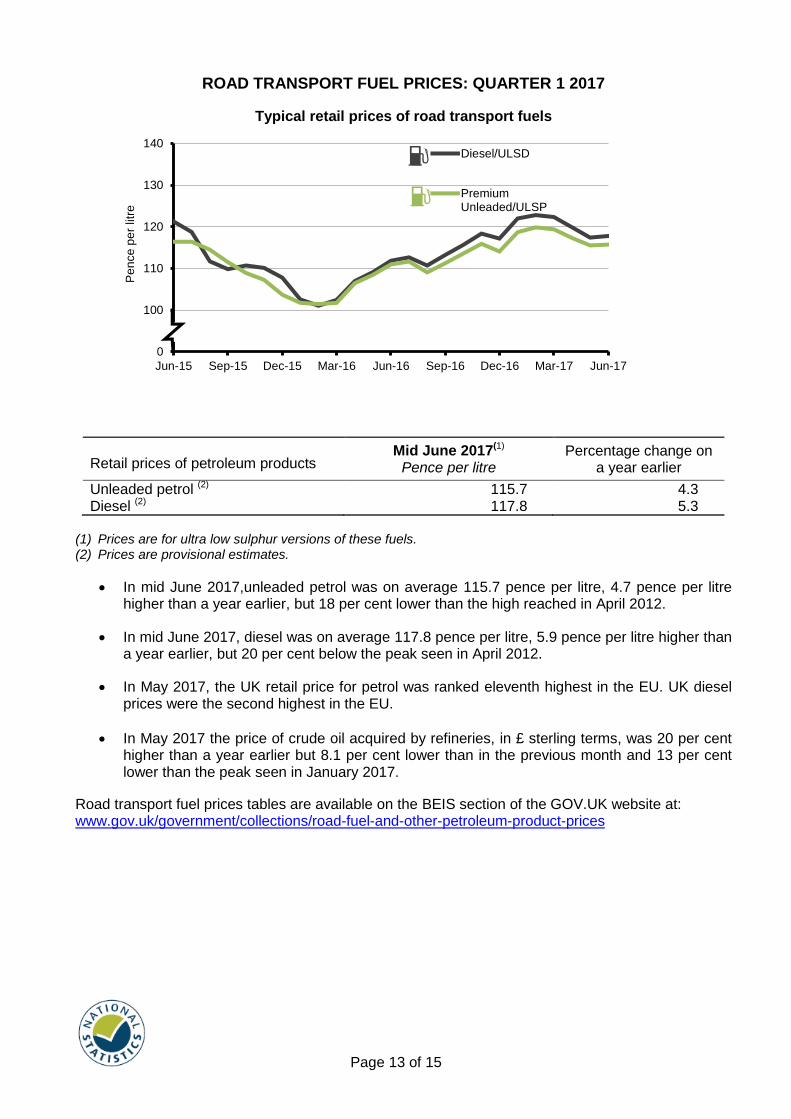
ROAD TRANSPORT FUEL PRICES: QUARTER 1 2017
Typical retail prices of road transport fuels
90
100
110
120
130
140
Jun-15 Sep-15 Dec-15 Mar-16 Jun-16 Sep-16 Dec-16 Mar-17 Jun-17
Pe
nce
pe
r lit
re
Diesel/ULSD
PremiumUnleaded/ULSP
(1) Prices are for ultra low sulphur versions of these fuels. (2) Prices are provisional estimates.
In mid June 2017,unleaded petrol was on average 115.7 pence per litre, 4.7 pence per litre higher than a year earlier, but 18 per cent lower than the high reached in April 2012.
In mid June 2017, diesel was on average 117.8 pence per litre, 5.9 pence per litre higher than a year earlier, but 20 per cent below the peak seen in April 2012.
In May 2017, the UK retail price for petrol was ranked eleventh highest in the EU. UK diesel prices were the second highest in the EU.
In May 2017 the price of crude oil acquired by refineries, in £ sterling terms, was 20 per cent higher than a year earlier but 8.1 per cent lower than in the previous month and 13 per cent lower than the peak seen in January 2017.
Road transport fuel prices tables are available on the BEIS section of the GOV.UK website at: www.gov.uk/government/collections/road-fuel-and-other-petroleum-product-prices
Retail prices of petroleum products Mid June 2017(1)
Pence per litre Percentage change on
a year earlier
Unleaded petrol (2) 115.7 4.3 Diesel (2) 117.8 5.3

Page 14 of 15
DOMESTIC PRICES: QUARTER 1 2017
Fuel price indices in the domestic sector in real terms
20
40
60
80
100
120
140
Q42014
Q12015
Q22015
Q32015
Q42015
Q12016
Q22016
Q32016
Q42016
Q12017
Ind
ex 2
01
0=
10
0
Gas
Electricity
Liquid fuels
Consumer price index fuel components in real terms (1) 2010=100 2017 Q1
Percentage change on a year earlier
Solid fuels 104.3 -0.6 Gas 110.1 -6.0 Electricity 115.1 -2.2 Liquid fuels 83.9 +49.6 Total domestic fuels 112.5 -2.5
(1) Deflated using the GDP implied deflator. The original source of the indices is ONS.
The price paid for all domestic fuels by household consumers has fallen by 2.5 per cent in real terms between Q1 2016 and Q1 2017, and by 0.3 per cent between Q4 2016 and Q1 2017.
Domestic electricity prices, including VAT, in Q1 2016 were 2.2 per cent lower in real terms than in Q1 2016. Prices were 0.2 per cent lower than in Q4 2016.
The price of domestic gas, including VAT, fell by 6.0 per cent in real terms between Q1 2016 and Q1 2017, and by 1.0 per cent between Q4 2016 and Q1 2017.
For the period July to December 2016, prices for medium domestic gas, including tax, were the second lowest and for electricity consumers, including tax, were the sixth highest in the EU15.
Switching levels The rates of switching in the electricity market increased by 13 per cent between 2016 quarter
1 and 2017 quarter 1. Since quarter 4 of 2016, electricity transfers have increased by 5.1 per cent. Gas transfers increased by 7.7 per cent between Q1 2016 with Q1 2017 and have increased by 7.5 per cent since last quarter.
Domestic prices tables are available on the BEIS section of the GOV.UK website at: www.gov.uk/government/collections/domestic-energy-prices

Page 15 of 15
Issued by: Department for Business, Energy and Industrial Strategy, 1 Victoria Street, London SW1H 0ET
Contacts:
Lead statistician: Warren Evans, Tel: 0300 068 5059
Press enquiries: Tel: 0207 215 5138 Statistical enquiries General enquiries: Tel 0207 215 5000
Notes to editors
1. More detailed figures of United Kingdom energy production and consumption and of energy prices, for the first quarter of 2017 are given in the June 2017 editions of ENERGY TRENDS and ENERGY PRICES respectively, the Department's statistical bulletins on energy, released on 29 June 2017.
2. Energy Trends and the Energy Prices bulletins, published quarterly, are available on the BEIS section of the GOV.UK website at: www.gov.uk/government/collections/energy-trends and www.gov.uk/government/collections/quarterly-energy-prices 3. Articles featured in Energy Trends are also available on the BEIS section of the GOV.UK website at: www.gov.uk/government/collections/energy-trends-articles 4. More detailed annual data on energy production and consumption for the years 2011 to 2015 are available in the DIGEST OF UNITED KINGDOM ENERGY STATISTICS 2016, published on 28 July 2016. The 2017 edition of the Digest will be published on 27 July 2017. All information contained in the Digest is available on the BEIS section of the GOV.UK website at: www.gov.uk/government/collections/digest-of-uk-energy-statistics-dukes