Uk 2015
24
The RICS and Macdonald & Company UK Rewards & Attitudes Survey 2015 Executive Summary and Key Findings
-
Upload
kelly-woodham -
Category
Documents
-
view
212 -
download
0
description
The RICS and Macdonald & Company UK Rewards & Attitudes Survey 2015. Executive Summary and Key Findings
Transcript of Uk 2015
The RICS and Macdonald & CompanyUK Rewards & Attitudes Survey 2015
Executive Summary and Key Findings

2 www.macdonaldandcompany.com/salary-survey
2015 EXECUTIVE SUMMARY

The RICS and Macdonald & Company Rewards & Attitudes Survey 2015 Results 3
Foreword2015 has been a strong year for real estate in the UK. Following a very positive 2014, the survey clearly shows that confidence remains high and substantial real increases in remuneration are accelerating following years of stagnation in the wake of the financial crisis. 62% of those surveyed received a pay rise, with an average increase of 7.1%, while 7% of the survey saw increases of 15% or more. The UK remains a key target destination for real estate investors, particularly from Asia, many of whom are assessing opportunities to enter the market; the resulting demand for staff and real estate services will add to inflationary pressure over the next period.
Key market sectors are experiencing skills shortages, with the leasing, fund and development sectors seeing large increases in salary as the market improves and the war for talent intensifies. Supply and demand imbalances have no quick fix and, in the short to medium term, professionals in these areas will hold significant bargaining power when negotiating salaries.
In general, the market outlook remains confident, albeit at a slightly more conservative level verses last year, with 59% optimistic about prospects in the next 12 months.
Macdonald & Company provide bespoke salary and remuneration benchmarking reports to clients worldwide. In conjunction with our research partners we are able to provide valuable data segmented and analysed to suit individual businesses, locations and specific needs.
Peter Moore MRICS, Managing Director, Macdonald & Company. February 2015
IntroductionNow in its sixteenth year, the annual RICS and Macdonald & Company Rewards & Attitudes Survey is the most comprehensive survey undertaken for the property sector in the UK.
The survey continues the success of earlier surveys; 8,311 UK surveying professionals participated online between December 2014 and January 2015, making this the largest and most comprehensive survey of its type in the industry.
As always, thanks this year must go to Property Week and RICS who actively promoted their involvement in the survey amongst their readership and members. We would also like to thank all the participants who took time to complete the online survey.
Besides statistics on current salaries, recent salary increases, bonuses and employment package benefits, the results give an insight into wider issues that are important to professionals in their role and their attitudes toward employment.
This report sets out the key findings of the survey. Because of rounding, some percentages may not add up to 100.
For further information or analysis please contact:E: [email protected] or call one of our UK offices.
An online statistics package for the 2015 survey is available at a cost of £599 + VAT. In addition to the UK, Macdonald & Company & RICS undertake remuneration and attitudes surveys for the following regions: Middle East and Asia Pacific. All reports are available at www.macdonaldandcompany.com
For the seventh year, the results have been collated and analysed by BluSky Research (a research trading name of BluSky Marketing Limited – www.bluskymarketing.com).

4 www.macdonaldandcompany.com/salary-survey4 www.macdonaldandcompany.com/salary-survey
KEY FINDINGS
anticipate an improvement in economic activity (-11%*)
of respondents received a base salary increase (+8%*)
is the average salary for UK Property Professionals (+7.0%*)
Real Industry Change (+1.1%*)
of the 62% who received an increase the average was 7.1% (+0.5%*)
40% (equal to last year) of all respondents secured an average bonus of £14,420 (+10.3%*)
*Versus last year 4

The RICS and Macdonald & Company Rewards & Attitudes Survey 2015 Results 5*Versus last year 4The RICS and Macdonald & Company Rewards & Attitudes Survey 2015 Results 5
believe their pay and benefits will be positively affected by market conditions in the next 12 months (versus 43%*)
of respondents believe their organisation will increase headcount in 2015 (+4%*)
A FRICS earns £66,196 in comparison to a non RICS counterpart who earns on average £45,778
of respondents class their current employer as an employer of choice (+4%*)
Better salary continues to be the principle reason for seeking a new job
Evidence of increase in provision of benefits such as mobile phone, professional fees and pensions

6 www.macdonaldandcompany.com/salary-survey
RESEARCH SAMPLE PROFILE
Response Rate TotalNow in its sixteenth year, the survey remains the most credible and respected survey of its kind in the UK property sector. With a sample size of 8,311 (+1.2% versus last year) the survey response rate remains extremely robust.
2009 2010 2011 2012 2013 2014 2015
10,476
+1.2% 14/15+6.8% 13/15
8,477 8,351
9,819
7,7838,209 8,311
0
2,000
4,000
6,000
8,000
10,000
12,000
Years’ ExperienceHow many years’ experience do you have in your discipline?61% of respondents have 16 years’ experience or more in their chosen discipline, versus 53% last year. The respondents with over 21 years’ experience demonstrated the largest growth, up from 41% to 49%.
8%
17%
25%
33%
42%
50%
0%
Up to 4 yrs 5–10 yrs 11–15 yrs 16–20 yrs Over 21yrs
2013 2014 2015
15%
12%
9%
23%
20%
16%
14%
14%
13%
12%
12%
12%
36%
41%
49%
Level of ResponsibilityWhat is the level of responsibility within the organisation for which you work?57% of the respondents are either Associate/Manager or above within the organisation, an increase from 50% last year. 20% of respondents are either an Assistant/Trainee or Staff/Other within the organisation (down 6% versus last year). 5%
10%
15%
20%
25%
30%
0%
Assistant/Trainee/
Graduate
Staff/Surveyor/
Other
Associate/Manager
Partner/Director/
VicePresident -
Salaried
Principal/Director/Partner -
Equity
ManagingDirector/
CEO
Senior
2013 2014 2015
8%
7%
4%
19%
19%
16%
22% 24
% 26% 28
%
28%
14%
12%
15%
7% 7%
9%
4%
3%
5%
23%

The RICS and Macdonald & Company Rewards & Attitudes Survey 2015 Results 7
Average UK SalaryWhat is your current Annual Base Salary?The average salary is at its highest level for the last 8 years. The average salary of a UK property professional has increased from £51,179 to £54,771 (or up by 7.0%) in 2015. N.B. the increase in average salary may be partially explained by the greater proportion of senior respondents (61% of respondents have 16 or more years’ experience, versus 53% last year).
2009 2010
£44,042
2011
£47,587
2012
£50,250
2013
£48,329
2014
£48,901
2015
£54,771£51,179
£0
£10,000
£20,000
£30,000
£40,000
£50,000
£60,000
+7.0% 14/15+12.0% 13/15
Average Salary by Gender & AgeWhat is your current Annual Base Salary?Male property professionals earn more, on average, than their female counterparts (£56,609 versus £44,794) and the gender premium rose from 25.5% last year to 27.0% in 2015. The discrepancy between male and female property professionals is evident across age groups and is most acute in entry level positions for those aged between 18-22, where the difference in average salary is 39.7%.
Average Salary by MembershipWhat is your current Annual Base Salary?RICS membership leads to higher remuneration. For example, a FRICS earns £66,196 in comparison to a non RICS counterpart who earns on average £45,778 (or a 44.6% premium). Those with a MRICS qualification secured the highest average salary increase up £3,544 from £51,128 to £54,672 (or up 7.1%).
AVERAGE UK SALARY (£KPA )
Av. RICS(part qual)
MRICS FRICS AssocRICS NotProfessionally
Quali�ed
2013 2014 2015
£0
£10,000
£20,000
£30,000
£40,000
£50,000
£60,000
£70,000
£48,
901
£51,
179
£54,
771
£32,
562
£35,
386
£37,
837
£49,
986
£51,
128
£54,
762
£62,
480
£64,
755
£66,
196
£43,
845
£43,
415
£41,
679
£40,
235
£44,
870
£45,
778
18-22 23-26 27-30 31-35 36-45 46-55 56+
Male Female
£0
£10,000
£20,000
£30,000
£40,000
£50,000
£60,000
£70,000
£28,
816
£20,
625 £2
9,80
0
£27,
966
£38,
470
£36,
150
£47,
497
£41,
303
£60,
250
£48,
962
£64,
542
£51,
814 £57,
864
£50,
004

8 www.macdonaldandcompany.com/salary-survey
Average Salary by RegionWhat is your current annual Base Salary?Respondents working in Greater London continue to earn on average the highest salary (£65,514) across all the regions and command a premium of £11,663 versus the South East in second place or £20,835 in comparison to Ireland at the bottom of the league table. All regions have illustrated a year on year growth, with Ireland (+14.4%), East Anglia (+11.4%) and Greater London (+9.0%) showing the largest growth in average annual salaries.
Change in SalaryWhat change (if any) was made to your annual salary at your last pay review?Overall 36% of respondents received no change in base salary. Of the 62% that received an increase in base salary last year the average increase was 7.1%. 2% of respondents received a pay reduction;with an average reduction of 18.4%. Considering the survey sample as a whole, the industry experienced an increase of +6.2%, up from last year’s industry increase of 5.1%.
Change to Salary at Last ReviewWhat change (if any) was made to your annual salary at your last pay review?62% of respondents received a base salary increase, up 54% from last year; 2% of respondents had a base salary reduction, down from 3% the previous year; 36% of respondents had no change made to their base salary, down from 43% the previous year.
AVERAGE UK SALARY (£KPA )
£45,514£49,046
£43,779
Average All
Greater London
South East
South West/Wales
East Anglia
Midlands
North West/East
Scotland
Ireland
Other
2013 2014 2015
£51,179£54,771
£48,901
£60,089£65,514
£56,383
£52,224£53,851
£49,780
£43,689£45,882
£41,304
£44,744£49,840
£42,082
£45,925£49,671
£44,894
£44,317£47,740
£43,764
£39,062£44,679
£35,511
£0 £10,000 £20,000 £30,000 £40,000 £50,000 £60,000 £70,000
£57,077£51,788
£63,383
Up by 15%+ (+2%)7%
Up by 11-15% (+1%)5%
Up 6-10% (+1%)9%
Up by <5% (+4%)39%
Reduced (-1%)2%
Unchanged (-7%)36%
Up not disclosed (=)2%
-20%
-15%
-10%
-5%
0%
5%
10%
AverageIncrease
7.1%
-18.4%
4,112 or 62% (+8%) of
respondents
2,431 or 36%(-7%) of
respondents
Average across6,692 respondents
145 or 2% (-1%) ofrespondents
6.2%
0%
NoChange
AverageDecrease
RIC
(*= average increase of those respondents who reported a salary increase offset against those who reported a salary decrease as a %) (Please note: 1,619 respondents did not respond to question & not included with % �gures)

The RICS and Macdonald & Company Rewards & Attitudes Survey 2015 Results 9
BONUS AND OTHER BENEFITS
Average UK Salary IncreaseIf your salary was increased, please indicate % increase?Of those respondents who did receive an increase in base salary (62% up from 54% the previous year), the average increase across all sectors of employment, location and level increased by 0.5% from 6.6% to 7.1%.
Bonuses Received Over the Last 12 MonthsWhat was the approximate value of your annual bonus (or bonuses) over the last 12 months?40% of UK property professionals received a bonus. Those professionals who received a bonus “£10K+” accounted for the highest % of respondents and they also received the highest growth at +1%.
Average UK BonusWhat was the approximate value of your annual bonus (or bonuses) over the last 12 months?The proportion of property professionals who secured an annual bonus remained at 40% this year. However, the average increase rose to £14,420 compared with £13,074 last year. The highest bonuses continue to be paid within the Fund Management (£52,944), Property Finance (£37,612) and Financial Institution/Fund (£27,629) sectors.
£13,803£13,074
£14,420
39% 40% 40%
2013 2014 2015
£0
£3,000
£6,000
£9,000
£12,000
£15,000
Nil (=)60%
£10K+ (+1%)15%
Up to £2.5K (-1%)11%
£5K - £9.9K (=)8%
£2.5K - £4.9K (=)6%
2013 2014 2015
43%
6.4%
54%
6.6%
62%
7.1%
0%
1%
2%
3%
4%
5%
6%
7%
8%

10 www.macdonaldandcompany.com/salary-survey
BONUS AND OTHER BENEFITS
Bonus by Level of ResponsibilityWhat was the approximate value of your annual bonus (or bonuses) over the last 12 months?The largest bonuses, on average £39,647 last year, were paid to Principal/Director/Partners – Equity, followed closely by Managing Director/CEOs who secured bonuses of £37,064, on average. The steady decline in bonuses awarded to Managing Director/CEOs may reflect a change in the emphasis of executive remuneration towards long-term incentives other than a cash bonus.
Average UK Total RewardWhat was the approximate value of your annual salary, bonus and additional remuneration received (e.g. commission & performance related pay) over the last 12 months?The average total reward of a UK property professional increased from £78,974 to £84,702 (or up by 7.3%) in 2015. The total reward includes the average annual salary, average annual bonus (or bonuses) and the average additional remuneration received (e.g. commission & performance related bonus) last year.
Employee BenefitsWhich of the following additional benefits are included in your current package?The provision of a company mobile phone (68%, up 3% from previous year) is the most popular employee benefit received by a property professional. Contributory pension (64%, up by 4%), professional subscription/fees (64%, up by 4%) and health insurance (44%, equal to last year) are also popular employee benefits across the sector.
2013 2014 2015
Mobile phone
Contributory pension
Professionalsubscriptions/fees
Health insurance
Company carallowance
Performancerelated bonus
Other insurances(critical illness/life)
Company car
Flexitime
Share option scheme
Flexible bene�ts package
Pro�t share
Club membership
Paid overtime
Lunches/luncheon vouchers
None
Other
0% 10% 20% 30% 40% 50% 60% 70% 80%
2%2%2%
4%4%4%
4%4%4%
7%8%
7%
11%13%
13%
12%13%
13%
19%19%20%
20%21%22%
22%23%24%
23%24%25%
27%29%29%
43%44%44%
55%
56%
60%
60%
64%
64%
68%65%65%
8%8%
7%
5%0%
4%
Assistant/Trainee/
Graduate
Staff/Surveyor/
Other
Senior Associate/Manager
Partner/Director/
VicePresident -
Salaried
Principal/Director/Partner -
Equity
ManagingDirector/
CEO
2013 2014 2015
£0
£10,000
£20,000
£30,000
£40,000
£50,000
£60,000
£70,000
£1,9
90
£2,1
08£1
,621
£3,3
75£3
,831
£3,9
09
£5,7
89£5
,301
£6,7
16 £9,6
11£8
,784
£8,4
40
£23,
012
£22,
332
£24,
576
£61,
436
£44,
181
£37,
064
£41,
778
£38,
793
£39,
647
2013 2014 2015
£0
£10,000
£20,000
£30,000
£40,000
£50,000
£60,000
£70,000
£80,000
£90,000
£77,770
£14,996
£13,803
£48,971
£78,974
£14,721
£13,074
£51,179
£84,702
£15,511
£14,420
£54,771
Average Salary Average Bonus Additional Remuneration

The RICS and Macdonald & Company Rewards & Attitudes Survey 2015 Results 11
BONUS AND OTHER BENEFITS
Holiday UsageDo you utilise your full annual holiday entitlement?77% of respondents used their full annual holiday entitlement, the same as the previous year. 23% fail to take full holiday entitlement.
Holiday Usage (Cont.)Do you utilise your full annual holiday entitlement?
Holiday Usage (Cont.)Do you utilise your full annual holiday entitlement?
Yes (=)77%
No (=)23%
Assistant/Trainee/Graduate
2%
Staff/Surveyor/Other9%
Senior20%
Associate/Manager26%
Principal/Director/Partner - Equity
16%
Managing Director/CEO7%
Partner/Director/Vice President - Salaried
20%
Occupier3%
Contractor7%
Practice/Consultancy/Advisor49%
Development/Investment/Property Company/REIT
11%
Financial Institution/Fund4%
Facilities Management3%
Engineering2%
Central/Local Government14%
Education2%
Non-pro�t making organisation4%
Utilities/Power1%

12 www.macdonaldandcompany.com/salary-survey
OVERVIEWBY MAIN PROFESSIONAL ACTIVITY
RESPONSES AVERAGE SALARY AVERAGE BONUS CHANGE TO SALARY – LAST YEAR NEXT 12 MONTHS – ANTICIPATED ECONOMIC CHANGE
= RIC* = ?
Average Overall 8311 £54,771 £14,420 36% 61% 2% 6.2% 43% 46% 5% 1% 4%
Academic 40 £44,948 £7,600 15% 81% 4% 2.7% 54% 27% 12% 0% 8%
Architect/Design 244 £48,657 £8,929 43% 52% 5% 6.7% 43% 47% 4% 2% 5%
Arts & Antiques 12 £34,350 £11,750 56% 44% 0% 11.8% 75% 13% 0% 0% 13%
Building Control 175 £42,971 £6,605 48% 46% 6% 2.7% 49% 30% 16% 0% 5%
Building Surveying 747 £45,916 £7,701 38% 60% 2% 7.8% 38% 53% 5% 0% 3%
Business Development Management 72 £70,763 £17,843 28% 69% 4% 1.6% 44% 55% 0% 0% 2%
Claims & Dispute Resolution 31 £66,279 £7,000 46% 54% 0% 6.4% 48% 39% 9% 0% 4%
Commercial Development 163 £73,792 £26,019 30% 69% 2% 6.6% 40% 52% 4% 2% 2%
Construction Management 151 £70,790 £12,698 42% 56% 3% 3.6% 38% 52% 3% 0% 6%
Corporate Property Consultancy 129 £63,579 £18,320 35% 63% 3% 7.1% 38% 53% 3% 3% 3%
Energy/Renewables 108 £56,063 £13,403 36% 63% 1% 6.9% 45% 30% 15% 0% 10%
Environmental/Sustainability 63 £50,181 £8,696 37% 59% 4% 7.1% 30% 59% 4% 0% 7%
Estates Surveyor (In House) 386 £50,715 £8,355 32% 67% 1% 3.9% 59% 31% 7% 1% 2%
Facilities Management 418 £56,959 £13,214 38% 60% 2% 3.7% 53% 36% 5% 1% 5%
Financial/Real Estate Analyst 58 £51,735 £19,240 42% 55% 4% 7.1% 34% 53% 4% 2% 6%
FM Procurement 6 £73,000 £10,000 50% 50% 0% 1.0% 75% 0% 0% 25% 0%
Fund Management 112 £97,939 £52,944 32% 68% 0% 10.5% 31% 65% 2% 0% 2%
General Practice 290 £46,899 £13,533 52% 44% 5% 5.9% 50% 36% 8% 1% 4%
Geomatics 38 £41,287 £4,322 46% 54% 0% 6.4% 56% 35% 6% 3% 0%
Health and Safety 71 £59,194 £25,181 39% 56% 5% 3.7% 56% 28% 7% 2% 7%
Industrial Agent/Leasing 31 £53,225 £21,845 50% 50% 0% 10.8% 20% 80% 0% 0% 0%
Investment Brokerage/Agency 79 £60,905 £30,794 25% 75% 0% 15.1% 23% 70% 2% 2% 4%
Landlord & Tenant 82 £53,253 £15,869 42% 57% 2% 5.8% 50% 43% 5% 0% 2%
Landscape Architect 2 NA NA NA NA NA NA NA NA NA NA NA
Minerals 7 £41,833 £100 43% 57% 0% 2.5% 29% 43% 14% 0% 14%
Office Agent/Leasing 43 £46,015 £15,414 50% 50% 0% 11.0% 28% 66% 6% 0% 0%
Planner 142 £52,615 £13,510 37% 61% 3% 5.6% 53% 35% 6% 1% 5%
Project Management 535 £61,358 £15,019 35% 63% 2% 5.6% 41% 51% 3% 1% 3%
Property Asset Management 434 £65,659 £19,352 36% 61% 3% 6.8% 43% 45% 7% 1% 4%
Property Finance 67 £74,098 £37,612 28% 70% 2% 6.5% 30% 64% 4% 0% 2%
Property Manager 354 £53,017 £8,968 30% 68% 2% 5.0% 45% 46% 5% 1% 4%
CONTINUED ON PAGE 10 - 11

The RICS and Macdonald & Company Rewards & Attitudes Survey 2015 Results 13
RESPONSES AVERAGE SALARY AVERAGE BONUS CHANGE TO SALARY – LAST YEAR NEXT 12 MONTHS – ANTICIPATED ECONOMIC CHANGE
= RIC* = ?
Average Overall 8311 £54,771 £14,420 36% 61% 2% 6.2% 43% 46% 5% 1% 4%
Academic 40 £44,948 £7,600 15% 81% 4% 2.7% 54% 27% 12% 0% 8%
Architect/Design 244 £48,657 £8,929 43% 52% 5% 6.7% 43% 47% 4% 2% 5%
Arts & Antiques 12 £34,350 £11,750 56% 44% 0% 11.8% 75% 13% 0% 0% 13%
Building Control 175 £42,971 £6,605 48% 46% 6% 2.7% 49% 30% 16% 0% 5%
Building Surveying 747 £45,916 £7,701 38% 60% 2% 7.8% 38% 53% 5% 0% 3%
Business Development Management 72 £70,763 £17,843 28% 69% 4% 1.6% 44% 55% 0% 0% 2%
Claims & Dispute Resolution 31 £66,279 £7,000 46% 54% 0% 6.4% 48% 39% 9% 0% 4%
Commercial Development 163 £73,792 £26,019 30% 69% 2% 6.6% 40% 52% 4% 2% 2%
Construction Management 151 £70,790 £12,698 42% 56% 3% 3.6% 38% 52% 3% 0% 6%
Corporate Property Consultancy 129 £63,579 £18,320 35% 63% 3% 7.1% 38% 53% 3% 3% 3%
Energy/Renewables 108 £56,063 £13,403 36% 63% 1% 6.9% 45% 30% 15% 0% 10%
Environmental/Sustainability 63 £50,181 £8,696 37% 59% 4% 7.1% 30% 59% 4% 0% 7%
Estates Surveyor (In House) 386 £50,715 £8,355 32% 67% 1% 3.9% 59% 31% 7% 1% 2%
Facilities Management 418 £56,959 £13,214 38% 60% 2% 3.7% 53% 36% 5% 1% 5%
Financial/Real Estate Analyst 58 £51,735 £19,240 42% 55% 4% 7.1% 34% 53% 4% 2% 6%
FM Procurement 6 £73,000 £10,000 50% 50% 0% 1.0% 75% 0% 0% 25% 0%
Fund Management 112 £97,939 £52,944 32% 68% 0% 10.5% 31% 65% 2% 0% 2%
General Practice 290 £46,899 £13,533 52% 44% 5% 5.9% 50% 36% 8% 1% 4%
Geomatics 38 £41,287 £4,322 46% 54% 0% 6.4% 56% 35% 6% 3% 0%
Health and Safety 71 £59,194 £25,181 39% 56% 5% 3.7% 56% 28% 7% 2% 7%
Industrial Agent/Leasing 31 £53,225 £21,845 50% 50% 0% 10.8% 20% 80% 0% 0% 0%
Investment Brokerage/Agency 79 £60,905 £30,794 25% 75% 0% 15.1% 23% 70% 2% 2% 4%
Landlord & Tenant 82 £53,253 £15,869 42% 57% 2% 5.8% 50% 43% 5% 0% 2%
Landscape Architect 2 NA NA NA NA NA NA NA NA NA NA NA
Minerals 7 £41,833 £100 43% 57% 0% 2.5% 29% 43% 14% 0% 14%
Office Agent/Leasing 43 £46,015 £15,414 50% 50% 0% 11.0% 28% 66% 6% 0% 0%
Planner 142 £52,615 £13,510 37% 61% 3% 5.6% 53% 35% 6% 1% 5%
Project Management 535 £61,358 £15,019 35% 63% 2% 5.6% 41% 51% 3% 1% 3%
Property Asset Management 434 £65,659 £19,352 36% 61% 3% 6.8% 43% 45% 7% 1% 4%
Property Finance 67 £74,098 £37,612 28% 70% 2% 6.5% 30% 64% 4% 0% 2%
Property Manager 354 £53,017 £8,968 30% 68% 2% 5.0% 45% 46% 5% 1% 4%
14 www.macdonaldandcompany.com/salary-survey
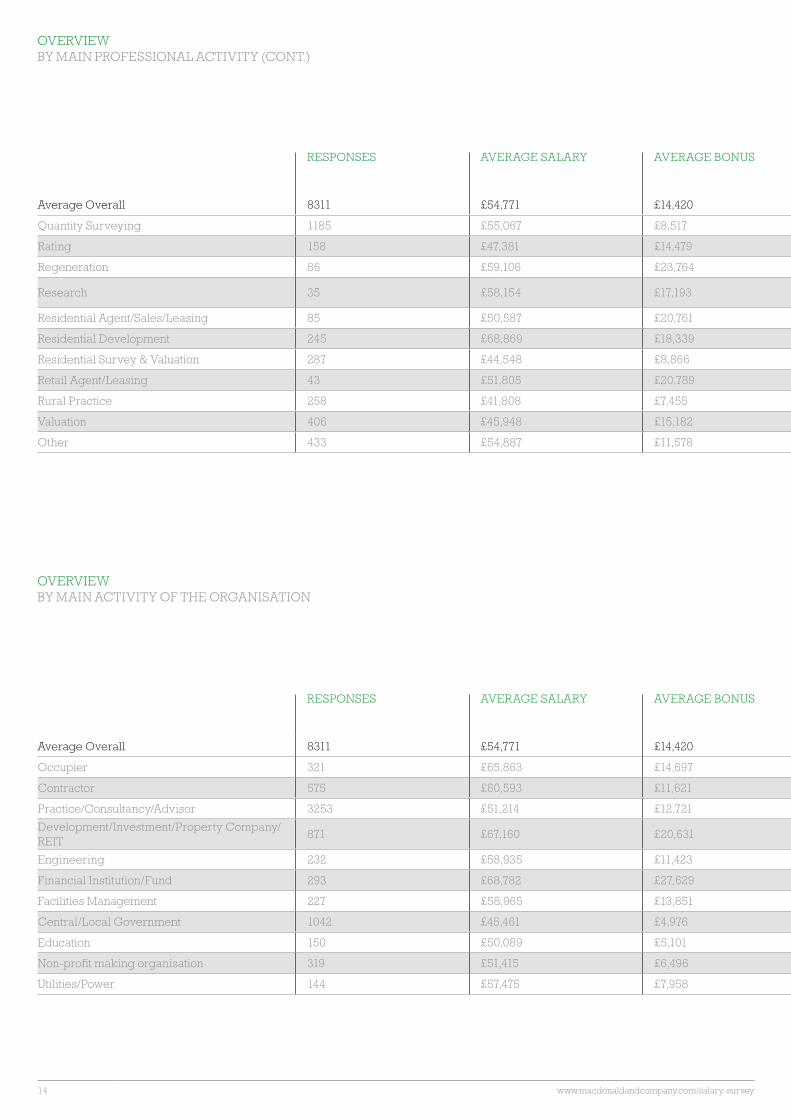
OVERVIEWBY MAIN PROFESSIONAL ACTIVITY (CONT.)
RESPONSES AVERAGE SALARY AVERAGE BONUS CHANGE TO SALARY – LAST YEAR NEXT 12 MONTHS – ANTICIPATED ECONOMIC CHANGE
= RIC* = ?
Average Overall 8311 £54,771 £14,420 36% 61% 2% 6.2% 43% 46% 5% 1% 4%
Occupier 321 £65,863 £14,697 26% 72% 2% 5.3% 49% 40% 8% 1% 3%
Contractor 575 £60,593 £11,621 34% 65% 1% 6.1% 35% 58% 2% 1% 4%
Practice/Consultancy/Advisor 3253 £51,214 £12,721 40% 58% 2% 8.2% 37% 55% 3% 1% 4%
Development/Investment/Property Company/REIT
871 £67,160 £20,631 32% 67% 1% 7.1% 36% 57% 3% 1% 3%
Engineering 232 £58,935 £11,423 27% 72% 2% 4.8% 35% 52% 4% 2% 7%
Financial Institution/Fund 293 £68,782 £27,629 25% 72% 2% 7.4% 38% 54% 4% 1% 4%
Facilities Management 227 £58,965 £13,851 38% 59% 3% 4.7% 51% 36% 7% 1% 5%
Central/Local Government 1042 £45,461 £4,976 43% 53% 4% 2.0% 66% 15% 15% 1% 3%
Education 150 £50,089 £5,101 33% 64% 3% 2.7% 59% 33% 5% 0% 3%
Non-profit making organisation 319 £51,415 £6,496 29% 70% 0% 4.4% 56% 36% 4% 1% 4%
Utilities/Power 144 £57,475 £7,958 25% 74% 1% 5.1% 55% 36% 5% 0% 4%
RESPONSES AVERAGE SALARY AVERAGE BONUS CHANGE TO SALARY – LAST YEAR NEXT 12 MONTHS – ANTICIPATED ECONOMIC CHANGE
= RIC* = ?
Average Overall 8311 £54,771 £14,420 36% 61% 2% 6.2% 43% 46% 5% 1% 4%
Quantity Surveying 1185 £55,067 £8,517 32% 67% 1% 6.4% 35% 56% 3% 1% 5%
Rating 158 £47,381 £14,479 33% 66% 1% 4.1% 62% 24% 9% 0% 5%
Regeneration 86 £59,106 £23,764 51% 47% 3% 1.8% 58% 28% 10% 1% 3%
Research 35 £58,154 £17,193 25% 71% 4% 22.0% 29% 48% 14% 5% 5%
Residential Agent/Sales/Leasing 85 £50,587 £20,761 64% 34% 2% 9.3% 27% 52% 11% 0% 9%
Residential Development 245 £68,869 £18,339 32% 66% 2% 8.5% 37% 58% 4% 0% 2%
Residential Survey & Valuation 287 £44,548 £8,866 37% 60% 3% 6.7% 50% 38% 6% 1% 5%
Retail Agent/Leasing 43 £51,805 £20,789 38% 62% 0% 10.8% 35% 54% 4% 0% 8%
Rural Practice 258 £41,808 £7,455 27% 70% 3% 4.8% 50% 38% 5% 1% 5%
Valuation 406 £45,948 £15,182 40% 58% 2% 8.1% 43% 48% 5% 1% 3%
Other 433 £54,887 £11,578 43% 56% 2% 5.6% 51% 36% 5% 1% 7%
OVERVIEWBY MAIN ACTIVITY OF THE ORGANISATION

The RICS and Macdonald & Company Rewards & Attitudes Survey 2015 Results 15
RESPONSES AVERAGE SALARY AVERAGE BONUS CHANGE TO SALARY – LAST YEAR NEXT 12 MONTHS – ANTICIPATED ECONOMIC CHANGE
= RIC* = ?
Average Overall 8311 £54,771 £14,420 36% 61% 2% 6.2% 43% 46% 5% 1% 4%
Occupier 321 £65,863 £14,697 26% 72% 2% 5.3% 49% 40% 8% 1% 3%
Contractor 575 £60,593 £11,621 34% 65% 1% 6.1% 35% 58% 2% 1% 4%
Practice/Consultancy/Advisor 3253 £51,214 £12,721 40% 58% 2% 8.2% 37% 55% 3% 1% 4%
Development/Investment/Property Company/REIT
871 £67,160 £20,631 32% 67% 1% 7.1% 36% 57% 3% 1% 3%
Engineering 232 £58,935 £11,423 27% 72% 2% 4.8% 35% 52% 4% 2% 7%
Financial Institution/Fund 293 £68,782 £27,629 25% 72% 2% 7.4% 38% 54% 4% 1% 4%
Facilities Management 227 £58,965 £13,851 38% 59% 3% 4.7% 51% 36% 7% 1% 5%
Central/Local Government 1042 £45,461 £4,976 43% 53% 4% 2.0% 66% 15% 15% 1% 3%
Education 150 £50,089 £5,101 33% 64% 3% 2.7% 59% 33% 5% 0% 3%
Non-profit making organisation 319 £51,415 £6,496 29% 70% 0% 4.4% 56% 36% 4% 1% 4%
Utilities/Power 144 £57,475 £7,958 25% 74% 1% 5.1% 55% 36% 5% 0% 4%
RESPONSES AVERAGE SALARY AVERAGE BONUS CHANGE TO SALARY – LAST YEAR NEXT 12 MONTHS – ANTICIPATED ECONOMIC CHANGE
= RIC* = ?
Average Overall 8311 £54,771 £14,420 36% 61% 2% 6.2% 43% 46% 5% 1% 4%
Quantity Surveying 1185 £55,067 £8,517 32% 67% 1% 6.4% 35% 56% 3% 1% 5%
Rating 158 £47,381 £14,479 33% 66% 1% 4.1% 62% 24% 9% 0% 5%
Regeneration 86 £59,106 £23,764 51% 47% 3% 1.8% 58% 28% 10% 1% 3%
Research 35 £58,154 £17,193 25% 71% 4% 22.0% 29% 48% 14% 5% 5%
Residential Agent/Sales/Leasing 85 £50,587 £20,761 64% 34% 2% 9.3% 27% 52% 11% 0% 9%
Residential Development 245 £68,869 £18,339 32% 66% 2% 8.5% 37% 58% 4% 0% 2%
Residential Survey & Valuation 287 £44,548 £8,866 37% 60% 3% 6.7% 50% 38% 6% 1% 5%
Retail Agent/Leasing 43 £51,805 £20,789 38% 62% 0% 10.8% 35% 54% 4% 0% 8%
Rural Practice 258 £41,808 £7,455 27% 70% 3% 4.8% 50% 38% 5% 1% 5%
Valuation 406 £45,948 £15,182 40% 58% 2% 8.1% 43% 48% 5% 1% 3%
Other 433 £54,887 £11,578 43% 56% 2% 5.6% 51% 36% 5% 1% 7%

16 www.macdonaldandcompany.com/salary-survey
Pay and BenefitsHow do you anticipate that your pay and benefits will be affected by market conditions in the next 12 months? 46% believe their pay and benefits will be positively affected by market conditions in the next 12 months versus 43% in 2014 – a 3% rise year on year. 43% do not anticipate any change (-2%) , while only 1% are likely to leave the profession (=).
Job SatisfactionHow satisfied overall are you with your current job?The majority of survey participants (84%, +4%) are fairly or very satisfied with their current job. Those who felt they were not at all satisfied with their current job, fell from 4% last year to 3% this year (or down by 1%).
Important Job AspectsHow important are each of the following to you in your job?Range of interesting work (69%, +2%) is now considered the most important job aspect for property professionals, overtaking salary (67%, -3%) which had been considered the most important for the previous 2 years. These are followed by management style (64%, +2%), and job security (57%, -2%). Working environment has increased from 51% to 54% (up 3% versus last year).
MARKET ATTITUDES
Fairly (-2%)50%
Very (+6%)34%
Not very (-4%)13%
Not at all (-1%)3%
Travel opportunities
Latest technology
Range of clients
Training/Development
Location
Working environment
Responsibility
Career progression
Job security
Management style
Range of interesting work
Salary
2013 2014 2015
69%67%
71%
67%
64%62%
65%
57%59%
62%
54%51%
54%
53%52%
56%
53%51%
49%
49%53%
57%
36%37%
40%
29%
19%
19%22%
8%7%
10%
30%31%
70%
70%
0% 20% 40% 60% 80%
Positively (+3%)46%
No change (-2%)43%
Likely to leave profession (=)
1%
Don't know (=)4%
Negatively (-2%)5%

The RICS and Macdonald & Company Rewards & Attitudes Survey 2015 Results 17
MARKET ATTITUDES
Important Job AspectsHow important are each of the following to you in your job?The chart to the right illustrates the change in attitudes over the period from 2007 to 2015. Both job security and location have increased in importance by 14% and rank fourth and seventh respectively in 2015. Management style has also increased by 12% over the 9 year period.
Employer of ChoiceDo you consider your current employer an employer of choice?Overall, 77% of the survey respondents consider that their current employer is their employer of choice, an increase of 4% from last year.
Employer of ChoiceHow important are the following factors in making your current employer an employer choice?Of the 77% of respondents who consider that they are working for an “employer of choice”, the key factors are leadership and management style (60%, +4%), business vision and future potential (59%, +2%), company values/ethics (59%, +3%) and reward and recognition (58%, +1%).
Job
sec
urity
Loca
tion
Man
agem
ent s
tyle
Resp
onsi
bili
ty
Sala
ry
Wor
king
env
iron
men
t
Trai
ning
/Dev
elop
men
t
Rang
e of
clie
nts
Late
st te
chno
log
y
Rang
e of
inte
rest
ing
wor
k
Car
eer
pro
gre
ssio
n
Trav
el o
pp
ortu
nitie
s
0%
5%
10%
15% 14%
14%
12%
11%
10%
7% 7% 7%
6% 6%
0% 0%
20%
% Change from 2007 to 2015
Fairly (-2%)20%
Very (-3%)12%
Not very (+2%)45%
Not at all (+3%)24%
Leadership/Management style
Business vision& future potential
Companyvalues/Ethics
Reward &recognition
Work lifebalance
Brand values
Colleagues/Social dimension
Personal development culture
Promotionalopportunities
Internalcommunication
Support in gainingyour quali�cations
C.S.R policy (CorporateSocial Responsibility)
Relocationpossibilities
2013 2014 2015
0% 10% 20% 30% 40% 50% 60%
60%56%
57%
59%57%
59%
59%56%
58%
58%57%
56%
58%56%
54%
47%43%
45%
41%40%
41%
40%38%
42%
39%39%
41%
29%29%
30%
26%29%
30%
21%21%
20%
11%9%10%
18 www.macdonaldandcompany.com/salary-survey
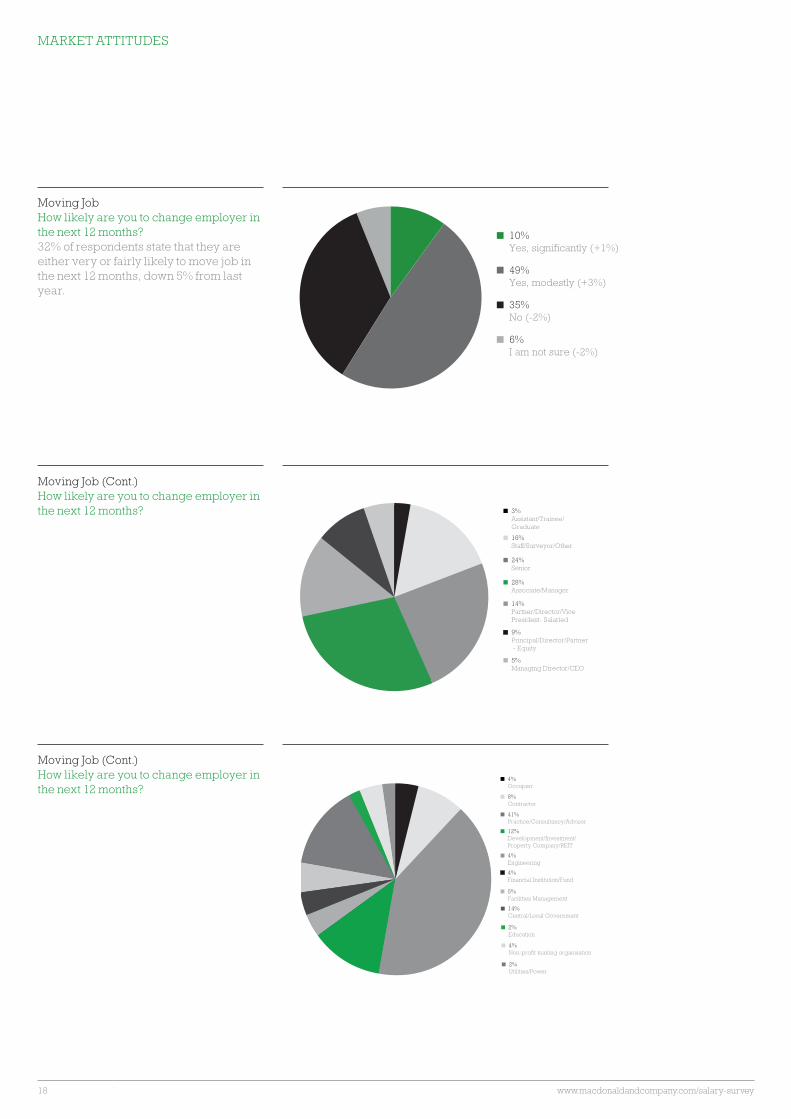
Moving JobHow likely are you to change employer in the next 12 months?32% of respondents state that they are either very or fairly likely to move job in the next 12 months, down 5% from last year.
Moving Job (Cont.)How likely are you to change employer in the next 12 months?
Moving Job (Cont.) How likely are you to change employer in the next 12 months?
MARKET ATTITUDES
Yes, signi�cantly (+1%)10%
Yes, modestly (+3%)49%
No (-2%)35%
I am not sure (-2%)6%
Assistant/Trainee/Graduate
3%
Staff/Surveyor/Other16%
Senior24%
Associate/Manager28%
Principal/Director/Partner - Equity
9%
Managing Director/CEO5%
Partner/Director/Vice President- Salaried
14%
Occupier4%
Contractor8%
Practice/Consultancy/Advisor41%
Development/Investment/Property Company/REIT
12%
Financial Institution/Fund4%
Facilities Management5%
Engineering4%
Central/Local Government14%
Education2%
Non-pro�t making organisation4%
Utilities/Power2%
The RICS and Macdonald & Company Rewards & Attitudes Survey 2015 Results 19
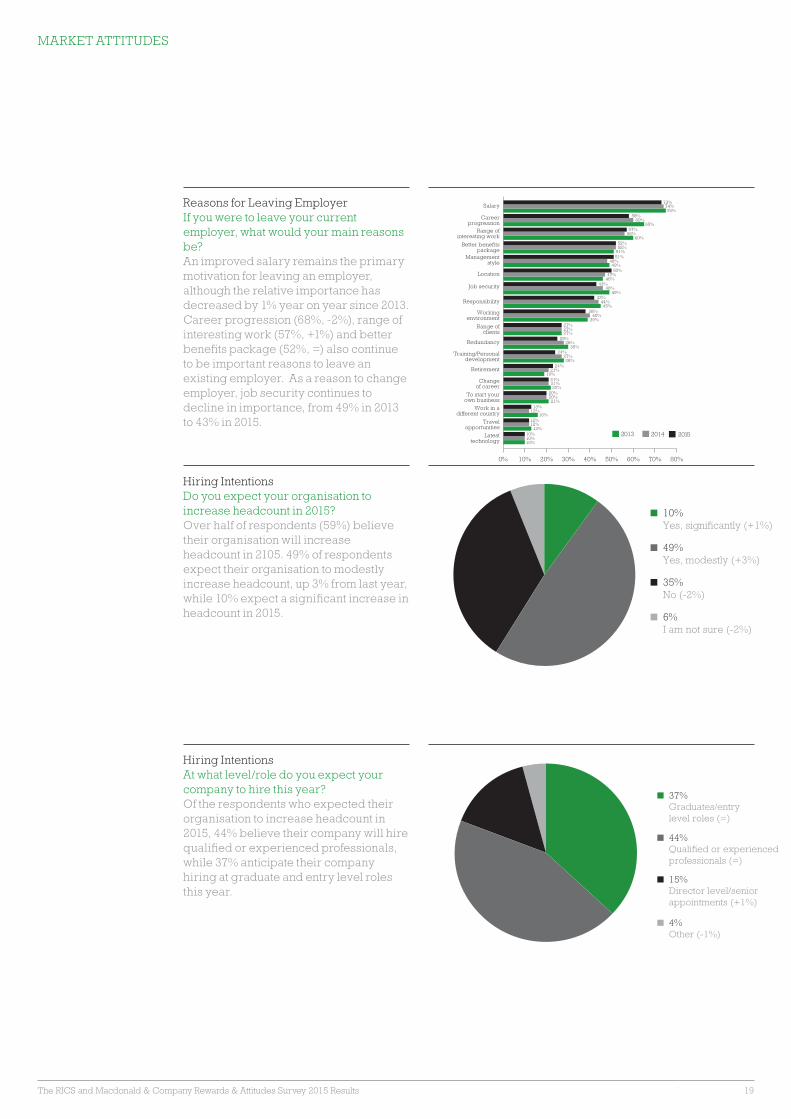
Reasons for Leaving EmployerIf you were to leave your current employer, what would your main reasons be?An improved salary remains the primary motivation for leaving an employer, although the relative importance has decreased by 1% year on year since 2013. Career progression (68%, -2%), range of interesting work (57%, +1%) and better benefits package (52%, =) also continue to be important reasons to leave an existing employer. As a reason to change employer, job security continues to decline in importance, from 49% in 2013 to 43% in 2015.
Hiring IntentionsDo you expect your organisation to increase headcount in 2015?Over half of respondents (59%) believe their organisation will increase headcount in 2105. 49% of respondents expect their organisation to modestly increase headcount, up 3% from last year, while 10% expect a significant increase in headcount in 2015.
Hiring IntentionsAt what level/role do you expect your company to hire this year?Of the respondents who expected their organisation to increase headcount in 2015, 44% believe their company will hire qualified or experienced professionals, while 37% anticipate their company hiring at graduate and entry level roles this year.
Yes, signi�cantly (+1%)10%
Yes, modestly (+3%)49%
No (-2%)35%
I am not sure (-2%)6%
Graduates/entrylevel roles (=)
37%
Quali�ed or experiencedprofessionals (=)
44%
Director level/seniorappointments (+1%)
15%
Other (-1%)4%
Salary
Careerprogression
Range ofinteresting work
Better bene�tspackage
Managementstyle
Location
Job security
Responsibility
Workingenvironment
Range ofclients
Redundancy
Training/Personaldevelopment
Changeof career
To start yourown business
Work in adifferent country
Travelopportunities
Latesttechnology
Retirement
2013 2014 2015
73%74%75%
58%60%
65%57%
56%60%
52%52%
51%51%
48%49%50%
47%46%
43%46%
49%42%
44%45%
38%40%
39%27%27%27%
25%28%
30%24%
27%28%
24%21%
19%21%21%22%
20%20%21%
13%12%
16%12%12%
13%10%10%10%
0% 10% 20% 30% 40% 50% 60% 70% 80%
MARKET ATTITUDES

20 www.macdonaldandcompany.com/salary-survey
Pay and Benefits by Main Professional ActivityHow do you anticipate that your pay and benefits will be affected by market conditions in the next 12 months? 80% of Industrial Agents/Leasing anticipate their pay and benefits will be positively affected by market conditions in the next 12 months, making it the most confident Main Professional Activity. They are followed by Fund Management (65%) and Property Finance (64%). Those working in Building Control are the least confident, with 16% anticipating their pay and benefits will be negatively affected.
Economic Activity by Main Professional ActivityIn your chosen profession, do you anticipate economic activity in the next 12 months?Industrial Agents/Leasing are also the most positive about the economic outlook in the next 12 months with 84% anticipating an increase in economic activity during 2015, followed by Property Finance (75%) and Environmental/Sustainability (72%). Those working in Energy/Renewables are the least confident, with 20% anticipating a decrease in economic activity during 2015.
Economic ActivityIn your chosen profession, do you anticipate economic activity in the next 12 months?Those working in Greater London are generally the most optimistic with 64% anticipating a increase in economic activity. The North West/East follows as one of the most optimistic regions with 61% anticipating an increase compared to 59% across the UK.
MARKET ATTITUDES
Average All
Greater London
North West/East
East Anglia
South East
Midlands
Ireland
Scotland
South West/Wales
Other
59%6%
35%
64%5%
31%
61%4%
34%
58%3%
39%
58%5%
37%
56%6%
38%
56%15%
29%
54%7%
39%
53%7%
40%
57%10%
32%
Increase
Decrease
Remain Unchanged
0% 10% 20% 30% 40% 50% 60% 70% 80%
80%
65% 64%59%
56%
15% 14%16%12%
9%
0%
10%
20%
30%
40%
50%
60%
70%
80%
Ind
ustr
ial A
gne
t/Lea
sing
Prop
erty
Fin
ance
Env
iron
men
tal/S
usta
inab
ility
Qua
ntity
Sur
veyi
ng
Fund
Man
agem
ent
Ene
rgy/
Ren
ewab
ies
Res
earc
h
Rat
ing
Aca
dem
ic
Build
ing
Con
trol
Top 5 Positive Main ProfessionalActivities
Top 5 Main ProfessionalActivities
Ind
ustr
ial A
gne
t/Lea
sing
Prop
erty
Fin
ance
Env
iron
men
tal/S
usta
inab
ility
Qua
ntity
Sur
veyi
ng
Fund
Man
agem
ent
0%
20%
40%
60%
80%
100%
84%
75%72% 71%
62%
Ene
rgy/
Ren
ewab
ies
Res
earc
h
Rat
ing
Aca
dem
ic
Build
ing
Con
trol
20%
14% 13% 12%
6%
Top 5 Positive Main ProfessionalActivities
Top 5 Negative Main ProfessionalActivities

The RICS and Macdonald & Company Rewards & Attitudes Survey 2015 Results 21
Economic ActivityIn your chosen profession, do you anticipate economic activity in the next 12 months?Business sentiment and confidence remains positive with 59% anticipating an improvement in economic activity during 2015, although this has fallen slightly from 70% last year. Negative business sentiment has increased slightly by 2% to 6%, while 35% (+9%) of respondents believe anticipated economic activity will remain the same over the next 12 months. Increase Decrease Remain
unchanged
2013 2014 2015
0%
10%
20%
30%
40%
50%
60%
70%
80%
28%
70%
59%
13%
4% 6%
59%
26%
35%
—Nina Zeilerbauer, DirectorMacdonald & Company
People make the difference. We connect you to that difference.macdonaldandcompany.com
MARKET ATTITUDES

22 www.macdonaldandcompany.com/salary-survey
NOTES
—Peter Moore, Managing DirectorMacdonald & Company, Singapore
People make the difference. We connect you to that difference.macdonaldandcompany.com

The RICS and Macdonald & Company Rewards & Attitudes Survey 2015 Results 23
NOTES
—Peter Moore, Managing DirectorMacdonald & Company, Singapore
People make the difference. We connect you to that difference.macdonaldandcompany.com
Prime People PLC
London2 Harewood Place, Hanover Square, London W1S 1BX T +44 (0) 20 7629 7220 F: +44 (0) 87 0442 1737 E: [email protected]
ManchesterYork House, 20 York Street, Manchester M2 3BB T: +44 (0) 161 605 0500 E: [email protected]
DubaiKnowledge Village, Dubai Media City (TECOM), Block 11, Office F13, P. O. Box 282196 Dubai, UAE T: +971 4 4366 393 E: [email protected]
Hong Kong16th Floor, 1 Duddell Street, Central, Hong Kong T: +852 2248 3000 E: [email protected]
Singapore 63 Market Street #05-02, Bank of Singapore Centre Singapore, 048942 T: +65 6713 9640 E: [email protected]
South AfricaCorner House, Corner 10th Avenue & Wessel Road Rivonia 2128, South Africa T: +27 10 005 1520 E: [email protected]
www.macdonaldandcompany.com
Macdonald & Company is the leading professional recruitment consultancy for the real estate and built environment sectors. Established in 1994 and headquartered in the UK, we apply local knowledge with true global connection through our offices in Asia-Pacific, the Middle East and Africa. Our specialist teams act for every class of organisation owning, occupying, financing or advising on property, construction and engineering – developers, investors, institutions, funds, banks, consultancies and contractors. We are the preferred recruitment partner of RICS - the Royal Institution of Chartered Surveyors. Macdonald & Company is a subsidiary of the London Stock Exchange quoted Prime People Plc.
People make the difference. We connect you to that difference.