Ugly ducklings: Double-digit EV growth, plenty of … See report end for details of Nomura’s...
134
Hedge your inflation risk Ugly ducklings: Double-digit EV growth, plenty of upside trading at ex-growth multiples Korean lifers have greatly underperformed the KOSPI since listing due to flattening of the yield curve. But we expect the long end of the yield curve to rise slowly but surely, starting in 2H11. Meanwhile, we expect Korean lifers to deliver double-digit EV growth for the next four years. BUY at the bottom of the rate cycle. Key analyses in this anchor report include: • Four-year projection of embedded value. • Long-term industry growth outlook – longevity market developing • SOTP valuation of Samsung Life – we think this is more accurate and our target price is top of the Street. EQUITY RESEARCH ANCHOR REPORT See Appendix A-1 for analyst certification and important disclosures. Analysts employed by non-US affiliates are not registered or qualified as research analysts with FINRA in the US. May 16, 2011 Research analysts Korea Insurance Michael Na m[email protected] +82 2 3783 2334 Young Kwon Kim y[email protected] +82 2 3783 2339 Korea life insurance
Transcript of Ugly ducklings: Double-digit EV growth, plenty of … See report end for details of Nomura’s...

Hedge your inflation risk
Ugly ducklings: Double-digit EV growth, plenty of upside trading at ex-growth multiples
Korean lifers have greatly underperformed the KOSPI since listing due to flattening of the yield curve.
But we expect the long end of the yield curve to rise slowly but surely, starting in 2H11.
Meanwhile, we expect Korean lifers to deliver double-digit EV growth for the next four years.
BUY at the bottom of the rate cycle.
Key analyses in this anchor report include:
• Four-year projection of embedded value.
• Long-term industry growth outlook – longevity market developing
• SOTP valuation of Samsung Life – we think this is more accurate and our target price is top of the Street.
EQUITY RESEARCH
AN
CH
OR
RE
PO
RT
See Appendix A-1 for analyst certification and important disclosures. Analysts employed by non-US affiliates are not registered or qualified as research analysts with FINRA in the US.
May 16, 2011
Research analysts
Korea Insurance
Michael Na [email protected] +82 2 3783 2334
Young Kwon Kim [email protected] +82 2 3783 2339
Korea life insurance

Rating: See report end for details of Nomura’s rating system.
Korea Life Insurance
Insurance
EQUITY RESEARCH
Hedge your inflation risk
Ugly ducklings: Double-digit EV growth, plus plenty of potential upside at ex-growth multiples
May 16, 2011
Action: Initiating with BUY We initiate coverage of Korean lifers, Samsung Life, Korea Life and Tong Yang Life with BUY calls and PTs of KRW150,000, KRW9,400 and KRW21,000, respectively. Korean lifers have underperformed the KOSPI since their IPOs due to the flattening yield curve. A flatter yield curve could continue to put pressure on the sector in the near term, but we would recommend accumulating on any weakness as we expect the long end of the yield curve to pick up slowly but surely from 2H11F.
Catalysts: Interest rate cycle to turn Our economist expects long-dated bond yields to rise from 2H11F at a measured pace on continued BOK rate hikes. We also look for rising inflation expectations, ECB tightening and the close of QE2 to lift pressure on the long end of the yield curve. The benefit of rising interest rates is clear for Korean lifers, which have significant exposure to fixed-rate liabilities (60% for Samsung Life, 70% for Korea Life and 56% for Tong Yang Life).
Korea can deliver double-digit EV growth We expect Samsung Life (ex-affiliate stakes), Korea Life and Tong Yang Life to deliver average EV growth of 16%, 12% and 15% over the next four years, driven by strong growth in value of in-force (VIF) business and improvement in the profitability of in-force business.
Priced ex-growth We believe the Korean lifers are priced ex-growth, despite having strong EV growth profiles. Samsung Life (ex-affiliate stakes), Korea Life and Tong Yang Life are trading at 0.8x, 0.8x and 0.7x FY11F P/EV, respectively.
Most upside for Samsung Life and Tong Yang Life, in our view We like Samsung Life for its strong EV growth and given our bullish stance on Samsung Electronics and Samsung Card. We also like Tong Yang Life, as we see a cheap entry point considering its solid growth profile and the likelihood that it will be the first of the lifers to be free of negative spread legacy issues; thus, it is more than just a rate cycle play.
Upside potential for Korea Life from faster-than-expected rate hikes We expect the least upside for Korea Life (26%, vs. 53% for Samsung and 62% for Tong Yang) due to its slower EV growth, and it will likely take time to rebuild a profitable in-force book. But in a hyper inflation scenario, it would be good to own, given it is the most exposed to fixed-rate liabilities.
Fig. 1: Korea life insurance coverage summary
Note: As of 11 May 2011
Anchor themes
Korean lifers, in our view, can del ver double-digit EV growth. While they trade like ex-growth companies due to a flatter yield curve, we believe the long-end of the yield curve will start to rise in 2H11F.
Nomura vs consensus
Our PTs for SLI and TYL are 11% and 27%, respectively higher than consensus, the highest on the Street. Our FY11F net profit estimate for KLI is 16% lower than consensus.
Research analysts
Korea Insurance
Michael Na - NFIK [email protected] +82 2 3783 2334
Young Kwon Kim - NFIK [email protected] +82 2 3783 2339
Stock Rating Price (W) Target Price (W)
Samsung Lif e [032830 KS] BUY 98,000 150,000
Korea Lif e [088350 KS] BUY 7,460 9,400
Tongy ang Lif e [082640 KS] BUY 12,950 21,000
See Appendix A-1 for analyst certification and important disclosures. Analysts employed by non US affiliates are not registered or qualified as research analysts with FINRA in the US.
Nomura | AEJ Korea Life Insurance May 16, 2011
2
Contents
4 Initiating coverage with BUY
4 Priced ex-growth
4 Long end likely to pick up
5 Korea can deliver double-digit EV growth, in our view
5 Samsung Life outpacing peers
5 Long-term positive industry outlook
6 Addressing concerns on PF loans
7 Risk factors
8 Valuation
8 Samsung Life: PT of W150,000 implies 53% potential upside
10 Korea Life: PT of W9,400 implies 26% potential upside
11 Tong Yang Life: PT of W21,000 implies 62% potential upside
12 Valuation would be higher using appraisal valuation method
14 Valuation sensitivity
15 Changes in PT assuming a 50bp increase in NIER
17 Valuation comps
18 Buying at the bottom of a rate cycle
18 Flatter yield curve putting pressure on insurers
19 Long-end should be lifted
21 Benefits from rising rates
23 Long-term positive industry outlook
23 Now entering the longevity market
24 Korean retirees not prepared for longevity risk

Nomura | AEJ Korea Life Insurance May 16, 2011
3
26 Plenty of room for growth
29 Wealth accumulation products to drive growth
32 Corporate pension market to grow rapidly
35 Embedded profitability to improve
35 Loading margin to improve
36 Spread on savings premium to improve gradually
39 Risk margin to stabilise
40 Second tiers gaining market share
40 The Big Three losing market share
41 Second tiers gaining market share
41 Tong Yang benefiting from financial crisis
43 Appendix 1: Calculating EV
46 Appendix 2: Life insurer M&A landscape
47 Samsung Life
81 Korea Life
102 Tong Yang Life Insurance
128 Appendix A-1

Nomura | AEJ Korea Life Insurance May 16, 2011
4
Initiating coverage with BUY We initiate coverage of Korean life insurers with BUY ratings and target prices of W150,000 for Samsung Life (53% potential upside), W9,400 for Korea Life (26% potential upside), and W21,000 (62% potential upside) for Tong Yang Life.
Priced ex-growth
Korean lifers have significantly underperformed Korean life insurers have significantly underperformed the KOSPI since their IPOs (Samsung Life by 45%, Korea Life 46% and Tong Yang Life 56%).
Korea can deliver double-digit EV growth We expect the Korean lifers to deliver double-digit EV growth over the next four years. However, despite the prospects of strong EV growth, we believe the Korean lifers are priced ex-growth. In our view, the depressed valuations are attributable to a flattening yield curve.
Long end of the yield curve sinking despite BOK rate hikes Despite a 100bp rate hike by the central bank, Bank of Korea (BOK), since July 2010, the three-year treasury yield has dropped by 22bp to 3.68%. During the same period, the five-year treasury yield has fallen by 51bp to 4.1%.
Lifers extremely sensitive to interest rates Korean lifers' valuation depends heavily on interest rates, given their significant exposure to fixed-rate policies. The reserve for fixed-rate policies as a proportion of the total interest-bearing reserve is 60% for Samsung Life, 70% for Korea Life and 56% for Tong Yang Life. Of note, a 50bp increase in our investment yield assumption boosts the EV by 8% for Samsung Life, 14% for Korea Life and 9% for Tong Yang Life.
Long end likely to pick up
Rate hike campaign to continue Nomura Korea economist Mr Young Sun Kwon expects two more rate hikes in May and July, and another two in 1H12F, which would lift the terminal policy rate of the current cycle to 4.0% by 2Q12F. Meanwhile, he expects real policy rates to remain negative, doing little to limit inflationary pressure unless it is combined with won appreciation.
Bond market will eventually react to growing concerns on inflation Mr Kwon forecasts CPI inflation will rise above 4% in 2011F, exceeding the BOK's target band. Interest rate hikes coupled with a stronger local currency and price controls should partly offset cost-push inflation pressures from higher oil prices, but rising nominal wages and housing rents are also fueling inflation. Mr Kwon forecasts CPI inflation will rise from 2.9% in 2010 to 4.4% in 2011F, before easing to 3.6% in 2012F. Thus, we think the long end of the bond market will eventually react to growing concerns on inflation.
Foreign capital inflow to slow Whether hunting for better yields or anticipating Korean won appreciation, the inflow of foreign capital has been adding pressure on the long end since 2H09. However, with the European Central Bank (ECB) turning hawkish and the US Federal Reserve's QE2 programme winding down, we expect the foreign capital inflow to slow and possibly even turn into an outflow going forward. We think that the long end of the yield curve could rise on interest rate hikes in developed markets, as we had seen in 4Q10. In addition, recent won appreciation could hinder foreign capital inflow lured in by market anticipation of a further rise in the Korean won, which would further ease pressure on the long end.
Long end to rise slowly Our Korea economist forecasts the five-year treasury yield to start to pick up in 3Q11F and reach 4.5% by end-1H12F (from the current 4.1%), and the three-year treasury yield to edge up to 4.2% by end-1H12F (from the current 3.6%).

Nomura | AEJ Korea Life Insurance May 16, 2011
5
Korea can deliver double-digit EV growth, in our view
Starting from a low base Up until 1998, government regulations required life insurers to pay 9% on non-participating policies and 7.5% on participating policies. The Korean government lowered the crediting rate by 100bp in 1999 and fully deregulated in 2000. Meanwhile, the Korean bond market has experienced a secular bull market over the past two decades. In 1995, the average rate on the three-year treasury was 13%, compared with the current rate of 3.6%. Consequently, Korean lifers are stuck with huge negative spread books that make their value of in-force (VIF) business extremely small relative to their business volume.
Fast rebuilding in-force book The VIF business only recently turned positive for most of the Korean life insurers. Hence, the value of new business (VNB) makes up a significant proportion of the VIF book. The VNB as a proportion of the VIF was 29% for Samsung Life, 52% for Korea Life and 29% for Tong Yang Life as of March 2011.
Plenty of new business We note that the three-year average 25th-month lapse ratio for Korean lifers stands at 39%. This means that nearly four out of 10 contracts are no longer in-force after two years. Although a higher lapse ratio has a negative impact on the VIF, it would have a positive impact on new business volumes. Currently, the reported VIFs by Korean lifers already reflect such high lapse ratios. That said, we see little downside to new business volumes for the Korean lifers.
Samsung Life outpacing peers
Samsung Life: average EV growth of 16% for next four years We expect Samsung Life to deliver RoEV of 16.7% and 16.1% for FY11F and FY12F, respectively, driven by strong growth in the VIF business and the unwinding of profitable in-force book. We forecast 25% and 22% growth in VIF for FY11F and FY12F, respectively. Growth contributions from VNB will likely be significant as it makes up 30% of VIF. We also expect solid VNB growth as the company starts its hiring cycle and ventures into non-traditional channels.
Korea Life: average EV growth of 12% for next four years We expect Korea Life to deliver RoEV of 12.6% for FY11F and FY12F, driven by strong growth in VIF business. We forecast 49% and 33% growth in VIF for FY11F and FY12F, respectively. The growth contribution from VNB is likely to be significant, as it made up 52% of VIF as of March 2011. However, our EV growth forecasts for Korea Life are slower than for its peers, to reflect the company’s lack of profitable in-force book and statutory earnings will likely be depressed in the near term.
Tong Yang Life: average EV growth of 15% for next four years We also expect Tong Yang Life to deliver strong EV growth. We forecast RoEV of 15.6% and 14.4% for FY11F and FY12F, respectively, driven by new business growth and the unwinding of its profitable in-force book. We expect VNB growth of 5% for each of FY11F and FY12F. Tong Yang looks set to deliver solid VNB growth given its relatively small size, increasing market share and improving profitability on the back of increasing operating leverage.
Long-term positive industry outlook
Insurance density is relatively low The Korean life insurance sector may seem mature based on insurance penetration levels (premium/GDP), which rank Korea the tenth most penetrated life insurance market globally. However, we note that based on insurance density (premium per capita), Korea ranks 24th after Austria.
Demographic changes to have positive impact We expect strong growth in demand for products that manage longevity risk (eg, income annuities and long-term care insurance) as the first 8mn baby boomers (16% of total

Nomura | AEJ Korea Life Insurance May 16, 2011
6
population, born in 1955–1964) start to retire this year. In our opinion, the boomers will seek sources of lifetime income and long-term care insurance given limited pension and healthcare support from the government and corporations. We also expect the second group of baby boomers (14% of total population, born in 1968–1975) to be a continued source of demand for death insurance and wealth accumulation products.
Separate account business to drive growth We believe separate accounts, which include investment-linked insurance and corporate pension, will remain the main growth driver for the Korean life insurers. The life insurance industry is uniquely positioned as the only sector that can provide protection against longevity risk. Life insurers can provide guaranteed streams of income with potential for upside with investment-linked insurance to retirees. Growth in the corporate pension market has been somewhat disappointing, but we expect to see meaningful growth starting this year, given tax benefits on retirement insurance.
General account profitability normalisation to continue The spread on savings premiums should improve as high-yield guarantee policies continue to expire and new low-yield floating-rate policies dilute the in-force book.
Separate account growth to improve capital efficiency ROE should improve as we expect separate account premium growth to outpace general account premium growth given that separate accounts require less capital.
Addressing concerns on PF loans
Court receivership / workout of construction companies Earlier this year, we witnessed the court receivership / workout cases of several construction companies ranked in the Top 100 by building capacity. The names include World Construction, Jin Heung Corp, LIG E&C, Dongyang E&C and Sambu Construction.
Restructuring of construction sector winding down However, exposure for the insurance sector remains limited with a smaller project financing (PF) loan balance of KRW4.9tn, which translates to only 7% of the total KRW67tn in PF loans remaining in the system. In addition, almost 40 constructors previously ranked in the Top 100 have entered court receivership / workout programmes. That said, the possibility of more firms following suit remains low, in our view.
Fig. 2: Constructors ranked in Top 50 that have entered workout / court receivership
Source: Edaily, MLTM, Nomura research
Limited downside risk Going forward, we expect default from the construction sector to be largely mitigated, given: 1) continuing signs of recovery in the domestic housing market; and 2) high likelihood for major shareholders to make capital injections to free up liquidity. According to local press (Korea Economic Daily, 3 May, 2011), Doosan Group announced a capital injection of KRW500bn to its affiliate Doosan E&C. Hyosung, STX Group and Daelim Industrial have followed suit with similar capital injections to free up liquidity for affiliates in the construction sector.
Rank Construction Firm Rank Construction Firm
12 Kumho Industrial 38 Namkw ang Corp
17 Kyeongnam Corp 39 Hanil Construction
22 Halla E&C 40 Jinheung Corp.
25 Poonglim Industrial 47 Samho
26 Byucksan E&C 46 Kumkw ang Corp
31 Shindongah Construction 44 Dongyang E&C
35 Namyang E&C

Nomura | AEJ Korea Life Insurance May 16, 2011
7
Risk factors
Asset allocation Shinsegae and CJ Group own a combined 16.6% of Samsung Life. KDIC and Daewoo International own a combined 24.8% of Korea Life. Given that all the aforementioned parties have expressed interest to off-load their stakes and the lock-up period is over, we see potential risk from an asset allocation perspective.
IFRS phase II implementation Although implementation looks to be a few years away, the liability adequacy test required by IFRS phase II could have a material impact on Korean life insurers. If the test identifies that the insurance liability is inadequate, the entire deficiency would be recognised in the P&L immediately. Insurers may have to reserve for "negative spread books", which would significantly lower book values and capital adequacy ratios. Lifers may have to raise additional capital if the liability adequacy test uses risk-free rates.
Solvency II implementation Given that Korea only recently implemented the Risk Based Capital (RBC) evaluation system, we think that Solvency II implementation will be many years away. However, to prepare insurers for Solvency II, the regulator could tighten the Korean RBC system, which is currently far less strict than the international RBC system.

Nomura | AEJ Korea Life Insurance May 16, 2011
8
Valuation We believe Korean lifers are priced like ex-growth stocks, despite offering prospects of double-digit EV growth for the next three years.
Samsung Life: PT of W150,000 implies 53% potential upside
Value of affiliate stakes is one of the key share price drivers In our view, Samsung Life share price is driven by three key factors: 1) EV growth, 2) market rates, and 3) value of affiliate stakes. The first two factors should be the same for all life insurers. However, given that affiliate stakes amounts to half of its book value, we cannot treat it like other equity investments, especially when one single stock (Samsung Electronics) represents 68% of the total affiliate stakes.
Yes, Samsung Electronics' share price performance affects Samsung Life Samsung Life outperformed Korea Life by 8.2% when Samsung Electronics outperformed the KOSPI by 28% from 3 November 2010 to 28 January 2011. However, when the outperformance of Samsung Electronics halted, Samsung Life moved in tandem with Korea Life. This means that we have to take a view on Samsung Electronics when analyzing Samsung Life.
Valuation attractive, trading at 0.8x forward P/EV We subtract the value of affiliate stakes in order to obtain an appropriate EV multiple. Based on our analysis, Samsung Life's insurance business is currently trading at 0.8x forward P/EV. The implied multiple appears to be attractive given that we expect average EV growth of 16% a year through FY14F.
Insurance business: W100,000 per share We value Samsung Life's insurance business on an embedded-value basis, applying a P/EV multiple of 1.5x forward EV. We have assumed a sustainable RoEV of 15%, a COE of 11% and a growth rate of 3%. Of note, we expect EV growth of 17.5% and 16.4% for FY11F and FY12F, respectively. We have assumed lower net investment earnings rate (NIER) for the purpose of our EV forecast. Samsung Life uses NIER of 5.2% for its FY10 EV calculation. In comparison, we assume 5.0% (20bps lower than Samsung Life's assumption). In addition, we used risk discount rate of 11% (50bps higher than Samsung Life’s assumption of 10.5%).
Fig. 3: Samsung Life: EV projection and PT Sustainable RoEV of 15%-plus through FY14F
Source: Company data, Nomura estimates
(Wbn) FY09 FY10 FY11F FY12F FY13F FY14FAdjusted net worth (ANW) 13,685 16,284 17,136 18,085 19,154 20,529 Affiliate stakes (A) 5,084 8,242 8,242 8,242 8,242 8,242 Insurance business book (ANW-A) 8,601 8,042 8,894 9,843 10,912 12,287 Value of in-force business (VIF) 2,954 4,141 5,058 6,042 7,042 7,997 Embedded value (EV) 11,555 12,183 13,952 15,885 17,954 20,284 Growth of EV (RoEV) 8.9% 17.5% 16.4% 15.5% 15.2%Current mkt cap 19,620 19,620 19,620 19,620 19,620 19,620 Mkt Cap - A 14,536 11,378 11,378 11,378 11,378 11,378 P/EV 1.26 0.93 0.82 0.72 0.63 0.56 VNB 1,070 972 1,015 1,084 1,138 1,188 NBM 2.79 (0.83) (2.54) (4.16) (5.78) (7.50)
Target multiple 1.5 Target mkt cap for insurance business 20,000 TP for insurance business 100,000Implied NBM 6.0

Nomura | AEJ Korea Life Insurance May 16, 2011
9
Holding company: W50,000 per share As shown below, Samsung Life's affiliate stakes amount to W14.6tr as of 31 March. Among its holdings, Samsung Electronics makes up 68% of the total value of the affiliate stakes. The company books valuation gains from affiliate stakes as other comprehensive income net of tax and policyholder proportion (currently at 32.1%). We have applied our PT (or current price for unrated stocks) to derive our target NAV.
Fig. 4: Affiliate stake valuation We see 32% upside for the value of affiliate stakes
Note: * reflects current price as of May 11, 2011
Source: Company data, Nomura research
Shareholders’ proportion rising Unrealised gains from affiliate holdings are split between shareholders and policyholders. The policyholders' proportion is the part of reserve relating participating policies to total reserve. Currently, the policyholders’ and shareholders’ proportions are 32% and 68%, respectively. We expect the shareholders’ proportion to increase by 1.0-1.4pp in a year’s time as the reserve relating to participating policies as a proportion of the total reserve declines.
Fig. 5: Shareholders’ proportion of unrealised gains on AFS Shareholders' proportion should increase by 1.0-1.4pp per annum
Source: Company data, Nomura estimates
Accounting # of Shares % holdingMar11Price
Mar11(Wbn)
TP orCurrent
price
Mar12F(Wbn)
Samsung Electronics Cost 10,622,814 7% 932,000 9,900 1,350,000 14,341
Samsung Card Equity 32,468,868 26% 55,500 1,802 67,000 2,175
Samsung F&M Cost 4,905,718 10% 242,500 1,190 223,000 * 1,094
Samsung Securities Cost 7,603,659 11% 80,600 613 83,800 * 637
Samsung C&T Cost 7,476,102 5% 71,800 537 85,000 635
Samsung Heavy Cost 7,800,000 3% 39,900 311 45,300 * 353
S1 Cost 2,030,476 5% 56,300 114 50,900 * 103
Hotel Shilla Cost 2,865,158 7% 25,550 73 27,100 * 78
Samsung Techw in Cost 289,800 1% 79,800 23 95,000 28
Samsung SDI Cost 10,155 0% 168,000 2 160,000 2
Cheil Industries Cost 6,871 0% 116,500 1 160,000 1
Samsung Futures Equity 1,025,000 41% 41 41
Samsung Asset Management Cost 1,024,000 5% 21 21
Samsung Economic Research Institute Cost 1,776,000 15% 10 10
Samsung Corning Precision Glass Cost 2,176 0% 2 2
Total Value 14,639 19,521
Net of holding company discount (27%) 10,687 14,250
Shareholders' proportion (69.6%) 7,438 9,918
Per share (Won) 38,000 50,000
39.1% 36.4% 34.5% 33.3% 32.1% 30.7%
60.9% 63.6% 65.5% 66.7% 67.9% 69.3%
Mar07 Mar08 Mar09 Mar10 Mar11 Mar12F
Policyholders' proportion Shareholders' equity

Nomura | AEJ Korea Life Insurance May 16, 2011
10
We apply a 27% holding company discount Theoretically, we think the holding company discount should be the corporate tax rate (22%). However, in reality, the holding company discount varies based on the performance of its holdings and market liquidity. The holding company discount narrows when its holdings outperform the market and vice versa. In addition, abundant market liquidity lowers the discount. Given that we are bullish on Samsung Group, the holding company discount could be lower than the tax rate. However, for the purpose of our valuation, we apply a 27% discount, which is the five-year average NAV discount for LG Corp. We select LG Corp as our benchmark as we believe it is one of the purest holding companies in Korea with most of its holdings being listed.
Fig. 6: LG Corp discount to NAV Average discount to NAV for the past five years of 27%
Source: Nomura research
Korea Life: PT of W9,400 implies 26% potential upside
Our PT is based on 1.0x P/EV We forecast EV growth of 12.6% for each of FY11F and FY12F. We believe Korea Life can sustain 11.5%-plus RoEV for the next four years. Our PT of KRW9,400 is based on 1.0x forward P/EV. We assume a sustainable medium-term RoEV of 11.5%, a COE of 11.5% and a growth rate of 3%. Of note, we assume a lower net investment earnings rate (NIER) of 5.0% for the purpose of our EV forecast, compared with the 5.25% used by Korea Life in its FY09 EV calculation.
Priced ex-growth Korea Life is trading at 0.8x forward P/EV. We think the current valuation is attractive as we expect sustainable RoEV of 11.5% in the medium term. The current implied NBM (new business multiple) is in negative territory despite the company’s solid growth profile and potential upside from rising interest rates.
Fig. 7: Korea Life: EV projection and PT Sustainable RoEV of 11.5%-plus through FY14F
Source: Company data, Nomura research
-20%
-10%
0%
10%
20%
30%
40%
50%
2-May-06 2-May-07 2-May-08 2-May-09 2-May-10 2-May-11
NAV Discount Average St Dev +1 St Dev -1
(Wbn) FY09 FY10F FY11F FY12F FY13F FY14FAdjusted net worth (ANW) 6,100 6,601 7,055 7,569 8,112 8,737 Value of in-force business (VIF) 408 795 1,187 1,580 1,973 2,365 Embedded value (EV) 6,508 7,396 8,242 9,150 10,085 11,102 Growth of EV (RoEV) 15.0% 12.6% 12.6% 11.6% 11.8%Current mkt cap 6,418 6,418 6,418 6,418 6,418 6,418 P/EV 0.99 0.87 0.78 0.70 0.64 0.58 VNB 410 411 422 430 436 439 NBM (0.22) (2.38) (4.32) (6.35) (8.41) (10.66)
Target multiple 1.0 Target mkt cap 8,242 Target price 9,400 Implied NBM -

Nomura | AEJ Korea Life Insurance May 16, 2011
11
Tong Yang Life: PT of W21,000 implies 62% potential upside
Our PT is based on 1.2x P/EV We expect Tong Yang Life (TYL) to deliver EV growth of 15.5% and 14.6% for FY11F and FY12F, respectively. We also expect TYL to sustain RoEV of 14%-plus through FY14F. Our PT of W21,000 is based on 1.2x forward P/EV. We assume a sustainable RoEV of 14.0%, a COE of 12.5% and a growth rate of 3%. We assume a higher COE than for other life insurers given Korea Life’s relatively smaller size and liquidity. Of note, we assume a lower net investment earnings rate (NIER) of 5.0% for the purpose of our EV forecast, compared with the 5.25% used by TYL in its FY09 EV calculation.
TYL looks attractive even on a PBR methodology… As more profitable new business continues to flow into in-force book, we think the return on shareholders' equity will improve and reach a sustainable level of 15% in the medium term. A PBR valuation derives a valuation of W15,000, implying 18% potential upside.
…but PBR could be misleading Given the long-tail nature of life insurance, we think current earnings and book value do not capture the value of current in-force book, especially if there is a significant difference in profitability between in-force book and new business (which is the case for Korean lifers who have been suffering from negative spread on legacy products). That said, investor should not miss out on TYL who looks attractive even on PBR.
Fig. 8: Tong Yang Life: EV projection and PT Sustainable RoEV of 14%-plus through FY14F
Source: Company data, Nomura estimates
(Wbn) FY09 FY10F FY11F FY12F FY13F FY14FAdjusted net worth (ANW) 1,019 1,127 1,260 1,400 1,559 1,750 Value of in-force business (VIF) 472 546 635 728 837 953 Embedded value (EV) 1,491 1,673 1,895 2,128 2,396 2,703 Growth of EV (RoEV) 14.4% 15.5% 14.6% 14.9% 14.8%Current mkt cap 1,334 1,334 1,334 1,334 1,334 1,334 P/EV 0.9 0.8 0.7 0.6 0.6 0.5 VNB 142 154 161 169 179 190 NBM (1.1) (2.2) (3.5) (4.7) (5.9) (7.2)
Target multiple 1.2 Target mkt cap 2,274 Target price 21,000Implied NBM 2.4

Nomura | AEJ Korea Life Insurance May 16, 2011
12
Valuation would be higher using appraisal valuation method
We calculate an even higher valuation using 10-year DCF model Using an appraisal valuation method we calculate an even higher valuation for TYL, as its VNB is the largest as a percentage of EV. In addition, we believe that NBM will increase, as we expect the company to continue to gain market share. Of note, we only reflect a 10-year projection in our NBM calculation. Typically, a 30-year DCF model is used in the region to drive NBM. However, due to the infancy of the EV valuation methodology in Korea, we do not want to pay for more than 10 years.
Samsung Life insurance business at KRW109,000 per share if using the appraisal valuation method For Samsung Life, the implied NBM is 6.0x our PT. However, if we were to use the appraisal value methodology, we could justify up to a 7.7x NBM.
Fig. 9: Samsung Life: target NBM based on appraisal valuation method
Source: Nomura estimates
Korea Life valuation at KRW12,800 if using the appraisal valuation method For Korea Life, the implied NBM is 0x at our PT. However, using the appraisal value methodology, we could justify up to a 6.9x NBM.
Fig. 10: Korea Life: target NBM based on appraisal valuation method
Source: Nomura estimates
Tong Yang Life PT at KRW30,000 if using the appraisal valuation method For TYL, the implied NBM is 2.3x our PT. However, using the appraisal value method, we could justify up to 8.0x NBM.
Fig. 11: Tong Yang Life: target NBM based on appraisal valuation method
Source: Nomura research
But we think it is more appropriate to use the P/EV methodology While there is upside potential to our PTs using the appraisal value methodology, we think it is more appropriate to use P/EV for the Korea life insurers given some variances we encountered in EV, which may not be captured in the NBM technique. In addition, we think the appraisal valuation method ignores near-term EV growth profile changes that companies may face such as Korea Life who may take a while to rebuild profitable VIF.
(Wbn) FY11F FY12F FY13F FY14F FY15F FY16F FY17F FY18F FY19F FY20FAnnualized premium equivalent (APE) 3,773 4,075 4,319 4,535 4,716 4,905 5,052 5,153 5,256 5,362 New business margin 26.9% 26.6% 26.4% 26.2% 26.1% 25.9% 25.8% 25.7% 25.6% 25.4%Value of new business (VNB) 1,015 1,084 1,138 1,188 1,230 1,272 1,304 1,323 1,343 1,363 Discount factor 1.0 1.1 1.2 1.4 1.5 1.7 1.9 2.1 2.3 2.6 PV of VNB 1,015 976 924 869 810 755 697 637 583 533 Sum of PV 7,799 Implied multiple 7.7
(Wbn) FY11F FY12F FY13F FY14F FY15F FY16F FY17F FY18F FY19F FY20FAnnualized premium equivalent (APE) 2,271 2,351 2,421 2,482 2,531 2,582 2,634 2,686 2,740 2,795 New business margin 18.6% 18.3% 18.0% 17.7% 17.5% 17.4% 17.4% 17.3% 17.3% 17.3%Value of new business (VNB) 422 430 436 439 443 450 458 466 475 484 Discount factor 1.0 1.1 1.2 1.4 1.5 1.7 1.9 2.1 2.3 2.6 PV of VNB 422 388 354 321 292 267 245 224 206 189 Sum of PV 2,908 Implied multiple 6.9
(Wbn) FY11F FY12F FY13F FY14F FY15F FY16F FY17F FY18F FY19F FY20FAnnualized premium equivalent (APE) 992 1,062 1,136 1,210 1,282 1,353 1,421 1,477 1,536 1,598 New business margin 16.2% 15.9% 15.8% 15.7% 15.7% 15.6% 15.5% 15.5% 15.5% 15.5%Value of new business (VNB) 161 169 179 190 201 211 221 229 238 248 Discount factor 1.0 1.1 1.2 1.4 1.5 1.7 1.9 2.1 2.3 2.6 PV of VNB 161 152 145 139 132 125 118 110 103 97 Sum of PV 1,283 Implied multiple 8.0

Nomura | AEJ Korea Life Insurance May 16, 2011
13
Appraisal value methodology may work in good times Samsung F&M's NBM expanded to 18.2x at the peak of the market in 2007. NBM of 18.2x could be explained only if we were to use the appraisal value methodology with a 30-year DCF model. We would derive NBM of 18.5x if we assume a sustainable VNB growth of 7% and a risk discount rate of 11% for next 30 years. That said, we think that our implied NBM of 6.0x at our PT based on P/EV valuation methodology is not overstretched.
Fig. 12: Samsung F&M P/EV trend Five-year average P/EV of 1.6x
Source: Nomura research
Fig. 13: Samsung F&M NBM trend Five-year average NBM of 8.3x
Source: Nomura research
Ex-affiliate multiples much higher We subtracted out the value of Samsung Electronics from both EV and market cap for Samsung F&M. Of note, Samsung F&M owns 1.2% in Samsung Electronics. Our analysis shows that Samsung F&M traded at much higher multiples excluding its Samsung Electronics stake. Currently, Samsung F&M is trading at an ex-affiliate stake trailing NBM of 5x. Again, we think our implied NBM of 6.0x is not overstretched.
Fig. 14: Samsung F&M ex-affiliate stake P/EV trend Five-year average P/EV of 2.0x
Source: Nomura research
Fig. 15: Samsung F&M ex-affiliate stake NBM trend Five-year average NBM of 9.9x
Source: Nomura research
50,000
100,000
150,000
200,000
250,000
300,000
Ap
r-06
Oct-
06
Ap
r-07
Oct-
07
Ap
r-08
Oct-
08
Ap
r-09
Oct-
09
Ap
r-10
Oct-
10
Ap
r-11
(W)
1.0x
1.2x
1.4x
1.6x1.8x2.0x
50,000
100,000
150,000
200,000
250,000
300,000
Ap
r-06
Oct-
06
Ap
r-07
Oct-
07
Ap
r-08
Oct-
08
Ap
r-09
Oct-
09
Ap
r-10
Oct-
10
Ap
r-11
(W)
2.0x
5.0x
8.0x11.0x14.0x17.0x
50,000
100,000
150,000
200,000
250,000
300,000
Ap
r-06
Oct-
06
Ap
r-07
Oct-
07
Ap
r-08
Oct-
08
Ap
r-09
Oct-
09
Ap
r-10
Oct-
10
Ap
r-11
(W)
1.3x
1.7x
2.1x2.5x2.9x3.3x
50,000
100,000
150,000
200,000
250,000
300,000
Mar-
06
Sep
-06
Mar-
07
Sep
-07
Mar-
08
Sep
-08
Mar-
09
Sep
-09
Mar-
10
Sep
-10
Mar-
11
(W)
2.0x
5.0x
8.0x
11.0x14.0x17.0x

Nomura | AEJ Korea Life Insurance May 16, 2011
14
Valuation sensitivity
Korea Life is most sensitive to interest rates Korea Life has the highest EV sensitivity to the net interest earnings rate (NIER) assumption as the company has the highest proportion of fixed-rate liabilities at 70% compared to 60% for Samsung Life and 56% for TYL. We estimate a 50bp increase in the NIER assumption would increase Korea Life’s EV by 13.8%, Samsung Life’s by 13.5% and TYL’s by 9.5%.
A 50bp increase in NIER assumption to increase Samsung Life’s EV by 12.8% Samsung Life used an NIER assumption of 5.2% for its FY10 EV calculation. We believe Samsung’s assumption is aggressive given current market rates. For the purpose of our analysis, we adjust the NIER to 5.0%. Note that Samsung Life’s EV is also sensitive to changes in the claims ratio.
Fig. 16: Samsung Life: EV sensitivity (KRW)
Source: Company data, Nomura research
Fig. 17: Samsung Life: EV sensitivity (%)
Source: Company data, Nomura research
A 50bp increase in NIER assumption to increase Korea Life’s EV by 13.8% Korea Life used an NIER assumption of 5.25% for its FY09 EV calculation. We believe Korea Life’s assumption is aggressive given the current market rates. For the purpose of our analysis, we adjust the NIER to 5.0%. We note that Korea Life is less sensitive to changes in the claims ratio, unlike Samsung Life.
Fig. 18: Korea Life’s EV sensitivity (KRW)
Source: Company data, Nomura research
Fig. 19: Korea Life’s EV sensitivity (%)
Source: Company data, Nomura research
(2,000)
(1,500)
(1,000)
(500)
-
500
1,000
1,500
2,000
Dis
co
unt r
ate
±1%
NIE
R ±
50bp
s
RB
C ±
50p
pt
Lap
se ±
10%
Cla
ims ±
10%
Main
ten
ance
±10%
AF
S a
ffilia
te s
takes ±
10%
(Wbn)
12.8% 14.4%
-20%
-15%
-10%
-5%
0%
5%
10%
15%
20%
Dis
co
unt r
ate
±1%
NIE
R ±
50bp
s
RB
C ±
50p
pt
Lap
se ±
10%
Cla
ims ±
10%
Main
ten
ance
±10%
AF
S a
ffilia
te s
takes ±
10%
1,028
(1,500)
(1,000)
(500)
0
500
1,000
1,500
Dis
co
unt r
ate
±1%
NIE
R ±
50bp
s
Cla
ims R
ate
±10p
pt
Lap
se R
ate
±10p
pt
(Wbn)
13.8%11%
-20%
-15%
-10%
-5%
0%
5%
10%
15%
20%
Dis
co
unt r
ate
±1%
NIE
R ±
50bp
s
Cla
ims R
ate
±10p
pt
Lap
se R
ate
±10p
pt
Nomura | AEJ Korea Life Insurance May 16, 2011
15
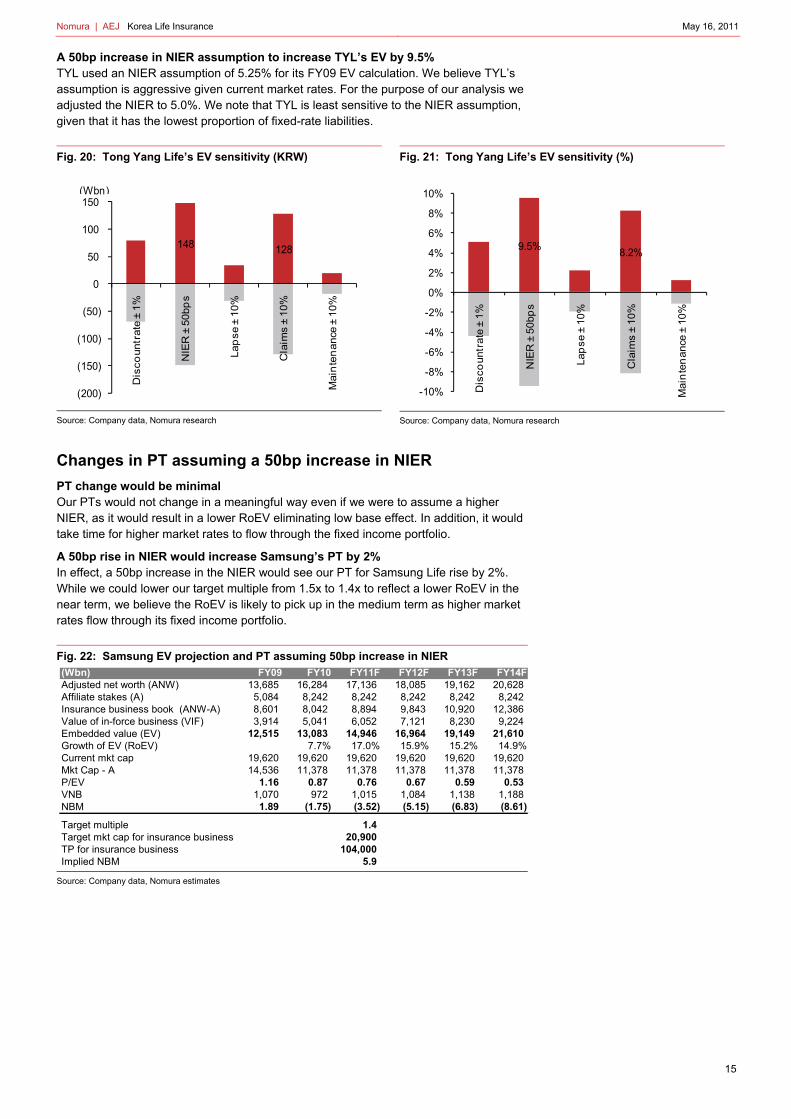
A 50bp increase in NIER assumption to increase TYL’s EV by 9.5% TYL used an NIER assumption of 5.25% for its FY09 EV calculation. We believe TYL’s assumption is aggressive given current market rates. For the purpose of our analysis we adjusted the NIER to 5.0%. We note that TYL is least sensitive to the NIER assumption, given that it has the lowest proportion of fixed-rate liabilities.
Fig. 20: Tong Yang Life’s EV sensitivity (KRW)
Source: Company data, Nomura research
Fig. 21: Tong Yang Life’s EV sensitivity (%)
Source: Company data, Nomura research
Changes in PT assuming a 50bp increase in NIER
PT change would be minimal Our PTs would not change in a meaningful way even if we were to assume a higher NIER, as it would result in a lower RoEV eliminating low base effect. In addition, it would take time for higher market rates to flow through the fixed income portfolio.
A 50bp rise in NIER would increase Samsung’s PT by 2% In effect, a 50bp increase in the NIER would see our PT for Samsung Life rise by 2%. While we could lower our target multiple from 1.5x to 1.4x to reflect a lower RoEV in the near term, we believe the RoEV is likely to pick up in the medium term as higher market rates flow through its fixed income portfolio.
Fig. 22: Samsung EV projection and PT assuming 50bp increase in NIER
Source: Company data, Nomura estimates
148 128
(200)
(150)
(100)
(50)
0
50
100
150
Dis
co
unt r
ate
±1%
NIE
R ±
50bp
s
Lap
se ±
10%
Cla
ims ±
10%
Main
ten
ance
±10%
(Wbn)
9.5%8.2%
-10%
-8%
-6%
-4%
-2%
0%
2%
4%
6%
8%
10%
Dis
co
unt r
ate
±1%
NIE
R ±
50bp
s
Lap
se ±
10%
Cla
ims ±
10%
Main
ten
ance
±10%
(Wbn) FY09 FY10 FY11F FY12F FY13F FY14FAdjusted net worth (ANW) 13,685 16,284 17,136 18,085 19,162 20,628 Affiliate stakes (A) 5,084 8,242 8,242 8,242 8,242 8,242 Insurance business book (ANW-A) 8,601 8,042 8,894 9,843 10,920 12,386 Value of in-force business (VIF) 3,914 5,041 6,052 7,121 8,230 9,224 Embedded value (EV) 12,515 13,083 14,946 16,964 19,149 21,610 Growth of EV (RoEV) 7.7% 17.0% 15.9% 15.2% 14.9%Current mkt cap 19,620 19,620 19,620 19,620 19,620 19,620 Mkt Cap - A 14,536 11,378 11,378 11,378 11,378 11,378 P/EV 1.16 0.87 0.76 0.67 0.59 0.53 VNB 1,070 972 1,015 1,084 1,138 1,188 NBM 1.89 (1.75) (3.52) (5.15) (6.83) (8.61)
Target multiple 1.4 Target mkt cap for insurance business 20,900 TP for insurance business 104,000Implied NBM 5.9

Nomura | AEJ Korea Life Insurance May 16, 2011
16
A 50bp rise in NIER would increase Korea Life’s PT by 3% In effect, a 50bp increase in the NIER would see our PT for Korea Life rise by 3%. While we could lower our target multiple from 1.0x to 0.9x to reflect a lower RoEV in near term, we think the RoEV is likely to pick up in the medium term as higher market rates flow through its fixed income portfolio. Eventually, we may be able to apply a higher target multiple.
Fig. 23: Korea Life’s EV projection and PT assuming 50bp increase in NIER
Source: Company data, Nomura estimates
TYL’s PT unchanged despite higher NEIR assumption For TYL, our target price would remain largely unchanged even if we were to assume a higher NIER assumption. While we could lower our target multiple from 1.2x to 1.1x to reflect a lower RoEV in the near term, we think the RoEV is likely to pick up in the medium term as higher market rates flow through its fixed income portfolio. Eventually, we should be able to apply higher target multiple.
Fig. 24: TYL’s EV projection and PT assuming 50bp increase in NIER
Source: Company data, Nomura estimates
(Wbn) FY09 FY10F FY11F FY12F FY13F FY14FAdjusted net worth (ANW) 6,100 6,651 7,127 7,679 8,324 8,992 Value of in-force business (VIF) 1,436 1,823 2,222 2,630 3,052 3,487 Embedded value (EV) 7,536 8,474 9,348 10,309 11,375 12,478 Growth of EV (RoEV) 13.6% 11.3% 11.2% 11.6% 10.8%Current mkt cap 6,418 6,418 6,418 6,418 6,418 6,418 P/EV 0.9 0.8 0.7 0.6 0.6 0.5 VNB 410 423 441 458 477 498 NBM (2.7) (4.9) (6.6) (8.5) (10.4) (12.2)
Target multiple 0.9 Target mkt cap 8,413 Target price 9,700 Implied NBM (2.1)
(Wbn) FY09 FY10F FY11F FY12F FY13F FY14FAdjusted net worth (ANW) 1,019 1,127 1,261 1,398 1,571 1,787 Value of in-force business (VIF) 546 617 703 793 890 993 Embedded value (EV) 1,565 1,744 1,964 2,191 2,461 2,781 Growth of EV (RoEV) 13.5% 14.8% 13.7% 14.5% 15.0%Current mkt cap 1,334 1,334 1,334 1,334 1,334 1,334 P/EV 0.9 0.8 0.7 0.6 0.5 0.5 VNB 142 154 161 169 179 190 NBM (1.6) (2.7) (3.9) (5.1) (6.3) (7.6)
Target multiple 1.1 Target mkt cap for insurance business 2,161 Target price 21,000 Implied NBM 1.2

Nomura | AEJ Korea Life Insurance May 16, 2011
17
Valuation comps
Fig. 25: Insurance Valuation Comps
Note: *Represents Bloomberg estimates, pricing as of 11 May 2011
Source: Bloomberg, Nomura estimates
SamsungLife
KoreaLife
TongYang Life
SamsungF&M*
HyundaiF&M*
DongbuInsurance*
Ping AnLife
ChinaLife
Bloomgberg Ticker 032830 KS 088350 KS 082640 KS 000810 KS 001450 KS 005830 KS 2318 HK 2628 HKRecommendation BUY BUY BUY n.a n.a n.a Neutral BUYLocal Currency KRW KRW KRW KRW KRW KRW CNY CNYShare price (W) 98,000 7,460 12,950 220500 27450 48800 81.4 26.5Target price (W) 150,000 9,400 21,000 n.a n.a n.a 90.0 40.0Implied upside (downside) (%) 53% 26% 62% n.a n.a n.a 11% 51%Shares outstanding (mn) 200 869 108 47.375 89.4 70.8 7,640 28,260Market Cap. (bn) 19,600 6,479 1,393 10,446 2,454 3,455 622 749Market Cap. (US$mn) 18,095 5,982 1,286 9,644 2,266 3,190 7,640 28,260
Current MultiplesP/BV (x) FY09A 1.6 1.1 1.4 2.7 2.9 4.1 8.3 3.5
FY10A 1.3 1.1 1.2 2.1 2.3 2.9 6.1 3.6FY11E 1.2 1.0 1.1 1.4 1.4 1.5 4.9 2.9FY12E 1.1 0.9 1.0 1.3 1.2 1.3 3.9 2.4
P/E (x) FY09A 21.6 15.5 13.3 17.4 21.3 14.9 42.8 22.8FY10A 10.1 13.5 8.6 19.9 13.3 15.3 34.5 22.3FY11E 16.7 12.1 8.5 12.9 8.4 8.8 21.9 16.9FY12E 15.0 10.8 7.5 11.1 7.0 7.3 15.6 13.9
P/EV (x) FY09A 1.2 1.0 0.9 n.a. n.a. n.a. 3.8 2.6FY10A 1.0 0.9 0.8 n.a. n.a. n.a. 3.3 2.4FY11E 0.9 0.8 0.7 n.a. n.a. n.a. 2.6 2.0FY12E 0.8 0.7 0.7 n.a. n.a. n.a. 2.0 1.6
P/EV (ex. aff ilates) (x) FY09A 1.3 n.a. n.a. n.a. n.a. n.a. n.a. n.a.FY10A 0.9 n.a. n.a. n.a. n.a. n.a. n.a. n.a.FY11E 0.8 n.a. n.a. n.a. n.a. n.a. n.a. n.a.FY12E 0.7 n.a. n.a. n.a. n.a. n.a. n.a. n.a.
ProfitabilityROE (%) FY09A 9.3 9.0 12.6 15.5 13.8 27.6 19.0 15.5
FY10A 14.1 8.1 15.0 10.6 17.3 19.3 18.0 16.0FY11E 7.4 8.4 13.7 12.2 19.4 19.2 25.0 18.6FY12E 7.9 8.8 13.9 13.0 20.9 20.0 28.0 18.8
ROEV (%) FY09A 34.6 30.1 32.1 n.a. n.a. n.a. 9.0 11.5FY10A 25.2 15.0 14.4 n.a. n.a. n.a. 9.5 10.6FY11E 10.4 12.6 15.5 n.a. n.a. n.a. 11.8 11.7FY12E 10.3 12.6 14.6 n.a. n.a. n.a. 13.0 11.8
ROEV (ex. aff iliates) (%) FY09A 13.1 n.a. n.a. n.a. n.a. n.a. n.a. n.a.FY10A 8.9 n.a. n.a. n.a. n.a. n.a. n.a. n.a.FY11E 17.5 n.a. n.a. n.a. n.a. n.a. n.a. n.a.FY12E 16.4 n.a. n.a. n.a. n.a. n.a. n.a. n.a.
Per Share DataEPS FY09A 4,530 482 977 12,638 1,288 3,270 1.9 1.2
FY10A 9,669 554 1,502 11,071 2,063 3,197 2.4 1.2FY11E 5,859 616 1,529 17,049 3,265 5,523 3.7 1.6FY12E 6,547 692 1,731 19,838 3,929 6,652 5.2 1.9
BVPS FY09A 60,664 6,540 9,494 81,540 9,343 11,867 9.8 7.5FY10A 76,950 7,098 10,495 104,281 11,923 16,574 13.3 7.4FY11E 81,009 7,620 11,767 154,100 19,027 32,341 16.5 9.2FY12E 85,755 8,162 13,099 167,986 22,202 36,994 21.0 11.0
EVPS FY09A 83,194 7,493 13,864 n.a. n.a. n.a. 21.1 10.1FY10A 102,125 8,516 15,555 n.a. n.a. n.a. 25.0 11.2FY11E 110,968 9,489 17,618 n.a. n.a. n.a. 31.6 13.4FY12E 120,635 10,535 19,782 n.a. n.a. n.a. 40.3 16.1

Nomura | AEJ Korea Life Insurance May 16, 2011
18
Buying at the bottom of a rate cycle We believe the BOK will continue with its rate hike campaign, taking the key policy rate to 4.0% by 2Q11F. We expect the long-end of yield curve to rise slowly along with rising policy rates. Korean lifers should benefit from rising interest rates given their large exposure to fixed-rate liabilities.
Flatter yield curve putting pressure on insurers
Long-end of the yield curve has been falling despite rate hikes by the BOK Despite hikes of 100bp by the BOK since July 2010, the three-year treasury yield fell by 22bp to 3.68%. During the same period, the five-year treasury yield fell by 15bp. The phenomenon happened in the early part of 2006, but it normalized thereafter.
Fig. 26: Interest rate trend
Source: CEIC, Nomura research
Lifers extremely sensitive to interest rates Korean lifers' valuation depends heavily on interest rates due to significant exposure to fixed-rate policies. The reserve for fixed rate policies as a proportion of total interest-bearing reserve amounts to 60% for Samsung Life, 70% for Korea Life, and 56% for Tong Yang Life. Of note, a 50bp increase in investment yield assumption would boost EV by 8% for Samsung Life, 14% for Korea Life and 9% for Tong Yang Life, according to our sensitivity analysis.
Fig. 27: Samsung Life share price vs. 3yr and 5yr treasury
Source: CEIC, Nomura research
Fig. 28: Korea Life share price vs. 3yr and 5yr treasury
Source: CEIC, Nomura research
Fig. 29: Tong Yang Life share price vs. 3yr and 5yr treasury
Source: CEIC, Nomura research
1
2
3
4
5
6
7
8
9
10
May-9
9O
ct-
99
Mar-
00
Aug
-00
Jan
-01
Jun
-01
No
v-0
1A
pr-
02
Sep
-02
Feb-0
3Jul-
03
Dec-0
3M
ay-0
4O
ct-
04
Mar-
05
Aug
-05
Jan
-06
Jun
-06
No
v-0
6A
pr-
07
Sep
-07
Feb-0
8Jul-
08
Dec-0
8M
ay-0
9O
ct-
09
Mar-
10
Aug
-10
Jan
-11
Policy Rate 3 Yr KTB 5 Yr KTB(%)
2.5
3.0
3.5
4.0
4.5
5.0
85
90
95
100
105
110
115
120
May
-10
Jul-
10
Sep
-10
No
v-10
Jan
-11
Mar
-11
SLI
3yr KTB
5yr KTB
(W'000) (%)
2.5
3.0
3.5
4.0
4.5
5.0
6778899
1010
Mar
-10
May
-10
Jul-
10
Sep
-10
No
v-10
Jan
-11
Mar
-11
KLI3yr KTB5yr KTB
(W'000) (%)
2.5
3.0
3.5
4.0
4.5
5.0
5.5
6
8
10
12
14
16
18
Oct
-09
Jan
-10
Ap
r-10
Jul-
10
Oct
-10
Jan
-11
Ap
r-11
TYL3yr KTB5yr KTB
(W'000) (%)
Nomura | AEJ Korea Life Insurance May 16, 2011
19
Long-end should be lifted
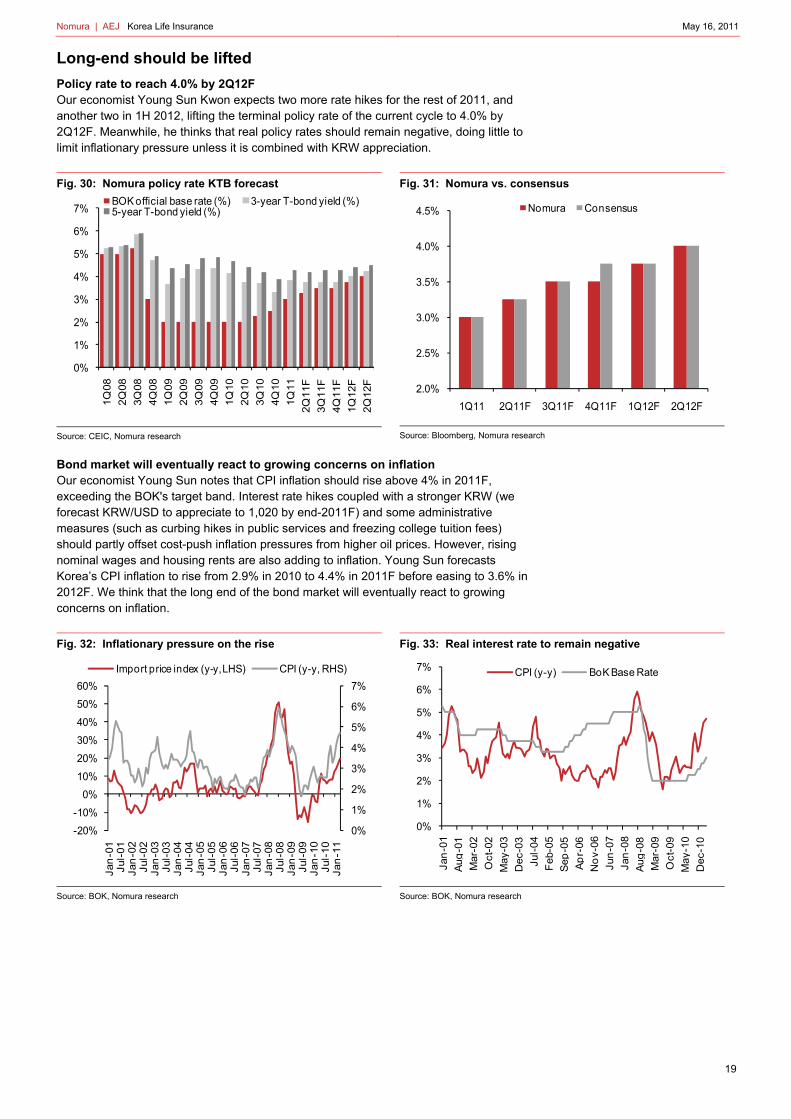
Policy rate to reach 4.0% by 2Q12F Our economist Young Sun Kwon expects two more rate hikes for the rest of 2011, and another two in 1H 2012, lifting the terminal policy rate of the current cycle to 4.0% by 2Q12F. Meanwhile, he thinks that real policy rates should remain negative, doing little to limit inflationary pressure unless it is combined with KRW appreciation.
Fig. 30: Nomura policy rate KTB forecast
Source: CEIC, Nomura research
Fig. 31: Nomura vs. consensus
Source: Bloomberg, Nomura research
Bond market will eventually react to growing concerns on inflation Our economist Young Sun notes that CPI inflation should rise above 4% in 2011F, exceeding the BOK's target band. Interest rate hikes coupled with a stronger KRW (we forecast KRW/USD to appreciate to 1,020 by end-2011F) and some administrative measures (such as curbing hikes in public services and freezing college tuition fees) should partly offset cost-push inflation pressures from higher oil prices. However, rising nominal wages and housing rents are also adding to inflation. Young Sun forecasts Korea’s CPI inflation to rise from 2.9% in 2010 to 4.4% in 2011F before easing to 3.6% in 2012F. We think that the long end of the bond market will eventually react to growing concerns on inflation.
Fig. 32: Inflationary pressure on the rise
Source: BOK, Nomura research
Fig. 33: Real interest rate to remain negative
Source: BOK, Nomura research
0%
1%
2%
3%
4%
5%
6%
7%
1Q
08
2Q
08
3Q
08
4Q
08
1Q
09
2Q
09
3Q
09
4Q
09
1Q
10
2Q
10
3Q
10
4Q
10
1Q
11
2Q
11F
3Q
11F
4Q
11F
1Q
12F
2Q
12F
BOK official base rate (%) 3-year T-bond yield (%) 5-year T-bond yield (%)
2.0%
2.5%
3.0%
3.5%
4.0%
4.5%
1Q11 2Q11F 3Q11F 4Q11F 1Q12F 2Q12F
Nomura Consensus
0%
1%
2%
3%
4%
5%
6%
7%
-20%
-10%
0%
10%
20%
30%
40%
50%
60%
Jan
-01
Jul-
01
Jan
-02
Jul-
02
Jan
-03
Jul-
03
Jan
-04
Jul-
04
Jan
-05
Jul-
05
Jan
-06
Jul-
06
Jan
-07
Jul-
07
Jan
-08
Jul-
08
Jan
-09
Jul-
09
Jan
-10
Jul-
10
Jan
-11
Import price index (y-y, LHS) CPI (y-y, RHS)
0%
1%
2%
3%
4%
5%
6%
7%
Jan
-01
Aug
-01
Mar-
02
Oct-
02
May-0
3
Dec-0
3
Jul-
04
Feb-0
5
Sep
-05
Ap
r-06
No
v-0
6
Jun
-07
Jan
-08
Aug
-08
Mar-
09
Oct-
09
May-1
0
Dec-1
0
CPI (y-y) BoK Base Rate

Nomura | AEJ Korea Life Insurance May 16, 2011
20
Foreign capital inflow putting pressure on the long-end We believe that foreign capital inflow (especially from dollar block economies) into Korea has been putting pressure on the long end of the yield curve. We think that exceptionally low rates in developed countries and expectation for KRW appreciation are the primary reasons for capital inflow into Korea.
Fig. 34: 5-year KTB vs. foreign net bond buy Foreigners appetite for KTB has been strong
Source: CEIC, Nomura research
Fig. 35: Net bond buy by origin of capital The US and China money main source of capital inflow
Source: CEIC, Nomura research
Fig. 36: KRW vs. foreign net bond buy Foreign capital inflow betting on KRW appreciation?
Source: CEIC, Nomura research
Fig. 37: Flattening of Yield curve Long-end falling despite the rise in policy rate
Source: CEIC, Nomura research
Foreign capital inflow to slow Whether hunting for better yields or expecting KRW appreciation, foreign capital inflows have been adding pressure on the long-end since 2H09. However, with the ECB turning hawkish and the Fed's QE2 programme winding down, foreign capital inflows may slow and we may even witness outflows going forward. We think that the long-end of the yield curve could be lifted with rising interest rates in developed markets, as we have seen in 4Q10. In addition, the recent strengthening of KRW could hinder foreign capital inflows (funds pouring into Korea on expectations of KRW appreciation), further lifting pressure on the long-end.
0
50
100
150
200
250
300
350
3.0
3.2
3.4
3.6
3.8
4.0
4.2
4.4
4.6
4.8
May-10 Jun-10 Jul-10 Aug-10
KTB 5yr (LHS) Net bond buy (RHS)(%) (Wtn)
(4)
(2)
0
2
4
6
8
10
12
14
Jan
-09
Mar-
09
May-0
9
Jul-
09
Sep
-09
No
v-0
9
Jan
-10
Mar-
10
May-1
0
Jul-
10
Sep
-10
No
v-1
0
Jan
-11
Mar-
11
US UK Thailand China(Wtn)
1,0501,0701,0901,1101,1301,1501,1701,1901,2101,2301,250
3
103
203
303
403
503
603
May-1
0
Jun
-10
Jul-
10
Aug
-10
Sep
-10
Oct-
10
No
v-1
0
Dec-1
0
Jan
-11
Feb-1
1
Mar-
11
Ap
r-11
Net bond buy (LHS) FX (KRW:USD)(Wtn) (W)
2.0
2.5
3.0
3.5
4.0
4.5
5.0
5.5
KTB1y MSB2y KTB3y KTB5y KTB10y KTB20y
12/1/2010 1/1/2011
2/1/2011 3/1/2011
(%)

Nomura | AEJ Korea Life Insurance May 16, 2011
21
Fig. 38: Foreign net bond buy vs. US rate
Source: FSS, KOFIA, Nomura research
Fig. 39: US rate vs. KTB rate
Source: FSS, KOFIA, Nomura research
Long-end expected to rise slowly but surely Young Sun forecasts that the five-year treasury yield will start to rise in 3Q11F and reach 4.5% by the end of 1H12F from the current yield of 4.0%, and the three-year treasury will reach 4.2% by the end of 1H12F from the current yield of 3.6%.
Fig. 40: Nomura interest rate forecast
Source: BOK, Nomura research
Benefits from rising rates
Korean lifers have significant exposure to fixed-rate policies The benefit from rising rates is clearly evident for life insurers with large exposure to fixed-rate policies, in our view. The reserve for fixed-rate policies as a proportion of interest-bearing reserve amounts to 60% for Samsung Life, 70% for Korea Life and 56% for Tong Yang Life.
Valuation sensitivity highest for Korea Life Our valuation sensitivity is the highest for Korea Life given that it has the largest exposure to fixed rate policies. Korea Life has the highest exposure to fixed-rate policies given the company’s focus on variable insurance. Although we think it is the right strategy for the company given its capital constraints, the approach has resulted in a larger duration gap than its peers. Variable products require less capital than traditional
300
320
340
360
380
400
420
440
460
480
500
1.5
1.7
1.9
2.1
2.3
2.5
2.7
2.9
Sep-10 Oct-10 Nov-10 Dec-10 Jan-11 Feb-11
US TN 5y (LHS) Net bond buy (RHS)(%) (Wtn)
3.0
3.2
3.4
3.6
3.8
4.0
4.2
4.4
4.6
1.5
1.7
1.9
2.1
2.3
2.5
2.7
2.9
Sep-10 Oct-10 Nov-10 Dec-10 Jan-11 Feb-11
US TN 5y (LHS) KTB 5yr (LHS)(%) (%)
1%
2%
3%
4%
5%
6%
7%
1Q
05
3Q
05
1Q
06
3Q
06
1Q
07
3Q
07
1Q
08
3Q
08
1Q
09
3Q
09
1Q
10
3Q
10
1Q
11
F
3Q
11
F
1Q
12
F
3yr T-bond yield 5yr T-bond yield BoK base rate
Forecast

Nomura | AEJ Korea Life Insurance May 16, 2011
22
products, but as savings premium gets booked to a separate account, it would not have dilutive effect in terms of general account crediting rate.
But Korea Life also has the highest hurdle Although Korea Life is most sensitive to rising rates, we do not think the stock will outperform its peers given that its hurdle rate is the highest among the Korean Lifers and we expect a slow rise in the long-end of the yield curve.
Fig. 41: % of fixed rate liabilities (December 2010)
Source: Company data, Nomura research
Fig. 42: Proportion of high yield guarantee policies yielding 6% and over
Source: Company data, Nomura research
70%
60% 58%
0%
10%
20%
30%
40%
50%
60%
70%
80%
Korea Life Samsung Life TYL
5.4%
5.6%
5.8%
6.0%
6.2%
6.4%
6.6%
Jun09 Sep09 Dec09 Mar10 Jun10 Sep10 Dec10
Korea Life Samsung Life Tong Yang Life

Nomura | AEJ Korea Life Insurance May 16, 2011
23
Long-term positive industry outlook We believe the Korean life insurance market still has room to grow, given relatively low insurance density. We expect investment-linked products and corporate pension to continue to provide growth opportunities. We also believe the profitability of lifers will likely improve as negative spread books mature and new low-yield floating rate policies dilute their in-force book.
Now entering the longevity market
Second baby boomers the source of traditional life insurance Traditional life insurance (eg, whole life and term life) started to grow meaningfully only in early 2000s. Demand for traditional life insurance could fall as baby boomers start to retire, in our view. However, Korea has the second group of 7mn baby boomers (14% of total population, born in 1968–1976) that could be a continued source of demand for traditional life insurance. The ‘second baby boomers’ are now having families and are seeking protection for their family in case of death or critical illness.
Demand for wealth accumulation products still rising Investment-linked insurance in Korea, introduced only in recent years, started to show a meaningful growth only in late 2000s. Although new business volume fell sharply due to the global credit crisis, the volume has been picking up again as the market recovers. We remain positive on the long-term demand for investment linked insurance given that they could provide guaranteed stream of income for life with potential for upside and tax advantages (e.g., variable annuity).
First baby boomers now looking for protection against longevity risk We expect strong growth in demand for products that manage longevity risk (eg, income annuities and long-term care insurance) as the first group of 8mn baby boomers (16% of total population, born in 1946-1964) start to retire this year. People are healthier and living longer, and are fearful of outliving their assets (ie, longevity risk). Hence, boomers will seek sources of lifetime income and long-term care insurance given limited pension and healthcare support from the government and corporations.
Fig. 43: Life insurance product migration Korea now entering the third stage "longevity market"
Source: Nomura research
PROTECTION2000 ~
ACCUMULATION2005 ~
LONGEVITY2010 ~
Mortality Risk
Morbidity Risk
Asset Accumulation
Tax Avoidance
Estate Planning
Asset Protection
Longevity Risk
Quality of Life

Nomura | AEJ Korea Life Insurance May 16, 2011
24
Korean retirees not prepared for longevity risk
Rapidly changing demographic to support life industry We expect a rapid change in demographics for the next ten years. In 2020, all of the first baby boomers will be in retirement, and all of the second baby boomers will face retirement. However, it seems like both the first and second baby boomers are not fully prepared for retirement. That said, we think demand for wealth accumulation and longevity products should remain healthy for the next 10 years.
Fig. 44: 2010 demographic First baby boomers about to retire
Source: KOSIS, Nomura research
Fig. 45: 2020 demographic Demand for wealth accumulation & longevity products to increase
Source: KOSIS, Nomura research
Retirees don’t have enough income from insurance and annuities… The first baby boomers are about to retire. However, retirees are not fully prepared for life after retirement. Insurance and annuities only make up a small proportion of Korean retirees' income. In addition, government pension only makes up 7% of retirees' income. Therefore, most of retirees in Korea are still dependant heavily on family support, or have to work even after retirement.
Fig. 46: US retirees’ income breakdown
Source: Korea Institute for Health and Social Affairs, Nomura research
Fig. 47: Korea retirees’ income breakdown
Source: Korea Institute for Health and Social Affairs, Nomura research
3,000 2,000 1,000 0 1,000 2,000 3,000
0 - 45 - 9
10 - 1415 - 1920 - 2425 - 2930 - 3435 - 3940 - 4445 - 4950 - 5455 - 5960 - 6465 - 6970 - 7475 - 7980 - 8485 - 8990 - 94
Female Male
1st Baby boom generationAge 47 - 56 (1955-64)
('000)
2nd Baby boom generationAge 36 - 43 (1968-75)
(Age)
2,500 1,500 500 500 1,500 2,500
0 - 45 - 9
10 - 1415 - 1920 - 2425 - 2930 - 3435 - 3940 - 4445 - 4950 - 5455 - 5960 - 6465 - 6970 - 7475 - 7980 - 8485 - 8990 - 94
Female Male
1st Baby boom generationAge 57 - 66 (1955-64) 2nd Baby boom generation
Age 46 - 53 (1968-75)
('000)
(Age)
Public pension,
55%
Support from family,
2%
Savings, insurance & annuities,
23%
Earned income,
16%
Others, 4%Public
pension, 7%
Support from family,
56%
Savings, insurance & annuities,
10%
Earned income,
27%

Nomura | AEJ Korea Life Insurance May 16, 2011
25
…because Koreans depend heavily on real estate for wealth accumulation We think that one of the key reasons is a heavy dependence on real estate for wealth accumulation and a reluctance to cash out of real estate due to expectation of capital gains. However, we think that as expected returns from real estate investment decline, the proportion of insurance and pension as a percentage of total household assets will likely increase going forward.
Fig. 48: Household asset breakdown (2006) Koreans depends heavily on real estate for wealth accumulation
Source: BOK, CEIC, Nomura research
Fig. 49: Household financial asset breakdown (2009) Koreans have most of their financial assets in bank deposits
Source: BOK, CEIC, Nomura research
Family support may not be an option anymore In our view, retirees will soon realise that they cannot depend on family support for retirement income any more. A demographic transition is in progress in Korea. Decreasing fertility along with lengthening life expectancy is reshaping the age structure of the population. According to the Korean Statistical Information Service (KOSIS), Korea recorded a birth rate of 1.15 in 2009, which is the lowest globally. This means that support from kids can no longer serve as a substitute for insurance and pensions.
National pension system is not reliable In addition, the change in demographic will likely put pressure on national pension system. National Pension System Chairman warned that due to the change in demographic, the national pension fund could be depleted by year 2064. This means that the payout scheme could be changed to preserve the fund, and so Koreans cannot rely on national pension as a primary source of income after retirement.
23%
46%
61%67%
77%
54%
39%33%
0
10
20
30
40
50
60
70
80
90
100
Korea UK Japan US
Financial assets Tangible assets(%)
24% 27% 28%
50%
46%
56%
18%
32%
12%
6%
10%
1%
18% 7%
24%
12%
3%
20%
5%
0
10
20
30
40
50
60
70
80
90
100
Korea Japan US UK
Insurance & pension Cash & deposit Bond Stock Other(%)

Nomura | AEJ Korea Life Insurance May 16, 2011
26
Fig. 50: Koreans are having fewer kids Korean retirees cannot rely on family support anymore
Source: KOSIS, Nomura research
Fig. 51: Korean population aging fast Age 60 and over as a proportion of population to reach 30% by 2030
Source: KOSIS, Nomura research
Plenty of room for growth
Korean life insurance market appears to be a mature market Korea is already one of the largest life insurance markets globally. Korea is the eighth-largest life insurance market after Italy and the third-largest in Asia after China by premium volume. In addition, the penetration ratio (premium as % of GDP) of life insurance is fairly high at 6.5%. Note that as Korean non-life insurers are multi-liners that participate in the life business, the actual penetration ratio should be even higher.
Fig. 52: Korea is eighth-largest life insurance market (2009)
Source: Swiss re sigma
Fig. 53: Korea is 10th most penetrated market (2009)
Source: Swiss re sigma
Survey says most households already own life insurance According to a survey conducted by Korea Life Insurance Association (KLIA) in 2009, most of Korea’s households (with an exception of poor and uneducated) already own life insurance.
0
1
2
3
4
5
0
200
400
600
800
1,000
1,2001
970
19
72
19
74
19
76
19
78
19
80
19
82
19
84
19
86
19
88
19
90
19
92
19
94
19
96
19
98
20
00
20
02
20
04
20
06
20
08
20
10
Number of births ('000) Birth rate (%)
0
10
20
30
40
50
60
199019921994199619982000200220042006200820102012201420162018202020222024202620282030
(mn) Below 20 20~64 Above 65
050
100150200250300350400450500
US
Jap
an
UK
fran
ce
Germ
any
Ch
ina
Italy
Ko
rea
Ind
ia
Taiw
an
Can
ad
a
Sp
ain
(US$ bn)
0
2
4
6
8
10
12
14
Taiw
an
So
uth
Afr
ica
UK
Ho
ng K
ong
Jap
an
Fin
land
Fra
nce
Den
mark
Irela
nd
Ko
rea
Po
rtug
al
(%)

Nomura | AEJ Korea Life Insurance May 16, 2011
27
Fig. 54: Percentage of households owning life insurance by income level (2009) 84.5% of households already have life Insurance
Source: Nomura research
Fig. 55: Percentage of households owning life insurance by education level (2009)
Source: Nomura research
But insurance density shows a different picture However, based on insurance density it appears that the Korean market is still underdeveloped. We think that one of the key reasons is due to fewer females in Korea participating in the workforce than more developed countries (and lower wage level than that of males). In addition, the insurance penetration ratio, which is measured based on the GDP figure, could be overstated given that the Korean economy is more trade oriented.
Fig. 56: Proportion of female in workforce trend (Korea) Female employment rising continuously
Source: CEIC, Nomura research
Fig. 57: Proportion of female in workforce by country (2009)Fewer Korean females participate in workforce
Source: CEIC, Nomura research
0 10 20 30 40 50 60 70 80 90 100
~W12m 12~24m 24~36m 36~48m 48~60m W60m~
Average =84.5%
(%)
0 10 20 30 40 50 60 70 80 90 100
Elementary Middle High College
(%)
38 38 39 39 40 40 41 41 42 42 43
1984
1986
1988
1990
1992
1994
1996
1998
2000
2002
2004
2006
2008
(%)
40
41
42
43
44
45
46
47
48
US Japan Korea
(%)

Nomura | AEJ Korea Life Insurance May 16, 2011
28
Fig. 58: Insurance density: premium per capita in USD (2009)
Source: Swiss re sigma
Further study by KLIA survey shows a different picture According to KLIA’s survey, 84.5% of households surveyed own life insurance. However, a breakdown of insurance products shows that most of the households have healthcare and casualty policies with low monthly payments and a large proportion of the households acknowledge that their current insurance assets seem insufficient.
Fig. 59: Most households that own life insurance have very little exposure to wealth accumulation products (2009) Current ownership is skewed to healthcare and casualty products with low monthly payments
Source: KLIA, Nomura research
Fig. 60: More households that already own life insurance feel their insurance assets are insufficient (2009) Even among the households that already own wealth accumulation products feel the need for more
Source: KLIA, Nomura research
Ranking Country Life business Non-life Total
1 Denmark 3,816 1,713 5,529
2 UK 3,528 1,051 4,579
3 Ireland 3,437 1,079 4,516
4 Sw itzerland 3,405 2,853 6,258
5 Finland 3,380 873 4,253
6 Luxembourg 3,229 1,998 5,227
7 Japan 3,139 840 3,979
8 France 2,980 1,289 4,269
9 Hong Kong 2,887 417 3,304
10 Sw eden 2,690 850 3,540
11 Liechtenstein 2,350 23 2,373
12 Belgium 2,323 1,171 3,494
13 Taiw an 2,257 495 2,752
14 Norw ay 2,074 1,351 3,425
15 Netherlands 2,046 4,508 6,554
16 Singapore 1,912 645 2,557
17 Italy 1,878 851 2,729
18 US 1,603 2,107 3,710
19 Autralia 1,525 1,307 2,832
20 Germany 1,360 1,518 2,878
21 Portugal 1,357 549 1,906
22 Canada 1,300 1,644 2,944
23 Austria 1,236 1,507 2,743
24 Korea 1,180 710 1,890
25 Spain 853 949 1,802
26 New Zealand 249 1,318 1,567
27 Malaysia 207 115 322
28 Thailand 92 62 154
29 India 48 6 54
30 Indonesia 22 10 32
0 10 20 30 40 50 60 70 80 90 100
Healthcare Casualty Death Pension Savings Variable
(%)
20
30
40
50
60
Healthcare Casualty Death Pension Savings Variable
Sufficient Insufficient(%)

Nomura | AEJ Korea Life Insurance May 16, 2011
29
Plenty of new business We should note that Korean lifers' average 25th month lapse ratio for the past seven years has stood at 36%. This means that nearly four out of ten contracts are no longer in-force after two years. Although a higher lapse ratio has a negative impact on VIF, it tends to have a positive impact on new business volume. Currently reported VIF by Korean lifers already reflect such a high lapse ratio. That said, we think there is little downside to new business volume for Korean lifers.
Fig. 61: Current 13th month persistency ratio is 76%
Source: FSS, Nomura research
Fig. 62: Current 25th month persistency ratio is 56%
Source: FSS, Nomura research
Underdeveloped compared to the banking sector The banking sector has gone through several rounds of restructuring since 1998 at the onset of the Asian Financial Crisis. As a result, the banking sector has emerged significantly healthier and profitable, in our view. We think that there are too many players with very little capital in the life insurance sector. We expect the government to introduce initiatives (such as a transition to risk-based capital) as part of its ongoing effort to restructure the financial sector.
Fig. 63: Total assets by sector (FY10)
Source: FISIS, Nomura research
Fig. 64: Shareholders' equity by sector (FY10)
Source: FISIS, Nomura research
Wealth accumulation products to drive growth
Death insurance growth slowing but not over yet Until late 1990s, Korean life insurers sold mostly savings type policies that have a very limited risk premium. We think savings type policies are mere substitutes for deposits. In addition, savings type policies have been a money-losing business for most of the life
60
65
70
75
80
85
90
1H
04
2H
04
1H
05
2H
05
1H
06
2H
06
1H
07
2H
07
1H
08
2H
08
1H
09
2H
09
1H
10
(%) Korea Samsung KyoboMirae asset Tong Yang
40
45
50
55
60
65
70
75
80
1H
04
2H
04
1H
05
2H
05
1H
06
2H
06
1H
07
2H
07
1H
08
2H
08
1H
09
2H
09
1H
10
(%) Korea Samsung KyoboMirae asset Tong Yang
0
200
400600
800
1,000
1,200
1,400
1,600
1,800
Bank Insurance Brokers
(Wtn)
0
20
40
60
80
100
120
140
Bank Insurance Brokers
(Wtn)

Nomura | AEJ Korea Life Insurance May 16, 2011
30
insurers. That said, we think growth of protection type policies that has a higher embedded margin is better than what we could infer from the insurance penetration rate.
Fig. 65: Premium growth by product (general account)
Source: KLIA, Nomura research
Fig. 66: Premium income by function
Source: KLIA, Nomura research
Separate account to derive growth We expect separate accounts, which include investment-linked insurance and corporate pension, to remain as the main growth driver for the Korean life insurers. The separate account business will increase insurers’ commission income with a minimum charge of capital cost, as investment risks transfer to policyholders of separate account products. The demand for variable insurance and pension products should increase with need for wealth accumulation and financial security, in our view.
Investment linked policies at infancy stage Investment-linked products were introduced in 2003 and started to show meaningful growth starting in 2006. Given its infant stage, we are positive on the long-term growth prospect of investment-linked products. Investment-linked products could provide a guaranteed stream of income with potential upside.
Fig. 67: Total premium growth by product
Source: KLIA, Nomura research
Fig. 68: Separate account growth
Source: KLIA, Nomura research
(80)
(60)
(40)
(20)
0
20
40
60
80
100
0
10
20
30
40
50
60
Mar-93
Mar-94
Mar-95
Mar-96
Mar-97
Mar-98
Mar-99
Mar-00
Mar-01
Mar-02
Mar-03
Mar-04
Mar-05
Mar-06
Mar-07
Mar-08
Mar-09
Mar-10
Pure Endowment DeathEndowment GroupGeneral account premium
(Wtn) (%)
0
10
20
30
40
50
60
70
80
90
100
Mar-9
9
Mar-0
0
Mar-0
1
Mar-0
2
Mar-0
3
Mar-0
4
Mar-0
5
Mar-0
6
Mar-0
7
Mar-0
8
Mar-0
9
Mar-1
0
Savings Protection(%)
-10
-5
0
5
10
15
20
0
20
40
60
80
100
120
140M
ar-0
1
Mar-0
2
Mar-0
3
Mar-0
4
Mar-0
5
Mar-0
6
Mar-0
7
Mar-0
8
Mar-0
9
Mar-1
0
Pure Endowment (LHS)Death (LHS)Endowment (LHS)General account premium (LHS)Separate Account (LHS)Growth (RHS)
(Wtn) (%)
0
5
10
15
20
25
30
35
Mar-0
0
Mar-0
1
Mar-0
2
Mar-0
3
Mar-0
4
Mar-0
5
Mar-0
6
Mar-0
7
Mar-0
8
Mar-0
9
Mar-1
0
Variable Retirement(Wtn)

Nomura | AEJ Korea Life Insurance May 16, 2011
31
We expect the recovery to continue Variable insurance initial premium volume fell sharply with the market crash in 2008. However, investors are coming back to variable insurance now as the economy rebounds. We think that this trend will likely continue, especially considering that insurers are now adopting a “step-up” guarantee option, which provides downside protection when the market is in a downturn.
Fig. 69: Variable premium vs. KOSPI
Note: Units represent monthly increase, Based as of April, 2005
Source: Wisenet, KLIA, INSIS, Nomura research
Fig. 70: Initial premium trend (Wtr)
Source: Nomura research
Fig. 71: Separate account initial premium trend
Source: Nomura research
Variable insurance as wealth accumulation and transfer vehicle Aside from financial security after retirement, we believe demand for investment-linked insurance should increase as an estate planning tool. Variable life insurance could provide a solution to wealthier individuals who are looking to accumulate and transfer wealth to the next generation with tax advantages, in our opinion.
0
50
100
150
200
250
300
Jul-
05
Oct
-05
Jan
-06
Ap
r-06
Jul-
06
Oct
-06
Jan
-07
Ap
r-07
Jul-
07
Oct
-07
Jan
-08
Ap
r-08
Jul-
08
Oct
-08
Jan
-09
Ap
r-09
Jul-
09
Oct
-09
Jan
-10
Ap
r-10
Jul-
10
Oct
-10
Variable KOSPI
60
40
20
0
20
40
60
80
100
0.0
0.5
1.0
1.5
2.0
2.5
3.0
Ap
r-06
Aug
-06
Dec-0
6
Ap
r-07
Aug
-07
Dec-0
7
Ap
r-08
Aug
-08
Dec-0
8
Ap
r-09
Aug
-09
Dec-0
9
Ap
r-10
Aug
-10
Dec-1
0
Pure Endowment
Death
Endowment
Group
Separate Account
Total growth (YoY)
(%)
0
200
400
600
800
1,000
1,200
1,400
1,600
1,800
2,000
Mar-05
Jul-05
No
v-05
Mar-06
Jul-06
No
v-06
Mar-07
Jul-07
No
v-07
Mar-08
Jul-08
No
v-08
Mar-09
Jul-09
No
v-09
Mar-10
Jul-10
No
v-10
Retirement Insurance
Retirement Pension
Variable
(Wbn)

Nomura | AEJ Korea Life Insurance May 16, 2011
32
Fig. 72: Wealth transfer is one of the key driver for insurance demand Percent indicating top or major reason (by amount of life insurance owned)
Source: LIMRA, Nomura Research; Note: in USD
Survey shows that Koreans are interested in variable insurance As seen in the table below, the penetration rate for retirement pension, investment accounts and variable annuities is still relatively low in Korea. Moreover, we can infer from the survey conducted by KLIA that demand for insurance is shifting to investment-linked and retirement products. That said, we think that insurers who align their corporate strategy to meet changing consumer needs will likely outperform their peers.
Fig. 73: Penetration rate by products
Source: Nomura research
Fig. 74: KLIA survey showing demand is shifting to investment linked and retirement products
Source: KLIA, Nomura research
Corporate pension market to grow rapidly
Corporate pension market now set to take off Corporate pension business growth in Korea has been somewhat disappointing. However, we expect the growth rate to pick up, given that recognition of provisions for severance pay as an expense for tax purposes will be phased out. In addition, the retirement insurance system has been discontinued. That said, we believe that corporate pension growth will likely accelerate. The Korea Capital Market Institute forecasts that the corporate pension market will grow to KRW330tn by 2020 from KRW28tr in 2010.
ReasonTotal
affluent<$100k $100-$500k
$500k-$999k
$1million+
Financial security 62% 36% 68% 83% 76%
Wealth transfer 44% 29% 54% 50% 47%
Final expenses 41% 61% 43% 28% 22%
Retirement 21% 16% 22% 17% 29%
Mortgage 14% 4% 17% 15% 16%
Estate tax 14% 9% 14% 11% 20%
Investment 8% 1% 8% 15% 16%
Charity 4% 1% 5% 7% 2%
Business 1% 0% 1% 2% 2%
0
20
40
60
80
100
Disease Accident Death Retirement pension
Investment accounts
Variable annuity
2003 2006 2009(%)
0
10
20
30
40
50
60
Pen
sio
n
Dis
eas
e
Acc
iden
t
Lo
ng
-te
rm
nu
rsin
g
Sa
vin
gs
De
ath
Varia
ble
Rev
ers
e
mo
rtga
ge
Me
dic
al
ind
em
nity
2003 2006 2009(%)

Nomura | AEJ Korea Life Insurance May 16, 2011
33
Fig. 75: Corporate pension M/S by institution
Source: FSS, Nomura research
Fig. 76: Korean corporate pension market forecast
Source: KCMI, Nomura research
Lifers should do well Although banks have been leading in the corporate pension business, we think that life insurers will grab a fair share of the market considering their extensive experience in defined benefit plans, which have been the most popular plans so far. According to Korea Capital Market Institute, the defined benefit (DB) plan should lead growth in Korea. So far, Life insurers have shown strength in defined benefit plan.
Fig. 77: DB forecasted to lead growth till FY20F Defined benefit (DB) plan and Individual retirement account (IRA) to drive growth (vs. defined contribution (DC)
Source: KCMI, Nomura estimates
Fig. 78: Corporate pension M/S by product Lifers have shown strength in DB
Source: FSS, Nomura research
Samsung Life leading the pack Samsung currently has a 15% share of the corporate pension market. We expect the company to maintain its leading position given that it has a captive market. Although the profitability of corporate pension is questionable with so many players in the market, we think that when the industry normalizes, it should be able to generate 50bp on the assets (Samsung Life believes 60bp is possible). Theoretically, if Samsung Life maintains a 15% market share, the company should be able to generate net profit of KRW117bn (compared to net profit of KRW1,200bn in FY11F) by FY20F.
0
5
10
15
20
25
30
35Jan
09
Feb09
Mar0
9A
pr0
9M
ay09
Jun
09
Jul0
9A
ug
09
Sep
09
Oct0
9N
ov09
Dec09
Jan
10
Feb10
Mar1
0A
pr1
0M
ay10
Jun
10
Jul1
0A
ug
10
Sep
10
Oct1
0N
ov10
Dec10
Jan
11
Feb11
(Wtn) Bank Insurance Broker
020406080
100120140160180
FY
09
FY
10
FY
11F
FY
12F
FY
13F
FY
14F
FY
15F
FY
16F
FY
17F
FY
18F
FY
19F
FY
20F
(Wtn)
020406080
100120140160180
FY
09
FY
10
FY
11F
FY
12F
FY
13F
FY
14F
FY
15F
FY
16F
FY
17F
FY
18F
FY
19F
FY
20F
DB DC IRA(Wtn)
0
2
4
6
8
10
12
14
16
Banks Life Insurer Brokerage Non-life insurer
DB DC IRA(Wtn)

Nomura | AEJ Korea Life Insurance May 16, 2011
34
Fig. 79: Samsung Life has 15% corporate pension market share
Source: Nomura research
0% 2% 4% 6% 8% 10% 12% 14% 16%
Samsung Life
Kookmin Bank
Shinhan Bank
Woori Bank
IBK
Kyobo Life
Hana Bank
HMC Securities
Nonghyup
Samsung F&M
Mirae Securities
KDB
Korea Life
KEB
LIG F&M
Hi Securities
Samsung Securities
KIS
Mirae Life
Tong Yang Securities

Nomura | AEJ Korea Life Insurance May 16, 2011
35
Embedded profitability to improve We expect all three profit sources (risk margin, loading margin, and savings margin) to improve or stop deteriorating going forward. Loading margin should improve as lifers gain scale and technical pressure when the deferred acquisition cost (DAC) accounting change is lifted. Savings margin should improve as low-yield floating rate policies replace high-yield fixed policies. In addition, we think further deterioration in risk margin is unlikely given that there will be no additional increase in IBNR reserve requirements.
Understanding profit sources There are three different profit sources for traditional life products: 1) mortality and morbidity margin (difference between assumed claims and actual claims); 2) loading margin (difference between assumed operating expense and actual operating expense); and 3) savings margin (spread between investment yield and interest paid to policyholders). For investment-linked insurance, the investment risk is transferred to policyholders and insurers earn commission income for managing the account. Mortality and morbidity margin can be improved by better risk management, loading margin can be improved by increasing the scale and savings margin can be improved by taking in greater risk with investment assets. However, protecting the spread is of higher priority for insurers given the long-tail nature of the business. Hence, asset and liability duration gap management is critical for insurers.
Policy mix change in favour of lifers We expect a continued shift in policy mix toward higher-margin policies. Underwriting profitability should improve as low-yield floating rate policies replace high-yield fixed rate policies and higher-margin protection type policies replace lower-margin savings type policies. We expect continued growth in protection type policies due to increased demand for living benefits. Savings type policies have lower embedded margins due to a higher proportion of saving premiums that carry thin margins.
Loading margin to improve
Loading margin is the main profit source for Korean lifers The loading margin has been the main profit source for the Korean insurers over the years. We think that the loading margin has been relatively high since insurers still have control over distribution channels, and the regulator allows it to a certain degree to compensate for negative spreads on savings premiums.
Fig. 80: Industry loading margin in KRW amount
Source: FISIS, Nomura research
Fig. 81: Industry loading margin in %
Source: FISIS, Nomura research
0
1
2
3
4
5
Mar 0
2
Mar 0
3
Mar 0
4
Mar 0
5
Mar 0
6
Mar 0
7
Mar 0
8
Mar 0
9
Mar 1
0
(Wtn)
0
5
10
15
20
25
30
35
Mar 0
2
Mar 0
3
Mar 0
4
Mar 0
5
Mar 0
6
Mar 0
7
Mar 0
8
Mar 0
9
Mar 1
0
(%)

Nomura | AEJ Korea Life Insurance May 16, 2011
36
Actual margin should be higher Note that a proportion of loading premium that relates to the separate account is captured in fees from the separate account. Meanwhile, the entire expense is captured in the general account. Hence, we believe that loading margin expansion has already started.
Loading margin has been under technical pressure The loading margin has been under technical pressure due to the change in accounting for acquisition costs in 2004. Prior to the accounting change, insurers capitalized estimated acquisition costs into a deferred acquisition cost (DAC) account, then amortized over seven years. Therefore, the entire loading margin was recognized upfront. However, after the change, insurers now defer the actual amount, recognizing the loading margin evenly for seven years. Given that we are six years into the new accounting method, we think that additional pressure from the accounting change will be limited.
Increase in upfront payment proportion added pressure on loading margin We should note that the recent downward trend of loading margin does not indicate deterioration in profitability. The loading margin fell as the industry increased the upfront proportion of sales commission. However, total commission paid out remained the same. That said, we think the loading margin should improve going forward.
Spread on savings premium to improve gradually
Regulator created negative spread books The regulator required life insurers to pay 9% on non-participating policies and 7.5% on participating policies until 1998. The Korean government lowered the crediting rate by 100bp in 1999 and deregulated in 2000. Meanwhile, the Korean bond market has experienced a secular bull market over the past two decades, taking the three-year treasury yield down to 3.6% from 13% in 1995. Consequently, Korean lifers are stuck with huge negative spread books.
Fig. 82: Fixed yield book breakdown by crediting rate
Source: FSS, Nomura research
Fig. 83: Crediting rate trend
Source: FSS, Nomura research
Unwinding of legacy issue will take time 67% of negative spread policies have remaining maturity of 20 years and longer. In addition, the lapse ratio for these policies is extremely low given their attractive yields.
0102030405060708090
>4.0
%
4.5
%
5.0
%
5.5
%
6.0
%
6.5
%
7.0
%
7.5
%
8.0
%
8.5
%<
(%)
3
4
5
6
7
8
9
10
1993
1994
1995
1996
1997
1998
1999
2000
2001
2002
2003
2004
2005
2006
2007
2008
(%) Participating Non-Par
Deregulated starting in 2000

Nomura | AEJ Korea Life Insurance May 16, 2011
37
Fig. 84: Fixed yield book breakdown by maturity
Source: FSS, Nomura research
Fig. 85: Average crediting rate by company
Source: FSS, Nomura research
But dilution effect likely to bring down the average crediting rate Although high-yield guarantee products will remain in-force for quite some time, we think their spreads are likely to improve given that insurers have been selling low-yield floating rate products. As high-yield guarantee products mature and new low-yield floating rate products dilute the existing pool, saving spreads should improve. In addition, we think that rising market rates should further improve the spread.
Fig. 86: Proportion of high yield guarantee policies yielding 6% and over Proportion of high yield guarantee policies declining steadily for all three companies
Source: FSS, Nomura research
Fig. 87: Average crediting rate Average crediting rate falling steadily for all three companies
Source: FSS, Nomura research
But recovery should take longer than expected due to RBC transition However, we note that the recovery in savings margin should take longer than expected. Life insurers have been increasing the long-dated bond proportion of investment (with an exception of Tong Yang Life) in order to improve their RBC ratio. The RBC ratio, which is a stricter measure of capital adequacy, assesses interest rate risk based on the asset and liability duration gap. As a result, the proportions of loans have declined. Given their loan books generate 300bp-400bp more in investment returns than those of bond portfolio, we believe improvement in the investment yield will take longer than expected. In addition, adding long-dated bonds at the bottom of interest cycle will not help the cause either.
Tong Yang relatively unaffected by RBC Tong Yang Life actually increased its loan proportion while its peers lowered it. In our opinion, Tong Yang, which had a relatively narrower asset and liability duration gap, was less affected by the RBC transition.
0
10
20
30
40
50
60
701-2
yr
2-3
yr
3-4
yr
4-5
yr
5-6
yr
6-7
yr
7-1
0yr
10-1
5yr
15-2
0yr
+20yr
(%)
5.94
6.29
5.67
5.2
5.4
5.6
5.8
6.0
6.2
6.4
-
10
20
30
40
50
60
Samsung Life Korea Life Tong Yang Life
% of reserve with crediting rate over 6%Average crediting rate
(%)(%)
20
25
30
35
40
45
50
55
60
Jun09 Sep09 Dec09 Mar10 Jun10 Sep10 Dec10
Korea Life Samsung Life Tong Yang Life(%)
5.4
5.6
5.8
6.0
6.2
6.4
6.6
Jun09 Sep09 Dec09 Mar10 Jun10 Sep10 Dec10
Korea Life Samsung Life Tong Yang Life(%)

Nomura | AEJ Korea Life Insurance May 16, 2011
38
Fig. 88: Change in investment asset mix Lifers have been adding more long-dated bonds in order to lower the asset liability duration gap
Source: Nomura research
Fig. 89: Duration gap narrowing Lifers lowered the duration gap by increasing asset duration which will have an adverse affect on investment returns
Source: Nomura research
15 20 25 30 35 40 45 50 55
Dec09 Dec10 Dec09 Dec10 Dec09 Dec10
Samsung Korea Tong Yang
Bonds Loans(%)
1.0
1.5
2.0
2.5
3.0
3.5
4.0
4.5
Mar10 Dec10 Mar10 Dec10 Mar10 Dec10
Samsung Korea Tong Yang

Nomura | AEJ Korea Life Insurance May 16, 2011
39
Risk margin to stabilise
The fall is mostly due to timing The mortality and morbidity margin has been falling continuously over the years after peaking at 32% in 2002. We think that further downside risk to the margin is limited.
The high margin in the early-2000s was attributable to rapid growth in death insurance that was introduced in 1997. Given that policies in the early stage had lower claims, the rapid growth in death insurance resulted in margin expansion. However, the trend reverses when growth slows and claims rise on in-force policies. We think that further downside to the mortality and morbidity margin is limited, given that premium growth for death insurance has been stagnant over the past three to four years, and the margin fell for six years after peaking in 2002.
No additional increase in IBNR reserve requirement The Implementation of incurred but not reported (IBNR) in 2004 also played a part in the mortality and morbidity margin squeeze. Life insurers started to reserve for IBNR in FY04. The reserve rate was increased every year to 10% in FY06. We think the pressure from the IBNR reserve is limited, given that there will be no additional increase in IBNR reserve requirements.
Lifers now have more flexibility in pricing Life insurers secured flexibility in terms of pricing for risk starting with the fifth mortality table in April 2006. The regulator allowed insurers to reflect their own mortality risk assumptions for pricing. We think the flexibility gives insurers room to manage the mortality margin and to improve it in the long term.
Fig. 90: Industry risk margin in KRW
Source: FISIS, Nomura research
Fig. 91: Industry risk margin in %
Source: FISIS, Nomura research
0.0
0.5
1.0
1.5
2.0
Mar
02
Mar
03
Mar
04
Mar
05
Mar
06
Mar
07
Mar
08
Mar
09
Mar
10
(Wbn)
0
5
10
15
20
25
30
35
Mar0
2
Mar0
3
Mar0
4
Mar0
5
Mar0
6
Mar0
7
Mar0
8
Mar0
9
Mar1
0
(%)

Nomura | AEJ Korea Life Insurance May 16, 2011
40
Second tiers gaining market share
The Big Three losing market share
Big three gained market share at the wrong time The Big Three (Samsung Life, Korea Life and Kyobo Life) gained market share in the late 1990s due to industry consolidation. However, their market share gain during this period was a short-lived positive, as during this period, the crediting rate was still regulated and fixed at 9% for non-participating and 7.5% for participating policies. In addition, when the crediting rate was deregulated, the Big Three lost most of the gains in the late 1990s. As a result, the Big Three have proportionally larger negative spread books. We think that this legacy issue will continue to impose constraints on their channel and pricing strategy.
Fig. 92: M/S in terms of total premium
Source: KLIA, Nomura research
Fig. 93: M/S in terms of initial premium
Source: KLIA, Nomura research
The Big Three slow to adopt non-traditional channels Since the turn of the century, the Big Three have started to lose market share with the proliferation of non-traditional distribution channels such as bancassurance, independent distribution channels and direct marketing channels (e.g., home shopping networks, telemarketing and the Internet). We think that the Big Three have been reluctant to adopt the non-traditional channels due to channel conflicts. The Big Three had large forces of exclusive solicitors who did not welcome the newly developing channels.
Fig. 94: Industry distribution channels
Source: KLIA, Nomura research
Fig. 95: Big 3’s distribution channel
Source: KLIA, Nomura research
Big Three focus on shifting to variable insurance The Big Three were quick to introduce investment-linked products when they started to lose market share in the traditional insurance product market. We think this was an inevitable strategy for the Big Three, given that their combined solvency margin fell below 200% in the early 2000s. Due to capital constraints, the Big Three had to shift their focus to variable insurance, which requires less capital than traditional products.
0
20
40
60
80
100
Mar9
3
Mar9
4
Mar9
5
Mar9
6
Mar9
7
Mar9
8
Mar9
9
Mar0
1
Mar0
2
Mar0
3
Mar0
4
Mar0
5
Mar0
6
Mar0
7
Mar0
8
Mar0
9
Mar1
0
Mar1
1
Dec10
Samsung Kyobo Korea SME Foreign(%)
0
20
40
60
80
100
Mar9
3
Mar9
4
Mar9
5
Mar9
6
Mar9
7
Mar9
8
Mar9
9
Mar0
1
Mar0
2
Mar0
3
Mar0
4
Mar0
5
Mar0
6
Mar0
7
Mar0
8
Mar0
9
Mar1
0
Mar1
1
Dec10
Samsung Kyobo Korea SME Foreign(%)
0
20
40
60
80
100
Mar9
9
Mar0
0
Mar0
1
Mar0
2
Mar0
3
Mar0
4
Mar0
5
Mar0
6
Mar0
7
Mar0
8
Mar0
9
Mar1
0
Mar1
1
Employee Solicitor Agent Bancassurance Other(%)
0
20
40
60
80
100
Mar9
9
Mar0
0
Mar0
1
Mar0
2
Mar0
3
Mar0
4
Mar0
5
Mar0
6
Mar0
7
Mar0
8
Mar0
9
Mar1
0
Mar1
1Employee Solicitor Agent Bancassurance Others(%)

Nomura | AEJ Korea Life Insurance May 16, 2011
41
Fig. 96: Big 3 vs industry average solvency ratio (%)
Source: Company data, Nomura research
Fig. 97: Big 3 Solvency ratio (%)
Source: Company data, Nomura research
Second tiers gaining market share
Multi-channel strategy working nicely Second-tier insurers have been gaining market share lead by Tong Yang Life and Shinhan Life. The second tiers have been taking advantage of newly developed distribution channels. In our opinion, they have been able to take on new channels without much conflict with the exclusive solicitors due to their weak solicitor base before the emergence of non-traditional channels.
Second tiers have more flexibility in pricing We think the Big Three have built in a higher risk and loading margin into their products to make up for their loss-making legacy books. However, second-tier insurers who are relatively free from the legacy issue are able to price their products more attractively.
Fig. 98: Whole life pricing by company (male)
Note: 40 year old, KRW300mn death benefit, payment period of 20years
Source: Hankyoreh, Nomura research
Fig. 99: Whole life pricing by company (women)
Note: 40 year old, KRW300mn death benefit, payment period of 20years
Source: Hankyoreh, Nomura research
Tong Yang benefiting from financial crisis
Foreign players damaged heavily during the crisis In our opinion, Tong Yang Life should benefit from foreign life insurers (namely ING Life and PCA Life) that lost a large number of exclusive solicitors during the financial crisis. We have not seen foreign lifers rebuilding their sales force yet.
Other medium size local players were also damaged heavily In addition, we note that Tong Yang Life’s domestic competitor KDB Life (unlisted) has had deployed a similar distribution strategy but it weakened during the financial crisis. KDB Life, formerly Kumho Life, incurred significant investment losses during the financial crisis, which has dragged down its solvency margin to only 30%. The company was later sold to Korea Development Bank. Mirae Asset Life (unlisted) also lost a large number of
50
100
150
200
250
Mar02 Mar03 Mar04 Mar05 Mar06 Mar07 Mar08 Mar09
Total Average Top 3 Average
50
100
150
200
250
300
350
400
450
Mar02 Mar03 Mar04 Mar05 Mar06 Mar07 Mar08 Mar09
Samsung Life Korea Life Kyobo Life
520,000540,000560,000580,000600,000620,000640,000660,000
Sam
sun
g
Mira
e a
sset
Gre
en
cro
ss
Sh
inhan
Ko
rea
KB
Kyo
bo
Allia
nz
Kum
ho
Heun
gkuk
To
ng Y
an
g
Do
ngbu
(W)
400,000420,000440,000460,000480,000500,000520,000540,000
Sam
sun
g
Mira
e a
sset
Gre
en
cro
ss
KB
Alia
nz
Kyo
bo
Ko
rea
Sh
inhan
Kum
ho
Heun
gkuk
Do
ngbu
To
ng Y
an
g
(W)

Nomura | AEJ Korea Life Insurance May 16, 2011
42
solicitors during the crisis. Mirae Asset Life had grown fast on the back of growing demand for investment linked insurance and its reputation as a leading asset manager. However, during the crisis, its new business volume for investment linked products fell sharply and so did the solicitors.
Fig. 100: ING Life & PCA Life solicitor trend ING Life and PCA Life lost 38% of their solicitors
Source: FISIS, Nomura research
Fig. 101: KDB Life & Mirae Asset Life solicitor trend KDB and Mirae Asset Life lost 33% of their solicitors
Source: FISIS, Nomura research
Fig. 102: Initial premium market share Foreign lifers losing out
Source: FISIS, Nomura research
Fig. 103: Medium size lifers' market share Mirae Asset and KDB losing out
Source: FISIS, Nomura research
12,000
13,500
15,000
16,500
18,000
19,500
21,000
3Q
08
4Q
08
1Q
09
2Q
09
3Q
09
4Q
09
1Q
10
2Q
10
3Q
10
4Q
10 5,000
7,000
9,000
11,000
13,000
15,000
3Q
08
4Q
08
1Q
09
2Q
09
3Q
09
4Q
09
1Q
10
2Q
10
3Q
10
4Q
10
0%
20%
40%
60%
80%
100%
Mar-
93
Mar-
94
Mar-
95
Mar-
96
Mar-
97
Mar-
98
Mar-
99
Mar-
01
Mar-
02
Mar-
03
Mar-
04
Mar-
05
Mar-
06
Mar-
07
Mar-
08
Mar-
09
Mar-
10
Mar-
11
Dec-1
0
Samsung Kyobo Korea SME Foreign
0%
2%
4%
6%
8%
10%M
ar-
97
Mar-
98
Mar-
99
Mar-
01
Mar-
02
Mar-
03
Mar-
04
Mar-
05
Mar-
06
Mar-
07
Mar-
08
Mar-
09
Mar-
10
Mar-
11
Dec-1
0
Tong Yang Mirae asset
Kumho Shinhan

Nomura | AEJ Korea Life Insurance May 16, 2011
43
Appendix 1: Calculating EV
Embedded value and appraisal value Embedded and appraisal values are the most widespread method of valuing life insurance companies outside the US, and are of increasing importance as investors pay attention to the published appraisal values of listed life insurance companies. We expect the use of embedded/appraisal values to increase in Asian markets. The purpose of this Appendix is to provide basic definitions and key drivers of embedded and appraisal values. An appraisal value is derived by developing a detailed model to project the future distributable cash flows arising from the underlying business (ie, the insurance and savings policies and supporting capital) of a life insurance company. These cash flows are discounted at a risk adjusted rate of return, known as the risk discount rate (RDR), to give a value for the company.
An appraisal value can be broken down into three components: net worth, value of in-force business and value of future new business. The net worth and value of in-force business are added together, and is referred to as the embedded value. The following chart shows how the three components come together.
Fig. 104: Components of appraisal value
Source: Nomura research
Net worth For regulatory reasons, life insurance companies must hold capital in excess of their current policy liabilities. This capital is intended to protect policyholders against the potentially detrimental effects of random economic shocks or fluctuations in the underlying operational experience of the portfolio. The excess capital must at least cover a ‘capital adequacy’ level specified by the regulator. Otherwise, the company is not allowed to pay dividends to shareholders. For this reason, it is usual for life insurance companies to hold capital in excess of the capital adequacy level. The net worth, or shareholders’ net worth, is the value of the shareholders’ interest in the capital held in excess of the policy liabilities. Some of this capital is ‘locked-in’, since it must cover the capital adequacy level. The locked-in capital is valued at a discount to face value, reflecting the fact that it will earn a lower rate of interest than that at which it is discounted. The capital, which does not need to be locked-in, is valued at face value, reflecting the fact that it is available for distribution or other uses. Usually the discount applied to the locked-in capital is taken off the value of in-force business, leaving the entire net worth at face value.
Value of in-force business Life insurance is a long-term business, with some policies extending over 50 years into the future. The valuation of each policy on a life insurance company’s books is performed by constructing a model to project cash flows from the policy into the future under a set of assumptions. The main cash flows projected can be separated into two categories: income and outgoings. The sources of future income are the regular
Shareholders net worth
(Shareholder funds + shareholders interest in life funds)
+
Value of in-force business
(value of future profit margins accruing to shareholders from policies in-force at date
of the valuation)
= Embedded value
+
Value of new business
(value of 1 year's new business X new business multiplier)
= Appraisal value

Nomura | AEJ Korea Life Insurance May 16, 2011
44
premiums payable on the policy (if any), the investment return on the assets backing the policy liability reserves, and any charges levied on funds under management. The sources of future outgoings are expenses and commission, policy-related claims, surrender and maturity payments, and taxation.
The value of in-force business is the value of all policies that a life insurance company has on its books at the balance date, to which the appraisal value relates. Often a policy-by-policy valuation will be carried out to project the cash flows and discount the shareholders’ share of the profits to the balance date.
Value of future new business The two components of the appraisal value mentioned above relate to the business already written by the life insurer and the capital supporting it. However, to value the company properly, one should also account for products that the company has already developed, and the distribution systems that it has in-place to sell them. The value of future new business attempts to encapsulate the value of the above, and is often referred to as the ‘goodwill’ component in the appraisal value.
The value of future new business can be calculated in one of two main ways. Both use a model to project future cash flows on a set of assumptions, i.e., a similar method to that used to value in-force business.
The simplest way to value future new business is to calculate the value of one year’s sales using the projection model, and then applying a multiple to it. The multiple used would implicitly reflect the discount rate, the assumed growth rate in new business volumes and any assumed ‘profit squeeze’ in the future. The ‘profit squeeze’ is a conservative adjustment that reflects:
An assumption that over time, competitive forces will erode some of the margins on profitable new business.
The extra uncertainty involved in making assumptions about the profitability of new business, the further into the future one looks.
The other method involves making explicit assumptions about sales volumes in each future year (by product), and then projecting these sales into the future. The cash flows from each year’s sales are overlaid on one another, and the combined cash flows are discounted at the risk discount rate.
Calculation of implied valuation metrics • Price/EV = (Price - value of other operations per share) / EV per share
• New business multiple = (Price - EV per share - value of other operations per share) / Value of one year’s new business per share.
Limitations of EV valuation methodology • Embedded value could fail to warn investors of the impact on insurers from falling
markets via asset/liability mismatch and costly options and guarantees.
• Embedded value could fail to track changes in the risk profile of an individual company.
• Embedded value capitalizes asset risk premiums before actual value creation.
Therefore, the limitations of the embedded value method become more apparent when interest is low and credit quality is poor.
Evolution of EV Leading life insurance firms in Europe have disclosed a form of embedded value dubbed EEV, European embedded value, since May 2004 when EEV principles were published by the CFO Forum. These principles attempted to address criticisms to the old methodology, TEV, traditional embedded value, and facilitated the implementation of market consistent valuation methods, which led many leading insurance companies in Europe to disclose EEV based on market-consistent approaches.
Many insurance companies in Europe disclose MCEV as part of their financial reports and use it as an internal management tool, so the CFO Forum published MCEV Principles in June 2008 in order to make EV information effective and appropriate for investors by streamlining MCEV disclosure standards for international use.

Nomura | AEJ Korea Life Insurance May 16, 2011
45
Fig. 105: MCEV vs TEV- Differences
Source: Nomura research
MCEV TEV
Total net assets section Total net assets section
Reserv e f or price f luctuations (excluding net unrealised gains/losses on bonds)
Contingency reserv e Reserv e f or price f luctuations
Reserv e f or possible loan losses Contingency reserv e
Net unrealised gains/losses on land and buildings Reserv e f or possible loan losses
Unf unded pension liability (deducting item) Net unrealised gains/losses on land
Intangible f ixed assets (deducting item) Unf unded pension liability (deducting item)
PV of certainty -equiv alent prof it
(discount rate: risk f ree rate)
Time v alue of options and guarantees
(deducting items)
(The dif f erence between the presetn v alue of certainty equiv alent
prof it and the present v alue of stochastic f uture prof its)
Present v alue of f uture af ter tax-prof its
(discount rate: risk f ree rate + risk premiums)
Cost of capital (deducting item) Cost of capital (decuting item)
Frictional costs (deducting item) Cost of minimum guarantee f or existing v ariable
(The present v alue of inv estment cost and taxes on assets backing
the required capital at each point of time in the f uture
lif e insurance (deducting item)
Cost of non-hedeable risks (deducting item)
(allowance f or the uncertainty of non-economic assumptions, the cost
of non-hedgeable economic risks as well as other risks that are not
ref lected on the other assumptions
Adjusted net worth
Value of existing
business

Nomura | AEJ Korea Life Insurance May 16, 2011
46
Appendix 2: Life insurer M&A landscape
Fig. 106: Korea life insurance M&A history
Source: Nomura research

Key company data: See page 2 for company data, and detailed price/index chart. Rating: See report end for details of Nomura’s rating system.
Samsung Life 032830.KS 032830 KS
INSURANCE
EQUITY RESEARCH
Meet Korea's fastest-growing life insurer
16% EV growth for next four years, trading at 0.8x P/EV; bullish on Samsung Group
May 16, 2011
Rating Starts at
Buy
Target price Starts at150,000 KRW 150,000
Closing price May 12, 2011 KRW 98,000
Potential upside +53.1%
Initiating coverage with BUY We initiate coverage of Samsung Life with a Buy rating and a PT of W150,000, implying 53% upside potential. Samsung Life is the largest life insurer in Korea and the quasi holding company of Samsung Group.
16% EV growth for next four years We expect Samsung’s EV (ex-affiliate stakes) to grow on average 16% a year for the next four years, driven by strong growth in the value of in-force (VIF) business and the unwinding of its profitable in-force book. We also expect solid value of new business (VNB) growth as its hiring cycle starts and ventures out to non-traditional channels.
Buying at the bottom of rate cycle Samsung’s insurance business (ex-affiliate stakes) is trading at 0.8x forward P/EV despite its strong growth profile. We think the stock is trading at a depressed level due to a flatter yield curve. However, we expect the long-end to be lifted starting in 2H10 with 1) continuous rate hikes by the BOK, 2) rising expected inflation, and 3) tightening by ECB and QE2 ending.
We are bullish on Samsung Group Our technology analyst CW Chung is bullish on Samsung Electronics (33% of Samsung Life's book value) with a PT of W1,350,000 (53% upside). Our financial services analyst Gil Hyung Kim is also bullish on Samsung Card (6% of Samsung Life's book value) with a PT of W67,000 (26% upside).
31 Mar FY10 FY11F FY12F FY13F
Currency (KRW) Actual Old New Old New Old New
Net premium (bn) 14,862 0 14,898 0 15,017 0 15,167
Reported net profit (bn) 1,934 1,172 1,309 1,509
Normalised net profit (bn) 1,934 1,172 1,309 1,509
Normalised EPS 9,668.9 5,859.0 6,546.7 7,544.6
Norm. EPS growth (%) 113.4 -39.4 11.7 15.2
Norm. P/E (x) 10.1 N/A 16.7 N/A 15.0 N/A 13.0
Price/EV (x) 1.0 N/A 0.9 N/A 0.8 N/A 0.7
Price/implied VNB (x) -0.8 N/A -2.6 N/A -4.2 N/A -5.8
Dividend yield (%) 2.0 N/A 2.0 N/A 2.0 N/A 2.6
ROE (%) 14.1 7.4 7.9 8.6
ROA (%) 1.4 0.0 0.8 0.0 0.8 0.0 0.9
Source: Nomura estimates
Anchor themes
Korean lifers, in our view, can deliver double-digit EV growth. While they trade like ex-growth companies due to a flatter yield curve, we believe the long-end of the yield curve will start to rise in 2H11F.
Nomura vs consensus
Our price target, 11% higher than consensus, is the highest on the Street.
Research analysts
Korea Insurance
Michael Na - NFIK [email protected] +82 2 3783 2334
Young Kwon Kim - NFIK [email protected] +82 2 3783 2339
See Appendix A-1 for analyst certification and important disclosures. Analysts employed by non US affiliates are not registered or qualified as research analysts with FINRA in the US.

Nomura | ASIA Samsung Life May 16, 2011
48
Key data on Samsung Life Profit and Loss (KRWbn) Year-end 31 Mar FY09 FY10 FY11F FY12F FY13FGross premiums 14,515 14,883 14,912 15,032 15,182Government charges
Reinsurance ceded -21 -21 -15 -15 -15Net written premium 14,494 14,862 14,898 15,017 15,167Change in unearned premium reserves
Net earned premium 14,494 14,862 14,898 15,017 15,167Claims and benefit payments -11,586 -10,374 -11,255 -11,327 -11,422Change in reserves -4,485 -6,548 -5,696 -5,697 -5,709Commission and DAC expenses -1,903 -1,657 -1,768 -1,851 -1,916Other expenses -1,341 -1,594 -1,474 -1,395 -1,341Underwriting surplus -4,821 -5,311 -5,295 -5,253 -5,221Recurrent investment income 5,501 6,584 6,227 6,286 6,484Realised and unrealised gains
Investment income 5,501 6,584 6,227 6,286 6,484Other income
Employee share expense
Operating profit 681 1,273 932 1,033 1,263Amortisation
Other non-operating income 488 1,237 614 646 671Associates and JCEs
Pre-tax profit 1,169 2,510 1,546 1,679 1,935Income tax -263 -576 -374 -369 -426Net profit after tax 906 1,934 1,172 1,309 1,509Minority interests
Other items
Preferred dividends
Normalised NPAT 906 1,934 1,172 1,309 1,509Extraordinary items
Reported NPAT 906 1,934 1,172 1,309 1,509Dividends -225 -400 -400 -400 -500Transfer to retained earnings 681 1,534 772 909 1,009
Valuation and ratio analysis
FD normalised P/E (x) 21.6 10.1 16.7 15.0 13.0FD normalised P/E at price target (x) 33.3 15.6 25.8 23.1 20.0Reported P/E (x) 21.6 10.1 16.7 15.0 13.0Dividend yield (%) 1.1 2.0 2.0 2.0 2.6Price/book (x) 1.6 1.3 1.2 1.1 1.1Investment return (%) 5.33 5.82 5.11 4.92 4.83Recurrent investment return (%) 5.33 5.82 5.11 4.92 4.83Non-recurrent return/invt. return (%) 0.0 0.0 0.0 0.0 0.0Price/EV (x) 1.2 1.0 0.9 0.8 0.7Price/implied VNB (x) 2.8 -0.8 -2.6 -4.2 -5.8Loss ratio (%)
Combined ratio (%)
Effective tax rate (%) 22.5 23.0 24.2 22.0 22.0Dividend payout (%) 24.8 20.7 34.1 30.5 33.1ROE (%) 9.3 14.1 7.4 7.9 8.6ROA (%) 0.71 1.38 0.78 0.83 0.91ROR (%) na na na na na
Growth (%)
Life premiums 2.5 0.2 0.8 1.0Non life premiums na na na naNet profit 113.4 -39.4 11.7 15.2Normalised EPS 113.4 -39.4 11.7 15.2Normalised FDEPS 113.4 -39.4 11.7 15.2Source: Nomura estimates
Notes
No more significant variances expected going forward.
Price and price relative chart (one year)
(%) 1M 3M 12M
Absolute (KRW) -1.3 -4.9 -14.0
Absolute (USD) -1.5 -1.5 -10.4
Relative to index -3.1 -12.6 -42.8
Market cap (USDmn) 17,916.2
Estimated free float (%) 52-week range (KRW)
121000/95500
3-mth avg daily turnover (USDmn)
38.85
Major shareholders (%) Lee, Gun hee 20.8
Samsung Everland 19.3
95000
100000
105000
110000
115000
60
70
80
90
100
110Ju
n 10
Jul 1
0
Aug
10
Sep
10
Oct
10
Nov
10
Dec
10
Jan
11
Feb
11
Mar
11
Apr
11
May
11
PriceRel MSCI Korea(KRW)
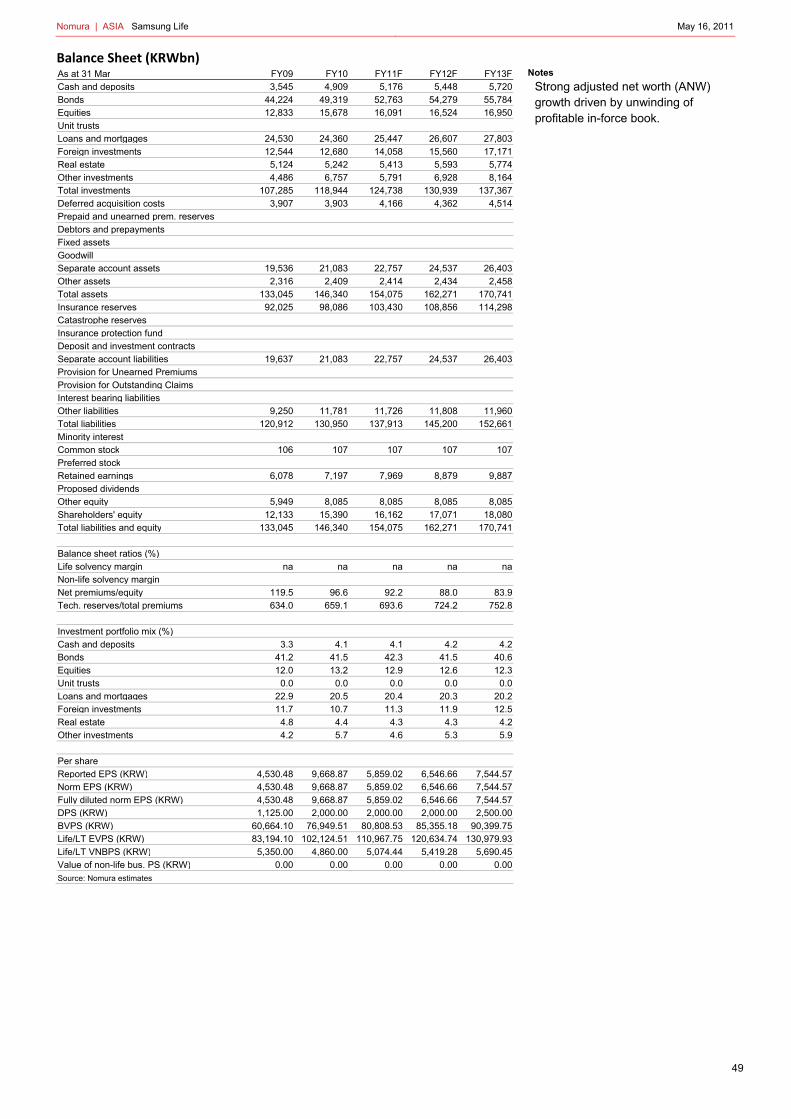
Nomura | ASIA Samsung Life May 16, 2011
49
Balance Sheet (KRWbn) As at 31 Mar FY09 FY10 FY11F FY12F FY13FCash and deposits 3,545 4,909 5,176 5,448 5,720Bonds 44,224 49,319 52,763 54,279 55,784Equities 12,833 15,678 16,091 16,524 16,950Unit trusts
Loans and mortgages 24,530 24,360 25,447 26,607 27,803Foreign investments 12,544 12,680 14,058 15,560 17,171Real estate 5,124 5,242 5,413 5,593 5,774Other investments 4,486 6,757 5,791 6,928 8,164Total investments 107,285 118,944 124,738 130,939 137,367Deferred acquisition costs 3,907 3,903 4,166 4,362 4,514Prepaid and unearned prem. reserves
Debtors and prepayments
Fixed assets
Goodwill
Separate account assets 19,536 21,083 22,757 24,537 26,403Other assets 2,316 2,409 2,414 2,434 2,458Total assets 133,045 146,340 154,075 162,271 170,741Insurance reserves 92,025 98,086 103,430 108,856 114,298Catastrophe reserves
Insurance protection fund
Deposit and investment contracts
Separate account liabilities 19,637 21,083 22,757 24,537 26,403Provision for Unearned Premiums
Provision for Outstanding Claims
Interest bearing liabilities
Other liabilities 9,250 11,781 11,726 11,808 11,960Total liabilities 120,912 130,950 137,913 145,200 152,661Minority interest
Common stock 106 107 107 107 107Preferred stock
Retained earnings 6,078 7,197 7,969 8,879 9,887Proposed dividends
Other equity 5,949 8,085 8,085 8,085 8,085Shareholders' equity 12,133 15,390 16,162 17,071 18,080Total liabilities and equity 133,045 146,340 154,075 162,271 170,741
Balance sheet ratios (%)
Life solvency margin na na na na naNon-life solvency margin
Net premiums/equity 119.5 96.6 92.2 88.0 83.9Tech. reserves/total premiums 634.0 659.1 693.6 724.2 752.8
Investment portfolio mix (%)
Cash and deposits 3.3 4.1 4.1 4.2 4.2Bonds 41.2 41.5 42.3 41.5 40.6Equities 12.0 13.2 12.9 12.6 12.3Unit trusts 0.0 0.0 0.0 0.0 0.0Loans and mortgages 22.9 20.5 20.4 20.3 20.2Foreign investments 11.7 10.7 11.3 11.9 12.5Real estate 4.8 4.4 4.3 4.3 4.2Other investments 4.2 5.7 4.6 5.3 5.9
Per share
Reported EPS (KRW) 4,530.48 9,668.87 5,859.02 6,546.66 7,544.57Norm EPS (KRW) 4,530.48 9,668.87 5,859.02 6,546.66 7,544.57Fully diluted norm EPS (KRW) 4,530.48 9,668.87 5,859.02 6,546.66 7,544.57DPS (KRW) 1,125.00 2,000.00 2,000.00 2,000.00 2,500.00BVPS (KRW) 60,664.10 76,949.51 80,808.53 85,355.18 90,399.75Life/LT EVPS (KRW) 83,194.10 102,124.51 110,967.75 120,634.74 130,979.93Life/LT VNBPS (KRW) 5,350.00 4,860.00 5,074.44 5,419.28 5,690.45Value of non-life bus. PS (KRW) 0.00 0.00 0.00 0.00 0.00Source: Nomura estimates
Notes
Strong adjusted net worth (ANW) growth driven by unwinding of profitable in-force book.

Nomura | ASIA Samsung Life May 16, 2011
50
Korea’s fastest-growing life insurer Samsung Life is the largest life insurance company in Korea and the quasi holding company of Samsung Group. We expect its insurance business to deliver strong EV growth in the medium term. In addition, we are bullish on Samsung Electronics, which makes up 33% of its shareholders’ equity.
Strong EV growth
RoEV of 17.5% and 16.4% for FY11F and FY12F We expect Samsung’s insurance business (ex-affiliate stakes) to deliver RoEV of 17.5% and 16.4% for FY11F and FY12F, respectively, driven by strong growth in the value of in-force (VIF) business and the unwinding of its profitable in-force book.
Quality growth driven by new business We think that new business (VNB) contribution to EV growth should be significant, as it makes up 24% of VIF. In our view, growth driven by new business is healthier and deserves higher valuation. We expect 52% and 51% of RoEV should come from new business for FY11F and FY12F, respectively.
Solid VNB growth We expect VNB growth of 4.4% and 6.8% for FY11F and FY12F, respectively. Although, we expect new business margin to fall due to an increase in wealth accumulation products, the volume growth should be more than enough to offset margin compression as the company aggressively ramps up its traditional solicitor channel and ventures out to non-traditional channels. In terms of the solicitor restructuring cycle, we think the company is passing through a trough. The company noted that the number of exclusive solicitors dropped due to layoffs of ineffective solicitors.
Long-term growth opportunity from corporate pension Although, it may not contribute to the bottom line in a meaningful way in the near term, the rapidly growing corporate pension market should be positive for Samsung Life, which has the largest captive market. If Samsung Life maintains its current market share of 15.2% and earns 60bps on pension assets, as it expects, then the company should generate W142bn in operating profit by FY20F, when the corporate pension market is expected to reach W156tr in assets according to Korea Capital Market Institute.
Holding company value to rise
Bullish on Samsung Group Samsung Life is a quasi holding company of Samsung Group. Major stakes include 7.21% in Samsung Electronics, 26.41% in Samsung Card, 10.36% in Samsung F&M and 11.38% in Samsung Securities. Our technology analyst CW Chung is bullish on Samsung Electronics and has a PT of W1,350,000 (52% upside). Our financial analyst Gil Hyung Kim is also positive on Samsung Card and has a PT of W67,000 (28% upside).
Shareholders’ proportion rising Currently, unrealized gains from affiliate holdings are split between shareholders and policyholders. We should also note that the shareholders’ proportion should increase by 1.4ppt a year going forward as reserve relating to participating policies as a proportion of total reserve declines.
Buying at the bottom of rate cycle
A 50bps increase in investment yield assumption should boost EV by 12.8% The benefit from rising interest rates is clearly evident for Samsung Life given that fixed-rate policies make up 60% of its in-force book. A 50bps increase in investment yield assumption should boost EV by 12.8%.
Nomura | ASIA Samsung Life May 16, 2011
51
Trading at 0.8x P/EV Samsung Life (ex-affiliate stakes) is trading at 0.8x forward P/EV. We think that the stock is trading at a depressed level due to a flatter yield curve. Although the BOK has raised the key policy rate by 100bps since July 2010, the long-end of the yield curve has been falling continuously. However, we believe the long-end should be lifted starting in 2H11.
Rate hike campaign to continue Our economist Young Sun Kwon expects two more rate hikes for the rest of 2011, and another two in 1H12, lifting the terminal policy rate of the current cycle to 4.0% by 2Q12. Meanwhile, he thinks that real policy rates should remain negative, doing little to limit inflationary pressure, unless it is combined with KRW appreciation.
Bond market will eventually react to growing concerns on inflation Young Sun noted that CPI inflation should rise above 4% in 2011, exceeding the BOK's target band. Interest rate hikes coupled with a stronger KRW and price controls should partly offset cost-push inflation pressures from higher oil prices. But rising nominal wages and housing rents are also adding to inflation. Young Sun forecasts CPI inflation to rise from 2.9% in 2010 to 4.4% in 2011, before easing to 3.6% in 2012. We think that the long-end of the bond market will eventually react to growing concerns on inflation.
Foreign capital inflow to slow Whether hunting for better yields or betting on KRW appreciation, inflow of foreign capital has been adding pressure on the long-end since 2H09. However, with ECB turning hawkish and the US Fed's QE2 program winding down, we may see foreign capital inflow slowing down and may even see outflow going forward. We think that the long-end of the yield curve could be lifted with rising interest rates in developed markets, as we have seen in 4Q10. In addition, the recent KRW appreciation could hinder foreign capital inflow that is betting on KRW appreciation, putting further pressure on the long-end.
Long-end to rise slowly, but surely Young Sun forecasts the five-year treasury to rise starting in 3Q11 and to reach 4.5% by the end of 1H12 from a current yield of 4.0%, and 4.2% for the three-year treasury from a current yield of 3.6%.
Risk factors
Prolonged low interest environment As market rates fall, the disparity between portfolio rates and new money rates has been widening. In addition to valuation risk, we believe a prolonged low interest environment will impose operational risks: 1) continued reliance on new sales to subsidize in-force business, 2) possible fall into the minimum guarantees zone, 3) negative impact on new business volume due to lower crediting rate, and 4) companies possibly compromising risk management standards in order to pick up additional yield.
Technology industry downturn Samsung Life owns 7.21% of Samsung Electronics, representing 33% of its book value.
Share overhang The combined ownership of Samsung Life by Shinsegae and CJ Group stands at 16.6%. The lock-up period for Shinsegae should end on 12 May 2011. The lock-up period for CJ Group already ended on 12 November 2010. Both parties have shown interest in liquidating their stakes and investing into their core operations or M&A.

Nomura | ASIA Samsung Life May 16, 2011
52
Valuation We derive our PT of W150,000 based on SOTP methodology. We value the insurance business using P/EV methodology, and the affiliate stakes applying a 27% holding company discount to our PT on individual stocks (or current market value for unrated stock).
Samsung Life should be valued on SOTP
Value of affiliate stakes is one of the key share price drivers In our view, Samsung Life share price is driven by three key factors: 1) EV growth, 2) market rates, and 3) value of affiliate stakes. The first two factors should be the same for all life insurers. However, given that affiliate stakes amounts to half of its book value, we cannot treat it like any other equity investments, especially when one single stock (Samsung Electronics) represents 68% of the total affiliate stakes.
Yes, Samsung Electronics' share price performance affects Samsung Life Samsung Life outperformed Korea Life by 8.2% when Samsung Electronics outperformed the KOSPI by 28% from 3 November 2010 to 28 January 2011. However, when the outperformance of Samsung Electronics was halted, Samsung Life moved in tandem with Korea Life. This means that we have to take a view on Samsung Electronics when analyzing Samsung Life.
Fig. 107: Samsung Electronics outperformed the KOSPI from 3 Nov 2010 through 28 Jan 2011
Source: Quantiwise, Nomura research
Fig. 108: Samsung Life outperformed Korea Life from 3 Nov 2010 through 28 Jan 2011
Source: Quantiwise, Nomura research
Fig. 109: Share price from 3 Nov 2010 through 28 Jan 2011 Samsung Life outperformed Korea Life by 8.2%
Source: Quantiwise, Nomura research
Fig. 110: Share price from 28 Jan 2011 through now Samsung Life share price moved in tandem with Korea Life
Source: Quantiwise, Nomura research
95
100
105
110
115
120
125
130
135
140
3-Nov-10 3-Jan-11 3-Mar-11
Samsung Electronics KS KOSPI
Outperformed by 28%
(%)
85
90
95
100
105
110
115
4-Nov-10 4-Dec-10 4-Jan-11 4-Feb-11 4-Mar-11 4-Apr-11
Samsung Life Korea Life
Fig.3
(%)
90
95
100
105
110
2-Nov-10 2-Dec-10 2-Jan-11
Samsung Life Korea Life
Outperformed by 8.2%
(%)
90
95
100
105
110
28-Jan-11 28-Feb-11 31-Mar-11
Samsung Life Korea Life(%)

Nomura | ASIA Samsung Life May 16, 2011
53
Insurance business: W100,000 per share
Valuation attractive, trading at 0.8x forward P/EV We subtract out the value of affiliate stakes in order to obtain an appropriate EV multiple. Based on our analysis, Samsung Life's insurance business is currently trading at 0.8x forward P/EV. The implied multiple appears to be attractive given that we expect average EV growth of 16% a year through FY14F.
Samsung to sustain EV growth of 15%-plus through FY14F We value Samsung Life's insurance business on an embedded-value basis, applying a P/EV multiple of 1.5x forward EV. We have assumed a sustainable RoEV of 15%, a COE of 11% and a growth rate of 3%. Of note, we expect EV growth of 17.5% and 16.4% for FY11F and FY12F, respectively.
EV adjusted to reflect lower market rates We have assumed lower net investment earnings rate (NIER) for the purpose of our EV forecast. Samsung Life uses NIER of 5.2% for its FY10 EV calculation. In comparison, we assume 5.0% (20bps lower than Samsung Life's assumption). In addition, we used risk discount rate of 11% (50bps higher than Samsung Life’s assumption of 10.5%).
Fig. 111: Embedded value projection and PT computation Samsung should be able to sustain EV growth of 15%-plus through FY14F
Source: Company data, Nomura research
We could justify W109,000 per share using appraisal value method The implied NBM is 6.0x at our PT. However, if we were to use the appraisal value methodology, we could justify up to a 7.7x NBM. Of note, we have only reflected a 10-year projection in our NBM calculation. Typically, a 30-year DCF model is used in the region to drive NBM. However, due to the infancy of the EV valuation methodology in Korea, we do not want to pay for more than 10 years.
More appropriate to use P/EV methodology There is upside potential to our PT using the appraisal value methodology. However, we think it is more appropriate to use P/EV methodology for Samsung Life given some negative variance we encountered in EV, which may not be captured in the NBM technique. In addition, the technique ignores near-term changes in the EV growth profile.
Fig. 112: VNB projection and target NBM using appraisal valuation method Our PT would be W109,000 using appraisal valuation method
Source: Nomura research
(Wbn) FY09 FY10 FY11F FY12F FY13F FY14FAdjusted net worth (ANW) 13,685 16,284 17,136 18,085 19,154 20,529 Affiliate stakes (A) 5,084 8,242 8,242 8,242 8,242 8,242 Insurance business book (ANW-A) 8,601 8,042 8,894 9,843 10,912 12,287 Value of in-force business (VIF) 2,954 4,141 5,058 6,042 7,042 7,997 Embedded value (EV) 11,555 12,183 13,952 15,885 17,954 20,284 Growth of EV (RoEV) 8.9% 17.5% 16.4% 15.5% 15.2%Current mkt cap 19,620 19,620 19,620 19,620 19,620 19,620 Mkt Cap - A 14,536 11,378 11,378 11,378 11,378 11,378 P/EV 1.26 0.93 0.82 0.72 0.63 0.56 VNB 1,070 972 1,015 1,084 1,138 1,188 NBM 2.79 (0.83) (2.54) (4.16) (5.78) (7.50)
Target multiple 1.5 Target mkt cap for insurance business 20,000 TP for insurance business 100,000Implied NBM 6.0
(Wbn) FY11F FY12F FY13F FY14F FY15F FY16F FY17F FY18F FY19F FY20FAnnualized premium equivalent (APE) 3,773 4,075 4,319 4,535 4,716 4,905 5,052 5,153 5,256 5,362 New business margin 26.9% 26.6% 26.4% 26.2% 26.1% 25.9% 25.8% 25.7% 25.6% 25.4%Value of new business (VNB) 1,015 1,084 1,138 1,188 1,230 1,272 1,304 1,323 1,343 1,363 Discount factor 1.0 1.1 1.2 1.4 1.5 1.7 1.9 2.1 2.3 2.6 PV of VNB 1,015 976 924 869 810 755 697 637 583 533 Sum of PV 7,799 Implied multiple 7.7
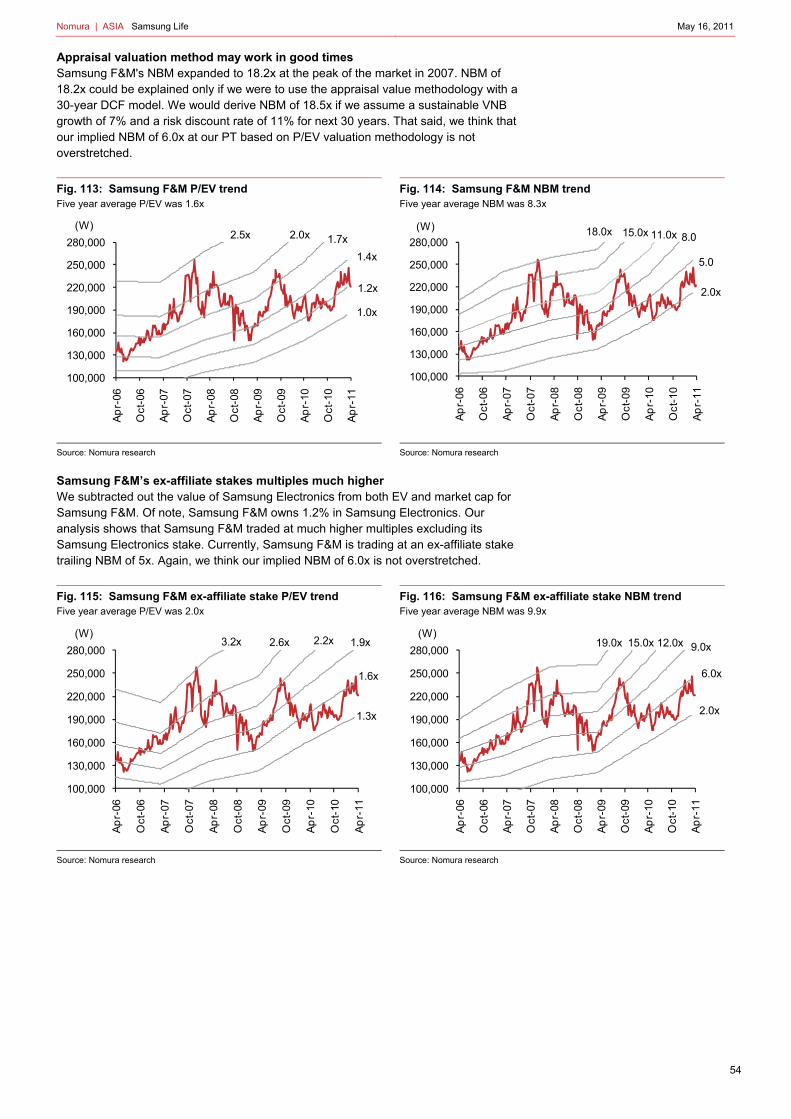
Nomura | ASIA Samsung Life May 16, 2011
54
Appraisal valuation method may work in good times Samsung F&M's NBM expanded to 18.2x at the peak of the market in 2007. NBM of 18.2x could be explained only if we were to use the appraisal value methodology with a 30-year DCF model. We would derive NBM of 18.5x if we assume a sustainable VNB growth of 7% and a risk discount rate of 11% for next 30 years. That said, we think that our implied NBM of 6.0x at our PT based on P/EV valuation methodology is not overstretched.
Fig. 113: Samsung F&M P/EV trend Five year average P/EV was 1.6x
Source: Nomura research
Fig. 114: Samsung F&M NBM trend Five year average NBM was 8.3x
Source: Nomura research
Samsung F&M’s ex-affiliate stakes multiples much higher We subtracted out the value of Samsung Electronics from both EV and market cap for Samsung F&M. Of note, Samsung F&M owns 1.2% in Samsung Electronics. Our analysis shows that Samsung F&M traded at much higher multiples excluding its Samsung Electronics stake. Currently, Samsung F&M is trading at an ex-affiliate stake trailing NBM of 5x. Again, we think our implied NBM of 6.0x is not overstretched.
Fig. 115: Samsung F&M ex-affiliate stake P/EV trend Five year average P/EV was 2.0x
Source: Nomura research
Fig. 116: Samsung F&M ex-affiliate stake NBM trend Five year average NBM was 9.9x
Source: Nomura research
100,000
130,000
160,000
190,000
220,000
250,000
280,000
Ap
r-06
Oct
-06
Ap
r-07
Oct
-07
Ap
r-08
Oct
-08
Ap
r-09
Oct
-09
Ap
r-10
Oct
-10
Ap
r-11
(W)
1.0x
1.2x
1.4x
1.7x2.0x2.5x
100,000
130,000
160,000
190,000
220,000
250,000
280,000
Ap
r-06
Oct
-06
Ap
r-07
Oct
-07
Ap
r-08
Oct
-08
Ap
r-09
Oct
-09
Ap
r-10
Oct
-10
Ap
r-11
(W)
2.0x
5.0
8.011.0x15.0x18.0x
100,000
130,000
160,000
190,000
220,000
250,000
280,000
Ap
r-06
Oct
-06
Ap
r-07
Oct
-07
Ap
r-08
Oct
-08
Ap
r-09
Oct
-09
Ap
r-10
Oct
-10
Ap
r-11
(W)
1.3x
1.6x
1.9x2.2x2.6x3.2x
100,000
130,000
160,000
190,000
220,000
250,000
280,000
Ap
r-06
Oct
-06
Ap
r-07
Oct
-07
Ap
r-08
Oct
-08
Ap
r-09
Oct
-09
Ap
r-10
Oct
-10
Ap
r-11
(W)
2.0x
6.0x
9.0x12.0x15.0x19.0x

Nomura | ASIA Samsung Life May 16, 2011
55
Holding company: W50,000 per share
Samsung Life's affiliate stakes amount to W14.6tr As shown below, Samsung Life's affiliate stakes amount to W14.6tr as of 31 March. Among its holdings, Samsung Electronics makes up 68% of the total value of the affiliate stakes. The company books valuation gains from affiliate stakes as other comprehensive income net of tax and policyholder proportion (currently at 32.1%). We have applied our PT (or current price for unrated stocks) to derive our target NAV.
Fig. 117: Affiliate stake value projection We see 32% upside for the value of affiliate holdings
Note: * reflects current price as of May 11, 2011
Source: Company data, Nomura research
Shareholders’ proportion rising Unrealized gains from affiliate holdings are split between shareholders and policyholders. The policyholders' proportion is the proportion of reserve relating participating policies to total reserve. Currently, policyholders and shareholders proportions are 32% and 68%, respectively. We should note that the shareholders’ proportion should increase by 1.0ppt to 1.4ppt a year going forward, as reserve relating to participating policies as a proportion of total reserve declines.
Accounting # of Shares % holdingMar11 Price
Mar11 (Wbn)
PT or Current
price
Mar12F (Wbn)
Samsung Electronics Cost 10,622,814 7.21% 932,000 9,900 1,350,000 14,341
Samsung Card Equity 32,468,868 26.41% 55,500 1,802 67,000 2,175
Samsung F&M Cost 4,905,718 10.36% 242,500 1,190 223,000 * 1,094
Samsung Securities Cost 7,603,659 11.38% 80,600 613 83,800 * 637
Samsung C&T Cost 7,476,102 4.79% 71,800 537 85,000 635
Samsung Heavy Cost 7,800,000 3.38% 39,900 311 45,300 * 353
S1 Cost 2,030,476 5.34% 56,300 114 50,900 * 103
Hotel Shilla Cost 2,865,158 7.30% 25,550 73 27,100 * 78
Samsung Techwin Cost 289,800 0.55% 79,800 23 95,000 28
Samsung SDI Cost 10,155 0.02% 168,000 2 160,000 2
Cheil Industries Cost 6,871 0.01% 116,500 1 160,000 1
Samsung Futures Equity 1,025,000 41.00% 41 41
Samsung Asset Management Cost 1,024,000 5.49% 21 21
Samsung Economic Research Institute Cost 1,776,000 14.80% 10 10
Samsung Corning Precision Glass Cost 2,176 0.01% 2 2
Total Value 14,639 19,521
Net of holding company discount (27%) 10,687 14,250
Shareholders' proportion (69.3%) 7,406 9,875
Per share (Won) 38,000 50,000

Nomura | ASIA Samsung Life May 16, 2011
56
Fig. 118: Shareholders' proportion of unrealized gains on AFS Shareholders' proportion should increase by 1~1.4ppt every year
Source: Company data, Nomura research
We apply 27% holding company discount Theoretically, we think the holding company discount should be the corporate tax rate (22%). However, in reality the holding company discount varies based on the performance of its holdings and market liquidity. The holding company discount narrows when its holdings outperform the market and vice versa. In addition, abundant market liquidity lowers the discount as well. Given that we are bullish on Samsung Group, the holding company discount could be lower than the tax rate. However, for the purpose of our valuation, we have used 27%, which is the five-year average discount to NAV for LG Corp. We selected LG Corp as a benchmark as we believe it is one of the purest holding companies in Korea, with most of its holdings being listed.
Fig. 119: LG Corp discount to NAV Average discount rate to NAV for the past five years is 27%
Source: Quantiwise, Nomura research
We are bullish on Samsung Electronics Our technology sector analyst CW Chung is bullish on Samsung Electronics with a PT of W1,350,000, implying 52% upside potential. CW believes that earnings will bottom out in 1Q11 and recover thereafter. All four major divisions (Memory, Panels, Handsets and Digital Media) should see earnings improvement going into 2H11 after bottoming out either in 1Q11 or 2Q11. CW derives his PT applying a target P/BV multiple of 2.0x (ROE of 17-18% from 2H11F-FY12F).
39.1%36.4% 34.5% 33.3% 32.1% 30.7%
60.9%63.6% 65.5% 66.7% 67.9% 69.3%
Mar07 Mar08 Mar09 Mar10 Mar11 Mar12F
Policyholders' proportion Shareholders' equity
-20%
-10%
0%
10%
20%
30%
40%
50%
5/2/2006 5/2/2007 5/2/2008 5/2/2009 5/2/2010 5/2/2011
NAV Discount Average St Dev +1 St Dev -1

Nomura | ASIA Samsung Life May 16, 2011
57
Fig. 120: Samsung Electronics EPS vs. share price
Source: Quantiwise, Nomura research
We are also bullish on Samsung Card Our financial sector analyst Gil Hyung Kim is bullish on Samsung Card (the second-largest affiliate holding after Samsung Electronics). Gil Hyung expects a one-off adjusted EPS CAGR of 20% over the next two years for Samsung Card. He expects system card purchase volume to advance in the double digits on the back of 1) migration of consumers to online from offline, 2) inflationary pressure, and 3) extended tax benefits. In addition, funding cost should decline as the company refinance W1.2tn legacy high-yield (=6% annually) debentures issued during the global financial crisis.
Fig. 121: Online sales growth outpacing offline Online purchase requires use of credit card
Source: KOSIS, Nomura research
Fig. 122: Funding cost to fall Average funding cost should normalize at around 5%
Source: DART, KOIFA, Nomura research
Valuation sensitivity
EV sensitive to investment yield and claims ratio assumptions The following chart shows the sensitivity in the EV to changes in some of Samsung Life's key assumptions. A key variable is the investment return assumption. For Samsung Life, this is currently 5.2%, which we believe is aggressive given current market rates. However, our EV forecast already reflects lower market rates. In addition, we believe that we are going through a trough in terms of the interest rate cycle.
(20)
0
20
40
60
80
100
120
140
160
0
200
400
600
800
1,000
1,200
1,400
00 01 02 03 04 05 06 07 08 09 10 11F 12F
Share price (LHS) EPS (RHS)('000 W) ('000 W)
<The lost four years>
(10)
0
10
20
30
40
50
60
1Q
06
2Q
06
3Q
06
4Q
06
1Q
07
2Q
07
3Q
07
4Q
07
1Q
08
2Q
08
3Q
08
4Q
08
1Q
09
2Q
09
3Q
09
4Q
09
1Q
10
2Q
10
3Q
10
4Q
10
Total
Cyber shopping mall
Home shopping
(%)
4.0
5.0
6.0
7.0
8.0
0
200
400
600
800
1,000
1,200
1,400
1,600
1,800
2011 2112 2013 2014 2015+
Amount of debentures maturing (LHS)
Avg Int rate (RHS)
Current yield on 5 yr card bond (RHS)
Current yield on 3 yr card bond (RHS)
(Wbn) (%)

Nomura | ASIA Samsung Life May 16, 2011
58
Fig. 123: EV sensitivity (Wbn)
Source: Company data, Nomura research
Fig. 124: EV sensitivity (%)
Source: Company data, Nomura research
A 50bps increase in investment yield assumption to boost the EV by 12.8%... The sensitivity analysis indicates a 50bps increase in investment yield assumption would boost the EV by 12.8% (ex-affiliate stakes).
…but would only increase our PT by 4% In effect, that would increase our PT by 4%. We should note that the affect on VNB from changing investment yield assumption is limited, since most of new businesses are floating rate policies. That said, higher EV due to an increase in investment yield assumptions would eliminate the base effect and should result in a lower RoEV. Hence, our target multiple would have to be lowered to 1.4x. However, we think RoEV should pick up in the longer term as higher market rates flow through its fixed income portfolio.
Fig. 125: EV projection and PT assuming 50bps increase in NIER Our PT would increase by 4% assuming 50bps increase in NIER
Source: Company data, Nomura research
VNB sensitive to discount rate and lapse ratio VNB is not sensitive to interest rates given that most of new businesses are floating rate policies. VNB is rather sensitive to the lapse ratio since most cancellations occur in the first 25 months, and by definition new business include policies acquired in the past year.
(2,000)
(1,500)
(1,000)
(500)
-
500
1,000
1,500
2,000
Dis
co
unt r
ate
±1%
NIE
R ±
50bp
s
RB
C ±
50p
pt
Lap
se ±
10%
Cla
ims ±
10%
Main
ten
ance
±10%
AF
S a
ffilia
te s
takes ±
10%
(Wbn)
12.8% 14.4%
-20%
-15%
-10%
-5%
0%
5%
10%
15%
20%
Dis
co
unt r
ate
±1%
NIE
R ±
50bp
s
RB
C ±
50p
pt
Lap
se ±
10%
Cla
ims ±
10%
Main
ten
ance
±10%
AF
S a
ffilia
te s
takes ±
10%
(Wbn) FY09 FY10 FY11F FY12F FY13F FY14FAdjusted net worth (ANW) 13,685 16,284 17,136 18,085 19,162 20,628 Affiliate stakes (A) 5,084 8,242 8,242 8,242 8,242 8,242 Insurance business book (ANW-A) 8,601 8,042 8,894 9,843 10,920 12,386 Value of in-force business (VIF) 3,914 5,041 6,052 7,121 8,230 9,224 Embedded value (EV) 12,515 13,083 14,946 16,964 19,149 21,610 Growth of EV (RoEV) 7.7% 17.0% 15.9% 15.2% 14.9%Current mkt cap 19,620 19,620 19,620 19,620 19,620 19,620 Mkt Cap - A 14,536 11,378 11,378 11,378 11,378 11,378 P/EV 1.16 0.87 0.76 0.67 0.59 0.53 VNB 1,070 972 1,015 1,084 1,138 1,188 NBM 1.89 (1.75) (3.52) (5.15) (6.83) (8.61)
Target multiple 1.4 Target mkt cap for insurance business 20,900 TP for insurance business 104,000Implied NBM 5.9

Nomura | ASIA Samsung Life May 16, 2011
59
Fig. 126: VNB sensitivity (Won)
Source: Company data, Nomura research
Fig. 127: VNB sensitivity (%)
Source: Company data, Nomura research
-150
-100
-50
0
50
100
150
Dis
co
unt r
ate
±1%
NIE
R ±
50bp
s
RB
C ±
50p
pt
Lap
se ±
10%
Cla
ims ±
10%
Main
ten
ance
±10%
(Wbn)
9.3%10.5%
-15%
-10%
-5%
0%
5%
10%
15%
Dis
count r
ate ±
1%
NIE
R ±
50bp
s
RB
C ±
50p
pt
Lap
se ±
10%
Cla
ims ±
10%
Main
ten
ance
±10%
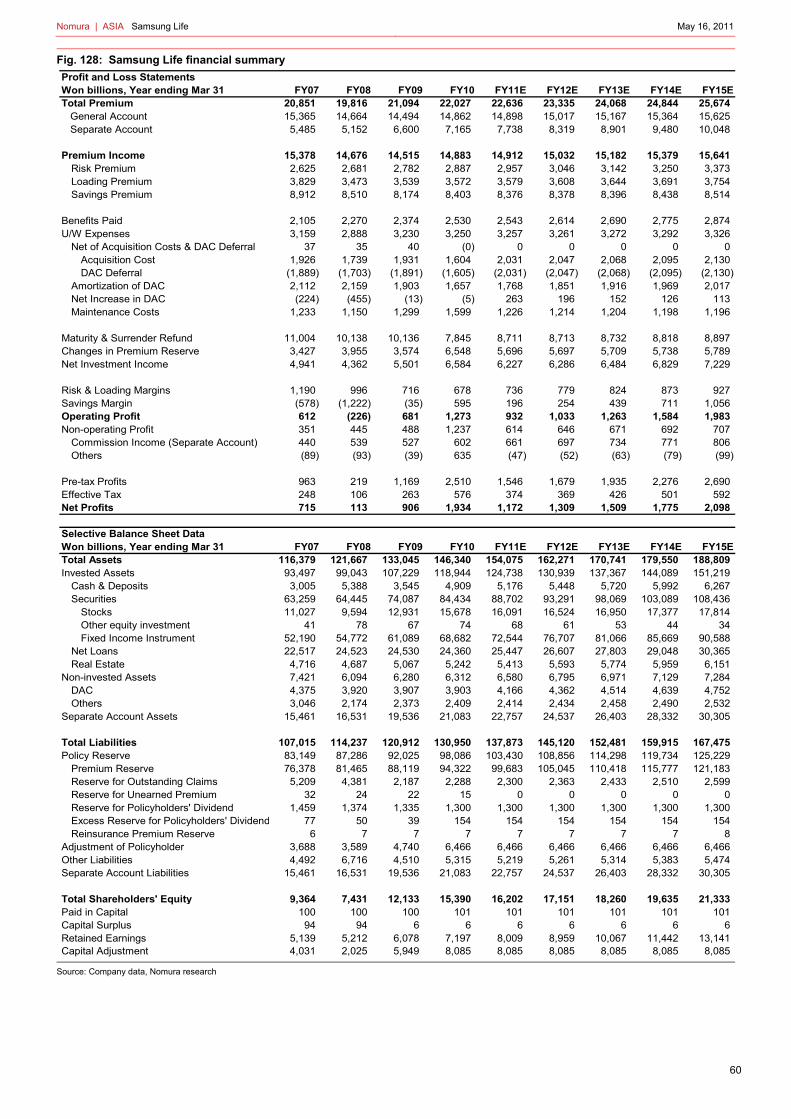
Nomura | ASIA Samsung Life May 16, 2011
60
Fig. 128: Samsung Life financial summary
Source: Company data, Nomura research
Profit and Loss StatementsWon billions, Year ending Mar 31 FY07 FY08 FY09 FY10 FY11E FY12E FY13E FY14E FY15ETotal Premium 20,851 19,816 21,094 22,027 22,636 23,335 24,068 24,844 25,674 General Account 15,365 14,664 14,494 14,862 14,898 15,017 15,167 15,364 15,625 Separate Account 5,485 5,152 6,600 7,165 7,738 8,319 8,901 9,480 10,048
Premium Income 15,378 14,676 14,515 14,883 14,912 15,032 15,182 15,379 15,641Risk Premium 2,625 2,681 2,782 2,887 2,957 3,046 3,142 3,250 3,373Loading Premium 3,829 3,473 3,539 3,572 3,579 3,608 3,644 3,691 3,754Savings Premium 8,912 8,510 8,174 8,403 8,376 8,378 8,396 8,438 8,514
Benefits Paid 2,105 2,270 2,374 2,530 2,543 2,614 2,690 2,775 2,874U/W Expenses 3,159 2,888 3,230 3,250 3,257 3,261 3,272 3,292 3,326
Net of Acquisition Costs & DAC Deferral 37 35 40 (0) 0 0 0 0 0Acquisition Cost 1,926 1,739 1,931 1,604 2,031 2,047 2,068 2,095 2,130DAC Deferral (1,889) (1,703) (1,891) (1,605) (2,031) (2,047) (2,068) (2,095) (2,130)
Amortization of DAC 2,112 2,159 1,903 1,657 1,768 1,851 1,916 1,969 2,017Net Increase in DAC (224) (455) (13) (5) 263 196 152 126 113Maintenance Costs 1,233 1,150 1,299 1,599 1,226 1,214 1,204 1,198 1,196
Maturity & Surrender Refund 11,004 10,138 10,136 7,845 8,711 8,713 8,732 8,818 8,897Changes in Premium Reserve 3,427 3,955 3,574 6,548 5,696 5,697 5,709 5,738 5,789Net Investment Income 4,941 4,362 5,501 6,584 6,227 6,286 6,484 6,829 7,229
Risk & Loading Margins 1,190 996 716 678 736 779 824 873 927Savings Margin (578) (1,222) (35) 595 196 254 439 711 1,056Operating Profit 612 (226) 681 1,273 932 1,033 1,263 1,584 1,983Non-operating Profit 351 445 488 1,237 614 646 671 692 707
Commission Income (Separate Account) 440 539 527 602 661 697 734 771 806Others (89) (93) (39) 635 (47) (52) (63) (79) (99)
Pre-tax Profits 963 219 1,169 2,510 1,546 1,679 1,935 2,276 2,690Effective Tax 248 106 263 576 374 369 426 501 592Net Profits 715 113 906 1,934 1,172 1,309 1,509 1,775 2,098
Selective Balance Sheet DataWon billions, Year ending Mar 31 FY07 FY08 FY09 FY10 FY11E FY12E FY13E FY14E FY15ETotal Assets 116,379 121,667 133,045 146,340 154,075 162,271 170,741 179,550 188,809Invested Assets 93,497 99,043 107,229 118,944 124,738 130,939 137,367 144,089 151,219
Cash & Deposits 3,005 5,388 3,545 4,909 5,176 5,448 5,720 5,992 6,267Securities 63,259 64,445 74,087 84,434 88,702 93,291 98,069 103,089 108,436
Stocks 11,027 9,594 12,931 15,678 16,091 16,524 16,950 17,377 17,814Other equity investment 41 78 67 74 68 61 53 44 34Fixed Income Instrument 52,190 54,772 61,089 68,682 72,544 76,707 81,066 85,669 90,588
Net Loans 22,517 24,523 24,530 24,360 25,447 26,607 27,803 29,048 30,365Real Estate 4,716 4,687 5,067 5,242 5,413 5,593 5,774 5,959 6,151
Non-invested Assets 7,421 6,094 6,280 6,312 6,580 6,795 6,971 7,129 7,284DAC 4,375 3,920 3,907 3,903 4,166 4,362 4,514 4,639 4,752Others 3,046 2,174 2,373 2,409 2,414 2,434 2,458 2,490 2,532
Separate Account Assets 15,461 16,531 19,536 21,083 22,757 24,537 26,403 28,332 30,305
Total Liabilities 107,015 114,237 120,912 130,950 137,873 145,120 152,481 159,915 167,475Policy Reserve 83,149 87,286 92,025 98,086 103,430 108,856 114,298 119,734 125,229
Premium Reserve 76,378 81,465 88,119 94,322 99,683 105,045 110,418 115,777 121,183Reserve for Outstanding Claims 5,209 4,381 2,187 2,288 2,300 2,363 2,433 2,510 2,599Reserve for Unearned Premium 32 24 22 15 0 0 0 0 0Reserve for Policyholders' Dividend 1,459 1,374 1,335 1,300 1,300 1,300 1,300 1,300 1,300Excess Reserve for Policyholders' Dividend 77 50 39 154 154 154 154 154 154Reinsurance Premium Reserve 6 7 7 7 7 7 7 7 8
Adjustment of Policyholder 3,688 3,589 4,740 6,466 6,466 6,466 6,466 6,466 6,466Other Liabilities 4,492 6,716 4,510 5,315 5,219 5,261 5,314 5,383 5,474Separate Account Liabilities 15,461 16,531 19,536 21,083 22,757 24,537 26,403 28,332 30,305
Total Shareholders' Equity 9,364 7,431 12,133 15,390 16,202 17,151 18,260 19,635 21,333Paid in Capital 100 100 100 101 101 101 101 101 101Capital Surplus 94 94 6 6 6 6 6 6 6Retained Earnings 5,139 5,212 6,078 7,197 8,009 8,959 10,067 11,442 13,141Capital Adjustment 4,031 2,025 5,949 8,085 8,085 8,085 8,085 8,085 8,085

Nomura | ASIA Samsung Life May 16, 2011
61
Fig. 129: Samsung Life per share data and performance ratios
Source: Company data, Nomura research
Per share dataWon billions, Year ending Mar 31 FY07 FY08 FY09 FY10 FY11E FY12E FY13E FY14E FY15EEarnings Per Share (Won) 35,729 5,651 4,530 9,669 5,859 6,547 7,545 8,875 10,492Book Value Per Share (Won) 468,209 371,526 60,664 76,950 81,009 85,755 91,300 98,175 106,666ROA (%) 0.6 0.1 0.7 1.4 0.8 0.8 0.9 1.0 1.1ROE (%) 7.9 1.3 9.3 14.1 7.4 7.9 8.5 9.4 10.2EPS Growth (%) 38.9 (84.2) (19.8) 113.4 (39.4) 11.7 15.2 17.6 18.2
Gross Dividend 40 40 225 400 360 360 400 400 400DPS (Won) 2,000 2,000 1,125 2,000 1,800 1,800 2,000 2,000 2,000Dividend Payout Ratio (%) 5.6 35.4 24.8 6.0 6.0 6.0 5.5 5.5 5.0Issued Shares (million) - Common 20 20 200 200 200 200 200 200 200
Performance ratiosWon billions, Year ending Mar 31 FY07 FY08 FY09 FY10 FY11E FY12E FY13E FY14E FY15EGrowth (%)Total Premium 2.5 (5.0) 6.4 4.4 2.8 3.1 3.1 3.2 3.3 General Account (0.5) (4.6) (1.2) 2.5 0.2 0.8 1.0 1.3 1.7 Separate Account 12.1 (6.1) 28.1 8.6 8.0 7.5 7.0 6.5 6.0Risk Margin 57.5 (21.0) (0.8) (12.4) 16.0 4.5 4.6 4.9 5.2Loading Margin (32.3) (12.7) (47.3) 4.3 0.2 7.5 7.3 7.3 7.3Savings Margin NM NM NM NM (0.7) 0.3 0.7 0.6 0.5Commission Income 39.1 22.4 (2.1) 14.1 9.8 5.6 5.3 5.0 4.6Net Profits 38.9 (84.2) 701.7 113.4 (39.4) 11.7 15.2 17.6 18.2Total Assets 6.9 4.5 9.4 10.0 5.3 5.3 5.2 5.2 5.2Invested Assets 7.9 5.9 8.3 10.9 4.9 5.0 4.9 4.9 4.9Net Loans 18.1 8.9 0.0 (0.7) 4.5 4.6 4.5 4.5 4.5Policy Reserve 4.5 5.0 5.4 6.6 5.4 5.2 5.0 4.8 4.6Shareholders' Equity 7.0 (20.6) 63.3 26.8 5.3 5.9 6.5 7.5 8.6
Premium Income Mix (%)Risk Premium 17.1 18.3 19.2 19.4 19.8 20.3 20.7 21.1 21.6Loading Premium 24.9 23.7 24.4 24.0 24.0 24.0 24.0 24.0 24.0Savings Premium 57.9 58.0 56.3 56.5 56.2 55.7 55.3 54.9 54.4
Margin Analysis (%)Risk Margin / Risk Premium 19.8 15.3 14.7 12.4 14.0 14.2 14.4 14.6 14.8Loading Margin / Loading Premium 17.5 16.8 8.7 9.0 9.0 9.6 10.2 10.8 11.4Savings Margin / Savings Premium (6.5) (14.4) (0.4) 7.1 2.3 3.0 5.2 8.4 12.4Net Investment Yield 5.6 4.6 5.5 6.0 5.2 5.0 5.0 5.0 5.0Net Interest Margin 6.1 6.2 6.0 6.3 5.7 5.4 5.3 5.3 5.3Effective Comm. Rate on Separate Account 3.0 3.4 2.9 3.0 2.9 2.8 2.8 2.7 2.7
Investment Mix (%)Cash & deposits 3.2 5.4 3.3 4.1 4.1 4.2 4.2 4.2 4.1Securities 67.7 65.1 69.1 71.0 71.1 71.2 71.4 71.5 71.7Net loans 24.1 24.8 22.9 20.5 20.4 20.3 20.2 20.2 20.1Real estate 5.0 4.7 4.7 4.4 4.3 4.3 4.2 4.1 4.1
Securities Mix (%)Stock 17.4 14.9 17.5 18.6 18.1 17.7 17.3 16.9 16.4Other equity investment 0.1 0.1 0.1 0.1 0.1 0.1 0.1 0.0 0.0Gov't and public bonds 33.7 32.4 31.7 32.4 34.4 34.2 33.9 33.6 33.3Special bonds 16.1 18.4 21.8 22.5 21.2 20.0 18.7 17.5 16.2Corporate bonds 4.3 4.1 3.6 3.6 3.8 4.0 4.3 4.5 4.8Beneficiary certificates 6.6 6.1 4.9 4.9 5.3 5.6 6.0 6.3 6.7Overseas securities 20.4 20.5 16.9 15.0 15.8 16.7 17.5 18.3 19.2Structured securities 0.0 0.0 0.0 0.0 0.5 1.0 1.5 2.0 2.5Others 1.5 0.7 1.0 0.6 0.7 0.7 0.8 0.9 0.9
Balance Sheet Strucuture (%)Avg Equity/Avg Assets 8.0 7.1 7.7 9.9 10.5 10.5 10.6 10.8 11.1Avg Invested Assets / Avg Asets 80.0 80.9 81.0 81.0 81.1 80.8 80.6 80.3 80.2Avg Separate Account Assets / Avg Asets 12.8 13.4 14.2 14.5 14.6 15.0 15.3 15.6 15.9Policy Reserve / Premium Income 540.7 594.8 634.0 659.1 693.6 724.2 752.8 778.5 800.7Period-End Equity/Assets 8.0 6.1 9.1 10.5 10.5 10.6 10.7 10.9 11.3Avg Equity / Premium Income 58.9 57.2 67.4 92.5 105.9 110.9 116.6 123.2 131.0Solvency Margin Ratio 292.1 238.1 332.8 395.4 411.9 429.2 448.7 472.0 499.6

Nomura | ASIA Samsung Life May 16, 2011
62
Strong EV growth We expect Samsung Life to post average EV (ex-affiliate stakes) growth of 17.5% and 16.4% for FY11F and FY12F, respectively, driven by strong growth in VIF and the unwinding of the profitable in-force book. The contribution from new business should be significant, as VNB makes up 24% of VIF.
VIF growth of 22% and 20% for FY11F and FY12F
Starting from a low base We believe that Samsung Life's VIF is relatively low compared to its size and the volume of its business due to "negative spread" policies. Policies written prior to FY01 carry negative value, mainly due to the high guarantee crediting rates. Total negative value (PV of pre-tax profits) contributed by these legacy policies amounts to W3.1tr as of September 2009. With lower NIER assumption we could safely assume that VIF did not have much value in it until very recently.
Fig. 130: PV of pre-tax profit by policy type (Sep 09) NIER assumption of 5.6% was used for information presented here
Source: Company data, Nomura research
Fig. 131: PV of pre-tax profit by contract year (Sep 09) NIER assumption of 5.6% was used for information presented here
Source: Company data, Nomura research
Significant contribution from VNB We expect strong VIF growth given that VNB made up 24% of VIF as of 31 March 2011, based on our adjusted numbers. Of note, we have adjusted VIF by lowering NIER to 5% from 5.2% in order to reflect lower market rates. In addition, we used discount rate of 11% compared to 10.5% for Samsung Life. We estimate VIF growth of 22% and 20% for FY11F and FY12F, respectively.
Quality growth driven by new business In our view, growth driven by new business is healthier and deserves higher valuation. We expect 52% and 51% of RoEV to be generated by addition of new business for FY11F and FY12F, respectively.
9,762
179
3,115
0
2,000
4,000
6,000
8,000
10,000
12,000
Non-par Par non-negative
Parnegative
PV of pre-tax profits = W6,826bn
(3,000)(2,500)(2,000)(1,500)(1,000)
(500)0
500 1,000 1,500 2,000
~CY
97
CY
98
CY
99
CY
00
CY
01
CY
02
CY
03
CY
04
CY
05
CY
06
CY
07
CY
08
CY
09
PV of pre-tax profit by contracty year(Wbn)

Nomura | ASIA Samsung Life May 16, 2011
63
Fig. 132: VIF growth profile We expect 22% and 20% VIF growth for FY11 and FY12
Source: Nomura Research
Fig. 133: RoEV contribution breakdown We think EV growth driven by new business is healthier
Source: Nomura Research
VNB growth of 4.4% and 6.8% for FY11F and FY12F
Samsung has better policy mix than its peers Samsung has higher new business margin than its peers due to better policy mix (8.9ppt higher than Korea Life and 12.2ppt higher than Tong Yang Life). The company sells more protection-type policies that its peers.
Fig. 134: Policy mix Samsung vs. Industry
Source: Company data, Nomura research
Fig. 135: EV margin by product type
Source: Company data, Nomura research
But VNB fell by 9.5% in FY10 VNB fell by 9.5% in FY10. Annualized premium equivalent (APE) fell by 3.6% due to exclusive solicitor channel restructuring. The company noted that number of exclusive solicitors dropped due to layoffs of ineffective solicitors. In addition, new business margin fell sharply to 27.6% from 29.2% in FY09 due to a shift in policy mix to lower-margin investment-linked insurance products and savings-type policies. Of note, our numbers are based on risk discount rate (RDR) of 11% compared to 10.5% for Samsung Life’s assumed RDR.
4,043 4,958
5,904 6,809
1,015
1,084
1,138
1,188
0
2,000
4,000
6,000
8,000
Mar12 Mar13 Mar14 Mar15
VIF-VNB VNB(Wbn)
8.4% 8.1% 8.0% 9.0%
9.1% 8.4% 7.5% 6.2%
0%
2%
4%
6%
8%
10%
12%
14%
16%
18%
20%
Mar12 Mar13 Mar14 Mar15
RoEV from VIF & ANW RoEV from VBN
35% 31% 37%25%
62%61%
59%
41%
3% 8% 4%
34%
0
20
40
60
80
100
FY07 FY08 FY09 Industry
Protection Annuities Savings(%)
29
50
13
8
Total Protection Annuities Savings
(%)

Nomura | ASIA Samsung Life May 16, 2011
64
Fig. 136: APE trend (Wbn)
Source: Company data, Nomura research
Fig. 137: New business margin trend
Source: Company data, Nomura research
APE recovering already Samsung Life has shown strong recovery in APE in 4QFY11 as the restructuring of exclusive solicitor channel ends. In addition, the new CEO’s strategic change to increase volume through bancassurance made a positive impact on APE.
Fig. 138: Quarterly APE trend (Wbn)
Source: Company data, Nomura research
VNB to rebound in FY11F We expect a sharp recovery of VNB in FY11F growing by 4.4%. Although we expect new business margin to fall due to increase in investment-linked insurance and savings-type policies, the volume growth should be more than enough to offset margin compression, in our view, as the company aggressively ramps up its traditional solicitor channel and ventures out into non-traditional channels.
Fig. 139: Samsung Life’s number of solicitor YoY change
Source: FISIS, Nomura research
Fig. 140: Number of solicitors by company
Source: FISIS, Nomura research
3,6593,526
FY09 FY10
-3.6%
29.2%
27.6%
26.5%
27.0%
27.5%
28.0%
28.5%
29.0%
29.5%
FY09 FY10
267 260286 279
245
301
345328
284 278 271
342
1Q08 2Q08 3Q08 4Q08 1Q09 2Q09 3Q09 4Q09 1Q10 2Q10 3Q10 4Q10
(25,000)
(20,000)
(15,000)
(10,000)
(5,000)
0
5,000
10,000
15,000
1Q00
3Q00
1Q01
3Q01
1Q02
3Q02
1Q03
3Q03
1Q04
3Q04
1Q05
3Q05
1Q06
3Q06
1Q07
3Q07
1Q08
3Q08
1Q09
3Q09
1Q10
3Q10
0
5,000
10,000
15,000
20,000
25,000
30,000
35,000
40,000
45,000
50,000
4Q06
1Q07
2Q07
3Q07
4Q07
1Q08
2Q08
3Q08
4Q08
1Q09
2Q09
3Q09
4Q09
1Q10
2Q10
3Q10
4Q10
Samsung Korea Kyobo
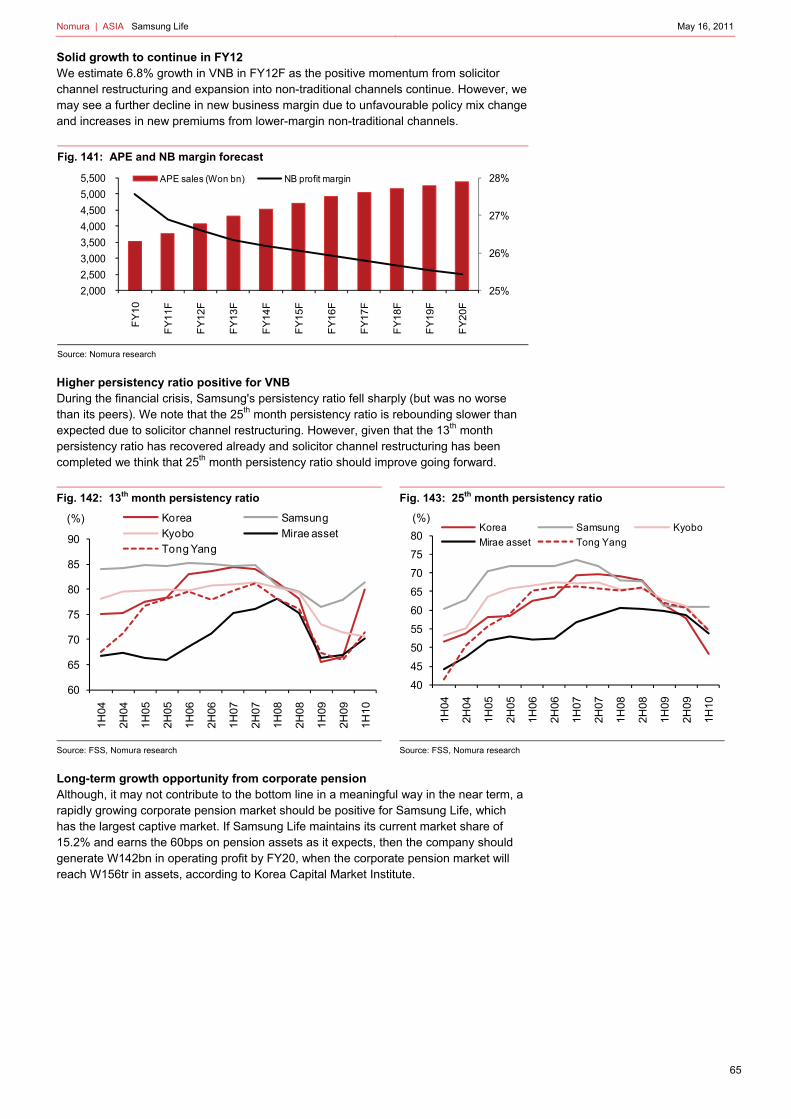
Nomura | ASIA Samsung Life May 16, 2011
65
Solid growth to continue in FY12 We estimate 6.8% growth in VNB in FY12F as the positive momentum from solicitor channel restructuring and expansion into non-traditional channels continue. However, we may see a further decline in new business margin due to unfavourable policy mix change and increases in new premiums from lower-margin non-traditional channels.
Fig. 141: APE and NB margin forecast
Source: Nomura research
Higher persistency ratio positive for VNB During the financial crisis, Samsung's persistency ratio fell sharply (but was no worse than its peers). We note that the 25th month persistency ratio is rebounding slower than expected due to solicitor channel restructuring. However, given that the 13th month persistency ratio has recovered already and solicitor channel restructuring has been completed we think that 25th month persistency ratio should improve going forward.
Fig. 142: 13th month persistency ratio
Source: FSS, Nomura research
Fig. 143: 25th month persistency ratio
Source: FSS, Nomura research
Long-term growth opportunity from corporate pension Although, it may not contribute to the bottom line in a meaningful way in the near term, a rapidly growing corporate pension market should be positive for Samsung Life, which has the largest captive market. If Samsung Life maintains its current market share of 15.2% and earns the 60bps on pension assets as it expects, then the company should generate W142bn in operating profit by FY20, when the corporate pension market will reach W156tr in assets, according to Korea Capital Market Institute.
25%
26%
27%
28%
2,000
2,500
3,000
3,500
4,000
4,500
5,000
5,500
FY
10
FY
11F
FY
12F
FY
13F
FY
14F
FY
15F
FY
16F
FY
17F
FY
18F
FY
19F
FY
20F
APE sales (Won bn) NB profit margin
60
65
70
75
80
85
90
1H
04
2H
04
1H
05
2H
05
1H
06
2H
06
1H
07
2H
07
1H
08
2H
08
1H
09
2H
09
1H
10
(%) Korea SamsungKyobo Mirae assetTong Yang
40
45
50
55
60
65
70
75
80
1H
04
2H
04
1H
05
2H
05
1H
06
2H
06
1H
07
2H
07
1H
08
2H
08
1H
09
2H
09
1H
10
(%)Korea Samsung Kyobo
Mirae asset Tong Yang

Nomura | ASIA Samsung Life May 16, 2011
66
Fig. 144: Corporate pension market share as of Jan 2011 Samsung Life believes it could increase Its market share to 20%
Source: FSS, Nomura research
Industry shakeout not a question of “if?”, but “when?” Samsung Life believes that it could eventually take 20% of the corporate pension market given its large captive market and eventual industry consolidation. We believe that most market participants are losing money on the corporate pension business due to intense competition. Samsung management has admitted that even with the captive market, it is barely breaking even. We think industry consolidation is not a question of “if?”, but “when?” We think 50bps should be a reasonable level of profitability in the medium term. However, Samsung's target spread of 60bps may not be farfetched post-shakeout.
Fig. 145: Corporate pension market projection
Source: FSS, Nomura research
Fig. 146: Lifers showing strength in defined benefits
Source: FSS, Nomura research
0 2 4 6 8 10 12 14 16
Samsung LifeKookmin Bank
Shinhan Bank
Woori BankIBK
Kyobo Life
Hana BankHMC Securities
Nonghyup
Samsung F&MMirae Securities
KDB
Korea Life
KEB
LIG F&M
Hi SecuritiesSamsung Securities
KIS
Mirae LifeTong Yang Securities
(%)
0
20
40
60
80
100
120
140
160
180
FY
09
FY
10
FY
11F
FY
12F
FY
13F
FY
14F
FY
15F
FY
16F
FY
17F
FY
18F
FY
19F
FY
20F
DB DC IRA(Wtn)
0
2
4
6
8
10
12
14
16
Banks Life Insurer Brokerage Non-life insurer
DB DC IRA(Wtn)

Nomura | ASIA Samsung Life May 16, 2011
67
ANW growth of 13% for FY11 and FY12
Significant variances unlikely The company posted net profit of W901bn in FY09, an increase of 702% YoY from a low base of W113bn in FY08 amid the global financial crisis. The recovery was fuelled by a pickup in investment yield to 5.3% from 4.5% in FY90. Net profit increased sharply again in FY10 by 118% thanks to one-off gains such as a write-back of Seoul Guarantee ABS loan-loss provisions. We expect a fall in net profits in FY11 to a normal level and steady improvement thereafter.
Fig. 147: Samsung Life NP trend
Source: Company data, Nomura research
Fig. 148: Samsung Life ROE trend
Source: Company data, Nomura research
Risk margin to improve Risk margin has been trending down since FY02 and has started to stabilize. Samsung Life enjoyed a hefty risk margin in the early part of the 2000s thanks to rapidly rising death insurance premiums. Given that death insurance policies have lower claims at the early stage, rapid growth resulted in margin expansion. However, with a slowdown in recent years, the trend has reversed. In addition, the implementation of IBNR in 2004 made the falling trend worse. We think that further downside is limited going forward. There will likely be no additional increases in IBNR reserve requirements. Moreover, life insurers have secured flexibility in terms of pricing with the fifth mortality table in April 2006. The industry risk margin already saw some improvement in FY09. We think Samsung's risk margin will probably follow the industry trend going forward.
Risk margin improvement may not be visible We should note that risk premium from variable insurance is captured in fees from separate accounts. Given the recent surge in fees from separate accounts we think that risk margin is already improving. However, due to accounting issue we may not see the exact amount or percentage of improvement.
0
500
1,000
1,500
2,000
2,500
FY
07
FY
08
FY
09
FY
10
FY
11E
FY
12E
FY
13E
FY
14E
FY
15E
(Wbn)
0
2
4
6
8
10
12
14
16
FY
07
FY
08
FY
09
FY
10
FY
11E
FY
12E
FY
13E
FY
14E
FY
15E
(%)

Nomura | ASIA Samsung Life May 16, 2011
68
Fig. 149: Risk margin in KRW amount
Source: FSS, Nomura research
Fig. 150: Risk margin in %
Source: FSS, Nomura research
Loading margin has been under technical pressure Loading margin has been falling sharply since FY03. We think that loading margin has been falling due to a change in accounting for acquisition costs in 2004. Prior to the accounting change, insurers capitalized estimated acquisition costs into a deferred acquisition cost (DAC) account, then amortized them over seven years. Therefore, the entire loading margin was recognized upfront. However, after the change, insurers now defer the actual amount, recognizing the loading margin evenly for seven years. Given that we are six years into the new accounting method, we think that additional pressure from the accounting change will be limited.
More recent decline in loading margin triggered by payment change competition We think that the last year's fall in loading margin was triggered by the increase in industry competition. Insurers increased the upfront proportion of sales commission in order to fight off independent agents who were trying to lure solicitors away from insurers. However, we should note that total commission paid out remained the same. We think that the falling trend of loading margin due to the timing issue will eventually normalize and loading margin should improve to the mid-teen level.
Fig. 151: Loading margin in KRW amount
Source: FSS, Nomura research
Fig. 152: Loading margin in %
Source: FSS, Nomura research
Savings spread to stabilize Despite continued dilution from low-yield floating rate policies saving spread has not seen a significant improvement. We do not expect a drastic improvement in the savings spread given that new money yield has been lower than yield on existing portfolios for over two years now. That said, we may not see an improvement in investment yield for three more years given that it would take more than four years to overturn its bond
0
200
400
600
800
1,000
1,200
1,400
Mar
02
Mar
03
Mar
04
Mar
05
Mar
06
Mar
07
Mar
08
Mar
09
Mar
10
(Wbn)
0
5
10
15
20
25
30
35
40
Mar
02
Mar
03
Mar
04
Mar
05
Mar
06
Mar
07
Mar
08
Mar
09
Mar
10
(%)
0
100
200
300
400
500
600
700
Mar
02
Mar
03
Mar
04
Mar
05
Mar
06
Mar
07
Mar
08
Mar
09
Mar
10
(Wbn)
0
5
10
15
20
25
30
35
40
Mar
02
Mar
03
Mar
04
Mar
05
Mar
06
Mar
07
Mar
08
Mar
09
Mar
10
(%)

Nomura | ASIA Samsung Life May 16, 2011
69
portfolio, and we expect slow recovery in the long bond yield. However, we believe that we are going through a trough in terms of rate cycle and continuous dilution from new low-yield floating rate policies should be enough to stop the worsening trend.
Fig. 153: Proportion of +6% fixed rate reserves
Source: Company data, Nomura research
Fig. 154: Savings spread
Source: Company data, Nomura research
Improvement will take time Although, we believe that we are going through a trough in terms of interest rate cycle, improvement of savings spread could be slower than expected due to the recently implemented RBC. In order to comply with the more strict capital adequacy requirement, insurers have been adding long-dated bonds to their portfolio to reduce the duration gap. However, the timing was not in favour of insurers, given that the transition to new regulation happened at the bottom of the rate cycle.
Fig. 155: Bond portfolio breakdown by maturity Buying long-dated bonds at the bottom of rate cycle
Source: Company data, Nomura research
Fig. 156: Duration gap trend RBC duration gap is lower at 2.4 years
Source: Company data, Nomura research
Fees on separate account Separate account assets have grown at a 20% CAGR for the past nine years thanks to the explosive growth of investment-linked insurance. Currently, Samsung Life earns 3% fees on separate account assets, falling from 3.4% in FY08. However, the company noted that actual management fees should be 50-75bps. The difference actually comes from pass-through items such as risk premium, maturity and surrender refunds. We have already noted that the falling trend of risk margin has been stabilized. This means that a fluctuation coming from the pass through of risk premium is now stabilized. For the purpose of our earnings projection, we assume that fees from separate account as a percentage of separate account asset continue downward trend by 6bps, stabilizing at around 2.6% in FY16.
46
48
50
52
54
56
58
FY07 FY08 FY09 3Q10
(%)
-0.11%
-0.22%
-0.04%
-0.17%
6.35% 6.30%
6.04%5.94%6.24%
6.08%6.00%
5.77%
5%
5%
5%
5%
6%
6%
6%
6%
6%
0%
0%
0%
0%
0%
0%
0%
0%
1%
FY07 FY08 FY09 1H10
Spread Avg. crediting rate Yield earned
0
10
20
30
40
50
60
70
80
90
100
3Q10FY09FY08FY07FY06FY05
(%) Less than 1yr 1~5 yr
5 ~ 10 yr More than 10 years 10.19.7
9.2 9.1 8.9
4.8 4.7 4.4 4.4 4.4
FY06 FY07 FY08 FY09 3Q10
Asset duration Liability duration
Gap:5.3
Gap:4.9 Gap:
4.9Gap:4.7
Gap:4.5

Nomura | ASIA Samsung Life May 16, 2011
70
Fig. 157: Fees on separate accounts trend
Source: Company data, Nomura research
0%
1%
2%
3%
4%
-
5,000
10,000
15,000
20,000
25,000
30,000
35,000
FY
00
FY
01
FY
02
FY
03
FY
04
FY
05
FY
06
FY
07
FY
08
FY
09
FY
10F
FY
11F
FY
12F
FY
13F
FY
14F
FY
15F
FY
16F
FY
17F
Separate account assets
Fees %
(Wbn)

Nomura | ASIA Samsung Life May 16, 2011
71
Bullish on Samsung Group Samsung Life's affiliate stakes represent 54% of its book value. Samsung Electronics and Samsung Card make up 80% of affiliate holdings. It appears that taking a view on Samsung Electronics and Samsung Card is an essential part of investing in Samsung Life. Note that we are bullish on both Samsung Electronics and Samsung Card.
Why we are bullish on Samsung Electronics
All cylinders firing Our technology analyst CW Chung expects to see gradual share price appreciation as both earnings improvement from cyclical recovery and new growth engines come into play: 1) The DRAM market, one of the most important catalysts of Samsung’s share performance, is likely to bottom out in 1Q11. 2) We expect continued healthy growth in Telecom and NAND, both of which are direct beneficiaries of Smartphone and tablet PC growth. 3) OLED, Sys-LSI, and Home Appliances, in all of which Samsung has invested heavily, are to begin to contribute meaningfully to both top line and bottom line.
Samsung deserves PBR of 2.0x Considering the constant high-teen ROE that Samsung can generate, CW believes the shares deserve a PBR of 2.0x. CW has a BUY rating on Samsung Electronics and a PT of W1,350,000 (implying 51% upside potential). He has applied a 2.0x of PBR with 12M Fwd BVPS of W672,000.
Fig. 158: EPS vs. share price
Source: Company data, Nomura research
Fig. 159: PBR trend
Source: Company data, Nomura research
DRAM bottoming out in 1Q11 Off from the high base of 2010, in which the DRAM market enjoyed the historic boom, we are likely to see a decline in earnings in 2011. However, thanks to 1) the market share of as high as 40%+, 2) the technology migration running ahead of the competitors (therefore 20~40ppt margin gap), and 3) the superior application mix (ie, larger exposure to specialty DRAM) and, therefore, higher ASP than its peers, we believe Samsung’s competitiveness in the DRAM market should continue to hold into 2011. We forecast 2011F bit growth of 58% y-y and ASP to fall by 41% y-y. 2011F DRAM operating profit is forecast at W4.5tn, down 41% y-y.
NAND to continue healthy growth Thanks to the rise in demand for smartphones, tablet PCs, and solid-state drives, we forecast benign a market situation in NAND. Though we expect industrywide capex (and accordingly, NAND wafer capacity) to increase quickly, this does not concern us much, as bit supply growth in 2011 should stand at around 80%, at best, similar to the growth in demand. Unlike in DRAM, Samsung’s competitiveness in NAND doesn’t seem as advanced vs its peers. We forecast 2011F NAND operating profit at W2.7tn, up 26% y-y, or OP margin of 28% (up 2ppt y-y).
(20)
0
20
40
60
80
100
120
140
160
0
200
400
600
800
1,000
1,200
1,400
00 01 02 03 04 05 06 07 08 09 10
11F
12F
Share price (LHS)
EPS (RHS)
('000 W) ('000 W)
<The lost four years>
0
200
400
600
800
1,000
1,200
00 01 02 03 04 05 06 07 08 09 10 11F
('000 W) PBR 2.5x PBR 2.0x
PBR 1.5x
PBR 1.0x

Nomura | ASIA Samsung Life May 16, 2011
72
Fig. 160: SEC- DRAM OP
Source: Company data, Nomura research
Fig. 161: SEC- NAND OP
Source: Company data, Nomura research
System-LSI to contribute meaningfully from 3Q11 Having spent W3tn in the System-LSI business in 2010, Samsung plans to invest another W4.2tn in 2011. The System-LSI business is building new capacity in Austin (US), which will come online in 2Q11 and is likely to contribute meaningfully to the top line from 3Q11. The major driving factors for S-LSI should be the AP (Accelerated Processors) for tablet PCs and Smartphone. Apple and Samsung itself are key customers for now. Samsung took up 30~40% of market share in the AP space in 2010, and we expect it to grow in line with the demand growth of Smartphone and tablet PCs. We forecast the segment’s 2011F revenue and operating profit at W9.7tn (up 38% y-y) and W800bn (up 136% y-y), respectively.
OLED making up for LCD With TV shipments muddling through and the demand for IT panels falling short of the market’s previous expectations, this segment’s operating profit is forecast to remain flat y-y. However, Samsung’s differentiation against its peer group will continue to increase as the results from the OLED operation contributes more into the whole segment. Regarding the OLED, as two 5.5G lines are planned to commence volume production in 2011, the gap versus the following panel makers should further widen. With around W924bn operating profit from the OLED business included, we forecast the whole display segment operating profit should stand at W2tn, flat y-y.
Revenue contribution from smartphones fast increasing With the revenue contribution from smartphone business fast increasing, Samsung is likely to see continued earnings improvement in the telecom business. While smartphones contributed only 14% of the segment’s 4Q10 handset shipments, the higher-than-feature phone ASP resulted in the revenue contribution proportion of as high as 38%. Operating profit margin of smartphones is estimated at around the high-teen percentage in 4Q10, but may see some downward pressure as competition soars. Still, though, we believe Samsung can manage to retain 10% OP margin from its smartphone business. 2011F shipments of feature phones and smartphones are forecast to grow at down 5% y-y and up 164% y-y, respectively. Thanks to the increased shipment proportion of smartphones, segment operating profit is forecast at W4.7tn, up 10% y-y.
(40)
(20)
0 %
20 %
40 %
60 %
80 %
(800)
0
800
1,600
2,400
04 05 06 07 08 09 10F 11F
DRAM OP (LHS)
DRAM OP margin (RHS)
(Wbn) (%)
(40)
(20)
0 %
20 %
40 %
60 %
80 %
(400)
0
400
800
1,200
04 05 06 07 08 09 10F 11F
NAND OP (LHS)NAND OP margin (RHS)
(Wbn) (%)

Nomura | ASIA Samsung Life May 16, 2011
73
Fig. 162: OLED to drive panel revenue
Source: Company data, Nomura research
Fig. 163: Smart phone to drive telecom revenue
Source: Company data, Nomura research
Risks on our view include; 1) Faster-than-expected KRW appreciation. 2) Increasing competition in the smartphone space. 3) Excessive industrywide capex in NAND, which we have seen in the past cycles.
Why we are bullish on Samsung Card
Structural growth coupled with rising expected inflation Our financial sector analyst Gil Hyung Kim is bullish on Samsung Card (the second-largest affiliate holding after Samsung Electronics). Gil expects a one-off adjusted EPS CAGR of 20% over the next two years for Samsung Card. He expects system card purchase volume to advance in the double digits on the back of 1) migration of consumers to online from offline, 2) inflationary pressure, and 3) extended tax benefits. In addition, funding cost should decline as the company refinance W1.2tn legacy high-yield (=6% annually) debentures issued during the global financial crisis.
Structural migration of cash to credit We project Samsung Card’s card payment (lump-sum and installment purchase) volume growth of 17% and 14% y-y in FY11F and FY12F, respectively. This is above our nominal private consumption forecasts of 7.4% and 7.6% for those years. Fast-growing sales at online stores are leading to more consumption on plastic money, as the card settlement portion is over 80% (vs. an average of 63%).
Additionally, under inflation pressure, consumers are expected to purchase more on credit cards than in cash in order to enjoy bonus points and cash-back services. Lastly, tax benefits on credit card purchases encourage more credit card spending and discourage tax evasion. Samsung Card has deeply penetrated into the Korean economy and we believe it would fully benefit from above-GDP growth of the card industry.
0
2
4
6
8
10
12
14
09 10 11F 12F
(Wtn) Feature phone Smartphone
0
2
4
6
8
10
12
14
16
10 11F 12F 13F 14F
(Wtn) LCD OLED

Nomura | ASIA Samsung Life May 16, 2011
74
Fig. 164: Sales growth by retail business type (y-y)
Source: KOSIS, Nomura research
Fig. 165: Credit card usage in retail stores
Source: KOSIS, BoK, Nomura research
Funding cost should decline Given that asset yields are almost fixed for the credit card issuers, funding costs are key drivers for net interest margin. Samsung Card, as a mono-line issuer, relies on wholesale funding. In theory, BoK rate hikes, led by inflation pressure, should put upward pressure on the company’s funding costs. However, we believe Samsung Card’s funding costs will continue to shift downward over the next two years, upholding net interest margin.
Yield curve flattening Despite the rate hikes of BoK, we expect the yield curve to flatten, as the long tail would be less sensitive to short-term rates. More than 80% of the total funding has maturity of three years and longer. Hence, the impact of a rising short-term rate would have marginal impact on Samsung Card’s funding costs.
Funding mix change Funding contribution from commercial paper, which is cheaper than long-term debentures, have subsided since the financial woes in 2008. This should provide more room for Samsung Card to lower overall funding costs, in our view.
Refinancing of high costs debentures Deleveraging was hardly evidenced by Samsung Card during the global financial crisis, when the company issued debentures at a high cost. Such legacy high-cost debentures are maturing in 2011 and are likely to be refinanced at a lower cost, reducing funding costs overall.
Fig. 166: Samsung Card funding mix (FY10)
Source: Company data, Nomura research
Fig. 167: Samsung Card debentures outstanding by maturity
Source: DART, Company data, KOFIA, Nomura research
(10)
0
10
20
30
40
50
601Q
062Q
063Q
064Q
061Q
072Q
073Q
074Q
071Q
082Q
083Q
084Q
081Q
092Q
093Q
094Q
091Q
102Q
103Q
104Q
10
Total
Cyber shopping mall
Home shopping
(%)
78%69%
54%39%
22%31%
46%61%
Home&Internet shop
Large discount stores
Department stores
Supermarkets
Credit card Others
Corporate Bond63%
Commercial Paper
1%
Borrowing10%
%Securitization26%
4.0
5.0
6.0
7.0
8.0
0
200
400
600
800
1,000
1,200
1,400
1,600
1,800
2011 2112 2013 2014 2015+
Amount of debentures maturing (LHS)
Avg Int rate (RHS)
Current yield on 5 yr card bond (RHS)
Current yield on 3 yr card bond (RHS)
(Wbn) (%)

Nomura | ASIA Samsung Life May 16, 2011
75
Risks to our view: 1) Given high penetration of Korean credit card industry– 4.4 cards per economically active person, we think industry competition could put pressure on marketing expenses. 2) Further tightening of regulations on credit card operation if card issuers exert aggressive competition for asst growth.
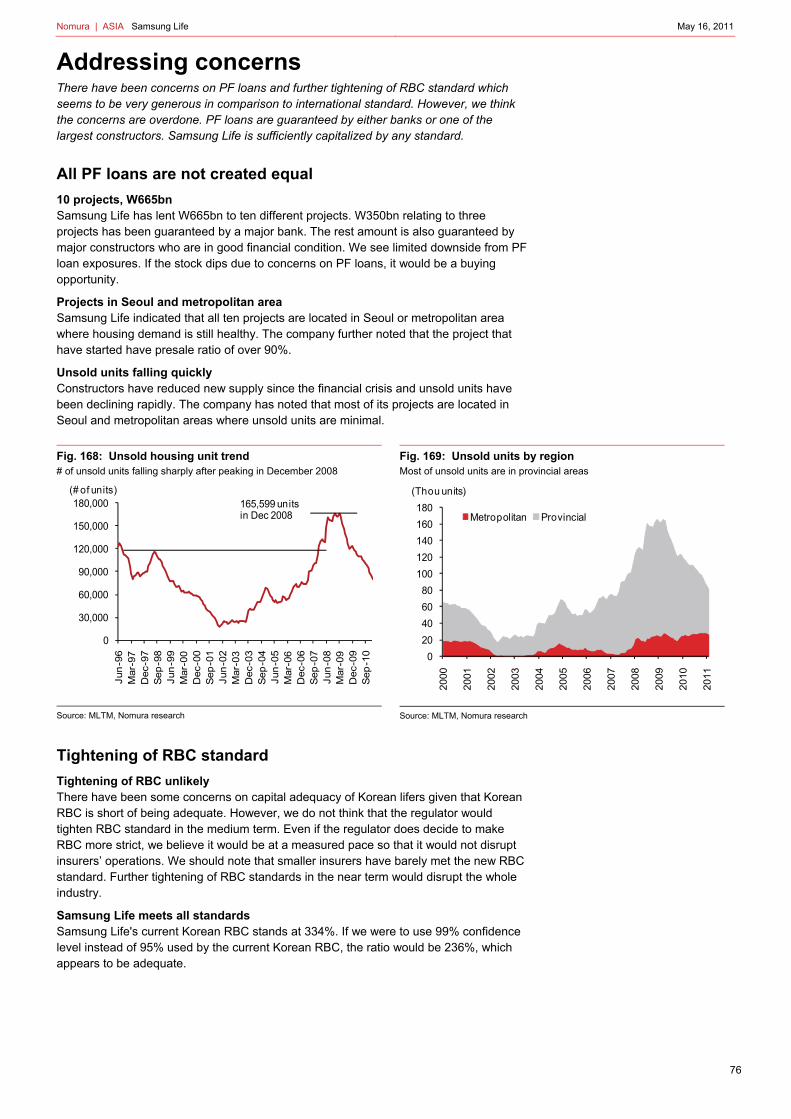
Nomura | ASIA Samsung Life May 16, 2011
76
Addressing concerns There have been concerns on PF loans and further tightening of RBC standard which seems to be very generous in comparison to international standard. However, we think the concerns are overdone. PF loans are guaranteed by either banks or one of the largest constructors. Samsung Life is sufficiently capitalized by any standard.
All PF loans are not created equal
10 projects, W665bn Samsung Life has lent W665bn to ten different projects. W350bn relating to three projects has been guaranteed by a major bank. The rest amount is also guaranteed by major constructors who are in good financial condition. We see limited downside from PF loan exposures. If the stock dips due to concerns on PF loans, it would be a buying opportunity.
Projects in Seoul and metropolitan area Samsung Life indicated that all ten projects are located in Seoul or metropolitan area where housing demand is still healthy. The company further noted that the project that have started have presale ratio of over 90%.
Unsold units falling quickly Constructors have reduced new supply since the financial crisis and unsold units have been declining rapidly. The company has noted that most of its projects are located in Seoul and metropolitan areas where unsold units are minimal.
Fig. 168: Unsold housing unit trend # of unsold units falling sharply after peaking in December 2008
Source: MLTM, Nomura research
Fig. 169: Unsold units by region Most of unsold units are in provincial areas
Source: MLTM, Nomura research
Tightening of RBC standard
Tightening of RBC unlikely There have been some concerns on capital adequacy of Korean lifers given that Korean RBC is short of being adequate. However, we do not think that the regulator would tighten RBC standard in the medium term. Even if the regulator does decide to make RBC more strict, we believe it would be at a measured pace so that it would not disrupt insurers’ operations. We should note that smaller insurers have barely met the new RBC standard. Further tightening of RBC standards in the near term would disrupt the whole industry.
Samsung Life meets all standards Samsung Life's current Korean RBC stands at 334%. If we were to use 99% confidence level instead of 95% used by the current Korean RBC, the ratio would be 236%, which appears to be adequate.
0
30,000
60,000
90,000
120,000
150,000
180,000
Jun
-96
Mar-
97
Dec-9
7S
ep
-98
Jun
-99
Mar-
00
Dec-0
0S
ep
-01
Jun
-02
Mar-
03
Dec-0
3S
ep
-04
Jun
-05
Mar-
06
Dec-0
6S
ep
-07
Jun
-08
Mar-
09
Dec-0
9S
ep
-10
(# of units)165,599 units in Dec 2008
0
20
40
60
80
100
120
140
160
180
2000
2001
2002
2003
2004
2005
2006
2007
2008
2009
2010
2011
(Thou units)
Metropolitan Provincial

Nomura | ASIA Samsung Life May 16, 2011
77
If tightened, Samsung Life should benefit However, we cannot fully rule out the possibility of the regulator abruptly tightening the RBC standards. If this were to happen, we think that Samsung Life with a buffer should benefit given the action will likely trigger industry consolidation.
Fig. 170: Samsung's RBC ratio under different standards
Source: Company data, Nomura research
Fig. 171: RBC ratio by company
Source: Company data, Nomura research
0
50
100
150
200
250
300
350
400
95% confidence
99% confidence
US RBC S&P RBC
(%)
0
100
200
300
400
500
600
Sam
sun
g L
ife
Ko
rea
To
ngY
ang
Sam
sun
g F
&M
Do
ngbu
Hyun
dai
LIG
(%)

Nomura | ASIA Samsung Life May 16, 2011
78
Risk factors
Prolonged low interest environment
More than valuation risk In addition to valuation risk, prolonged low interest environment could impose operational risks. As the market rates fall the disparity between portfolio rates and new money rates has been widening. As a result, the company could continue to post negative variances. This would undermine credibility of EV valuation would eventually result in lower multiple.
Could trigger minimum guarantees Samsung Life provides guaranteed minimum accumulation benefit (GMAB) on its investment linked products and minimum return guarantees on floating rate policies. If market rates fall below a threshold, these guarantees could be triggered. Once insurers find themselves in this situation, insurers may compromise risk management standards in order to pick up additional yields.
Harder to acquire new business Lower interest rate environment could negatively impact new business volume due to lower crediting rate.
Underperformance of Samsung Electronics
Technology industry downturn A broader technology industry downturn could impose risk on Samsung Life. Samsung Life owns 7.21% in Samsung Electronics representing 33% of its book value.
Other risk factors for Samsung Electronics 1) Faster-than-expected KRW appreciation. 2) Increasing competition in the smart phone space. 3) Excessive industrywide capex in NAND, which we have seen in the past cycles.
Share overhang
Shinsegae owns 11.07% Shinsegae owns 11.07% of Samsung Life. The lock-up period for Shinsegae should end on 12 May 2011. Shinsegae has indicated that Samsung Life stake could be a funding source if they were to invest overseas or find an attractive acquisition target. However, our consumer analyst Cara Song believes that there isn't any attractive acquisition target at the moment.
CJ Group owns 5.49% CJ Group combined ownership of Samsung Life stands at 5.49%. CJ Corp and CJ CheilJedang own 3.2% and 2.3%, respectively. The lock-up period for CJ Group already ended in 12 November 2010. CJ Group is currently in the process of bidding for Korea Express. CJ Group has noted that Samsung Life stake will be a funding source
ESOP owns 3.82% Employee stock ownership program also owns 3.82% of Samsung Life. The lock up period ends on 12 May 2011. We think the chance of ESOP stake coming on to the market is low given the tendency of individual investors waiting until they recover losses.

Nomura | ASIA Samsung Life May 16, 2011
79
Company Overview Samsung Life is by far the largest life insurer in Korea and quasi holding company of Samsung Group.
Company History Established as Dong bang Life insurance in 1957, the company became part of Samsung Group in 1963. After changing its name to Samsung Life Insurance in 1989, the company has grown to be the largest life insurance company in Korea with W133tn in total assets (Mar, 10). In May, 2010, the company listed on the KRX.
Fig. 172: Key historical milestones
Source: DART, Company data, Nomura research
Fig. 173: Shareholding structure
Source: DART, Company data, Nomura research
Fig. 174: Korea life insurers ranking
Source: DART, Nomura research
Policy mix breakdown Samsung Life derives 45% of total premium from protection-type policies. We should note that protection-type policies carry much higher embedded margin than wealth accumulation products such as annuities and savings-type policies. However, demand growth is coming from wealth accumulation products.
Distribution channel In terms of the distribution channel, Samsung Life distributes its products mainly through traditional channels; exclusive solicitors (78%) and exclusive agents (12%). Bancassurance sales account for 8% of distribution (on initial premium basis), but should grow faster than other channels as the company becomes more receptive to the bancassurance channel.
Date History1957. 5 Established Dong Band Life Insurance1963. 7 Incorporates into Samsung Group1989. 9 Changes name to Samsung Life Insurance1993. 12 Establish base in New York1997. 11 Establish JV in Thailand2005. 7 Establish JV in China2006. 4 First non-depository financial institution to supass
W100tn in asset2007. 12 Gain licencse to manage trust assets2008. 7 Establish oversees branch in Vietnam2010. 5 Listed on KRX
20.8%
19.3%
11.1%
5.5%4.7%
4.7%
3.8%
2.3%
27.9%
Lee, Kun-Hee
Samsung Everaland
Shinsegae
CJ Group
Samsung Foundation of CultureSamsung Life Welfare FoundationESOP
Other affiliates
Free float
Company Amount M/S Company Amount M/S Company Amount M/S Company Amount M/S1 Samsung Life 82,811 38% Samsung Life 99,116 36% Samsung Life 13,334 38% Samsung Life 34,440 23%2 Korea Life 29,506 14% Korea Life 43,249 16% Korea Life 5,981 17% Korea Life 24,600 17%3 Kyobo Life 27,105 13% Kyobo Life 39,367 14% Kyobo Life 4,568 13% Kyobo Life 22,122 15%4 ING Life 10,311 5% ING Life 11,528 4% ING Life 1,739 5% Mirae Asset Life 8,696 6%5 Allianz 9,462 4% Allianz 10,985 4% Prudential 1,193 3% Shinhan Life 7,834 5%6 AIA Life 6,124 3% Shinhan Life 9,369 3% Tong Yang Life 1,095 3% Met Life 7,132 5%7 Shinhan Life 6,044 3% Tong Yang Life 9,262 3% AIA Life 992 3% Allianz 6,821 5%8 Tong Yang Life 5,831 3% Heung Kuk Life 8,486 3% Shinhan Life 966 3% ING Life 6,782 5%9 Mirae Asset Life 5,722 3% KDB Life 7,397 3% Allianz 930 3% Tong Yang Life 6,033 4%
10 Heung Kuk Life 5,650 3% Mirae Asset Life 6,944 3% Met Life 763 2% Heung Kuk Life 5,029 3%
Policy reserve (bn) Total Equity (Wbn) Exclusive solicitors (person)Rank
Total asset (Wbn)

Nomura | ASIA Samsung Life May 16, 2011
80
Fig. 175: Policy mix trend
Source: Company data, Nomura research
Fig. 176: Distribution channel breakdown
Source: Company data, Nomura research
Management profile In December 2010, Kuen-hee Park was appointed the new CEO of Samsung Life. Mr. Park has been part of Samsung Group since 1978, holding positions in Samsung restructuring headquarters, Samsung Capital, Samsung Card, and Samsung Electronics. His latest position within Samsung Group was head of Samsung Electronics in China.
Quasi holding company of Samsung Group Samsung Life plays a key role in Samsung Groups ownership structure. As seen in chart below, Samsung Life holds controlling stake in both Samsung Electronics and Samsung Card.
Fig. 177: Samsung Group Ownership Structure
Source: DART, Nomura research
Protection (general)
30%
Protection (separate)
15%Annuities (general)
20%
Annuities (separate)
27%
Savings6%
Group2%
Exclusive solicitors
78%
Exclusive agents12%
Independent agents
1%
Banc-assurance
8%
Other1%
Key company data: See page 2 for company data, and detailed price/index chart. Rating: See report end for details of Nomura’s rating system.
Korea Life 088350.KS 088350 KS
INSURANCE
EQUITY RESEARCH
If you believe in hyper inflation
Leveraged play on rising interest rates
May 16, 2011
Rating Starts at
Buy
Target price Starts at9,400
KRW 9,400
Closing price May 12, 2011
KRW 7,460
Potential upside +26%
Action: Initiating coverage at BUY We initiate coverage of Korea Life with a BUY rating and a PT of W9,400. Korea Life is the second-largest life insurer in Korea with strength in investment-linked products.
Too inexpensive to ignore Korea Life is trading at 0.8x forward P/EV. In our view, its valuation is undemanding considering that we expect Korea Life’s EV to grow an average of 12% a year for the next four years.
Catalyst: Interest rate cycle to turn We think the stock is trading at a depressed level due to a flatter yield curve. However, our economist believes that the long-end of the curve will rise steadily starting in 2H11 with: 1) continuous rate hikes by the BOK; 2) rising expected inflation; and 3) tightening by ECB and QE2 ending.
Name to own if you believe in hyper inflation Seventy percent of Korea Life’s reserve relates to fixed-rate policies, the highest among the listed lifers. Hence, its EV sensitivity to a change in interest rate is also the highest. While our economist believes the rates will rise at a measured pace, we believe Korea Life would be a good name to own in a hyper-inflation scenario. Of note, we estimate a 50bp increase in the NIER would boost Korea Life’s EV by 14%.
Valuation: PT of W9,400, implying 26% upside Our PT of W9,400 is based on 1.0x forward P/EV. We assume a sustainable RoEV of 11.5%, a COE of 11.5% and a growth rate of 3%.
31 Mar FY10 FY11F FY12F FY13F
Currency (KRW) Actual Old New Old New Old New
Net premium (bn) 6,772 0 6,987 0 7,197 0 7,413
Reported net profit (bn) 481 535 601 673
Normalised net profit (bn) 481 535 601 673
Normalised EPS 553.8 616.5 692.2 775.3
Norm. EPS growth (%) 15.0 11.3 12.3 12.0
Norm. P/E (x) 13.5 N/A 12.1 N/A 10.8 N/A 9.6
Price/EV (x) 0.9 N/A 0.8 N/A 0.7 N/A 0.6
Price/implied VNB (x) -2.2 N/A -4.2 N/A -6.2 N/A -8.2
Dividend yield (%) 1.3 N/A 1.3 N/A 2.0 N/A 2.0
ROE (%) 8.1 8.4 8.8 9.1
ROA (%) 0.8 0.0 0.8 0.0 0.9 0.0 0.9
Source: Nomura estimates
Anchor themes
Korean lifers, in our view, can deliver double-digit EV growth. While they trade like ex-growth companies due to a flatter yield curve, we believe the long-end of the yield curve will start to rise in 2H11F.
Nomura vs consensus
Our net profit estimate for FY11F is 16% lower than consensus. Our PT is 4% lower than consensus.
Research analysts
Korea Insurance
Michael Na - NFIK [email protected] +82 2 3783 2334
Young Kwon Kim - NFIK [email protected] +82 2 3783 2339
See Appendix A-1 for analyst certification and important disclosures. Analysts employed by non US affiliates are not registered or qualified as research analysts with FINRA in the US.

Nomura | ASIA Korea Life May 16, 2011
82
Key data on Korea Life Profit and Loss (KRWbn) Year-end 31 Mar FY09 FY10 FY11F FY12F FY13FGross premiums 6,545 6,790 6,994 7,204 7,420Government charges
Reinsurance ceded -15 -18 -7 -7 -7Net written premium 6,529 6,772 6,987 7,197 7,413Change in unearned premium reserves
Net earned premium 6,529 6,772 6,987 7,197 7,413Claims and benefit payments -4,742 -5,108 -5,286 -5,436 -5,590Change in reserves -2,354 -2,248 -2,356 -2,444 -2,535Commission and DAC expenses -1,239 -999 -1,020 -1,044 -1,071Other expenses -738 -635 -628 -635 -640Underwriting surplus -2,545 -2,218 -2,302 -2,362 -2,423Recurrent investment income 2,355 2,223 2,363 2,431 2,528Realised and unrealised gains
Investment income 2,355 2,223 2,363 2,431 2,528Other income
Employee share expense
Operating profit -190 5 61 69 105Amortisation
Other non-operating income 736 625 645 702 758Associates and JCEs
Pre-tax profit 546 629 706 771 863Income tax -127 -149 -171 -170 -190Net profit after tax 418 481 535 601 673Minority interests
Other items
Preferred dividends
Normalised NPAT 418 481 535 601 673Extraordinary items
Reported NPAT 418 481 535 601 673Dividends -87 -87 -87 -130 -130Transfer to retained earnings 331 394 449 471 543
Valuation and ratio analysis
FD normalised P/E (x) 15.5 13.5 12.1 10.8 9.6FD normalised P/E at price target (x) 19.5 17.0 15.2 13.6 12.1Reported P/E (x) 15.5 13.5 12.1 10.8 9.6Dividend yield (%) 1.3 1.3 1.3 2.0 2.0Price/book (x) 1.1 1.1 1.0 0.9 0.8Investment return (%) na na na na naRecurrent investment return (%) na na na na naNon-recurrent return/invt. return (%) 0.0 0.0 0.0 0.0 0.0Price/EV (x) 1.0 0.9 0.8 0.7 0.6Price/implied VNB (x) -0.1 -2.2 -4.2 -6.2 -8.2Loss ratio (%)
Combined ratio (%)
Effective tax rate (%) 23.3 23.6 24.2 22.0 22.0Dividend payout (%) 20.8 18.1 16.2 21.7 19.3ROE (%) 9.0 8.1 8.4 8.8 9.1ROA (%) 0.75 0.79 0.82 0.87 0.92ROR (%) na na na na na
Growth (%)
Life premiums 3.8 3.0 3.0 3.0Non life premiums na na na naNet profit 15.0 11.3 12.3 12.0Normalised EPS 15.0 11.3 12.3 12.0Normalised FDEPS 15.0 11.3 12.3 12.0Source: Nomura estimates
Notes
Our net profit estimate for FY11F is 16% lower than consensus.
Price and price relative chart (one year)
(%) 1M 3M 12M
Absolute (KRW) 1.5 -2.4 -11.2
Absolute (USD) 1.3 1.1 -7.4
Relative to index -0.3 -10.1 -40.0
Market cap (USDmn) 5,922.6
Estimated free float (%) 52-week range (KRW)
9270/6760
3-mth avg daily turnover (USDmn)
6.71
Major shareholders (%) Hanwha E&C 24.9
Hanwha 21.7
6500
7000
7500
8000
8500
9000
60
70
80
90
100
110Ju
n 10
Jul 1
0
Aug
10
Sep
10
Oct
10
Nov
10
Dec
10
Jan
11
Feb
11
Mar
11
Apr
11
May
11
PriceRel MSCI Korea(KRW)

Nomura | ASIA Korea Life May 16, 2011
83
Balance Sheet (KRWbn) As at 31 Mar FY09 FY10 FY11F FY12F FY13FCash and deposits 1,752 2,015 2,094 2,186 2,283Bonds 19,487 21,936 23,330 23,615 23,835Equities 511 1,197 1,826 2,544 3,357Unit trusts
Loans and mortgages 12,536 13,277 13,193 13,122 13,029Foreign investments 1,197 1,293 2,199 3,234 4,410Real estate 2,245 2,276 2,349 2,433 2,523Other investments 6,172 4,988 4,082 4,312 4,556Total investments 43,900 46,982 49,074 51,446 53,992Deferred acquisition costs 2,332 2,290 2,337 2,393 2,454Prepaid and unearned prem. reserves
Debtors and prepayments
Fixed assets
Goodwill
Separate account assets 11,433 12,739 14,143 15,584 17,059Other assets 1,333 1,417 1,459 1,503 1,548Total assets 58,997 63,427 67,014 70,926 75,053Insurance reserves 40,470 43,153 44,852 46,821 48,899Catastrophe reserves
Insurance protection fund
Deposit and investment contracts
Separate account liabilities 11,526 14,001 17,008 20,661 25,097Provision for Unearned Premiums
Provision for Outstanding Claims
Interest bearing liabilities
Other liabilities 1,322 108 -1,465 -3,645 -6,575Total liabilities 53,318 57,262 60,395 63,837 67,421Minority interest
Common stock 4,837 4,883 4,883 4,883 4,883Preferred stock
Retained earnings 481 760 1,209 1,680 2,223Proposed dividends
Other equity 362 522 527 527 527Shareholders' equity 5,680 6,165 6,618 7,089 7,632Total liabilities and equity 58,998 63,426 67,014 70,926 75,053
Balance sheet ratios (%)
Life solvency margin na na na na naNon-life solvency margin
Net premiums/equity 115.0 109.9 105.6 101.5 97.1Tech. reserves/total premiums 618.3 635.5 641.3 649.9 659.0
Investment portfolio mix (%)
Cash and deposits 4.0 4.3 4.3 4.2 4.2Bonds 44.4 46.7 47.5 45.9 44.1Equities 1.2 2.5 3.7 4.9 6.2Unit trusts 0.0 0.0 0.0 0.0 0.0Loans and mortgages 28.6 28.3 26.9 25.5 24.1Foreign investments 2.7 2.8 4.5 6.3 8.2Real estate 5.1 4.8 4.8 4.7 4.7Other investments 14.1 10.6 8.3 8.4 8.4
Per share
Reported EPS (KRW) 481.66 553.78 616.47 692.19 775.30Norm EPS (KRW) 481.66 553.78 616.47 692.19 775.30Fully diluted norm EPS (KRW) 481.66 553.78 616.47 692.19 775.30DPS (KRW) 100.00 100.00 100.00 149.99 149.99BVPS (KRW) 6,539.68 7,097.75 7,619.92 8,162.12 8,787.42Life/LT EVPS (KRW) 7,493.01 8,515.67 9,482.36 10,514.23 11,579.17Life/LT VNBPS (KRW) 472.06 472.70 486.38 495.29 501.78Value of non-life bus. PS (KRW) 0.00 0.00 0.00 0.00 0.00Source: Nomura estimates
Notes
Asset growth driven by separate account.

Nomura | ASIA Korea Life May 16, 2011
84
Leveraged play on rising interest rates Korea Life is the second-largest life insurance company in Korea. The company has been the leader in investment-linked insurance. We believe that Korea Life is a good name to own for investors who are bullish on inflation.
Attractive valuation, limited downside
Solid EV growth We expect Korea Life to deliver RoEV of 12.6% for each of FY11F and FY12F, driven by strong growth in the value of in-force business (VIF). We forecast VIF growth of 49% and 33% for FY11F and FY12F, respectively. Of note, our estimate VIF is adjusted to reflect a lower net interest earnings rate (NIER).
Significant contribution from VNB The contribution from new business (VNB) should be significant, as it makes up 52% of VIF based on our adjusted numbers as of March 2011. Thanks to low base effect, we think the company will continue to generate robust VIF growth.
ANW growth may take time to recover Although Korea Life will likely enjoy robust VIF growth in the medium term, its EV growth will likely lag behind that of other listed lifers given that its VIF is small relative to its adjusted net worth (ANW). We think it will take time for Korea Life to rebuild its VIF for it to contribute to the bottom line in a meaningful way.
Trading at ex-growth multiples Despite its solid EV growth profile, Korea Life is trading at 0.8x forward P/EV. We think that Korea Life is trading like an ex-growth company due to a flatter yield curve. However, Nomura’s Korea economist, Mr Young Sun Kwon, believes that the long-end of the curve will rise slowly going into 2H11.
Most leveraged to rising interest rates
Highest proportion of fixed-rate policies As 70% of Korea Life’s reserve relates to fixed-rate policies, its valuation sensitivity to interest rates is the highest among the listed lifers in Korea. Although this could be a double-edged sword, we believe that we are going through a trough in the interest rate cycle.
50bp increase in NIER assumption likely to boost EV by 13.8% Our economist forecasts a 45bp rise in the three-year treasury yield over the next 12 months. We estimate that a 50bp increase in the NIER would boost Korea Life’s EV by 13.8%.
But actual pickup in investment yield will take time However, we should note that the investment yield on fixed-income securities will likely fall for two more years given that it takes three to four years to overturn the bond portfolio. In addition, we think that transition to Risk Based Capital (RBC) may further delay the recovery of investment returns given that life insurers are forced to buy long-dated bonds to meet a stricter measure of capital adequacy.
We are less bullish on Korea Life due to high hurdle rate Korea Life’s current average crediting rate is the highest among the listed lifers. Given that we expect a steady but slow recovery in market rates, we are less bullish on Korea Life than other lifers.
We would likely turn more bullish if rates were to pick up faster than expected But again, if inflation gets out of hand as the BOK falls behind the curve, we would become more bullish on the name. We believe that in a hyper-inflation environment the company’s operation would likely improve as fast as the improvement in its valuation.

Nomura | ASIA Korea Life May 16, 2011
85
BUY at the bottom of the rate cycle
Rate hike campaign to continue Our economist expects two more rate hikes in for the rest of 2011, and another two in 1H12, which will lift the terminal policy rate of the current cycle to 4.0% by 2Q12. Meanwhile, he thinks that real policy rates will remain negative, doing little to limit inflationary pressure, unless it is combined with KRW appreciation.
Bond market will eventually react to growing concerns on inflation Our economist noted that CPI inflation is set to rise to more than 4% in 2011, exceeding the BOK's target band. Interest rate hikes coupled with a stronger KRW and price control should partly offset cost-push inflation pressures from higher oil prices. But rising nominal wages and housing rents are also adding to inflation. Our economist forecasts CPI inflation to rise from 2.9% in 2010 to 4.4% in 2011, before easing to 3.6% in 2012. We think that the long end of the bond market will eventually react to growing concerns on inflation.
Foreign capital inflow to slow Whether hunting for better yields or looking for KRW appreciation, inflow of foreign capital has been adding downward pressure on the long end since 2H09. However, with the ECB turning hawkish and the Fed's QE2 programme winding down, we may see foreign capital inflow slow and even turn to an outflow further out. We think that the long end of the yield curve could be lifted with rising interest rates in developed markets, as we have seen in 4Q10. In addition, the recent KRW appreciation could hinder foreign capital inflow looking for KRW appreciation, and thus further ease the downward pressure on the long end.
Long end to rise slowly but surely Our economist forecasts the five-year treasury yield will rise from 3Q11 and reach 4.5% by end-1H12 (from the current 4.0%), and the three-year treasury yield will rise to 4.2% by end-1H12 (from the current 3.6%).
Risk factors
Prolonged low interest rate environment As the market rates fall, the disparity between portfolio rates and new money rates has widened. In addition to valuation risk, a prolonged low interest rate environment will likely present operational risks including: 1) continued reliance on new sales to subsidize in-force business; 2) a decline into the minimum guarantees zone; 3) a negative impact on new business volume due to a lower crediting rate; and 4) companies may compromise risk management standards to boost yield.
W1tn in PF loans Korea Life has W1tn in PF loans outstanding that are related to housing projects. Although the housing market has improved and the number of unsold apartments has been falling steadily over the past two years, we have seen continuous filings of court receivership by medium-size construction companies recently. That said, we think the stock may face downward pressure whenever PF loans become an issue in the market. The company has noted that all of its PF loans are guaranteed by larger constructors and projects are located in Seoul and metropolitan areas where demand is still healthy.

Nomura | ASIA Korea Life May 16, 2011
86
Fig. 178: Korea Life financial summary
Source: Company data, Nomura estimates
Profit and Loss StatementsWon billions, Year ending Mar 31 FY08 FY09 FY10 FY11F FY12F FY13F FY14F FY15FTotal Premium 10,529 10,499 11,183 11,839 12,437 13,046 13,662 14,253 General Account 6,729 6,529 6,772 6,987 7,197 7,413 7,635 7,864 Separate Account 3,801 3,970 4,411 4,852 5,240 5,633 6,027 6,389
Premium Income 6,735 6,545 6,790 6,994 7,204 7,420 7,643 7,872Risk Premium 1,552 1,606 1,647 1,693 1,741 1,790 1,841 1,893Loading Premium 2,315 2,057 1,969 1,993 2,032 2,070 2,109 2,149Savings Premium 2,862 2,867 3,157 3,308 3,432 3,560 3,693 3,830
Benefits Paid 1,375 1,410 1,410 1,449 1,490 1,531 1,574 1,618U/W Expenses 1,965 1,673 1,634 1,654 1,686 1,718 1,751 1,784
Net of Acquisition Costs & DAC Deferral 28 27 35 0 0 0 0 0Acquisition Cost 1,269 965 956 1,067 1,100 1,132 1,166 1,201DAC Deferral (1,241) (938) (921) (1,067) (1,100) (1,132) (1,166) (1,201)
Amortization of DAC 1,403 1,239 999 1,020 1,044 1,071 1,100 1,131Net Increase in DAC (162) (301) (42) 48 55 62 66 71Maintenance Costs 695 708 643 587 587 586 584 582
Maturity & Surrender Refund 4,464 3,769 3,698 3,837 3,946 4,058 4,210 4,367Changes in Premium Reserve 1,422 2,223 2,248 2,356 2,444 2,535 2,630 2,728Net Investment Income 1,814 2,355 2,223 2,363 2,431 2,528 2,675 2,829
Risk & Loading Margins 527 580 572 583 597 611 625 639Savings Margin (1,209) (770) (567) (521) (528) (506) (472) (435)Operating Profit (682) (190) 5 61 69 105 153 204Non-operating Profit 773 736 625 645 702 758 815 869
Commission Income (Separate Account) 779 766 655 679 739 798 858 915Others (6) (30) (30) (34) (37) (40) (43) (46)
Pre-tax Profits 91 546 629 706 771 863 968 1,073Effective Tax 8 127 149 171 170 190 213 236Net Profits 83 418 481 535 601 673 755 837
Selective Balance Sheet Data FY08 FY09 FY10 FY11F FY12F FY13F FY14F FY15FTotal Assets 52,597 58,998 63,427 67,014 70,926 75,053 79,325 83,757Invested Assets 39,320 43,875 46,982 49,074 51,446 53,992 56,648 59,462
Cash & Deposits 1,853 1,752 2,015 2,094 2,186 2,283 2,384 2,488Securities 23,556 27,367 29,414 31,438 33,705 36,158 38,761 41,553
Stocks 592 511 1,197 1,826 2,544 3,357 4,273 5,303Money Invested 222 192 170 152 132 108 80 47Fixed Income Instrument 22,742 26,663 28,047 29,460 31,029 32,693 34,409 36,204
Net Loans 11,672 12,536 13,277 13,193 13,122 13,029 12,890 12,711Real Estate 2,239 2,220 2,276 2,349 2,433 2,523 2,614 2,710
Non-invested Assets 3,881 3,690 3,706 3,796 3,895 4,002 4,115 4,233DAC 2,633 2,332 2,290 2,337 2,393 2,454 2,521 2,591Others 1,248 1,358 1,417 1,459 1,503 1,548 1,594 1,642
Separate Account Assets 9,395 11,433 12,739 14,143 15,584 17,059 18,562 20,061
Total Liabilities 48,996 53,318 57,262 60,395 63,837 67,421 71,112 74,880Policy Reserve 38,082 40,470 43,153 44,852 46,821 48,899 51,053 53,288
Premium Reserve 36,384 38,770 41,328 43,154 45,083 47,120 49,233 51,425Reserve for Outstanding Claims 1,397 1,356 1,382 1,421 1,461 1,502 1,544 1,587Reserve for Unearned Premium 18 13 7 0 0 0 0 0Reserve for Policyholders' Dividend 292 288 274 274 274 274 274 274Excess Reserve for Policyholders' Dividend 14 15 24 24 24 24 24 24Reinsurance Premium Reserve 0 0 0 0 0 0 0 0
Adjustment of Policyholder 148 297 364 364 364 364 364 364Other Liabilities 1,277 1,026 1,006 1,037 1,068 1,100 1,133 1,167Separate Account Liabilities 9,395 11,433 12,739 14,143 15,584 17,059 18,562 20,061
Total Shareholders' Equity 3,601 5,680 6,165 6,618 7,089 7,632 8,213 8,877Paid in Capital 3,550 4,343 4,386 4,386 4,386 4,386 4,386 4,386Capital Surplus 0 494 496 496 496 496 496 496Retained Earnings 66 481 760 1,209 1,680 2,223 2,804 3,467Capital Adjustment (12) 362 527 527 527 527 527 527

Nomura | ASIA Korea Life May 16, 2011
87
Fig. 179: Korea Life per share data and performance ratios
Source: Company data, Nomura estimates
Per Share Data FY08 FY09 FY10 FY11F FY12F FY13F FY14F FY15FEarnings Per Share (Won) 117 482 554 616 692 775 869 964Book Value Per Share (Won) 5,072 6,540 7,098 7,620 8,162 8,787 9,457 10,221ROA (%) 0.2 0.7 0.8 0.8 0.9 0.9 1.0 1.0ROE (%) 2.3 9.0 8.1 8.4 8.8 9.1 9.5 9.8EPS Growth (%) (76.9) 311.9 15.0 11.3 12.3 12.0 12.1 10.9
Gross Dividend 0 0 87 87 130 130 174 174DPS (Won) 0 0 100 100 150 150 200 200Dividend Payout Ratio (%) 0.0 0.0 6.0 6.0 6.0 5.5 5.5 5.0Issued Shares (million) - Common 710 869 869 869 869 869 869 869
PERFORMANCE RATIOS FY08 FY09 FY10 FY11F FY12F FY13F FY14F FY15FGrowth (%)Total Premium (6.2) (0.3) 6.5 5.9 5.0 4.9 4.7 4.3 General Account (7.1) (3.0) 3.7 3.2 3.0 3.0 3.0 3.0 Separate Account (4.6) 4.5 11.1 10.0 8.0 7.5 7.0 6.0Risk Margin (13.9) 10.4 21.1 2.9 2.9 2.9 2.9 2.9Loading Margin (35.7) 9.9 (12.9) 1.2 1.9 1.9 1.9 1.9Savings Margin NM NM NM NM NM NM NM NMCommission Income 31.6 (1.7) (14.5) 3.7 8.8 8.1 7.4 6.7Net Profits (76.9) 403.9 15.0 11.3 12.3 12.0 12.1 10.9Total Assets 6.3 12.2 7.5 5.7 5.8 5.8 5.7 5.6Invested Assets 5.4 11.6 7.1 4.5 4.8 4.9 4.9 5.0Net Loans 7.9 7.4 5.9 (0.6) (0.5) (0.7) (1.1) (1.4)Policy Reserve 4.6 6.3 6.6 3.9 4.4 4.4 4.4 4.4Shareholders' Equity (1.2) 57.7 8.5 7.4 7.1 7.7 7.6 8.1
Premium Income Mix (%)Risk Premium 23.0 24.5 24.2 24.2 24.2 24.1 24.1 24.0Loading Premium 34.4 31.4 29.0 28.5 28.2 27.9 27.6 27.3Savings Premium 42.5 43.8 46.5 47.3 47.6 48.0 48.3 48.7
Margin Analysis (%)Risk Margin / Risk Premium 11.4 12.2 14.4 14.4 14.4 14.4 14.5 14.5Loading Margin / Loading Premium 15.1 18.7 17.0 17.0 17.0 17.0 17.0 17.0Savings Margin / Savings Premium (42.2) (26.9) (18.0) (15.8) (15.4) (14.2) (12.8) (11.4)Net Investment Yield 4.9 5.8 5.0 5.0 5.0 4.9 5.0 5.0Net Interest Margin 6.1 5.9 5.5 5.4 5.3 5.3 5.3 5.4Effective Comm. Rate on Separate Account 8.8 7.4 5.4 4.8 4.7 4.7 4.6 4.6
Investment Mix (%)Cash & deposits 4.7 4.0 4.3 4.3 4.2 4.2 4.2 4.2Securities 59.9 62.4 62.6 64.1 65.5 67.0 68.4 69.9Net loans 29.7 28.6 28.3 26.9 25.5 24.1 22.8 21.4Real estate 5.7 5.1 4.8 4.8 4.7 4.7 4.6 4.6
Securities Mix (%)Stock 2.5 1.9 4.1 5.8 7.5 9.3 11.0 12.8Money invested 0.9 0.7 0.6 0.5 0.4 0.3 0.2 0.1Gov't and public bonds 52.0 45.6 42.9 44.9 43.1 41.3 39.5 37.8Special bonds 15.0 18.6 25.1 23.4 21.7 20.0 18.4 16.7Corporate bonds 9.1 7.0 6.6 5.9 5.2 4.6 3.9 3.2Beneficiary certificates 8.1 14.5 10.4 10.0 9.6 9.2 8.8 8.4Overseas securities 5.8 4.4 4.4 7.0 9.6 12.2 14.8 17.4Structured securities 0.0 0.0 0.0 0.5 1.0 1.5 2.0 2.5Others 1.9 3.4 2.2 2.0 1.8 1.6 1.4 1.2
Balance Sheet Strucuture (%)Avg Equity/Avg Assets 7.1 8.3 9.7 9.8 9.9 10.1 10.3 10.5Avg Invested Assets / Avg Asets 75.0 74.6 74.2 73.6 72.9 72.2 71.7 71.2Avg Separate Account Assets / Avg Asets 17.3 18.7 19.7 20.6 21.6 22.4 23.1 23.7Policy Reserve / Premium Income 565.4 618.3 635.5 641.3 649.9 659.0 668.0 676.9Period-End Equity/Assets 6.8 9.6 9.7 9.9 10.0 10.2 10.4 10.6Avg Equity / Premium Income 53.8 70.9 87.2 91.4 95.1 99.2 103.7 108.6Solvency Margin Ratio 215.6 299.1 295.3 320.2 326.1 321.8 317.5 312.4

Nomura | ASIA Korea Life May 16, 2011
88
Valuation We have derived our PT of W9,400, based on 1.0x forward P/EV. The stock is trading at 0.8x forward P/EV. We think valuation is undemanding, considering that we expect the company to deliver sustainable RoEV of 11.5% over the next four years.
Valuation attractive at 0.8x forward P/EV
Our PT is based on 1.0x P/EV Korea Life is trading at 0.8x forward P/EV, which we believe is attractive considering that we expect sustainable RoEV of 11.5% in the medium term. We apply 1.0x forward P/EV to derive our PT. We assume a sustainable medium-term RoEV of 11.5%, a COE of 11.5% and a growth rate of 3%.
Priced ex-growth The current implied NBM (new business multiple) is in negative territory despite the company’s solid growth profile and upside potential from rising interest rates.
EV adjusted to reflect lower market rates We assume a lower net investment earnings rate (NIER) than the company in our EV forecasts. Korea Life uses a NIER of 5.25% in calculating its FY09 EV, while we assume a NIER of 5.0% (ie, 25bp lower than Korea Life's assumption).
Fig. 180: Korea Life: EV projection and PT Korea Life should be able to deliver RoEV of 11.5%-plus through FY14F
Source: Company data, Nomura estimates
Starting from a low base We believe that 11.5% RoEV is sustainable despite the lacklustre outlook for Korea Life’s ANW growth in the near term. We note that even if we assume no growth in VNB, Korea Life should be able to achieve VIF growth of 48% and 32% for FY11F and FY12F, respectively, given that we expect VNB to make up 52% of VIF (value in-force) as of March 2011. Of note, we assume a NIER of 5.0% to forecast VIF.
Positive variance likely based on Nomura EV figures We use a NIER of 5.0% to forecast VIF. However, we believe the actual investment yield will remain above 5.0%, thus yielding positive variance in the near term. That said, we think that continuous positive variance is likely if Korea Life does not have any hiccups in its in-force profit management.
We could justify PT of W12,800 using appraisal valuation method We think that our PT is conservative given that valuation using the appraisal value method results in a higher NBM. The implied NBM is 0x at our PT. However, using the appraisal value method, we could justify up to a 6.9x NBM. Of note, we only reflect a 10-year projection in our NBM calculation. Typically, a 30-year DCF model is used in the region to derive NBM. However, due to the infancy of the EV valuation methodology in Korea, we do not want to pay for more than 10 years.
(Wbn) FY09 FY10F FY11F FY12F FY13F FY14FAdjusted net worth (ANW) 6,100 6,601 7,055 7,569 8,112 8,737 Value of in-force business (VIF) 408 795 1,187 1,580 1,973 2,365 Embedded value (EV) 6,508 7,396 8,242 9,150 10,085 11,102 Growth of EV (RoEV) 15.0% 12.6% 12.6% 11.6% 11.8%Current mkt cap 6,444 6,444 6,444 6,444 6,444 6,444 P/EV 0.99 0.87 0.78 0.70 0.64 0.58 VNB 410 411 422 430 436 439 NBM (0.16) (2.32) (4.26) (6.29) (8.35) (10.60)
Target multiple 1.0 Target mkt cap 8,242 Target price 9,400 Implied NBM -

Nomura | ASIA Korea Life May 16, 2011
89
More appropriate to use P/EV methodology There is upside potential to our PT using the appraisal value methodology. However, we think it is more appropriate to use P/EV for Korea Life given some negative variance we encountered in EV, which may not be captured in the NBM technique. In addition, the NBM technique ignores near-term changes in EV growth profile.
Fig. 181: Korea Life: target NBM based on appraisal value method The appraisal value method implies a PT of W12,800, 36% higher than our P/EV-based PT of W9,400
Source: Nomura research
Valuation sensitivity
EV sensitive to investment yield and claims ratio assumptions The following charts show the sensitivity in the EV to changes in some of Korea Life's key assumptions. A key variable is the investment return assumption. For Korea Life, this is currently 5.25%, which we believe is slightly aggressive considering the current market rates. Note that we used a NIER of 5.0% to forecast VIF and VNB. In addition, we believe that we are going through a trough in the interest rate cycle.
A 50bp increase in investment yield would boost EV by 13.8%... Our sensitivity analysis indicates a 50bp increase in investment yield would boost EV by 13.8%. Of note, Korea Life is most sensitive to rising interest rates among the listed life insurers due to its largest exposure to fixed-rate liabilities. 70% of its reserve relates to fixed-rate policies, compared with 60% for Samsung Life and 58% for Tong Yang Life.
Fig. 182: EV sensitivity in KRW
Source: Company data, Nomura research
Fig. 183: EV sensitivity in %
Source: Company data, Nomura research
… but our PT would increase by only 3% In effect, this would increase our PT by 3%. We should note that the affect on VNB from a changing investment yield assumption is limited since most new businesses are floating-rate policies. We would not expect to see ANW growth pick up immediately given that it takes time for higher market rates to flow through the bond portfolio. Hence, the increase in our PT would be less than what the valuation sensitivity indicates.
(Wbn) FY11F FY12F FY13F FY14F FY15F FY16F FY17F FY18F FY19F FY20FAnnualized premium equivalent (APE 2,271 2,351 2,421 2,482 2,531 2,582 2,634 2,686 2,740 2,795 New business margin 18.6% 18.3% 18.0% 17.7% 17.5% 17.4% 17.4% 17.3% 17.3% 17.3%Value of new business (VNB) 422 430 436 439 443 450 458 466 475 484 Discount factor 1.0 1.1 1.2 1.4 1.5 1.7 1.9 2.1 2.3 2.6 PV of VNB 422 388 354 321 292 267 245 224 206 189 Sum of PV 2,908 Implied multiple 6.9
1,028
(1,500)
(1,000)
(500)
0
500
1,000
1,500
Disco
unt rate ±1%
NIE
R ±
50bps
Claim
s Rate ±
10pp
t
Lapse R
ate ±10p
pt
13.8% 11%
(20)
(15)
(10)
(5)
0
5
10
15
20
Disco
unt rate ±1%
NIE
R ±
50bps
Claim
s Rate ±
10pp
t
Lapse R
ate ±10p
pt

Nomura | ASIA Korea Life May 16, 2011
90
Fig. 184: Korea Life: EV projection and PT assuming 50bp increase in NIER Our PT would increase by only 3%, assuming a 50bp NIER increase
Source: Company data, Nomura research
VNB sensitive to discount rate and lapse ratio VNB is not sensitive to interest rates given that most new businesses are floating-rate policies. VNB is rather sensitive to the lapse ratio, however, since most cancellations occur in the first 25 months and by definition new business includes policies acquired in the past year.
Fig. 185: Korea Life: VNB sensitivity in KRW VNB not sensitive to NIER since new businesses are floating-rate policies
Source: Company data, Nomura research
Fig. 186: Korea Life: VNB sensitivity in % VNB not sensitive to NIER since new businesses are floating-rate policies
Source: Company data, Nomura research
(Wbn) FY09 FY10F FY11F FY12F FY13F FY14FAdjusted net worth (ANW) 6,100 6,651 7,127 7,679 8,324 8,992 Value of in-force business (VIF) 1,436 1,823 2,222 2,630 3,052 3,487 Embedded value (EV) 7,536 8,474 9,348 10,309 11,375 12,478 Growth of EV (RoEV) 13.6% 11.3% 11.2% 11.6% 10.8%Current mkt cap 6,444 6,444 6,444 6,444 6,444 6,444 P/EV 0.86 0.76 0.69 0.63 0.57 0.52 VNB 410 423 441 458 477 498 NBM (2.7) (4.8) (6.6) (8.4) (10.3) (12.1)
Target multiple 0.9 Target mkt cap 8,413 Target price 9,700 Implied NBM (2.1)
33 35
(40)
(30)
(20)
(10)
0
10
20
30
40
Dis
coun
t rate ±1
%
NIE
R ±
50bp
s
Claim
s Rate ±
10pp
t
Lap
se R
ate ±
10p
pt
8% 8.0%
(10)
(8)
(6)
(4)
(2)
0
2
4
6
8
10
Dis
coun
t rate ±1
%
NIE
R ±
50bp
s
Claim
s Rate ±
10pp
t
Lap
se R
ate ±
10p
pt
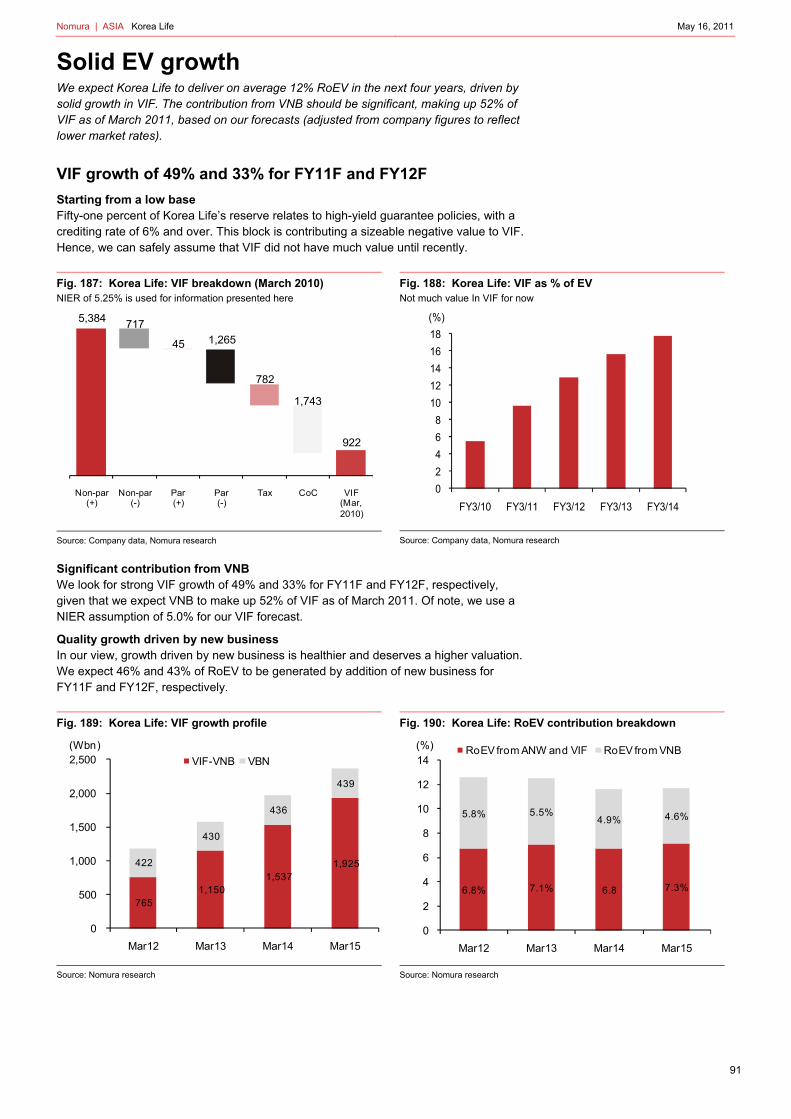
Nomura | ASIA Korea Life May 16, 2011
91
Solid EV growth We expect Korea Life to deliver on average 12% RoEV in the next four years, driven by solid growth in VIF. The contribution from VNB should be significant, making up 52% of VIF as of March 2011, based on our forecasts (adjusted from company figures to reflect lower market rates).
VIF growth of 49% and 33% for FY11F and FY12F
Starting from a low base Fifty-one percent of Korea Life’s reserve relates to high-yield guarantee policies, with a crediting rate of 6% and over. This block is contributing a sizeable negative value to VIF. Hence, we can safely assume that VIF did not have much value until recently.
Fig. 187: Korea Life: VIF breakdown (March 2010) NIER of 5.25% is used for information presented here
Source: Company data, Nomura research
Fig. 188: Korea Life: VIF as % of EV Not much value In VIF for now
Source: Company data, Nomura research
Significant contribution from VNB We look for strong VIF growth of 49% and 33% for FY11F and FY12F, respectively, given that we expect VNB to make up 52% of VIF as of March 2011. Of note, we use a NIER assumption of 5.0% for our VIF forecast.
Quality growth driven by new business In our view, growth driven by new business is healthier and deserves a higher valuation. We expect 46% and 43% of RoEV to be generated by addition of new business for FY11F and FY12F, respectively.
Fig. 189: Korea Life: VIF growth profile
Source: Nomura research
Fig. 190: Korea Life: RoEV contribution breakdown
Source: Nomura research
5,384 717
45 1,265
782
1,743
922
Non-par(+)
Non-par(-)
Par (+)
Par(-)
Tax CoC VIF (Mar, 2010)
0
2
4
6
8
10
12
14
16
18
FY3/10 FY3/11 FY3/12 FY3/13 FY3/14
(%)
765 1,150
1,537 1,925 422
430
436
439
0
500
1,000
1,500
2,000
2,500
Mar12 Mar13 Mar14 Mar15
VIF-VNB VBN
(Wbn)
6.8% 7.1% 6.8 7.3%
5.8% 5.5%4.9% 4.6%
0
2
4
6
8
10
12
14
Mar12 Mar13 Mar14 Mar15
RoEV from ANW and VIF RoEV from VNB(%)

Nomura | ASIA Korea Life May 16, 2011
92
VNB growth of 3% and 2% for FY11F and FY12F
Volume growth driven by bancassurance We forecast new business volume growth of 4% and 3.5% for FY11F and FY12F, respectively. We believe that our volume growth assumptions are reasonable given that the demand for wealth accumulation products is growing and Korea Life is taking advantage of the fast-growing bancassurance channel.
Fig. 191: Korea Life: APE and new business margin trend Margin should fall as policy mix shifts to lower margin products
Source: Nomura research
Fig. 192: Korea Life: initial premium by channel (KRW) Initial premium growth coming from bancassurance channel
Source: Company data, Nomura research
Fig. 193: Korea Life: initial premium by channel (%) Korea Life increasing exposure to bancassurance
Source: Company data, Nomura research
Solicitor channel strengthened Korea Life initiated a restructuring programme for its exclusive solicitor channel at the time of IPO in March 2010. The initial premium from the exclusive solicitor channel has grown steadily of late as the company enters a rehiring cycle. We think that this trend will likely continue as Korea Life has said it plans to add more solicitors.
Increased sales through exclusive channel to support NB margin We think that the recent development in the exclusive solicitor channel will be positive for NB margin as well as volume given that the exclusive solicitor channel is more profitable than non-traditional channels. Of note, the exclusive solicitor channel sells more higher-margin traditional protection-type policies.
17.0
17.4
17.8
18.2
18.6
19.0
2,000
2,100
2,200
2,300
2,400
2,500
2,600
2,700
2,800
FY
3/12
FY
3/13
FY
3/14
FY
3/15
FY
3/16
FY
3/17
FY
3/18
FY
3/19
FY
3/20
FY
3/21
Annualized premium equivalent (APE)
New business margin
(Wbn) (%)
0
200
400
600
800
1Q09
2Q09
3Q09
4Q09
1Q10
2Q10
3Q10
Tied Agents Agency
Bancassurance TCM
(Wbn)
% 0
20
40
60
80
100
1Q09
2Q09
3Q09
4Q09
1Q10
2Q10
3Q10
Tied Agents Agency
Bancassurance TCM(%)

Nomura | ASIA Korea Life May 16, 2011
93
Fig. 194: Korea Life: number of solicitors Korea Life cut inefficient solicitors in 1Q3/10
Source: Company data, Nomura research
Fig. 195: Korea Life: initial premium from solicitor channel The Initial premium from the solicitor channel is growing with rehiring
Source: Company data, Nomura research
But modest VNB growth However, VNB growth is likely to be slower than volume growth due to margin pressure coming from product mix change to lower-margin wealth accumulation products.
Fig. 196: Korea Life: APE by product type (KRW) Growth driven by lower-margin annuities
Source: Nomura research
Fig. 197: Korea Life: APE by product type (%) Product mix shifting to lower-margin wealth accumulation products
Source: Nomura research
Higher persistency ratio positive for VNB During the financial crisis, Korea Life's persistency ratio fell sharply, with its 25-month persistency ratio falling by more than that of peers. However, we expect an improvement in the 25-month persistency ratio going forward given that the 13-month persistency ratio has bounced back quickly to pre-crisis levels and the company has entered a solicitor rehiring cycle after completing its restructuring programme.
24,000
24,500
25,000
25,500
1Q09
2Q09
3Q09
4Q09
1Q10
2Q10
3Q10
300
320
340
360
380
400
420
440
460
480
1Q09
2Q09
3Q09
4Q09
1Q10
2Q10
3Q10
(Wbn)
0
100
200
300
400
500
600
700
1Q
09
2Q
09
3Q
09
4Q
09
1Q
10
2Q
10
3Q
10
Savings(Var)
Annuities(Var)
Protection(Var)
Savings(Gen)
Annuities(Gen)
Protection(Gen)
(Wbn)
% 0% 10% 20% 30% 40% 50% 60% 70% 80% 90
% 1001Q
09
2Q
09
3Q
09
4Q
09
1Q
10
2Q
10
3Q
10
Savings(Var)
Annuities(Var)
Protection(Var)
Savings(Gen)
Annuities(Gen)
Protection(Gen)
(%)

Nomura | ASIA Korea Life May 16, 2011
94
Fig. 198: 13-month persistency ratio trends Persistency ratio bouncing back quickly
Source: FSS, Nomura research
Fig. 199: 25-month persistency ratio trends 25th month persistency ratio should follow 13th month soon
Source: FSS, Nomura research
Equity bull market should help Korea Life The variable insurance initial premium volume fell sharply with the market crash in 2008. However, the volume started to pick up again with the market recovery in 2009. If the KOSPI continues to advance, we think the variable insurance volume will pick up further and Korea Life stands to benefit given that it has shown strength in the space.
Fig. 200: KOSPI vs variable insurance initial premium Variable insurance initial premium picking up with rising KOSPI
Source: KLIA, Quantiwise, Nomura research
Fig. 201: Initial premium breakdown Korea Life has shown strength in variable insurance
Source: KLIA, Nomura research
60
65
70
75
80
85
901H
04
2H04
1H05
2H05
1H06
2H06
1H07
2H07
1H08
2H08
1H09
2H09
1H10
(%) Korea SamsungKyobo Mirae assetTong Yang
40
45
50
55
60
65
70
75
80
1H04
2H04
1H05
2H05
1H06
2H06
1H07
2H07
1H08
2H08
1H09
2H09
1H10
(%) Korea SamsungKyobo Mirae assetTong Yang
1,000
1,200
1,400
1,600
1,800
2,000
2,200
50
70
90
110
130
150
170
190
2005 2006 2007 2008 2009 2010
Variable insurance FYP (LHS)
KOSPI (RHS)
(Wbn) (Index)
0 10 20 30 40 50 60 70 80 90100
1Q F
Y03
3Q F
Y03
1Q F
Y04
3Q F
Y04
1Q F
Y05
3Q F
Y05
1Q F
Y06
3Q F
Y06
1Q F
Y07
3Q F
Y07
1Q F
Y08
3Q F
Y08
1Q F
Y09
3Q F
Y09
1Q F
Y10
3Q F
Y10
1Q F
Y11
Pure endow Death EndowmentGroup Retirement PensionVariable(%)

Nomura | ASIA Korea Life May 16, 2011
95
Fig. 202: Variable insurance initial premium trend
Source: Nomura research
Fig. 203: Variable insurance initial premium trend
Source: Nomura research
Modest ANW growth
Not much value in VIF yet Korea Life has suffered from the low interest rate environment more so than other lifers, due to its higher average crediting rate. We think the pain will likely continue until the company rebuilds its VIF. We estimate VIF as percentage of ANW of only 12% at FY10F year end. This means that contribution from the unwinding of in-force book will likely be limited in terms of ANW growth.
Fig. 204: Korea Life: net profit trend Expect modest profit growth until Korea Life rebuild its VIF
Source: Company data, Nomura estimates
Fig. 205: Korea Life: ROE trend
Source: Company data, Nomura estimates
Risk margin has been under technical pressure Risk margin has been trending down since FY03 and started to stabilize. Korea Life enjoyed a hefty risk margin in the early 2000s thanks to a rapidly rising death insurance premium. Given that death insurance policies have lower claims at the early stage, rapid growth resulted in margin expansion. However, with a slowdown in recent years, the trend has reversed. In addition, the implementation of IBNR in 2004 made the falling trend worse. We think that further downside is limited going forward.
Risk margin to improve There will be no additional increase in IBNR reserve requirements. Moreover, life insurers secured flexibility in terms of pricing with the fifth mortality table in April 2006. That said, we expect risk margin to improve.
0
50
100
150
200
2501Q
062Q
063Q
064Q
061Q
072Q
073Q
074Q
071Q
082Q
083Q
084Q
081Q
092Q
093Q
094Q
091Q
102Q
103Q
10
Korea Samsung Kyobo(Wbn)
0
200
400
600
800
1,000
1,200
1Q06
2Q06
3Q06
4Q06
1Q07
2Q07
3Q07
4Q07
1Q08
2Q08
3Q08
4Q08
1Q09
2Q09
3Q09
4Q09
1Q10
2Q10
3Q10
Korea Samsung Kyobo(Wbn)
0
100
200
300
400
500
600
700
800
900
FY
09
FY
10
FY
11F
FY
12F
FY
13F
FY
14F
FY
15F
(Wbn)
7.0
7.5
8.0
8.5
9.0
9.5
10.0
FY
09
FY
10
FY
11F
FY
12F
FY
13F
FY
14F
FY
15F
(%)

Nomura | ASIA Korea Life May 16, 2011
96
But risk margin improvement may not be visible We should note that risk premium from variable insurance is captured in fees from separate accounts. Given the recent surge in fees from separate accounts, we think that risk margin is already improving. However, due to accounting, we may not see the exact amount or percentage of improvement.
Fig. 206: Korea Life: risk margin (KRW)
Source: Nomura research
Fig. 207: Korea Life: risk margin (%)
Source: Nomura research
Loading margin also under technical pressure Loading margin has been falling sharply since FY03. We think that loading margin has been falling due to a change in accounting for acquisition costs in 2004. Prior to the accounting change, insurers capitalized estimated acquisition costs into a deferred acquisition cost (DAC) account, then amortized over seven years. Therefore, the entire loading margin was recognized up front. However, after the change, insurers now defer the actual amount, recognizing the loading margin evenly for seven years. Given that we are six years into the new accounting method, we think that additional pressure from the accounting change will be limited.
More recent fall in loading margin triggered by payment structure change We think that the past year's fall in loading margin was triggered by increasing industry competition. Insurers increased the up-front proportion of sales commission to fight off independent agents who were trying to lure solicitors away from insurers. However, we should note that total commission paid out remained the same. We think that the falling trend of loading margin due to the timing issue will eventually normalize and loading margin will improve to the mid-teens level.
Fig. 208: Korea Life: loading margin (KRW)
Source: Nomura research
Fig. 209: Korea Life: loading margin (%)
Source: Nomura research
0
100
200
300
Mar
-02
Mar
-03
Mar
-04
Mar
-05
Mar
-06
Mar
-07
Mar
-08
Mar
-09
Mar
-10
(Wbn)
0
5
10
15
20
25
30
Mar
-02
Mar
-03
Mar
-04
Mar
-05
Mar
-06
Mar
-07
Mar
-08
Mar
-09
Mar
-10
(%)
0
200
400
600
800
1,000
1,200
Mar
-02
Mar
-03
Mar
-04
Mar
-05
Mar
-06
Mar
-07
Mar
-08
Mar
-09
Mar
-10
(Wbn)
0
5
10
15
20
25
30
35
40
45
Mar
-02
Mar
-03
Mar
-04
Mar
-05
Mar
-06
Mar
-07
Mar
-08
Mar
-09
Mar
-10
(%)

Nomura | ASIA Korea Life May 16, 2011
97
Savings spread may fall further Despite continued dilution from low-yield floating-rate policies, saving spread has not seen a significant improvement. We do not expect a drastic improvement in the savings spread given that new money yields have been lower than the yield on existing portfolios for over two years now.
Average crediting rate too high and falling too slowly We believe that we are going through a trough in the rate cycle. However, given that Korea Life’s average crediting rate is well above 6% and falling at a slow pace as the premium growth is driven by separate accounts, we may not see an improvement in savings spread for some time.
Fig. 210: Korea Life: average crediting rate Crediting rate to fall 10~12bps pa
Source: Nomura research
Fig. 211: Korea Life: % of high-yield guarantee policies 51% of reserve relates to policies with fixed rate of 6% or higher
Source: Nomura research
Slower dilution effect High-yield guarantee policies still make up a significant proportion of Korea Life’s liabilities and the proportion is declining at a slow pace. Korea Life’s premium growth has come mostly from separate accounts. Hence, we think the dilution effect is minimal and will not bring down the high-yield guarantee proportion in a meaningful way in the near term.
Fig. 212: Premium trend: general vs separate accounts Premium growth driven by separate accounts
Source: Nomura research
Fig. 213: Proportion of high-yield guarantee policies 51% of reserve relates to policies with fixed rate of 6% or higher
Source: Nomura research
6.406.38
6.36
6.33
6.29
6.20
6.24
6.28
6.32
6.36
6.40
6.44
3Q FY09 4Q FY09 1Q FY10 2Q FY10 3Q FY10
(%)
-1.25%
-0.02% -0.13%
-1.19% -0.94%
-0.11%
-1.36%
6.51% 6.46% 6.40% 6.38% 6.36% 6.33% 6.29%
5.26%
6.44%
6.27%
5.19%5.42%
6.22%
4.93%
4%
4%
5%
5%
6%
6%
7%
-2%
-1%
0%
1%
2%
3%
4%
5%
6%
1Q FY09
2Q FY09
3Q FY09
4Q FY09
1Q FY10
2Q FY10
3Q FY10
Spread Avg. crediting rate Yield earned
0 1 2 3 4 5 6 7 8 9
10
Mar
-04
Mar
-05
Mar
-06
Mar
-07
Mar
-08
Mar
-09
Mar
-10
Mar
-11
(Wtr)General account Separate account
45
47
49
51
53
55
3Q FY09 4Q FY09 1Q FY10 2Q FY10 3Q FY10
(%)

Nomura | ASIA Korea Life May 16, 2011
98
Improvement will take longer than expected Although we believe that we are going through a trough in the interest rate cycle, improvement in the savings spread could be slower than expected due to the recently implemented RBC. To comply with the more strict capital adequacy requirement, insurers have been adding long-dated bonds to their portfolios to reduce the duration gap. However, the timing was not in favour of insurers given that the transition to the new regulation happened at the bottom of the rate cycle.
Fig. 214: Bond portfolio breakdown by maturity (%) Buying long-dated bonds at the bottom of rate cycle
Source: Nomura research
Fig. 215: Duration gap trend Reducing duration gap by adding long-dated bonds
Source: Nomura research
Fees on separate accounts Separate account assets have seen a 29% CAGR over the past nine years thanks to significant demand growth and a strategic move to focus on investment-linked insurance. Currently, Korea Life earns 5.4% fees on separate account assets, down from 8.8% in FY09. However, we believe that the actual management fee will be no more than 75bp. The difference comes from pass-through items such as risk premium, maturity or surrender refunds. We have already noted that the falling trend of risk margin has stabilized. This means that fluctuation coming from the pass-through of risk premium has also stabilized. For the purpose of our earnings projection, we assume that fees from separate accounts as a percentage of separate account assets would continue to trend down by 5-10bp a year and stabilize at around 4.5% in FY16F.
Fig. 216: Separate account assets and fees (%)
Source: Company data, Nomura estimates
0
10
20
30
40
50
60
70
80
90
100
3Q10FY09FY08FY07
Less than 1yr
1~5 yr
5 ~ 10 yr
More than 10 yrs
(%)7.76 7.74 7.71 7.67 7.65
3.48 3.47 3.503.84 3.97
3Q FY09 4Q FY09 1Q FY10 2Q FY10 3Q FY10
4.47 4.33 4.20 3.68 3.64
0
2
4
6
8
10
0
5
10
15
20
25
Mar
-04
Mar
-05
Mar
-06
Mar
-07
Mar
-08
Mar
-09
Mar
-10
Mar
-11
Mar
-12F
Mar
-13F
Mar
-14F
Mar
-15F
Mar
-16F
Mar
-17F
(Wtr)Separate account assets (LHS) Fees (RHS)
(%)

Nomura | ASIA Korea Life May 16, 2011
99
Risk factors A prolonged low interest rate environment would be most negative to Korea Life given that it has the highest proportion of high-yield guarantee policies. Its exposure to PF loans could also impose risk.
Prolonged low interest rate environment
More than valuation risk In addition to valuation risk, a prolonged low interest rate environment would impose operational risks, in our view. As the market rates fall, the disparity between portfolio rates and new money rates has widened. As a result, the company could continue to post negative variances. This could undermine the credibility of EV valuation and eventually result in a lower multiple.
Could trigger minimum guarantees Korea Life provides a guaranteed minimum accumulation benefit (GMAB) on its investment-linked products and minimum return guarantees on floating-rate policies. If the market rates fall below the given threshold, these guarantees could be triggered. Once insurers find themselves in this situation, insurers may compromise risk management standards to boost yields.
Harder to acquire new business A lower interest rate environment could have a negative impact on new business volume due to a lower crediting rate.
PF loans
Korea Life has W1tn in PF loans Korea Life has W1tn in PF loans outstanding that relates to housing projects. Although the housing market has improved and unsold apartment numbers have fallen steadily for the past two years, we have seen continuous filings of court receivership by medium-size construction companies recently. That said, we think Korea Life may face downward pressure whenever PF loans become an issue in the market. The company has noted that all of its PF loans are guaranteed by larger constructors and projects are located in Seoul and metropolitan areas where demand is healthy.
Unsold units falling quickly Constructors have reduced new supply since the financial crisis and unsold units have been declining rapidly. The company has noted that most of its projects are located in Seoul and metropolitan areas where unsold units are minimal.
Fig. 217: Unsold housing unit trend Sharp drop in number of unsold units after peak in December 2008
Source: MLTM, Nomura research
Fig. 218: Unsold units by region Most unsold units are in provincial areas
Source: MLTM, Nomura research
0
30,000
60,000
90,000
120,000
150,000
180,000
Jun
-96
Jun
-97
Jun
-98
Jun
-99
Jun
-00
Jun
-01
Jun
-02
Jun
-03
Jun
-04
Jun
-05
Jun
-06
Jun
-07
Jun
-08
Jun
-09
Jun
-10
(# of units)165,599 units in Dec 2008
0
20
40
60
80
100
120
140
160
180
2000
2001
2002
2003
2004
2005
2006
2007
2008
2009
2010
2011
('000 units)
Metropolitan Provincial

Nomura | ASIA Korea Life May 16, 2011
100
Korea Life Company overview
Company history Established in 1946, Korea Life was the first life insurance company in Korea. Korea Life has grown to become the second-largest life insurance company after Samsung Life in terms of total assets and gross premium. The company started its overseas business in 2009 by establishing a subsidiary in Vietnam.
Fig. 219: Key historical milestones
Date History
1946. 6 Established as first life insurance company
1986. 12 Surpass total asset of W1tn
1996. 5 Surpass total asset of W10tn
1999. 12 Acquire contracts from Duwon Life
2001. 4 Acquired contracts from Hyundai, Samshin Life
2002. 12 Joined Hanwha Group
2007. 7 Establish bases in London and New York
2008. 4 Surpass total asset of W50tn
2009. 4 Start operations in Vietnam
2010. 3 Listed in KRX
Source: DART, Company data, Nomura research
Fig. 220: Shareholding structure
Source: DART, Company data, Nomura research
Fig. 221: Korea life insurers ranking
Source: DART, Nomura research
Policy mix breakdown Korea Life derives 36% of total premium from protection type policies. We should note that protection type policies carry much higher embedded margin than wealth accumulation products such as annuities (56%) and savings type policies (8%). However, demand growth is coming from wealth accumulation products.
Distribution channel In terms of the distribution channel, Korea Life distributes its products mainly through traditional channels; exclusive solicitors (54%) and independent agents (12%). Bancassurance sales account for 13% of distribution (on initial premium basis), but should grow faster than other channels as the company becomes more receptive to bancassurance channel.
Hanwha E&C
24.9%
KDIC21.7%Hanwha
Corp21.7%
Hanwha Chemical
3.7%
Other Hanwha affiliates
0.0%
Others20.8%
Lazard Asset Management
7.2%
Company Amount M/S Company Amount M/S Company Amount M/S Company Amount M/S
1 Samsung Life 82,811 38% Samsung Life 99,116 36% Samsung Life 13,334 38% Samsung Life 34,440 23%
2 Korea Life 29,506 14% Korea Life 43,249 16% Korea Life 5,981 17% Korea Life 24,600 17%
3 Kyobo Life 27,105 13% Kyobo Life 39,367 14% Kyobo Life 4,568 13% Kyobo Life 22,122 15%
4 ING Life 10,311 5% ING Life 11,528 4% ING Life 1,739 5% Mirae Asset Life 8,696 6%
5 Allianz 9,462 4% Allianz 10,985 4% Prudential 1,193 3% Shinhan Life 7,834 5%
6 AIA Life 6,124 3% Shinhan Life 9,369 3% Tong Yang Life 1,095 3% Met Life 7,132 5%
7 Shinhan Life 6,044 3% Tong Yang Life 9,262 3% AIA Life 992 3% Allianz 6,821 5%
8 Tong Yang Life 5,831 3% Heung Kuk Life 8,486 3% Shinhan Life 966 3% ING Life 6,782 5%
9 Mirae Asset Life 5,722 3% KDB Life 7,397 3% Allianz 930 3% Tong Yang Life 6,033 4%
10 Heung Kuk Life 5,650 3% Mirae Asset Life 6,944 3% Met Life 763 2% Heung Kuk Life 5,029 3%
RankTotal asset (Wbn) Policy reserve (bn) Total Equity (Wbn) Exclusive solicitors (person)

Nomura | ASIA Korea Life May 16, 2011
101
Fig. 222: Policy mix
Source: Company data, Nomura research Note: Aggregated as of 3Q10
Fig. 223: Distribution channel breakdown
Source: Company data, Nomura research Note: Aggregated as of 3Q10
Management profile In February 2011, Nam-Gyu Cha was appointed the CEO of Korea Life. Prior to this position, Mr Cha was Co-vice President of insurance sales at Korea Life. He was also the head of Hanwha TechM in 2007.
Changes in shareholding structure Prior to IPO, Korea Life was 67% owned by Hanwha Group and affiliates, and 33%-owned by Korea Deposit Insurance Corporation (KDIC). After the listing, Hanwha Group and KDIC reduced their shareholdings to 54.6% and 25%, respectively.
Fig. 224: Shareholding structure
Source: Nomura research
Protection(general)
23%
Protection(separate)
13%
Annuities (general)
23%
Annuities (Separate)
33%
Savings8%
Group0%
Exclusive solicitor
54%
Independent agent12%
Bancassurance13%
Direct marketing
1%
Corporate sales20%
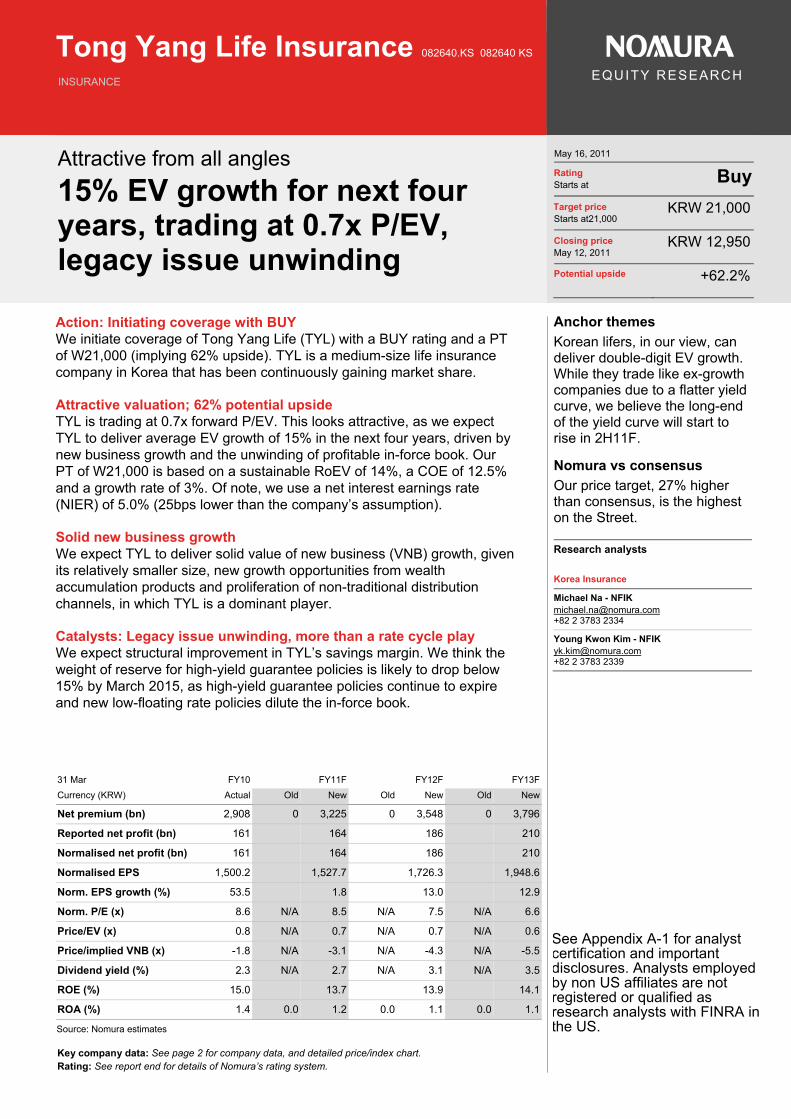
Key company data: See page 2 for company data, and detailed price/index chart. Rating: See report end for details of Nomura’s rating system.
Tong Yang Life Insurance 082640.KS 082640 KS
INSURANCE
EQUITY RESEARCH
Attractive from all angles
15% EV growth for next four years, trading at 0.7x P/EV, legacy issue unwinding
May 16, 2011
Rating Starts at
Buy
Target price Starts at21,000
KRW 21,000
Closing price May 12, 2011
KRW 12,950
Potential upside +62.2%
Action: Initiating coverage with BUY We initiate coverage of Tong Yang Life (TYL) with a BUY rating and a PT of W21,000 (implying 62% upside). TYL is a medium-size life insurance company in Korea that has been continuously gaining market share.
Attractive valuation; 62% potential upside TYL is trading at 0.7x forward P/EV. This looks attractive, as we expect TYL to deliver average EV growth of 15% in the next four years, driven by new business growth and the unwinding of profitable in-force book. Our PT of W21,000 is based on a sustainable RoEV of 14%, a COE of 12.5% and a growth rate of 3%. Of note, we use a net interest earnings rate (NIER) of 5.0% (25bps lower than the company’s assumption).
Solid new business growth We expect TYL to deliver solid value of new business (VNB) growth, given its relatively smaller size, new growth opportunities from wealth accumulation products and proliferation of non-traditional distribution channels, in which TYL is a dominant player.
Catalysts: Legacy issue unwinding, more than a rate cycle play We expect structural improvement in TYL’s savings margin. We think the weight of reserve for high-yield guarantee policies is likely to drop below 15% by March 2015, as high-yield guarantee policies continue to expire and new low-floating rate policies dilute the in-force book.
31 Mar FY10 FY11F FY12F FY13F
Currency (KRW) Actual Old New Old New Old New
Net premium (bn) 2,908 0 3,225 0 3,548 0 3,796
Reported net profit (bn) 161 164 186 210
Normalised net profit (bn) 161 164 186 210
Normalised EPS 1,500.2 1,527.7 1,726.3 1,948.6
Norm. EPS growth (%) 53.5 1.8 13.0 12.9
Norm. P/E (x) 8.6 N/A 8.5 N/A 7.5 N/A 6.6
Price/EV (x) 0.8 N/A 0.7 N/A 0.7 N/A 0.6
Price/implied VNB (x) -1.8 N/A -3.1 N/A -4.3 N/A -5.5
Dividend yield (%) 2.3 N/A 2.7 N/A 3.1 N/A 3.5
ROE (%) 15.0 13.7 13.9 14.1
ROA (%) 1.4 0.0 1.2 0.0 1.1 0.0 1.1
Source: Nomura estimates
Anchor themes
Korean lifers, in our view, can deliver double-digit EV growth. While they trade like ex-growth companies due to a flatter yield curve, we believe the long-end of the yield curve will start to rise in 2H11F.
Nomura vs consensus
Our price target, 27% higher than consensus, is the highest on the Street.
Research analysts
Korea Insurance
Michael Na - NFIK [email protected] +82 2 3783 2334
Young Kwon Kim - NFIK [email protected] +82 2 3783 2339
See Appendix A-1 for analyst certification and important disclosures. Analysts employed by non US affiliates are not registered or qualified as research analysts with FINRA in the US.

Nomura | ASIA Tong Yang Life Insurance May 16, 2011
103
Key data on Tong Yang Life Insurance Profit and Loss (KRWbn) Year-end 31 Mar FY09 FY10 FY11F FY12F FY13FGross premiums 2,271 2,909 3,229 3,551 3,800Government charges
Reinsurance ceded -1 -1 -3 -4 -4Net written premium 2,270 2,908 3,225 3,548 3,796Change in unearned premium reserves
Net earned premium 2,270 2,908 3,225 3,548 3,796Claims and benefit payments -1,029 -1,328 -1,499 -1,686 -1,857Change in reserves -1,034 -1,235 -1,406 -1,573 -1,713Commission and DAC expenses -387 -341 -366 -398 -430Other expenses -141 -288 -312 -331 -331Underwriting surplus -321 -283 -359 -440 -535Recurrent investment income 414 465 537 639 763Realised and unrealised gains
Investment income 414 465 537 639 763Other income
Employee share expense
Operating profit 93 182 179 199 228Amortisation
Other non-operating income 48 38 38 39 40Associates and JCEs
Pre-tax profit 140 220 217 238 269Income tax -35 -58 -52 -52 -59Net profit after tax 105 161 164 186 210Minority interests
Other items
Preferred dividends
Normalised NPAT 105 161 164 186 210Extraordinary items
Reported NPAT 105 161 164 186 210Dividends -32 -32 -38 -43 -48Transfer to retained earnings 73 129 127 143 161
Valuation and ratio analysis
FD normalised P/E (x) 13.3 8.6 8.5 7.5 6.6FD normalised P/E at price target (x) 21.5 14.0 13.7 12.2 10.8Reported P/E (x) 13.3 8.6 8.5 7.5 6.6Dividend yield (%) 2.3 2.3 2.7 3.1 3.5Price/book (x) 1.4 1.2 1.1 1.0 0.9Investment return (%) na na na na naRecurrent investment return (%) na na na na naNon-recurrent return/invt. return (%) 0.0 0.0 0.0 0.0 0.0Price/EV (x) 0.9 0.8 0.7 0.7 0.6Price/implied VNB (x) -0.7 -1.8 -3.1 -4.3 -5.5Loss ratio (%)
Combined ratio (%)
Effective tax rate (%) 25.1 26.5 24.2 22.0 22.0Dividend payout (%) 30.7 20.0 22.9 23.2 23.1ROE (%) 12.6 15.0 13.7 13.9 14.1ROA (%) 1.04 1.37 1.20 1.13 1.08ROR (%) na na na na na
Growth (%)
Life premiums 28.1 11.0 10.0 7.0Non life premiums na na na naNet profit 53.5 1.8 13.0 12.9Normalised EPS 53.5 1.8 13.0 12.9Normalised FDEPS 53.5 1.8 13.0 12.9Source: Nomura estimates
Notes
Premium growth to outpace industry average as the company gains market share.
Price and price relative chart (one year)
(%) 1M 3M 12M
Absolute (KRW) 2.8 2.8 0.0
Absolute (USD) 2.6 6.4 4.2
Relative to index 0.9 -4.9 -28.8
Market cap (USDmn) 1,273.1
Estimated free float (%) 52-week range (KRW)
14700/11200
3-mth avg daily turnover (USDmn)
1.49
Major shareholders (%) Vogo Fund 58.4
11000
11500
12000
12500
13000
13500
14000
14500
15000
65
70
75
80
85
90
95
100
105
Jun
10
Jul 1
0
Aug
10
Sep
10
Oct
10
Nov
10
Dec
10
Jan
11
Feb
11
Mar
11
Apr
11
May
11
PriceRel MSCI Korea(KRW)

Nomura | ASIA Tong Yang Life Insurance May 16, 2011
104
Balance Sheet (KRWbn) As at 31 Mar FY09 FY10 FY11F FY12F FY13FCash and deposits 167 407 504 615 731Bonds 3,219 4,430 5,617 6,643 7,632Equities 245 242 440 716 1,075Unit trusts
Loans and mortgages 2,352 2,681 3,176 3,691 4,172Foreign investments 172 261 530 910 1,412Real estate 688 460 566 684 808Other investments 1,351 1,007 983 1,213 1,459Total investments 8,195 9,488 11,815 14,472 17,290Deferred acquisition costs 799 830 896 974 1,053Prepaid and unearned prem. reserves
Debtors and prepayments
Fixed assets
Goodwill
Separate account assets 1,676 1,819 1,950 2,081 2,215Other assets 416 305 339 373 399Total assets 11,087 12,442 15,000 17,900 20,955Insurance reserves 7,810 8,978 11,313 13,914 16,686Catastrophe reserves
Insurance protection fund
Deposit and investment contracts
Separate account liabilities 1,715 2,288 3,054 4,076 5,440Provision for Unearned Premiums
Provision for Outstanding Claims
Interest bearing liabilities
Other liabilities 541 47 -633 -1,499 -2,740Total liabilities 10,066 11,313 13,734 16,492 19,386Minority interest
Common stock 743 751 751 751 751Preferred stock
Retained earnings 223 320 447 589 750Proposed dividends
Other equity 55 58 69 69 69Shareholders' equity 1,021 1,129 1,266 1,408 1,569Total liabilities and equity 11,087 12,442 15,000 17,900 20,956
Balance sheet ratios (%)
Life solvency margin na na na na naNon-life solvency margin
Net premiums/equity 222.3 257.5 254.8 251.9 241.9Tech. reserves/total premiums 343.9 308.7 350.4 391.8 439.1
Investment portfolio mix (%)
Cash and deposits 2.0 4.3 4.3 4.2 4.2Bonds 39.3 46.7 47.5 45.9 44.1Equities 3.0 2.5 3.7 4.9 6.2Unit trusts 0.0 0.0 0.0 0.0 0.0Loans and mortgages 28.7 28.3 26.9 25.5 24.1Foreign investments 2.1 2.8 4.5 6.3 8.2Real estate 8.4 4.8 4.8 4.7 4.7Other investments 16.5 10.6 8.3 8.4 8.4
Per share
Reported EPS (KRW) 977.15 1,500.19 1,527.67 1,726.25 1,948.59Norm EPS (KRW) 977.15 1,500.19 1,527.67 1,726.25 1,948.59Fully diluted norm EPS (KRW) 977.15 1,500.19 1,527.67 1,726.25 1,948.59DPS (KRW) 300.00 300.14 350.16 400.19 450.21BVPS (KRW) 9,494.34 10,497.94 11,768.74 13,094.80 14,593.18Life/LT EVPS (KRW) 13,864.24 15,555.49 17,630.81 19,765.23 22,144.13Life/LT VNBPS (KRW) 1,320.32 1,427.28 1,494.47 1,569.47 1,663.49Value of non-life bus. PS (KRW) 0.00 0.00 0.00 0.00 0.00Source: Nomura estimates
Notes
Unwinding of profitable in-force book to drive earnings growth.

Nomura | ASIA Tong Yang Life Insurance May 16, 2011
105
Attractive from all angles We initiate coverage of Tong Yang Life (TYL) with a BUY rating and a PT of W21,000. We believe TYL provides a cheap entry point, considering its solid growth profile and likelihood of becoming the first Korean life insurer to be free from negative spread legacy issues, making it more than just a rate cycle play.
Solid growth profile
EV growth of 15% for the next four years We believe TYL is able to deliver average EV growth of 15% over the next four years, driven by new business growth and the unwinding of profitable in-force book. We forecast its VNB will grow 5% in each of FY11F and FY12F. Although we expect demand growth to come from its less profitable wealth accumulation products, we believe TYL is able to grow its VNB through faster volume growth, thanks to proliferation of non-traditional distribution channels in which TYL is a dominant player.
Gaining market share In our opinion, TYL should deliver solid VNB growth given its relatively smaller size and proliferation of non-traditional distribution channels. TYL’s regular initial premium market share increased from 1.9% in 2001 to 6.3 % in the first three quarters of FY10, due to its early adoption of non-traditional distribution channels. Of note, TYL is the third-largest player in direct marketing channels in the Korean insurance segment with a 9.0% share vs a 2.5% share for the exclusive solicitor channel.
Competition weakening The reluctance of the three largest Korean life insurers (Samsung Life, Korea Life and Kyobo Life) to adopt fast-growing non-traditional channels, due to channel conflicts with the exclusive solicitors, should enable TYL to gain further market share, in our view. TYL will also likely benefit from foreign life insurers and other medium size domestic life insurers that lost a large number of exclusive solicitors during the financial crisis.
Embedded profitability to improve We expect TYL’s loading margin to improve, as it enjoys greater operating leverage with growth. Its risk margin should also improve, as the company increased its death benefit proportion (vs. living benefit) amid an improving mortality rate and increased flexibility in the use of mortality table as of 2006.
Positive long-term industry outlook We see growth opportunities for Korean life insurers as they transform into wealth managers and providers of protection for longevity from providers of protection against mortality and morbidity risks. We believe that, as the first baby boomers (born in 1946~1964) start to retire, the demand for products that provide lifetime income and long-term care insurance will likely pick up. The second group of baby boomers (born in 1968~1976) will be the continued source of demand for death insurance and investment-oriented life insurance products (with tax advantages), in our view.
Buying at the bottom of a rate cycle
Trading at 0.7x P/EV TYL is now trading at 0.7x forward P/EV. We think the stock is trading at a very depressed level due to a flatter yield curve. Although the central bank, Bank of Korea, has raised its key policy rate by 100bps since July 2010, the long-end of the yield curve has been falling continuously. However, we believe the long-end should start to rise in 2H11F.
Long-term benefits from rising interest rates The benefit from rising interest rates is clearly evident for TYL, given that fixed-rate policies make up 56% of its in-force book. A 50bps increase in investment yield assumption would boost its EV by 9.5%, according to our sensitivity analysis.

Nomura | ASIA Tong Yang Life Insurance May 16, 2011
106
Rate hike campaign to continue Our economist Young Sun Kwon expects two more rate hikes for the rest of 2011, and another two in 1H12F, lifting the terminal policy rate of the current cycle to 4.0% by 2Q12F. Meanwhile, he thinks that real policy rates should remain negative, doing little to limit inflationary pressure unless it is combined with KRW appreciation.
Bond market will eventually react to growing concerns on inflation Young Sun notes that CPI inflation should rise above 4% in 2011F, exceeding the BOK's target band. Interest rate hikes, coupled with a stronger KRW and price control, should partly offset cost-push inflation pressures from higher oil prices. However, rising nominal wages and housing rents are also adding to inflation. Young Sun forecasts Korea’s CPI inflation to rise from 2.9% in 2010 to 4.4% in 2011F, before easing to 3.6% in 2012F. We think that the long end of the bond market will eventually react to growing concerns on inflation.
Foreign capital inflow to slow Whether hunting for better yields or expecting KRW appreciation, foreign capital inflows have been adding pressure on the long-end since 2H 2009. However, with the ECB turning hawkish and the Fed's QE2 programme winding down, foreign capital inflows may slow and we may even witness outflows going forward. We think that the long-end of the yield curve could be lifted with rising interest rates in developed markets, as we have seen in 4Q10. In addition, the recent strengthening of KRW could hinder foreign capital inflows (funds pouring into Korea on expectations of KRW appreciation), further lifting pressure on the long-end.
Long-end to rise slowly but surely Young Sun forecasts that the five-year treasury yield will start to rise in 3Q11F and reach 4.5% by the end of 1H 2012F from the current yield of 4.0%, and the three-year treasury will reach 4.2% by the end of 1H 2012F from the current yield of 3.6%.
Legacy issue unwinding
First to be free from negative books TYL was relatively smaller in the 1990s when high-yield guarantee policies were sold, with less than 2% of market share compared with the current share of 6.7%. This has given TYL a relatively smaller negative spread book. We expect the reserve for high-yield guarantee policies as a proportion of total interest-bearing reserve to fall below 15% by FY15F from 30% in FY11F, as high-yield guarantee policies continue to expire and new low-yield floating rate policies dilute the in-force book.
Structural improvement We think Korea’s larger life insurers will likely move with the market rates, due mainly to their large negative spread books. However, as we expect TYL to be free from the legacy issue in the medium term, we believe the stock will be less affected by the market rates.
Potential M&A play
Vogo Fund now the largest shareholder Tong Yang Group sold a 44.05% stake in TYL to Vogo Fund and a 2.46% stake to MinJu Lee at a price of KRW18,000 on 23 March 2011. MinJu Lee is the former chairman of C&M (a cable company now owned by Macquarie and MBK Partners). Tong Yang Group now only owns 3% of TYL.
MinJu Lee could take over if he wants Tong Yang Group has an option to buy back 30% share from Vogo Fund. This means that Vogo could sell the rest of its stake (27.55%) to any party. If MinJu Lee were to buy the stake and purchase an additional 3% in the market, he would become the largest shareholder. Given that he has sold C&M for KRW1.46tn, we would think he has significant capital for investment.

Nomura | ASIA Tong Yang Life Insurance May 16, 2011
107
PF loans could impose risk
W270bn in PF loans We are not totally comfortable with the asset quality of TYL’s loan portfolio, as the company has W270bn (25% of shareholders’ equity) in project financing (PF) loans relating to real estate projects. We have seen several contractors in Korea turning to court receivership lately.
Court receivership / workout of construction companies Earlier this year, we witnessed the court receivership / workout cases of several construction companies ranked in the Top 100 by building capacity. The names include World Construction, Jin Heung Corp, LIG E&C, Dongyang E&C and Sambu Construction.
Restructuring of construction sector winding down However, exposure for the insurance sector remains limited with a smaller PF loan balance of KRW4.9tn, which translates to only 7% of the total KRW67tn in PF loans remaining in the system. In addition, almost 40 constructors previously ranked in the Top 100 have entered court receivership / workout programmes. That said, the possibility of more firms following suit remains low, in our view.
Fig. 225: Constructors ranked in Top 50 that have entered workout / court receivership
Source: MLTM, Nomura research
Limited downside risk Going forward, we expect default from the construction sector to be largely mitigated, given: 1) continuing signs of recovery in the domestic housing market; and 2) high likelihood for major shareholders to make capital injections to free up liquidity. According to local press (Korea Economic Daily, 3 May, 2011), Doosan Group announced a capital injection of KRW500bn to its affiliate Doosan E&C. Hyosung, STX Group and Daelim Industrial have followed suit with similar capital injections to free up liquidity for affiliates in the construction sector.
Rank Construction Firm Rank Construction Firm
12 Kumho Industrial 38 Namkw ang Corp
17 Kyeongnam Corp 39 Hanil Construction
22 Halla E&C 40 Jinheung Corp.
25 Poonglim Industrial 47 Samho
26 Byucksan E&C 49 Hw asung Industrial
31 Shindongah Construction 46 Kumkw ang Corp
35 Namyang E&C 44 Dongyang E&C

Nomura | ASIA Tong Yang Life Insurance May 16, 2011
108
Fig. 226: TYL- Financial Summary
Source: Company data, Nomura research
Profit and Loss StatementsWon billions, Year ending Mar 31 FY07 FY08 FY09 FY10F FY11F FY12F FY13F FY14F FY15FTotal Premium 2,447 2,590 2,883 3,553 3,906 4,266 4,554 4,839 5,081 General Account 1,860 2,028 2,270 2,908 3,225 3,548 3,796 4,043 4,245 Separate Account 586 562 613 645 681 718 758 796 835
Premium Income 1,862 2,030 2,271 2,909 3,229 3,551 3,800 4,047 4,249Risk Premium 240 257 272 344 371 398 414 429 438Loading Premium 643 715 691 698 759 817 855 890 914Savings Premium 978 1,056 1,307 1,866 2,099 2,337 2,531 2,728 2,898
Benefits Paid 205 233 247 307 330 354 369 382 390U/W Expenses 538 611 524 628 682 732 765 795 815
Net of Acquisition Costs & DAC Deferral 20 12 12 20 0 0 0 0 0Acquisition Cost 428 485 395 388 432 476 509 542 569DAC Deferral (409) (473) (383) (368) (432) (476) (509) (542) (569)
Amortization of DAC 276 378 387 341 366 398 430 463 493Net Increase in DAC 132 95 (4) 31 66 78 79 79 76Maintenance Costs 110 126 129 237 249 257 256 253 246
Maturity & Surrender Refund 894 918 901 1,021 1,169 1,332 1,488 1,664 1,846Changes in Premium Reserve 461 580 919 1,235 1,406 1,573 1,713 1,855 1,971Net Investment Income 322 325 414 465 537 639 766 914 1,071
Risk & Loading Margins 139 128 192 106 118 128 135 142 147Savings Margin (56) (118) (100) 75 61 72 95 123 152Operating Profit 83 11 93 182 179 200 230 265 299Non-operating Profit 22 30 48 38 38 39 40 42 44
Commission Income (Separate Account) 27 46 52 43 45 46 48 49 52Others (6) (15) (5) (5) (7) (7) (7) (7) (8)
Pre-tax Profits 105 41 140 220 217 239 271 307 344Effective Tax 23 8 35 58 52 53 60 67 76Net Profits 81 33 105 161 164 186 211 239 268
Selective Balance Sheet DataFY07 FY08 FY09 FY10F FY11F FY12F FY13F FY14F FY15F
Total Assets 8,013 9,140 11,087 12,442 15,000 17,921 21,023 24,315 27,728Invested Assets 6,011 6,689 8,183 9,488 11,815 14,494 17,357 20,410 23,592
Cash & Deposits 461 230 167 312 393 484 580 682 788Securities 3,134 3,749 4,987 5,442 7,065 9,024 11,236 13,717 16,440
Stocks 364 273 245 280 421 610 851 1,150 1,511Other Equity Investment 23 25 26 26 28 29 28 23 16Fixed Income Instrument 2,747 3,450 4,715 5,136 6,616 8,384 10,357 12,543 14,913
Net Loans 1,824 2,050 2,352 3,055 3,564 4,078 4,530 4,912 5,198Real Estate 592 661 676 678 793 908 1,011 1,099 1,166
Non-invested Assets 970 1,185 1,228 1,135 1,235 1,347 1,451 1,557 1,654DAC 709 803 799 830 896 974 1,053 1,132 1,208Others 261 382 428 305 339 373 399 425 446
Separate Account Assets 1,032 1,266 1,676 1,819 1,950 2,081 2,215 2,348 2,483
Total Liabilities 7,479 8,494 10,066 11,314 13,734 16,513 19,452 22,552 25,746Policy Reserve 6,012 6,778 7,833 8,978 11,313 13,914 16,686 19,618 22,649
Premium Reserve 5,758 6,505 7,501 8,613 10,948 13,526 16,282 19,200 22,223Reserve for Outstanding Claims 232 251 288 319 343 368 383 396 404Reserve for Unearned Premium 4 3 2 2 0 0 0 0 0Reserve for Policyholders' Dividend 18 20 21 21 21 21 21 21 21Excess Reserve for Policyholders' Dividend 3 1 2 4 4 4 4 4 4Reinsurance Premium Reserve 0 0 0 0 0 0 0 0 0
Adjustment of Policyholder 2 11 17 20 20 20 20 20 20Other Liabilities 394 421 500 409 452 497 532 567 595Separate Account Liabilities 1,032 1,266 1,676 1,819 1,950 2,081 2,215 2,348 2,483
Total Shareholders' Equity 534 646 1,021 1,129 1,266 1,409 1,572 1,762 1,982Paid in Capital 438 484 538 543 543 543 543 543 543Capital Surplus 7 81 205 207 207 207 207 207 207Retained Earnings 86 118 223 320 447 590 753 944 1,163Capital Adjustment 3 (37) 54 58 68 68 68 68 68

Nomura | ASIA Tong Yang Life Insurance May 16, 2011
109
Fig. 227: TYL per share data and performance ratios
Source: Company data, Nomura research
Per Share DataWon billions, Year ending Mar 31 FY07 FY08 FY09 FY10F FY11F FY12F FY13F FY14F FY15FEarnings Per Share (Won) 961 337 977 1,502 1,529 1,731 1,964 2,225 2,493Book Value Per Share (Won) 6,328 6,680 9,494 10,495 11,767 13,099 14,613 16,388 18,430ROA (%) 1.1 0.4 1.0 1.4 1.2 1.1 1.1 1.1 1.0ROE (%) 16.7 5.5 12.6 15.0 13.7 13.9 14.2 14.4 14.3EPS Growth (%) 17.0 (64.9) 189.6 53.7 1.8 13.2 13.5 13.3 12.0
Gross Dividend 0 0 0 32 38 43 48 48 48DPS (Won) 0 0 0 300 350 400 450 450 450Dividend Payout Ratio (%) 0.0 0.0 0.0 6.0 6.0 6.0 5.5 5.5 5.0Issued Shares (million) - Common 84 97 108 108 108 108 108 108 108
PERFORMANCE RATIOSWon billions, Year ending Mar 31 FY07 FY08 FY09 FY10F FY11F FY12F FY13F FY14F FY15FGrowth (%)Total Premium 30.6 5.9 11.3 23.3 9.9 9.2 6.7 6.3 5.0 General Account 17.7 9.0 11.9 28.1 10.9 10.0 7.0 6.5 5.0 Separate Account 100.8 (4.2) 9.1 5.3 5.5 5.5 5.5 5.0 5.0Risk Margin 77.3 (30.7) 7.9 43.6 11.8 7.1 4.1 3.6 2.0Loading Margin (9.9) (0.8) 59.6 (58.1) 10.5 9.4 6.4 5.8 4.2Savings Margin NM NM NM NM (0.2) 0.2 0.3 0.3 0.2Commission Income 45.5 66.5 14.4 (17.8) 4.3 2.1 4.0 3.6 5.8Net Profits 23.9 (59.7) 221.8 53.7 1.8 13.2 13.5 13.3 12.0Total Assets 18.0 14.1 21.3 12.2 20.6 19.5 17.3 15.7 14.0Invested Assets 12.4 11.3 22.3 16.0 24.5 22.7 19.8 17.6 15.6Net Loans 21.3 12.4 14.8 29.9 16.7 14.4 11.1 8.4 5.8Policy Reserve 12.1 12.7 15.6 14.6 26.0 23.0 19.9 17.6 15.4Shareholders' Equity 22.6 21.1 58.0 10.5 12.1 11.3 11.6 12.1 12.5
Premium Income Mix (%)Risk Premium 12.9 12.7 12.0 11.8 11.5 11.2 10.9 10.6 10.3Loading Premium 34.5 35.2 30.4 24.0 23.5 23.0 22.5 22.0 21.5Savings Premium 52.5 52.0 57.5 64.2 65.0 65.8 66.6 67.4 68.2
Margin Analysis (%)Risk Margin / Risk Premium 14.2 9.2 9.3 10.6 11.0 11.0 11.0 11.0 11.0Loading Margin / Loading Premium 16.4 14.6 24.1 10.0 10.2 10.3 10.5 10.7 10.8Savings Margin / Savings Premium (5.8) (11.1) (7.6) 4.0 2.9 3.1 3.8 4.5 5.3Net Investment Yield 5.8 5.3 5.7 5.4 5.2 5.0 4.9 5.0 5.0Net Interest Margin 6.0 6.8 6.5 5.7 5.5 5.3 5.3 5.3 5.4Effective Comm. Rate on Separate Account 3.3 4.0 3.6 2.5 2.3 2.2 2.2 2.1 2.1
Investment Mix (%)Cash & deposits 7.7 3.4 2.0 3.3 3.3 3.3 3.3 3.3 3.3Securities 52.1 56.0 60.9 57.4 59.8 62.3 64.7 67.2 69.7Net loans 30.3 30.6 28.7 32.2 30.2 28.1 26.1 24.1 22.0Real estate 9.8 9.9 8.3 7.2 6.7 6.3 5.8 5.4 4.9
Securities Mix (%)Stock 11.6 7.3 4.9 5.1 6.0 6.8 7.6 8.4 9.2Money invested 0.7 0.7 0.5 0.5 0.4 0.3 0.2 0.2 0.1Gov't and public bonds 20.9 9.1 28.0 23.1 30.1 29.7 29.3 28.8 28.4Special bonds 17.9 21.4 23.3 22.4 22.0 21.6 21.2 20.8 20.4Corporate bonds 21.5 21.0 13.2 9.5 9.6 9.6 9.7 9.8 9.9Beneficiary certificates 16.9 15.9 12.5 24.5 21.8 19.0 16.3 13.5 10.8Overseas securities 6.3 5.8 3.4 2.6 5.5 8.4 11.3 14.2 17.1Structured securities 0.0 0.0 0.0 0.0 0.5 1.0 1.5 2.0 2.5Others 4.1 4.6 3.8 4.8 4.2 3.6 2.9 2.3 1.6
Balance Sheet Strucuture (%)Avg Equity/Avg Assets 6.5 6.9 8.2 9.1 8.7 8.1 7.7 7.4 7.2Avg Invested Assets / Avg Asets 76.7 74.0 73.5 75.1 77.6 79.9 81.8 83.3 84.5Avg Separate Account Assets / Avg Asets 11.2 13.4 14.5 14.9 13.7 12.2 11.0 10.1 9.3Policy Reserve / Premium Income 322.9 333.9 344.9 308.7 350.4 391.8 439.1 484.8 533.0Period-End Equity/Assets 6.7 7.1 9.2 9.1 8.4 7.9 7.5 7.2 7.1Avg Equity / Premium Income 26.0 29.1 36.7 37.0 37.1 37.7 39.2 41.2 44.1Solvency Margin Ratio 217.3 180.1 258.1 261.7 261.5 261.2 260.2 258.9 257.1

Nomura | ASIA Tong Yang Life Insurance May 16, 2011
110
Valuation TYL is trading at an attractive multiple of 0.7x forward P/EV. As the long-end of the yield curve starts to rise, we think the stock should trade up to our target price of W21,000. Rising market rates are a key share-price catalyst, in our view.
PT of W21,000, implying significant upside
Valuation attractive trading at 0.7x forward P/EV We value TYL on an embedded value basis, applying a P/EV multiple of 1.2x forward EV. We assume a sustainable RoEV of 14%, a COE of 12.5% and a growth rate of 3%. We used a higher COE than other life insurers to reflect TYL’s relatively smaller size and liquidity.
Our RoEV forecast could be on the conservative side Of note, our estimated sustainable RoEV would be 1ppt higher if we were to exclude the negative variance we have reflected in our forecast; we noticed the negative variance in FY08 and FY09. We would likely remove the assumed negative variances should we gain more confidence in TYL's EV.
EV adjusted to reflect lower market rates We assume a lower net investment earnings rate (NIER) for the purpose of EV forecast. TYL used an NIER of 5.25% for its FY09 EV calculation. In comparison, we assume an NIER 5.0%.
Fig. 228: EV projection and PT
Source: Company data, Nomura research
PT would be KRW30,000 based on the appraisal value methodology The implied NBM is 2.4x our PT. However, using the appraisal value method, we could justify up to 8.0x NBM. Of note, we only reflect a 10-year projection in our NBM calculation. Typically, a 30-year DCF model is used in the region to derive NBM. However, due to the infancy of the EV valuation methodology in Korea, we do not want to pay for more than 10 years.
More appropriate to use P/EV There is upside potential to our PT using the appraisal value method. However, we think it is more appropriate to use the P/EV methodology for TYL, given some negative variance seen in the EV, which may not be captured in the NBM technique. In addition, the technique ignores near-term changes in EV growth profile.
Fig. 229: VNB projection and target NBM using appraisal valuation method
Source: Company data, Nomura estimates
(Wbn) FY09 FY10F FY11F FY12F FY13F FY14FAdjusted net worth (ANW) 1,019 1,127 1,260 1,400 1,559 1,750 Value of in-force business (VIF) 472 546 635 728 837 953 Embedded value (EV) 1,491 1,673 1,895 2,128 2,396 2,703 Growth of EV (RoEV) 14.4% 15.5% 14.6% 14.9% 14.8%Current mkt cap 1,334 1,334 1,334 1,334 1,334 1,334 P/EV 0.9 0.8 0.7 0.6 0.6 0.5 VNB 142 154 161 169 179 190 NBM (1.1) (2.2) (3.5) (4.7) (5.9) (7.2)
Target multiple 1.2 Target mkt cap for insurance business 2,274 Target price 21,000 Implied NBM 2.4
(Wbn) FY11F FY12F FY13F FY14F FY15F FY16F FY17F FY18F FY19F FY20FAnnualized premium equivalent (APE) 992 1,062 1,136 1,210 1,282 1,353 1,421 1,477 1,536 1,598 New business margin 16.2% 15.9% 15.8% 15.7% 15.7% 15.6% 15.5% 15.5% 15.5% 15.5%Value of new business (VNB) 161 169 179 190 201 211 221 229 238 248 Discount factor 1.0 1.1 1.2 1.4 1.5 1.7 1.9 2.1 2.3 2.6 PV of VNB 161 152 145 139 132 125 118 110 103 97 Sum of PV 1,283 Implied multiple 8.0

Nomura | ASIA Tong Yang Life Insurance May 16, 2011
111
Valuation cross-check
With Samsung F&M Samsung F&M is trading at a trailing P/EV of 1.3x and an NBM of 4.3x; historically, it has never traded below 1.1x trailing P/EV. In comparison, TYL is trading at a trailing P/EV of 0.8x and negative NBM. We believe TYL's EV growth profile measures up to that of Samsung F&M. Samsung F&M's average EV growth over the past five years is 15% compared to 15% for TYL for the next four years. That said, we think that the risk is greater on the upside in terms of valuation multiple.
Fig. 230: Samsung F&M P/EV trend Five year average P/EV was 1.6x
Source: Quantiwise, Nomura research
Fig. 231: Samsung F&M NBM trend Five year average NBM was 8.3x
Source: Quantiwise, Nomura research
With PBR methodology As more profitable new businesses continue to flow into its in-force book, we think return on shareholders' equity will likely improve to reach a sustainable level of 15% in the medium term. Our PT would be KRW15,000 (implying 19% upside) based on the PBR methodology.
But PBR could be misleading Given the long-tail nature of life insurance, we believe current earnings and book value cannot capture the value of current in-force book, especially if there is a significant difference in profitability between in-force book and new business (which is the case for Korean lifers who have been suffering from negative spread on legacy products). That said, investors should not miss out on TYL that looks attractive even on P/BV.
Valuation sensitivity
Rising interest rate positive for EV Rising market rates are a potential positive catalyst for the share price of TYL. Based on the sensitivity analysis provided by the company, a 50bps increase in investment yield assumption would boost the value of its in-force book by 27% and EV by 9.5%. Of note, the investment yield assumption is 5.25% and the actual yield for the first three quarters of FY11 is 5.7%. By comparison, the current average crediting rate is 5.67%.
100 120 140 160 180 200 220 240 260 280 300
Ma
r/0
6
Sep/0
6
Ma
r/0
7
Sep/0
7
Ma
r/0
8
Sep/0
8
Ma
r/0
9
Sep/0
9
Ma
r/1
0
Sep/1
0
Ma
r/1
1
(W'000)
1.0x
1.2x
1.5x
1.8x1.2x2.0x
100 120 140 160 180 200 220 240 260 280 300
Ma
r/0
6
Sep
/06
Ma
r/0
7
Sep
/07
Ma
r/0
8
Sep
/08
Ma
r/0
9
Sep
/09
Ma
r/1
0
Sep
/10
Ma
r/1
1
(W'000)
2.0x
5.0x
8.0x11.0x14.0x18.0x

Nomura | ASIA Tong Yang Life Insurance May 16, 2011
112
Fig. 232: EV sensitivity EV most sensitive to change in NIER assumption
Source: Nomura research
Fig. 233: EV sensitivity in % 50bps increase in NIER assumption to boost EV by 9.5%
Source: Nomura research
VNB more sensitive to risk discount rate and lapse ratio VNB is not sensitive to interest rates unlike VIF, as most of TYL’s new businesses are floating rate policies. VNB is rather sensitive to the lapse ratio since most policy cancellations occur in the first twenty five months and by definition, new business includes policies acquired in the past one year.
Fig. 234: VNB sensitivity VNB is not sensitive to NIER assumption
Source: Nomura research
Fig. 235: VNB sensitivity in % VNB most sensitive to lapse ratio assumption
Source: Nomura research
PT assuming 50bps increase in NIER
PT change would be minimal Our PT would not change in a meaningful way even if we were to assume a higher NIER, as it would only result in a lower RoEV eliminating low base effect. In addition, it would take time for higher market rates to flow through the fixed income portfolio.
We would not change TYL’s PT For TYL, we would not change our PT even with a higher NIER assumption. While we could lower our target multiple from 1.2x to 1.1x to reflect a lower RoEV in the near term, we believe RoEV will likely pick up in the medium term as higher market rates flow through its fixed income portfolio. Eventually, we should be able to apply a higher target multiple.
148 128
(200)
(150)
(100)
(50)
-
50
100
150
Dis
co
unt
rate
±1
%
NIE
R ±
50bp
s
La
ps
e ±
10%
Cla
ims ±
10
%
Main
tena
nc
e ±
10
%
(Wbn)
9.5%8.2%
(10)
(8)
(6)
(4)
(2)
0
2
4
6
8
10
Dis
cou
nt ra
te ±
1%
NIE
R ±
50
bp
s
Lap
se
±10
%
Cla
ims ±
10
%
Ma
inte
nan
ce
±10
%
(%)
12
20
(20)
(15)
(10)
(5)
0
5
10
15
20
Dis
cou
nt ra
te ±
1%
NIE
R ±
50
bps
Lap
se
±1
0%
Cla
ims ±
10
%
Main
ten
an
ce ±
10%
(Wbn)
13.1%
(15)
(10)
(5)
0
5
10
15D
isc
ount
rate
±1
%
NIE
R ±
50bp
s
Laps
e ±
10%
Cla
ims
±10
%
Mai
nte
nan
ce ±
10%
(%)

Nomura | ASIA Tong Yang Life Insurance May 16, 2011
113
Fig. 236: TYL’s EV projection and PT assuming 50bps increase in NIER Our PT would not change even assuming higher NIER
Source: Company data, Nomura research
(Wbn) FY09 FY10F FY11F FY12F FY13F FY14FAdjusted net worth (ANW) 1,019 1,127 1,261 1,398 1,571 1,787 Value of in-force business (VIF) 546 617 703 793 890 993 Embedded value (EV) 1,565 1,744 1,964 2,191 2,461 2,781 Growth of EV (RoEV) 13.5% 14.8% 13.7% 14.5% 15.0%Current mkt cap 1,334 1,334 1,334 1,334 1,334 1,334 P/EV 0.9 0.8 0.7 0.6 0.5 0.5 VNB 142 154 161 169 179 190 NBM (1.6) (2.7) (3.9) (5.1) (6.3) (7.6)
Target multiple 1.1 Target mkt cap 2,161 Target price 21,000 Implied NBM 1.2

Nomura | ASIA Tong Yang Life Insurance May 16, 2011
114
15% EV growth for next four years We expect TYL to deliver average EV growth of 15% a year for the next four years, driven by unwinding of profitable in-force book and solid new business growth.
Ahead of competition
Proliferation of non-traditional distribution channel has been the key TYL has been growing faster than its peers by expanding into non-traditional distribution channels. The Korean insurance market is still a push market where increasing points of contact with potential customers results in volume growth. TYL has the third-highest market share in direct marketing channels such as home shopping TV networks, Internet and telemarketing.
TYL is gaining market share Given that the non-traditional channels are growing faster than the traditional channels, we expect TYL to gain additional market share going forward. Of note, TYL holds a 9.0% share of non-traditional channel (bankassurance and direct marketing channels) compared with 2.5% for the traditional channels (exclusive solicitor and employees). TYL’s regular initial premium market share increased from 1.9% in 2001 to 6.3% in 2008.
Fig. 237: Traditional channel market share TYL has 2.5% MS of exclusive solicitor channel
Source: FSS, Nomura research
Fig. 238: Non-traditional channel market share TYL has 9.0% MS of non-traditional channel
Source: FSS, Nomura research
Balanced channel strategy The proportion of new business acquisition by bancassurance recently increased sharply due to increased demand for savings-type of policies. However, the company still maintains a better balanced distribution channel than its peers, in our view. We think that the multi-channel strategy is the right approach as it reduces dependency on one particular channel and allows faster implementation of new channel strategy.
Fig. 239: TYL's initial premium by channel
Source: KLIA, Nomura research
Fig. 240: TYL's new business market share trend
Source: KLIA, Nomura research
0 5 10 15 20 25 30 35 40 45
Mir
ae A
sset
To
ng Y
an
g
ING
Sh
inhan
Allia
nz
Ko
rea
Kyo
bo
Sam
sun
g
(%)
0
2
4
6
8
10
12
14
Ko
rea
KB
Car
dif
Wo
ori
Avi
va
Sam
sun
g
To
ng
Yan
g
Alli
anz
Sh
inha
n
(%)
0
20
40
60
80
100
Mar07 Mar08 Mar09 Mar10 Dec10
Banassurance Independent agents Direct marketing Solicitors(%)
4.8%5.0%
5.8%
6.1%6.3%
4.0
4.5
5.0
5.5
6.0
6.5
Mar07 Mar08 Mar09 Mar10 Jan11
(%)

Nomura | ASIA Tong Yang Life Insurance May 16, 2011
115
Competition weakening
The big three still not receptive of non-traditional channels The reluctance of the three largest Korean life insurers (Samsung Life, Korea Life and Kyobo Life) to adopt the fast-growing non-traditional channels, due to channel conflicts with the exclusive solicitors, should help TYL to gain further market share, in our view.
Foreign players damaged heavily during the crisis TYL should also benefit from foreign life insurers, namely ING Life and PCA Life, losing a large number of exclusive solicitors during the financial crisis. We have not seen foreign lifers rebuilding their sales force yet.
Other medium size local players were also damaged heavily In addition, we note that TYL's domestic competitor KDB Life (unlisted) has had deployed a similar distribution strategy but it weakened during the financial crisis. KDB Life, formerly Kumho Life, incurred significant investment losses during the financial crisis, which drag down its solvency margin to mere 30%. The company was later sold to Korea Development Bank. Mirae Asset Life (unlisted) also lost a large number of solicitors during the crisis. Mirae Asset Life had grown fast on the back of growing demand for investment linked insurance and its reputation as a leading asset manager. However, during the crisis, its new business volume for investment linked products fell sharply and so did the solicitors.
Fig. 241: ING Life & PCA Life solicitor trend ING Life and PCA Life lost 38% of their solicitors
Source: FSS, Nomura research
Fig. 242: KDB Life & Mirae Asset Life solicitor trend KDB and Mirae Asset Life lost 33% of their solicitors
Source: FSS, Nomura research
Fig. 243: Initial premium market share Foreign lifers losing out
Source: KLIA, Nomura research
Fig. 244: Medium size lifers' market share Mirae Asset and KDB losing out
Source: KLIA, Nomura research
6,000
7,000
8,000
9,000
10,000
11,000
12,000
13,000
14,000
3Q08 4Q08 1Q09 2Q09 3Q09 4Q09 1Q10 2Q10 3Q10 4Q10
10,000
12,000
14,000
16,000
18,000
20,000
22,000
3Q08 4Q08 1Q09 2Q09 3Q09 4Q09 1Q10 2Q10 3Q10 4Q10
0%
20%
40%
60%
80%
100%
Ma
r93
Ma
r94
Ma
r95
Ma
r96
Ma
r97
Ma
r98
Ma
r99
Ma
r01
Ma
r02
Ma
r03
Ma
r04
Ma
r05
Ma
r06
Ma
r07
Ma
r08
Ma
r09
Ma
r10
Ma
r11
Dec
10
Samsung Kyobo Korea SME Foreign
0%
1%
2%
3%
4%
5%
6%
7%
8%
9%
10%
Ma
r97
Ma
r98
Ma
r99
Ma
r01
Ma
r02
Ma
r03
Ma
r04
Ma
r05
Ma
r06
Ma
r07
Ma
r08
Ma
r09
Ma
r10
Ma
r11
De
c10
Tong Yang Mirae asset Kumho Shinhan

Nomura | ASIA Tong Yang Life Insurance May 16, 2011
116
VIF growth of 16% and 15% for FY11F and FY12F
In-force book growing fast We like TYL since its already profitable in-force book is growing at a fast pace, thanks to solid VNB growth. We expect VIF to grow 16% and 15% in FY11F and FY12F, respectively, driven by new business growth.
Significant contribution from VNB TYL's VNB as a proportion of VIF is significant at 29%. Of note, we have adjusted its VIF by lowering the NIER to 5% from 5.25%. We estimate VNB growth of 5% for each of FY11F and FY12F. Note that if we were to remove negative variances we reflected for the purpose of the VIF projection, then our VIF growth estimates would be 22% and 19% for FY11 and FY12, respectively.
Quality growth driven by new business In our view, growth driven by new businesses is healthier and deserves a higher valuation. We expect 34% of EV growth to come from the addition of VNB over the next two years.
Fig. 245: VIF growth profile
Source: Company data, Nomura research
Fig. 246: RoEV contribution breakdown
Source: Company data, Nomura research
VNB growth of 5% for FY11F and FY12F
Solid VNB growth We forecast VNB growth of 5% for each of FY11F and FY12F. We think that TYL should grow its annual premium equivalent (APE) by 7% on average for FY11F and FY12F, driven by continuous market share gain. Meanwhile, we believe that the new business margin will likely fall continuously given that most of growth is coming from lower-margin savings type policies and investment-linked products.
Fig. 247: APE and NB margin forecast
Source: Nomura research
393 478 569
663
158 167
175 183
0
200
400
600
800
1,000
Mar12 Mar13 Mar14 Mar15
VIF-VNB VNB(Wbn)
10.3% 9.4% 9.6% 10.0%
5.6%5.2% 4.8% 4.5%
0 2 4 6 8 10 12 14 16 18
Mar12 Mar13 Mar14 Mar15
RoEV from VIF and ANW RoEV from NB(%)
15
16
16
17
700
900
1,100
1,300
1,500
1,700
Mar1
2
Mar1
3
Mar1
4
Mar1
5
Mar1
6
Mar1
7
Mar1
8
Mar1
9
Mar2
0
Mar2
1
APE sales (Won bn) NB profit margin(Wbn) (%)

Nomura | ASIA Tong Yang Life Insurance May 16, 2011
117
Not too concerned about product mix change There have been some concerns on the company’s increased proportion of savings type policies in new business. Although its overall new business margin could fall (as savings type policies have lower embedded margins due to their lower risk premium proportion), we are not overly concerned given that the company is not shifting its existing channel capacity to savings type policies. The company has noted that the increase in the savings type policy proportion comes from adding additional bancassurance capacity.
Fig. 248: Policy mix trend Proportion of lower margin savings type increasing
Source: KLIA, Nomura research
Fig. 249: APE by policy type (KRW) But not at the expense of higher margin protection type
Source: KLIA, Nomura research
Slower persistency ratio recovery is a concern Samsung Life and Korea Life have shown a quick recovery in the thirteenth month persistency ratio. However, TYL's persistency ratio is not recovering as fast. TYL has noted that the most recent figures show that persistency ratio is improving steadily. We would become less bullish if its persistency ratio fails to recover to levels seen before the financial crisis. Of note, VNB is most sensitive to the persistency ratio.
Fig. 250: Current 13th month persistency ratio is 76%
Source: FSS, Nomura research
Fig. 251: Current 25th month persistency ratio is 56^
Source: FSS, Nomura research
12% and 11% ANW growth for FY11F and FY12F
ANW growth driven by unwinding of profitable book TYL's VIF, as a proportion of EV, is the highest among listed life insurers at 33% (based on FY11F) compared to 29% for Samsung Life and 11% for Korea Life. We think that the unwinding of profitable VIF should result in 12% and 11% ANW growth for FY11F and FY12F, respectively. We forecast TYL's earnings will grow by 13% and 12% in FY11F and FY12F, respectively. We attribute the projected earnings growth to strong improvement in premiums and risk and loading margins. In addition, we expect steady growth in commission income from separate accounts.
27% 21%32% 36%
40%43%
42% 34%
29% 30%20% 21%
5% 6% 6% 8%
Mar-08 Mar-09 Mar-10 Dec-10
Annuities Variable Protection Savings
0
50
100
150
200
250
300
350
1QF
Y3/
10
2QF
Y3/
10
3QF
Y3/
10
4QF
Y3/
10
1QF
Y3/
11
2QF
Y3/
11
3QF
Y3/
11
Corporate pension Savings
Annuities Protection (Separate)
Protection (General)
(Wbn)
60
65
70
75
80
85
90
1H
04
2H
04
1H
05
2H
05
1H
06
2H
06
1H
07
2H
07
1H
08
2H
08
1H
09
2H
09
1H
10
(%)Korea Samsung KyoboMirae asset Tong Yang
40
50
60
70
80
1H
04
2H
04
1H
05
2H
05
1H
06
2H
06
1H
07
2H
07
1H
08
2H
08
1H
09
2H
09
1H
10
(%)Korea Samsung KyoboMirae asset Tong Yang

Nomura | ASIA Tong Yang Life Insurance May 16, 2011
118
Fig. 252: Net profit projection
Source: Nomura model based
Fig. 253: ROE projection
Source: Nomura model based
In-force book profitability is improving We expect the profitability of in-force book to improve, driven mainly by improvement in loading margin and savings margin. We expect TYL’s loading margin to improve on increased operating leverage. In addition, savings margin is also expected to improve as the weight of high-yield guarantee policies declines.
Loading margin to improve TYL has one of the lowest operating expense ratios among Korea lifers. Its expense ratio is even lower than those of the Big-Three insurers, which have a much bigger scale. We think that with volume growth, TYL should enjoy operating leverage and improve its loading margin.
Fig. 254: TYL to enjoy greater operating leverage
Source: FSS, Nomura research
Fig. 255: Loading margin improving
Source: FSS, Nomura research
Risk margin to improve TYL’s risk margin has been falling due the implementation of IBNR in 2004. Lifers started to reserve for IBNR in FY04. The reserve rate was increased every year to 10% in FY06. We think that further pressure from the IBNR reserve is limited, given that there will be no additional increase in IBNR reserve requirements. Hence, we expect the risk margin of TYL to improve, as the company increased the death benefit proportion amid an improving mortality rate and increased flexibility in the use of mortality table as of 2006.
0
50
100
150
200
250
300
350
Mar11 Mar12 Mar13 Mar14 Mar15 Mar16 Mar17
(Wbn)
12
13
14
15
16
Mar11 Mar12 Mar13 Mar14 Mar15 Mar16 Mar17
(%)
0
50
100
150
200
250
300
Mar-08 Mar-09 Mar-10 Mar-11(e)
Actual maintenance expense
Maintenance margin(Wbn)
40
45
50
55
60
Mar-08 Mar-09 Mar-10 Mar-11(e)
Maintenance margin as % of expected maintenance expense
(%)

Nomura | ASIA Tong Yang Life Insurance May 16, 2011
119
Fig. 256: Mortality/morbidity margin improving
Source: FSS, Nomura research
Fig. 257: Risk margin improving
Source: FSS, Nomura research
Fees on separate account TYL’s separate account assets saw a 30% CAGR over the past ten years, due to significant growth of investment linked insurance. Currently, TYL earns 2.4% fees on separate account assets, a drop from 4.0% in FY09. We believe the actual management fee collected should be 50bps to 75bps. The difference comes from pass-through items such as risk premium, maturity or surrender refunds. We expect the fees from separate account as a percentage of separate account asset to continue to trend downward, stabilizing at around 2.1% in FY17F.
Fig. 258: Fees on separate account Fees as % of total asset to stabilize at around 2%
Source: Company data, Nomura research
0
50
100
150
200
250
300
350
Mar-07 Mar-08 Mar-09 Mar-10 Mar-11(e)
Claims paid Mortality margin(Wbn)
6
8
10
12
14
16
18
Mar-07 Mar-08 Mar-09 Mar-10 Mar-11(e)
Mortality margin as % of risk premium(%)
0%
1%
2%
3%
4%
5%
-
500
1,000
1,500
2,000
2,500
3,000
FY
01
FY
02
FY
03
FY
04
FY
05
FY
06
FY
07
FY
08
FY
09
FY
10
FY
11F
FY
12F
FY
13F
FY
14F
FY
15F
FY
16F
Separate account assets Fees %(Wbn)

Nomura | ASIA Tong Yang Life Insurance May 16, 2011
120
Legacy issue unwinding TYL should be free from problematic high-yield guarantee policies in the medium term, in our view. We think the larger lifers will likely move with the market rate owing to their large negative spread books, but the legacy issue is actually unwinding for TYL.
High-yield guarantee policies maturing
Large exposure to high-yield guarantee policies TYL, in our view, has been suffering from high-yield guarantee policies which it had sold in the 1990s. Currently, 55.5% of its savings reserves represent fixed crediting rate policies, and 30.7% of its fixed crediting rate policies have a guaranteed yield above 5%.
Fig. 259: Fixed vs. floating policy
Source: Company data, Nomura research
Fig. 260: Fixed crediting rate with yield higher than 5%
Source: Company data, Nomura research
High-yield guarantee policies maturing slowly The high-yield guarantee policies sold in the 1990s have less probability of being surrendered, in our view. Moreover, above 70% of the policies have a maturity of 20 years and longer. However, we have seen a decline in the absolute amount of reserves by 6.4% for TYL. Theoretically, if there was no surrender or maturing, then the reserve amount should increase by 7.53% (average crediting rate for high-yield guarantee policies), based on our estimates. However, the absolute amount of reserves increased by only 1.1%.
Fig. 261: TYL fixed rate policies by crediting rate
Source: Company data, Nomura research
62.3%
55.5%
37.7%
44.5%
0%
10%
20%
30%
40%
50%
60%
70%
Jun09 Dec10
Fixed Floating 39.2%
30.7%
0%
5%
10%
15%
20%
25%
30%
35%
40%
45%
Jun09 Dec10
0200400600800
1,0001,2001,4001,6001,800
10.5
0%
9.5
0%
8.5
0%
7.5
0%
6.5
0%
6.0
0%
5.5
0%
5.0
0%
4.8
0%
4.6
0%
4.5
0%
4.2
5%
4.2
0%
4.0
0%
3.9
0%
3.8
0%
3.7
5%
Jun09 Dec10(Wbn)

Nomura | ASIA Tong Yang Life Insurance May 16, 2011
121
High-yield guarantee weight to fall below 15% by FY14
Weight of high-yield guarantee policies to fall below 15% by FY14 Although the maturing of the problematic high-yield guarantee policies will be a slow process, we believe the proportion should fall fairly quickly as new low-yield floating rate policies dilute the in-force book. We expect the reserves for high-yield guarantee policies, as a proportion of total interest-bearing reserves, to fall below 15% by FY14.
Fig. 262: High guarantee policy reserves
Source: Company data, Nomura research
Fig. 263: Average credit rate on total in-force policies
Source: Company data, Nomura research
0
10
20
30
40
50
60
Mar-
06
Mar-
07
Mar-
08
Mar-
09
Mar-
10
Mar1
1F
Mar1
2F
Mar1
3F
(%)
5
5
6
6
7
7
Mar-
06
Mar-
07
Mar-
08
Mar-
09
Mar-
10
Mar1
1F
Mar1
2F
(%)

Nomura | ASIA Tong Yang Life Insurance May 16, 2011
122
Potential M&A play Vogo Fund is now the largest shareholder in TYL with a 57.6% stake. Tong Yang Group has an option to buy back a 30% stake. But Vogo Fund could sell 27.6% to anyone. We think management control is up for grabs.
Vogo Fund has the key
Vogo Fund is now the largest shareholder Tong Yang group sold a 44.05% stake in TYL to Vogo Fund and a 2.46% stake to MinJu Lee at a share price of KRW18,000 on 23 March 2011. MinJu Lee is the former chairman of C&M (a cable company now owned by Macquarie and MBK Partners). Tong Yang group now only owns 3% of TYL.
Tong Yang group has the option to buy back 30% from Vogo Fund Tong Yang has a three-year option to buy back a 30% stake from Vogo Fund for a strike price of KRW18,000 plus 11.5% compounding interest rates minus any dividend paid. However, this still leaves 27.6% for Vogo Fund to place to a third party.
Tong Yang group needs to pay KRW770bn for the 30% stake We think that management will likely increase the payout ratio in order to lower the strike price. Based on our forecasts, TYL should be able to buyout 30% without much impact on its capital adequacy ratio. That said, we think, the strike price will likely be KRW770bn for the 30% stake over three years. If Tong Yang group does not turnaround its financial status, the amount seems burdensome for the group, in our view.
Fig. 264: Shareholding structure before stake sale
Source: Company data, DART, Nomura research
Fig. 265: Shareholding structure after stake sale
Source: Company data, DART, Nomura research
MinJu Lee the potential buyer
MinJu Lee could take over if he wants Tong Yang group has an option to buy back a 30% stake from Vogo Fund. This implies that Vogo could sell the rest of its stake (27.55%) to anyone. If MinJu Lee were to buy the stake and purchase an additional 3% from the market, he would become the largest shareholder in TYL, based on our estimates. MinJu Lee currently runs a private equity firm Atinum Partners. Given that he sold C&M for KRW1.46tn, we would think he has adequate capital to invest.
Taiyo Life to be the casting vote Taiyo Life owns 4.1% of TYL. We think Taiyo Life will likely be the casting vote in the case of a deadlock situation. We think Taiyo Life may side with Tong Yang group, considering its relationship with the group over the years. However, we would think that the price will be the key deciding factor.
Tong Yang Group, 49.5%
ESOP, 5.0%
Vogo TYL, 13.5%
Taiyo Life, 4.1%
Boston Company,
5.0%
Treasury stock, 1.4%
Others, 21.5%
Vogo TYL, 57.6%
MinJu Lee, 2.5%
ESOP, 5.0%
Boston Company,
5.0%
Taiyo Life, 4.1%
Tong Yang Group, 3.0%
Treasury stock, 1.4%
Others, 21.5%

Nomura | ASIA Tong Yang Life Insurance May 16, 2011
123
Company overview Company history Established in 1989 as Tong Yang Benefit Life Insurance, the company changed its name to “Tong Yang Life Insurance” in 1995. Considered to be one of the top SME insurance companies in Korea, the company has been quick to expand into non-traditional distribution channels, such as bancassurance and direct marketing channels. Tong Yang Life was listed on the KRX in 2009, the first insurance company to be listed in the industry.
Fig. 266: Key historical milestones
Source: DART, Company data, Nomura research
Fig. 267: Current shareholding structure
Source: DART, Company data, Nomura research
Fig. 268: Korea life insurer ranking
Source: DART, Nomura research
Policy mix breakdown Tong Yang Life Insurance derives 50% of its total premium from savings type products, followed by annuities (29%). We should note that savings type policies carry lower embedded margin than protection type products. However, demand growth is coming from wealth accumulation products (savings and annuities). Protection type products account for 21% of total premium.
Distribution channels In terms of distribution channel, Tong Yang Life distributes its products mainly through bancassurance (51%), on an initial premium basis. It is followed by solicitors (19%), direct marketing (18%), and independent agents (12%).
Date History
1989. 4 Established as Tong Yang Benef it Lif e insurance
1995. 8 Change name to Tong Yang Lif e insurance
1999. 5 Dev elop CI of "My Angel" to promote sales
1999. 12 Major shareholder change f rom Tong Yang major to Tong Yang capita
2000. 7 Merge with Pacif ic Lif e Insurance
2005. 3 Change major shareholder to Tong Yang Financial
2007. 9 Tong Yang Asset Management incorporated as subsidary
2009. 9 Supassed W10tn in total assets
2009. 10 Listed on KRX (f irst to do so in industry )
2011. 3 Vogo Fund becomes the largest shareholder with 58.4%
Vogo TYL, 57.6%
MinJu Lee, 2.5%
ESOP, 5.0%
Boston Company,
5.0%
Taiyo Life, 4.1%
Tong Yang Group, 3.0%
Treasury stock, 1.4%
Others, 21.5%
Company Amount M/S Company Amount M/S Company Amount M/S Company Amount M/S
1 Samsung Lif e 82,811 38% Samsung Lif e 99,116 36% Samsung Lif e 13,334 38% Samsung Lif e 34,440 23%
2 Korea Lif e 29,506 14% Korea Lif e 43,249 16% Korea Lif e 5,981 17% Korea Lif e 24,600 17%
3 Ky obo Lif e 27,105 13% Ky obo Lif e 39,367 14% Ky obo Lif e 4,568 13% Ky obo Lif e 22,122 15%
4 ING Lif e 10,311 5% ING Lif e 11,528 4% ING Lif e 1,739 5% Mirae Asset Lif e 8,696 6%
5 Allianz 9,462 4% Allianz 10,985 4% Prudential 1,193 3% Shinhan Lif e 7,834 5%
6 AIA Lif e 6,124 3% Shinhan Lif e 9,369 3% Tong Yang Lif e 1,095 3% Met Lif e 7,132 5%
7 Shinhan Lif e 6,044 3% Tong Yang Lif e 9,262 3% AIA Lif e 992 3% Allianz 6,821 5%
8 Tong Yang Lif e 5,831 3% Heung Kuk Lif e 8,486 3% Shinhan Lif e 966 3% ING Lif e 6,782 5%
9 Mirae Asset Lif e 5,722 3% KDB Lif e 7,397 3% Allianz 930 3% Tong Yang Lif e 6,033 4%
10 Heung Kuk Lif e 5,650 3% Mirae Asset Lif e 6,944 3% Met Lif e 763 2% Heung Kuk Lif e 5,029 3%
RankTotal asset (Wbn) Policy reserve (bn) Total Equity (Wbn) Exclusive solicitors (person)

Nomura | ASIA Tong Yang Life Insurance May 16, 2011
124
Fig. 269: Policy mix trend
Source: Nomura research
Fig. 270: Distribution channel breakdown
Source: Nomura research
Management profile Jung-Jin Park has been the CEO and vice-president of Tong Yang Life insurance since 2006. Previously, Mr Park has held various positions within Tong Yang Securities and Tong Yang Life Insurance.
Vogo Fund is now the largest shareholder Tong Yang group sold a 44.05% stake in TYL to Vogo Fund and a 2.46% stake to MinJu Lee at a price of KRW18,000 on 23 March 2011. MinJu Lee is the former chairman of C&M (a cable company now owned by Macquarie and MBK Partners). Tong Yang Group now owns only 3% of TYL.
Fig. 271: Tong Yang Group – ownership structure
Source: DART, Nomura research
Protection (general)
15%Protection (separate)
6%
Annuities (general)
8%
Annuities (separate)
21%
Savings50%
Group0% Exclusive
solicitor19%
Independent agent12%
Direct marketing
18%
Bancassurance51%

Nomura | AEJ Korea Life Insurance May 16, 2011
125

Nomura | AEJ Korea Life Insurance May 16, 2011
126

Nomura | AEJ Korea Life Insurance May 16, 2011
127

Nomura | AEJ Korea Life Insurance May 16, 2011
Appendix A-1
Analyst Certification
I, Michael Na, hereby certify (1) that the views expressed in this Research report accurately reflect my personal views about any or all of the subject securities or issuers referred to in this Research report, (2) no part of my compensation was, is or will be directly or indirectly related to the specific recommendations or views expressed in this Research report and (3) no part of my compensation is tied to any specific investment banking transactions performed by Nomura Securities International, Inc., Nomura International plc or any other Nomura Group company.
Issuer Specific Regulatory Disclosures Mentioned companies Issuer name Ticker Price Price date Stock rating Sector rating Disclosures Korea Life 088350 KS 7,380 KRW 13-May-2011 Buy Not rated Samsung Life 032830 KS 98,100 KRW 13-May-2011 Buy Not rated 4,138 Tong Yang Life Insurance 082640 KS 12,500 KRW 13-May-2011 Buy Not rated Cheil Industries 001300 KS 122,000 KRW 13-May-2011 Buy Not rated 4,135 China Life Insurance 2628 HK 26.80 HKD 13-May-2011 Buy Not rated 4,58,123 Ping An Insurance Group 2318 HK 82.25 HKD 13-May-2011 Neutral Not rated 4,58 Samsung C&T Corp 000830 KS 76,500 KRW 13-May-2011 Buy Not rated 4,139 Samsung Card 029780 KS 52,700 KRW 13-May-2011 Buy Not rated Samsung Electronics 005930 KS 916,000 KRW 13-May-2011 Buy Not rated 4,106 Samsung SDI 006400 KS 189,000 KRW 13-May-2011 Neutral Not rated 4,130 Samsung Techwin 012450 KS 85,800 KRW 13-May-2011 Buy Not rated 4,134 Samsung Securities 016360 KS 82,300 KRW 12-May-2011 Not rated 4,158 Samsung Heavy Industries 010140 KS 43,350 KRW 12-May-2011 Not rated 4,108
Disclosures required in the U.S.
123 Market Maker - NSI Nomura Securities International Inc. makes a market in securities of the company.
Disclosures required in the European Union
4 Market maker Nomura International plc or an affiliate in the global Nomura group is a market maker or liquidity provider in the securities / related derivatives of the issuer.
Disclosures required in Hong Kong
58 Nomura financial interest/business relationships disclosures: Nomura International (Hong Kong) Limited or an affiliate in the global Nomura group is a market maker or liquidity provider in the securities / related derivatives of the issuer.
Disclosures required in Korea
106 Liquidity Provider for Equity Linked Warrant Nomura Financial Investment (Korea) Co., Ltd. is a liquidity provider (LP) or LP & issuer for ELW which the underlying is Samsung Electronics (005930.KS), and holds 57,224,970 warrants as of 13-May-2011.
108 Liquidity Provider for Equity Linked Warrant Nomura Financial Investment (Korea) Co., Ltd. is a liquidity provider (LP) or LP & issuer for ELW which the underlying is Samsung Heavy Industries (010140.KS), and holds 17,217,930 warrants as of 13-May-2011.
130 Liquidity Provider for Equity Linked Warrant Nomura Financial Investment (Korea) Co., Ltd. is a liquidity provider (LP) or LP & issuer for ELW which the underlying is Samsung SDI (006400.KS), and holds 24,367,550 warrants as of 13-May-2011.
134 Liquidity Provider for Equity Linked Warrant Nomura Financial Investment (Korea) Co., Ltd. is a liquidity provider (LP) or LP & issuer for ELW which the underlying is Samsung Techwin (012450.KS), and holds 14,006,720 warrants as of 13-May-2011.
135 Liquidity Provider for Equity Linked Warrant Nomura Financial Investment (Korea) Co., Ltd. is a liquidity provider (LP) or LP & issuer for ELW which the underlying is Cheil Industries (001300.KS), and holds 14,024,960 warrants as of 13-May-2011.
128

Nomura | AEJ Korea Life Insurance May 16, 2011
138 Liquidity Provider for Equity Linked Warrant Nomura Financial Investment (Korea) Co., Ltd. is a liquidity provider (LP) or LP & issuer for ELW which the underlying is Samsung Life (032830.KS), and holds 16,870,250 warrants as of 13-May-2011.
139 Liquidity Provider for Equity Linked Warrant Nomura Financial Investment (Korea) Co., Ltd. is a liquidity provider (LP) or LP & issuer for ELW which the underlying is Samsung C&T (000830.KS), and holds 17,563,030 warrants as of 13-May-2011.
158 Liquidity Provider for Equity Linked Warrant Nomura Financial Investment (Korea) Co., Ltd. is a liquidity provider (LP) or LP & issuer for ELW which the underlying is Samsung Securities (016360.KS), and holds 10,487,990 warrants as of 13-May-2011.
Previous Rating Issuer name Previous Rating Date of change Korea Life Not rated 15-May-2011 Samsung Life Not rated 15-May-2011 Tong Yang Life Insurance Not rated 15-May-2011 Cheil Industries Neutral 22-Feb-2011 China Life Insurance Not Rated 02-Nov-2010 Ping An Insurance Group Not Rated 02-Nov-2010 Samsung C&T Corp Neutral 28-Mar-2009 Samsung Card Not Rated 04-Apr-2011 Samsung Electronics Neutral 03-Jul-2009 Samsung SDI Reduce 07-Sep-2009 Samsung Techwin Neutral 12-Aug-2009 Samsung Securities Samsung Heavy Industries
Rating and target price changes
Ticker Old stock rating New stock rating Old target price New target price
Korea Life 088350 KS Not rated Buy N/A 9,400
Samsung Life 032830 KS Not rated Buy N/A 150,000
Tong Yang Life Insurance 082640 KS Not rated Buy N/A 21,000
Korea Life (088350 KS) 7,380 (13-May-2011)
Chart Not Available
Valuation Methodology Our TP of KRW9,400 is based on 1.0x forward P/EV. We assume a substainable RoEV of 11.5%, a COE of 11.5% and a growth rate of 3%. Risks that may impede the achievement of the target price 1. A prolonged low interest rate environment 2. Potential default risk relating to KRW1tn in project financing loans.
Samsung Life (032830 KS) 98,100 (13-May-2011)
Chart Not Available
Valuation Methodology Our TP of W150,000 is derived using a SOTP valuation methodology. We apply 1.5x P/EV to derive a TP of W100,000 for Samsung's insurance business and a 27% discount to NAV to derive a TP of W50,000 for its affiliate stakes. Risks that may impede the achievement of the target price 1. Prolonged low interest environment. 2. Technology sector downturn. 3. Share overhang stemming from potential stake sale by Shinsegae and CJ Group.
Tong Yang Life Insurance (082640 KS) 12,500 (13-May-2011)
Chart Not Available
Valuation Methodology Our TP of W21,000 is based on sustainable RoEV of 14%, COE of 12.5% and growth rate of 3%. Risks that may impede the achievement of the target price 1. A prolonged low interest rate environment 2. Potential default risk relating to KRW1tn in project financing loans.
129

Nomura | AEJ Korea Life Insurance May 16, 2011
Important Disclosures Conflict-of-interest disclosures Important disclosures may be accessed through the following website: http://www.nomura.com/research/pages/disclosures/disclosures.aspx . If you have difficulty with this site or you do not have a password, please contact your Nomura Securities International, Inc. salesperson (1-877-865-5752) or email [email protected] for assistance. Online availability of research and additional conflict-of-interest disclosures Nomura Japanese Equity Research is available electronically for clients in the US on NOMURA.COM, REUTERS, BLOOMBERG and THOMSON ONE ANALYTICS. For clients in Europe, Japan and elsewhere in Asia it is available on NOMURA.COM, REUTERS and BLOOMBERG. Important disclosures may be accessed through the left hand side of the Nomura Disclosure web page http://www.nomura.com/research or requested from Nomura Securities International, Inc., on 1-877-865-5752. If you have any difficulties with the website, please email [email protected] for technical assistance. The analysts responsible for preparing this report have received compensation based upon various factors including the firm's total revenues, a portion of which is generated by Investment Banking activities. Industry Specialists identified in some Nomura International plc research reports are employees within the Firm who are responsible for the sales and trading effort in the sector for which they have coverage. Industry Specialists do not contribute in any manner to the content of research reports in which their names appear. Marketing Analysts identified in some Nomura research reports are research analysts employed by Nomura International plc who are primarily responsible for marketing Nomura’s Equity Research product in the sector for which they have coverage. Marketing Analysts may also contribute to research reports in which their names appear and publish research on their sector. Distribution of ratings (US) The distribution of all ratings published by Nomura US Equity Research is as follows: 38% have been assigned a Buy rating which, for purposes of mandatory disclosures, are classified as a Buy rating; 4% of companies with this rating are investment banking clients of the Nomura Group*. 55% have been assigned a Neutral rating which, for purposes of mandatory disclosures, is classified as a Hold rating; 1% of companies with this rating are investment banking clients of the Nomura Group*. 7% have been assigned a Reduce rating which, for purposes of mandatory disclosures, are classified as a Sell rating; 0% of companies with this rating are investment banking clients of the Nomura Group*. As at 31 March 2011. *The Nomura Group as defined in the Disclaimer section at the end of this report. Distribution of ratings (Global) The distribution of all ratings published by Nomura Global Equity Research is as follows: 49% have been assigned a Buy rating which, for purposes of mandatory disclosures, are classified as a Buy rating; 37% of companies with this rating are investment banking clients of the Nomura Group*. 40% have been assigned a Neutral rating which, for purposes of mandatory disclosures, is classified as a Hold rating; 46% of companies with this rating are investment banking clients of the Nomura Group*. 11% have been assigned a Reduce rating which, for purposes of mandatory disclosures, are classified as a Sell rating; 16% of companies with this rating are investment banking clients of the Nomura Group*. As at 31 March 2011. *The Nomura Group as defined in the Disclaimer section at the end of this report. Explanation of Nomura's equity research rating system in Europe, Middle East and Africa, US and Latin America for ratings published from 27 October 2008 The rating system is a relative system indicating expected performance against a specific benchmark identified for each individual stock. Analysts may also indicate absolute upside to target price defined as (fair value - current price)/current price, subject to limited management discretion. In most cases, the fair value will equal the analyst's assessment of the current intrinsic fair value of the stock using an appropriate valuation methodology such as discounted cash flow or multiple analysis, etc. STOCKS A rating of 'Buy', indicates that the analyst expects the stock to outperform the Benchmark over the next 12 months. A rating of 'Neutral', indicates that the analyst expects the stock to perform in line with the Benchmark over the next 12 months. A rating of 'Reduce', indicates that the analyst expects the stock to underperform the Benchmark over the next 12 months. A rating of 'Suspended', indicates that the rating and target price have been suspended temporarily to comply with applicable regulations and/or firm policies in certain circumstances including when Nomura is acting in an advisory capacity in a merger or strategic transaction involving the company. Benchmarks are as follows: United States/Europe: Please see valuation methodologies for explanations of relevant benchmarks for stocks (accessible through the left hand side of the Nomura Disclosure web page: http://www.nomura.com/research);Global Emerging Markets (ex-Asia): MSCI Emerging Markets ex-Asia, unless otherwise stated in the valuation methodology. SECTORS A 'Bullish' stance, indicates that the analyst expects the sector to outperform the Benchmark during the next 12 months. A 'Neutral' stance, indicates that the analyst expects the sector to perform in line with the Benchmark during the next 12 months. A 'Bearish' stance, indicates that the analyst expects the sector to underperform the Benchmark during the next 12 months. Benchmarks are as follows: United States: S&P 500; Europe: Dow Jones STOXX 600; Global Emerging Markets (ex-Asia): MSCI Emerging Markets ex-Asia.
130

Nomura | AEJ Korea Life Insurance May 16, 2011
Explanation of Nomura's equity research rating system for Asian companies under coverage ex Japan published from 30 October 2008 and in Japan from 6 January 2009 STOCKS Stock recommendations are based on absolute valuation upside (downside), which is defined as (Target Price - Current Price) / Current Price, subject to limited management discretion. In most cases, the Target Price will equal the analyst's 12-month intrinsic valuation of the stock, based on an appropriate valuation methodology such as discounted cash flow, multiple analysis, etc. A 'Buy' recommendation indicates that potential upside is 15% or more. A 'Neutral' recommendation indicates that potential upside is less than 15% or downside is less than 5%. A 'Reduce' recommendation indicates that potential downside is 5% or more. A rating of 'Suspended' indicates that the rating and target price have been suspended temporarily to comply with applicable regulations and/or firm policies in certain circumstances including when Nomura is acting in an advisory capacity in a merger or strategic transaction involving the subject company. Securities and/or companies that are labelled as 'Not rated' or shown as 'No rating' are not in regular research coverage of the Nomura entity identified in the top banner. Investors should not expect continuing or additional information from Nomura relating to such securities and/or companies. SECTORS A 'Bullish' rating means most stocks in the sector have (or the weighted average recommendation of the stocks under coverage is) a positive absolute recommendation. A 'Neutral' rating means most stocks in the sector have (or the weighted average recommendation of the stocks under coverage is) a neutral absolute recommendation. A 'Bearish' rating means most stocks in the sector have (or the weighted average recommendation of the stocks under coverage is) a negative absolute recommendation. Explanation of Nomura's equity research rating system in Japan published prior to 6 January 2009 (and ratings in Europe, Middle East and Africa, US and Latin America published prior to 27 October 2008) STOCKS A rating of '1' or 'Strong buy', indicates that the analyst expects the stock to outperform the Benchmark by 15% or more over the next six months. A rating of '2' or 'Buy', indicates that the analyst expects the stock to outperform the Benchmark by 5% or more but less than 15% over the next six months. A rating of '3' or 'Neutral', indicates that the analyst expects the stock to either outperform or underperform the Benchmark by less than 5% over the next six months. A rating of '4' or 'Reduce', indicates that the analyst expects the stock to underperform the Benchmark by 5% or more but less than 15% over the next six months. A rating of '5' or 'Sell', indicates that the analyst expects the stock to underperform the Benchmark by 15% or more over the next six months. Stocks labeled 'Not rated' or shown as 'No rating' are not in Nomura's regular research coverage. Nomura might not publish additional research reports concerning this company, and it undertakes no obligation to update the analysis, estimates, projections, conclusions or other information contained herein. SECTORS A 'Bullish' stance, indicates that the analyst expects the sector to outperform the Benchmark during the next six months. A 'Neutral' stance, indicates that the analyst expects the sector to perform in line with the Benchmark during the next six months. A 'Bearish' stance, indicates that the analyst expects the sector to underperform the Benchmark during the next six months. Benchmarks are as follows: Japan: TOPIX; United States: S&P 500, MSCI World Technology Hardware & Equipment; Europe, by sector - Hardware/Semiconductors: FTSE W Europe IT Hardware; Telecoms: FTSE W Europe Business Services; Business Services: FTSE W Europe; Auto & Components: FTSE W Europe Auto & Parts; Communications equipment: FTSE W Europe IT Hardware; Ecology Focus: Bloomberg World Energy Alternate Sources; Global Emerging Markets: MSCI Emerging Markets ex-Asia. Explanation of Nomura's equity research rating system for Asian companies under coverage ex Japan published prior to 30 October 2008 STOCKS Stock recommendations are based on absolute valuation upside (downside), which is defined as (Fair Value - Current Price)/Current Price, subject to limited management discretion. In most cases, the Fair Value will equal the analyst's assessment of the current intrinsic fair value of the stock using an appropriate valuation methodology such as Discounted Cash Flow or Multiple analysis etc. However, if the analyst doesn't think the market will revalue the stock over the specified time horizon due to a lack of events or catalysts, then the fair value may differ from the intrinsic fair value. In most cases, therefore, our recommendation is an assessment of the difference between current market price and our estimate of current intrinsic fair value. Recommendations are set with a 6-12 month horizon unless specified otherwise. Accordingly, within this horizon, price volatility may cause the actual upside or downside based on the prevailing market price to differ from the upside or downside implied by the recommendation. A 'Strong buy' recommendation indicates that upside is more than 20%. A 'Buy' recommendation indicates that upside is between 10% and 20%. A 'Neutral' recommendation indicates that upside or downside is less than 10%. A 'Reduce' recommendation indicates that downside is between 10% and 20%. A 'Sell' recommendation indicates that downside is more than 20%. SECTORS A 'Bullish' rating means most stocks in the sector have (or the weighted average recommendation of the stocks under coverage is) a positive absolute recommendation. A 'Neutral' rating means most stocks in the sector have (or the weighted average recommendation of the stocks under coverage is) a neutral absolute recommendation. A 'Bearish' rating means most stocks in the sector have (or the weighted average recommendation of the stocks under coverage is) a negative absolute recommendation. Target Price A Target Price, if discussed, reflect in part the analyst's estimates for the company's earnings. The achievement of any target price may be impeded by general market and macroeconomic trends, and by other risks related to the company or the market, and may not occur if the company's earnings differ from estimates.
131

Nomura | AEJ Korea Life Insurance May 16, 2011
Disclaimers This publication contains material that has been prepared by the Nomura entity identified at the top or bottom of page 1 herein, if any, and/or, with the sole or joint contributions of one or more Nomura entities whose employees and their respective affiliations are specified on page 1 herein or elsewhere identified in the publication. Affiliates and subsidiaries of Nomura Holdings, Inc. (collectively, the 'Nomura Group'), include: Nomura Securities Co., Ltd. ('NSC') Tokyo, Japan; Nomura International plc ('NIplc'), United Kingdom; Nomura Securities International, Inc. ('NSI'), New York, NY; Nomura International (Hong Kong) Ltd. (‘NIHK’), Hong Kong; Nomura Financial Investment (Korea) Co., Ltd. (‘NFIK’), Korea (Information on Nomura analysts registered with the Korea Financial Investment Association ('KOFIA') can be found on the KOFIA Intranet at http://dis.kofia.or.kr ); Nomura Singapore Ltd. (‘NSL’), Singapore (Registration number 197201440E, regulated by the Monetary Authority of Singapore); Capital Nomura Securities Public Company Limited (‘CNS’), Thailand; Nomura Australia Ltd. (‘NAL’), Australia (ABN 48 003 032 513), regulated by the Australian Securities and Investment Commission ('ASIC') and holder of an Australian financial services licence number 246412; P.T. Nomura Indonesia (‘PTNI’), Indonesia; Nomura Securities Malaysia Sdn. Bhd. (‘NSM’), Malaysia; Nomura International (Hong Kong) Ltd., Taipei Branch (‘NITB’), Taiwan; Nomura Financial Advisory and Securities (India) Private Limited (‘NFASL’), Mumbai, India (Registered Address: Ceejay House, Level 11, Plot F, Shivsagar Estate, Dr. Annie Besant Road, Worli, Mumbai- 400 018, India; SEBI Registration No: BSE INB011299030, NSE INB231299034, INF231299034, INE 231299034). THIS MATERIAL IS: (I) FOR YOUR PRIVATE INFORMATION, AND WE ARE NOT SOLICITING ANY ACTION BASED UPON IT; (II) NOT TO BE CONSTRUED AS AN OFFER TO SELL OR A SOLICITATION OF AN OFFER TO BUY ANY SECURITY IN ANY JURISDICTION WHERE SUCH OFFER OR SOLICITATION WOULD BE ILLEGAL; AND (III) BASED UPON INFORMATION THAT WE CONSIDER RELIABLE. NOMURA GROUP DOES NOT WARRANT OR REPRESENT THAT THE PUBLICATION IS ACCURATE, COMPLETE, RELIABLE, FIT FOR ANY PARTICULAR PURPOSE OR MERCHANTABLE AND DOES NOT ACCEPT LIABILITY FOR ANY ACT (OR DECISION NOT TO ACT) RESULTING FROM USE OF THIS PUBLICATION AND RELATED DATA. TO THE MAXIMUM EXTENT PERMISSIBLE ALL WARRANTIES AND OTHER ASSURANCES BY NOMURA GROUP ARE HEREBY EXCLUDED AND NOMURA GROUP SHALL HAVE NO LIABILITY FOR THE USE, MISUSE, OR DISTRIBUTION OF THIS INFORMATION. Opinions expressed are current opinions as of the original publication date appearing on this material only and the information, including the opinions contained herein, are subject to change without notice. Nomura is under no duty to update this publication. If and as applicable, NSI's investment banking relationships, investment banking and non-investment banking compensation and securities ownership (identified in this report as 'Disclosures Required in the United States'), if any, are specified in disclaimers and related disclosures in this report. In addition, other members of the Nomura Group may from time to time perform investment banking or other services (including acting as advisor, manager or lender) for, or solicit investment banking or other business from, companies mentioned herein. Furthermore, the Nomura Group, and/or its officers, directors and employees, including persons, without limitation, involved in the preparation or issuance of this material may, to the extent permitted by applicable law and/or regulation, have long or short positions in, and buy or sell, the securities (including ownership by NSI, referenced above), or derivatives (including options) thereof, of companies mentioned herein, or related securities or derivatives. For financial instruments admitted to trading on an EU regulated market, Nomura Holdings Inc's affiliate or its subsidiary companies may act as market maker or liquidity provider (in accordance with the interpretation of these definitions under FSA rules in the UK) in the financial instruments of the issuer. Where the activity of liquidity provider is carried out in accordance with the definition given to it by specific laws and regulations of other EU jurisdictions, this will be separately disclosed within this report. Furthermore, the Nomura Group may buy and sell certain of the securities of companies mentioned herein, as agent for its clients. Investors should consider this report as only a single factor in making their investment decision and, as such, the report should not be viewed as identifying or suggesting all risks, direct or indirect, that may be associated with any investment decision. Please see the further disclaimers in the disclosure information on companies covered by Nomura analysts available at www.nomura.com/research under the 'Disclosure' tab. Nomura Group produces a number of different types of research product including, among others, fundamental analysis, quantitative analysis and short term trading ideas; recommendations contained in one type of research product may differ from recommendations contained in other types of research product, whether as a result of differing time horizons, methodologies or otherwise; it is possible that individual employees of Nomura may have different perspectives to this publication. NSC and other non-US members of the Nomura Group (i.e. excluding NSI), their officers, directors and employees may, to the extent it relates to non-US issuers and is permitted by applicable law, have acted upon or used this material prior to, or immediately following, its publication. Foreign-currency-denominated securities are subject to fluctuations in exchange rates that could have an adverse effect on the value or price of, or income derived from, the investment. In addition, investors in securities such as ADRs, the values of which are influenced by foreign currencies, effectively assume currency risk. The securities described herein may not have been registered under the US Securities Act of 1933, and, in such case, may not be offered or sold in the United States or to US persons unless they have been registered under such Act, or except in compliance with an exemption from the registration requirements of such Act. Unless governing law permits otherwise, you must contact a Nomura entity in your home jurisdiction if you want to use our services in effecting a transaction in the securities mentioned in this material. This publication has been approved for distribution in the United Kingdom and European Union as investment research by NIplc, which is authorized and regulated by the UK Financial Services Authority ('FSA') and is a member of the London Stock Exchange. It does not constitute a personal recommendation, as defined by the FSA, or take into account the particular investment objectives, financial situations, or needs of individual investors. It is intended only for investors who are 'eligible counterparties' or 'professional clients' as defined by the FSA, and may not, therefore, be redistributed to retail clients as defined by the FSA. This publication may be distributed in Germany via Nomura Bank (Deutschland) GmbH, which is authorized and regulated in Germany by the Federal Financial Supervisory Authority ('BaFin'). This publication has been approved by NIHK, which is regulated by the Hong Kong Securities and Futures Commission, for distribution in Hong Kong by NIHK. This publication has been approved for distribution in Australia by NAL, which is authorized and regulated in Australia by the ASIC. This publication has also been approved for distribution in Malaysia by NSM. In Singapore, this publication has been distributed by NSL. NSL accepts legal responsibility for the content of this publication, where it concerns securities, futures and foreign exchange, issued by their foreign affiliates in respect of recipients who are not accredited, expert or institutional investors as defined by the Securities and Futures Act (Chapter 289). Recipients of this publication should contact NSL in respect of matters arising from, or in connection with, this publication. Unless prohibited by the provisions of Regulation S of the U.S. Securities Act of 1933, this material is distributed in the United States, by NSI, a US-registered broker-dealer, which accepts responsibility for its contents in accordance with the provisions of Rule 15a-6, under the US Securities Exchange Act of 1934. This publication has not been approved for distribution in the Kingdom of Saudi Arabia or to clients other than 'professional clients' in the United Arab Emirates by Nomura Saudi Arabia, NIplc or any other member of the Nomura Group, as the case may be. Neither this publication nor any copy thereof may be taken or transmitted or distributed, directly or indirectly, by any person other than those authorised to do so into the Kingdom of Saudi Arabia or in the United Arab Emirates or to any person located in the Kingdom of Saudi Arabia or to clients other than 'professional clients' in the United Arab Emirates. By accepting to receive this publication, you represent that you are not located in the Kingdom of Saudi Arabia or that you are a 'professional client' in the United Arab Emirates and agree to comply with these restrictions. Any failure to comply with these restrictions may constitute a violation of the laws of the Kingdom of Saudi Arabia or the United Arab Emirates. No part of this material may be (i) copied, photocopied, or duplicated in any form, by any means; or (ii) redistributed without the prior written consent of the Nomura Group member identified in the banner on page 1 of this report. Further information on any of the securities mentioned herein may be obtained upon request. If this publication has been distributed by electronic transmission, such as e-mail, then such transmission cannot be guaranteed to be secure or error-free as information could be intercepted, corrupted, lost, destroyed, arrive late or incomplete, or contain viruses. The sender therefore does not accept liability for any errors or omissions in the contents of this publication, which may arise as a result of electronic transmission. If verification is required, please request a hard-copy version. Additional information available upon request NIPlc and other Nomura Group entities manage conflicts identified through the following: their Chinese Wall, confidentiality and independence policies, maintenance of a Restricted List and a Watch List, personal account dealing rules, policies and procedures for managing conflicts of interest arising from the allocation and pricing of securities and impartial investment research and disclosure to clients via client documentation. Disclosure information is available at the Nomura Disclosure web page: http://www.nomura.com/research/pages/disclosures/disclosures.aspx
132
Nomura Asian Equity Research Group
Hong Kong Nomura International (Hong Kong) Limited 30/F Two International Finance Centre, 8 Finance Street, Central, Hong Kong Tel: +852 2536 1111 Fax: +852 2536 1820
Singapore
Nomura Singapore Limited 10 Marina Boulevard Marina Bay Financial Centre Tower 2, #36-01, Singapore 018983, Singapore Tel: +65 6433 6288 Fax: +65 6433 6169
Taipei Nomura International (Hong Kong) Limited, Taipei Branch 17th Floor, Walsin Lihwa Xinyi Building, No.1, Songzhi Road, Taipei 11047, Taiwan, R.O.C. Tel: +886 2 2176 9999 Fax: +886 2 2176 9900
Seoul Nomura Financial Investment (Korea) Co., Ltd. 17th floor, Seoul Finance Center, 84 Taepyeongno 1-ga, Jung-gu, Seoul 100-768, Korea Tel: +82 2 3783 2000 Fax: +82 2 3783 2500
Kuala Lumpur Nomura Securities Malaysia Sdn. Bhd. Suite No 16.5, Level 16, Menara IMC, 8 Jalan Sultan Ismail, 50250 Kuala Lumpur, Malaysia Tel: +60 3 2027 6811 Fax: +60 3 2027 6888
India Nomura Financial Advisory and Securities (India) Private Limited Ceejay House, Level 11, Plot F, Shivsagar Estate, Dr. Annie Besant Road, Worli, Mumbai- 400 018, India Tel: +91 22 4037 4037 Fax: +91 22 4037 4111
Indonesia PT Nomura Indonesia Suite 209A, 9th Floor, Sentral Senayan II Building Jl. Asia Afrika No. 8, Gelora Bung Karno, Jakarta 10270, Indonesia Tel: +62 21 2991 3300 Fax: +62 21 2991 3333
Sydney Nomura Australia Ltd. Level 25, Governor Phillip Tower, 1 Farrer Place, Sydney NSW 2000 Tel: +61 2 8062 8000 Fax: +61 2 8062 8362
Tokyo Equity Research Department Financial & Economic Research Center Nomura Securities Co., Ltd. 17/F Urbannet Building, 2-2, Otemachi 2-chome Chiyoda-ku, Tokyo 100-8130, Japan Tel: +81 3 5255 1658 Fax: +81 3 5255 1747, 3272 0869
Caring for the environment: to receive only the electronic versions of our research, please contact your sales representative.