UGANDA NATIONAL HOUSEHOLD SURVEY …countrystat.org/country/UGA/contents/docs/unhs_2005...UGANDA...
214
UGANDA NATIONAL HOUSEHOLD SURVEY 2005/2006 REPORT ON THE AGRICULTURAL MODULE Uganda Bureau of Statistics P.O. Box 7186, Kampala Tel: 041 706000 Fax: 041 237 553 E-mail: [email protected] Website: www.ubos.org UGANDA BUREAU OF STATISTICS April 2007 THE REPUBLIC OF UGANDA
Transcript of UGANDA NATIONAL HOUSEHOLD SURVEY …countrystat.org/country/UGA/contents/docs/unhs_2005...UGANDA...
UGANDA NATIONAL HOUSEHOLD SURVEY
2005/2006
REPORT ON THE
AGRICULTURAL MODULE
Uganda Bureau of Statistics
P.O. Box 7186, Kampala
Tel: 041 706000
Fax: 041 237 553
E-mail: [email protected]
Website: www.ubos.org
UGANDA BUREAU OF STATISTICS
April 2007
THE REPUBLIC OF UGANDA
ii
FOREWORD The Uganda National Household Survey (UNHS) 2005/06 is the latest in a series of household
surveys that started in 1989. The survey comprised of five modules namely the Socio-economic,
agriculture, Community, Price and the Qualitative Modules. This report presents the major findings
based on the Agricultural module (i.e. Second Season of 2004 and the First Season of 2005). The
overall objective of Agricultural Module was to collect data for estimating agricultural production
namely crop production and livestock and poultry numbers.
The Module covered the household crop farming enterprise particulars (with emphasis on land, crop
area, inputs, outputs and other allied characteristics). The components included- investments on land;
crop areas; labour and non labour inputs for the Second Season of 2004 and the First Season of
2005; Crop Disposition; Land Rights, Disputes and Certificates; Livestock numbers ; Small Animals
and Poultry numbers; Agricultural Extension Services and Technologies. The data in this report gives
results for the two seasons mentioned above.
We are grateful to the Government of Uganda, the World Bank and the UK Department for
International Development for the financial assistance that enabled the survey to be conducted. We
would also like to acknowledge the technical backstopping provided by the Institute of Statistics and
Applied Economics during the data analysis phase. Our gratitude is extended to all the field staff who
worked tirelessly to successfully implement the survey and to the survey respondents who provided
us the information on which this report is based. We sincerely thank the Local Governments and other
stakeholders, for the unreserved support during the data collection. The Bureau is greatly indebted to
these governments for the invaluable cooperation.
There is a lot of information from the survey that has not been analyzed and included in this report
and yet important for policy formulation and overall planning. The Bureau would like to encourage
stakeholders to utilize the rich datasets that exists in its data bank to do further analysis so as to
better inform future policy debate.
John B. Male-Mukasa
Executive Director
iii
TABLE OF CONTENTS
FOREWORD ........................................................................................................................................... II
TABLE OF CONTENTS......................................................................................................................... III
LIST OF TABLES ...................................................................................................................................V
LIST OF FIGURES.................................................................................................................................IX
LIST OF ACRONYMS.............................................................................................................................X
EXECUTIVE SUMMARY........................................................................................................................XI
CHAPTER ONE: INTRODUCTION .......................................................................................................1 1.1 BACKGROUND ..........................................................................................................................1 1.2 SURVEY OBJECTIVES................................................................................................................. I 1.3 SCOPE AND COVERAGE ............................................................................................................1 1.4 EARLIER FOOD AND AGRICULTURAL STATISTICS COLLECTION ACTIVITIES....................................2 1.5 SAMPLE DESIGN........................................................................................................................ I 1.6 SURVEY ORGANIZATION............................................................................................................4 1.7 DATA MANAGEMENT AND PROCESSING....................................................................................... I 1.8 FUNDING..................................................................................................................................5 1.9 RELIABILITY OF ESTIMATES .......................................................................................................5 1.10 FURTHER ANALYSIS..................................................................................................................5 1.11 PROBLEMS ENCOUNTERED AND CONSTRAINTS ..........................................................................7 1.12 STRUCTURE OF THE REPORT ....................................................................................................9
CHAPTER TWO: AGRICULTURAL HOUSEHOLDS CHARACTERISTICS...................10 2.1 INTRODUCTION .......................................................................................................................10 2.2 NUMBER AND REGIONAL DISTRIBUTION OF AG HHS. ................................................................... I 2.3 AGRICULTURAL HOUSEHOLDS THAT OPERATE LAND.................................................................11 2.4 NUMBER OF AGRICULTURAL HOUSEHOLDS ..............................................................................11 2.5 AVERAGE HOLDING SIZE.........................................................................................................13 2.6 DISTRIBUTION OF AGRICULTURAL HOUSEHOLDS BY (HOLDING) SIZE .........................................14 2.7 AGRICULTURAL HHS BY GEOGRAPHICAL LOCATION OF PARCELS................................................. I 2.8 PARCELS OPERATED BY AG HHS.............................................................................................16 2.9 PRIMARY LAND USE................................................................................................................18 2.10 PLOTS OPERATED BY AGRICULTURAL HOUSEHOLDS ................................................................19 2.11 SUMMARY OF FINDINGS ..........................................................................................................20
CHAPTER THREE: LAND OWNERSHIP AND UTILISATION............................................................22 3.1 INTRODUCTION .......................................................................................................................22 3.2 LAND OWNERSHIP AND USE RIGHTS........................................................................................22 3.3 LOCATION OF PARCELS...........................................................................................................26 3.4 PARCELS BY LAND TENURE SYSTEM........................................................................................28 3.5 PARCEL ACQUISITION METHOD ...............................................................................................29 3.6 PRIMARY LAND USE OF PARCELS ............................................................................................31 3.7 LAND CHARACTERISTICS AND RIGHTS .....................................................................................34 3.8 LAND TITLE, CERTIFICATES AND DISPUTES ..............................................................................42 3.9 SUMMARY OF FINDINGS ..........................................................................................................44
CHAPTER FOUR: AREA AND PRODUCTION OF MAJOR CROPS................................................46 4.1 INTRODUCTION .......................................................................................................................46 4.2 PRODUCTION (MT) AND AREA (HA) OF MAJOR CROPS...............................................................48 4.3 SALES....................................................................................................................................61 4.4 CROP DISPOSITION (UTILIZATION) ...........................................................................................62 4.5 CROP PLOTS, AREA AND AVERAGE PLOT SIZES (APS) ............................................................63 4.6 SUMMARY OF FINDINGS ..........................................................................................................65
iv
CHAPTER FIVE: LIVESTOCK AND POULTRY NUMBERS...............................................................67 5.1 INTRODUCTION .......................................................................................................................67 5.2 CATTLE REARING ...................................................................................................................67 5.3 GOAT REARING.......................................................................................................................71 5.4 SHEEP REARING.....................................................................................................................74 5.5 DISTRIBUTION OF AG HHS THAT REARED PIGS, BY REGION .......................................................77 5.6 POULTRY KEEPING .................................................................................................................79 5.7 OTHER LIVESTOCK .................................................................................................................83 5.8 SUMMARY OF FINDINGS ..........................................................................................................83
CHAPTER SIX: AGRICULTURAL INPUTS AND EXTENSION SERVICES.......................................85 6.1 INTRODUCTION .......................................................................................................................85 6.2 NON-LABOUR INPUTS..............................................................................................................85 6.3 LABOUR INPUTS......................................................................................................................86 6.4 MAIN CAUSES OF CROP DAMAGE............................................................................................93 6.5 SOIL CONSERVATION MEASURES ............................................................................................95 6.6 EXTENSION SERVICES ............................................................................................................96 6.7 ACCESS TO AND DEMAND FOR AGRICULTURAL TECHNOLOGY .................................................103 6.8 FARMERS’ KNOWLEDGE ABOUT AGRICULTURAL TECHNOLOGY ................................................107 6.9 FARMERS’ KNOWLEDGE ABOUT IMPROVED VARIETIES.............................................................110 6.10 SUMMARY OF FINDINGS ........................................................................................................113
LIST OF REFERENCES .....................................................................................................................115
ANNEXES ...........................................................................................................................................116
ANNEX 1: TABLES.........................................................................................................................117
ANNEX 2: SAMPLING ERRORS .....................................................................................................154
ANNEX 3: GLOSSARY OF AGRICULTURAL MODULE TERMS ..................................................173
ANNEX 4: QUESTIONNAIRES ........................................................................................................178
v
LIST OF TABLES Table 2.1: Agricultural Households by Region (‘000)............................................................................................. 10 Table 2.2: Ag HHs that Owned land and Land operated with Use Rights.............................................................. 11 Table 2.3: Comparison of Agricultural Households over the Years (‘000) ............................................................. 11 Table 2.4: Percentage Distribution of Holdings by size in Second Season of 2004 and First Season of 2005 ...... 15 Table 2.5: Percentage Distribution of Agricultural Households by geographical location of the parcels owned..... 16 Table 2.6: Percentage of Agricultural Households by parcels owned within the .................................................... 16 Table 2.7: Percentage of Agricultural Households by number of parcels owned ................................................... 17 Table 2.8: Percentage of Agricultural Households by number of parcels with Use Rights..................................... 18 Table 2.9: Average land size (Ha) for land owned by primary land use ................................................................. 19 Table 3.1: Number of Agricultural Households by Land Ownership and Use Rights by Region (‘000) .................. 22 Table 3.2: Parcels of Land Owned by Region (‘000) ............................................................................................ 23 Table 3.3: Number of Parcels owned and Percentage by sex of the head of Ag HHs by Region (‘000) ................ 24 Table 3.4: Number of Ag HHs and Percentage that own parcels by sex of the household head (‘000) ................. 24 Table 3.5: Average Number of Parcels owned per Ag HH by sex of the Household head.................................... 25 Table 3.6: Number of parcels and Percentage with use rights by sex of the head of Ag HHs (‘000) ..................... 25 Table 3.7: Number of Ag HHs and Percentage with use rights parcels by sex of the household head (‘000)........ 25 Table 3.8: Average Number of Use Rights parcels operated by each Ag HH by sex of the household head ........ 26 Table 3.9: Number of parcels Owned by location, by Region (‘000) ...................................................................... 26 Table 3.10: Percentage distribution of parcels Owned by location by Region. ...................................................... 26 Table 3.11: Number of parcels with Use Rights by location by Region (‘000)........................................................ 27 Table 3.12: Percentage distribution of parcels with Use Rights by location by Region. ......................................... 27 Table 3.13: Number of Parcels Owned and with Use Rights by the land tenure system (‘000) ............................. 28 Table 3.14: Percentage Distribution of Parcels Owned and with Use Rights by land tenure system ..................... 29 Table 3.15: Distribution of Parcels Owned within EA by Method of Acquisition by Region (‘000) .......................... 30 Table 3.16: Distribution of Parcels with Use Rights within EA by Method of Acquisition by Region (‘000)............. 30 Table 3.17: Percentage distribution of all parcels owned by Primary Land Use by Region ................................... 32 Table 3.18: Percentage of parcels (within EA) by Primary Use by Region ........................................................... 33 Table 3.19: Percentage distribution of Parcels by quality of soil by Region .......................................................... 34 Table 3.20A: Percentage distribution of parcels by main water source ................................................................. 35 Table 3.20B: Percentage distribution of parcels by Region ................................................................................... 35 Table 3.21: Percentage Distribution of parcels by their distance from the homestead by Region. ........................ 36 Table 3.22: Percentage distribution of parcels by rights to sell Ownership or Use Rights by Region .................... 36 Table 3.23: Number of Parcels by Rights to sell land by Person with Ownership or Use Rights (‘000) ................. 37 Table 3.24: Number of Parcels by Rights to bequeath by Person with Ownership or Use Rights (‘000) .............. 37 Table 3.25: Percentage Distribution of Parcels by Rights to Rent the Parcel to Someone Else. .......................... 38 Table 3.26: Number of Parcels with Rights to Rent Out land by Person with Ownership or Use Rights (‘000)...... 38 Table 3.27: Number of Parcels with Rights to Use for Loan by Person with Ownership or Use Rights (‘000) ...... 39 Table 3.28: Percentage Distribution of Parcels by rights to plant Trees by Region ............................................... 40 Table 3.29: Number of Parcels with Rights to Plant Trees by Person with Ownership or Use Rights (‘000) ......... 40 Table 3.30: Percentage Distribution of Parcels by Rights to use Parcel as a Loan Security by Region................ 40 Table 3.31: Average amount one can borrow using the Parcel as a Loan Security by Rural/Urban (‘000)........... 41 Table 3.32: Percentage distribution of Parcels by who works on the Parcel by Region........................................ 41 Table 3.33: Percentage distribution of Parcels with/without Certificates by Region............................................... 42 Table 3.34: Percentage distribution of Parcels by ever having a land dispute over Ownership/Use Rights .......... 42 Table 3.36: Percentage Distribution of parcels with whom they had disputes by Region. ..................................... 43 Table 4.1: Number and Percentage of Ag HHs by type of Crop Produced by region (‘000) .................................. 47 Table 4.2: A Comparison of Percentage Distribution of Ag HHs by type of crop produced by Region................... 48 Table 4.3: Data collection level (on crop area and production) during the Second Season of 2004 ..................... 48 Table 4.4: Proportion of Crop Sales to Output 1999/2000 – 2005/06 ................................................................... 62 Table 4.5: Average Plot sizes (Ha) 2005/06 .......................................................................................................... 63 Table 5.1: Number of Agric HHs with indigenous Cattle (‘000) .............................................................................. 67 Table 5.2: Number of Ag HHs with and without Exotic Cattle (‘000) ..................................................................... 68 Table 5.3: Cattle Number by Breed and Region, UNHS 2005/06 (‘000) ................................................................ 70 Table 5.4: Number of Ag HHs with and without Indigenous Goats (‘000) .............................................................. 71 Table 5.5: Number of Ag HHs with and without Exotic Goats (‘000)...................................................................... 72 Table 5.6: Number of goats by Breed and Region (‘000)....................................................................................... 72 Table 5.7: Number of Agricultural Households with and without Sheep (‘000) ...................................................... 74 Table 5.8: Number of Sheep by breed and Region (‘000) ........................................................................................ i Table 5.9: Number of Ag HHs with Pigs (‘000) ...................................................................................................... 77 Table 5.10: Number of Pigs UNHS 2005/06 (‘000) ................................................................................................ 77 Table 5.11: Number of Ag HHS with and without Local Chicken (Back-yard), UNHS 2005/06 (‘000).................... 79 Table 5.13: Number of Chicken by breed and region (‘000) .................................................................................. 82 Table 6.1: Use of Agricultural Inputs (% of parcels).............................................................................................. 85 Table 6.2: Average value of Non-Labour Inputs used in crop farming Second Season of 2004 (‘000 shs) .......... 86 Table 6.3: Average value of Non-Labour Inputs used in crop farming: First Season of 2005 (‘000 shs) .............. 86 Table 6.4: Distribution of Labour Days for the Second season of 2004+ First Season of 2005 (millions).............. 87
vi
Table 6.5A: Distribution of Cost of Labour including in Kind Payment by Season and Region (Billion shs.).......... 88 Table 6.5B: Average Cost of Labour including in Kind Payment by Season and Region (‘000 shs.) ..................... 88 Table 6.6: Distribution of Labour Days for Seedbed Preparation and Sowing by Sex and Region ........................ 89 Table 6.7: Distribution of Labour Days for Application of Inputs by Sex and Region ............................................. 90 Table 6.8: Distribution of Labour Days for Weeding or Pruning by Sex and Region.............................................. 92 Table 6.9: Distribution of Labour Days for Harvesting by Sex and Region ............................................................ 93 Table 6.10: Distribution of Crop Plots by main Cause of Crop Damage, by Region (‘000) .................................... 94 Table 6.11: Percentage Distribution of Plots by Main Causes of Crop Damage (First Season of 2005) ............... 94 Table 6.12: Percentage of Agricultural Parcels that used various Soil Conservation Measures by Region .......... 96 Table 6.13: Distribution of Agricultural Households visited/not visited by Extension Workers. (‘000) .................... 97 Table 6.14: Distribution of Ag HHs with a member having attended a NAADS training program (‘000s)............... 99 Table 6.15: Membership of Agricultural Households members under the FIDS of NAADS (‘000) ....................... 100 Table 6.16: Distribution of Agricultural Household member participation in PEDAS under NAADS programs .... 101 Table 6.17: Number of Heads of Agric. Households with Knowledge on changes in the Land Tenure (‘000) ..... 102 Table 6.18: Number of Spouses in Ag HHs with Knowledge about changes in the Land Tenure System (‘000) . 103 Table 6.19: Number of Ag HHs that have changed practices by type of technology (‘000) ................................. 104 Table 6.20: Number of Ag HHs by extent to which good information on type of technology (‘000)..................... 105 Table 6.21: Number of Ag HHs according to willingness to pay for information by type of technology (‘000). ..... 105 Table 6.22: Number of Ag HHs by mode of access to Information by type of Technology (‘000). ....................... 106 Table 6.23: Distribution of Ag HHs according to crop that can Improve Soil Fertility (‘000) ................................. 107 Table 6.24: Distribution of Ag HHs according to preference of Cassava Planting Method by region (‘000)......... 108 Table 6.25: Distribution of Ag HHs according to methods that increase Susceptibility of crops to pests ............ 108 Table 6.26: Distribution of Ag HHs according to crop to follow Beans in rotation (‘000) ...................................... 109 Table 6.27: Distribution of Ag HHs according to the number of plants per stool of Bananas (‘000)..................... 109 Table 6.28: Distribution of Ag HHs according to most common pest on Bananas (‘000)..................................... 110 Table 6.29: Distribution of Ag HHs according to recommended quantity of DAP (‘000) ...................................... 110 Table 6.30: Distribution of Ag HHs by knowledge of Improved Variety (‘000)...................................................... 111 Table 6.31: Distribution of Ag HHs with knowledge of variety according to Information source (‘000)................. 112 Table 6.32: Percentage Distribution of Ag HHs that had ever used variety ......................................................... 113
LIST OF APPENDIX TABLES A2.1: Percentage of agricultural households by number of parcels that are within the ea/lc1 by the households 117 A2.2: Number of agricultural households by number of parcels owned (‘000) ..................................................... 117 A2.3: Number of agricultural households by number of parcels Used (Elsewhere) (‘000) ................................... 117 A2.4: Number of plots by plot size, Second Season of 2004 (‘000) ..................................................................... 117 A2.5: Number of plots by plot size, First Season of 2005 (‘000) .......................................................................... 118 A2.6: Number of plots by plot size, Second Season of 2004of 2004 excluding fallow and grazing land ............. 118 A2.7: Agric. Hhds by total size (f.ext) - holding size excl. parcels rented out Second Season of 2004 land use . 118 A2.8: Households by geographical location of the parcels (Number and percentages) ('000) ............................. 118 A2.9: Number of households by number of parcels that are within the ea/lc1 and are the owned by the hh ....... 119 A3.1: Number of parcels owned by location ('000)............................................................................................... 119 A3.2: Number of parcels by location (Use Rights) ('000) ..................................................................................... 119 A3.3: Number of owned parcels by the land tenure system (within EA) ('000)..................................................... 119 A3.4: Number of use rights parcels by the land tenure system (within EA) ('000)................................................ 120 A3.5: Total area of parcels by Land tenure system in acres - F.est both seasons ('000)..................................... 120 A3.6: Total area of parcels by Land tenure system in acres - GPS both seasons ............................................... 120 A3.7: Number of parcels by primary land use during the second cropping season 2004 (within EA) ('000) ........ 120 A3.8: Number of parcels by primary land use during the first cropping season 2005 (within EA) ('000) .............. 121 A3.9: Number of owned parcels by parcel size (farmers’ estimate in acres) ('000).............................................. 121 A3.10: Households by total size (farmers’ estimates) - holding size (with in EA) exc. parcels rented out ('000).. 121 A3.11: Households by total size - holding size (with in EA) excluding parcels rented out First Season 2005..... 121 A3.12: Households by total size - holding size (with in ea) excluding parcels rented out First Season of 2005.. 122 A3.13: Number of parcels by average selling price per acre ('000)...................................................................... 122 A3.14: Number of owned parcels by land tenure ('000) ....................................................................................... 122 A3.15: Average land value (owned parcels) per acre in shs by tenure system (Selling) ('000)............................ 122 A3.16: Average land value (owned parcels) per acre in shs by tenure system (Renting) ('000) .......................... 122 A3.17: Average land value (use rights parcels) per acre in shs by tenure system (Willing to Pay) ('000) ............ 123 A3.18: Average land value (use rights parcels) per acre in shs by tenure system sale of use rights................... 123 A3.19: Number of Parcels by soil/land quality ('000)............................................................................................ 123 A3.20: Main water source ('000) .......................................................................................................................... 123 A3.21: Topology of the parcel ('000).................................................................................................................... 123 A3.22: Number of Parcels (‘000) by Distance from Homestead (Km).................................................................. 124 A3.23: Number of Parcels with Rights to sell ownership or use rights ................................................................. 124 A3.24: Number of Parcels with Rights to beneath Ownership or use rights......................................................... 124 A3.25: Number of Parcels with Rights to rent it to some one else ....................................................................... 124 A3.26: Number of Parcels with Rights to plant trees............................................................................................ 125 A3.27: Number of Parcels with Rights to use it as a loan security ....................................................................... 125
vii
A3.28: Average amount one can borrow using the owned parcel as a loan by region (shs) ................................ 125 A3.29: Average amount one can borrow using the owned parcel as a loan by rural/urban (shs)......................... 125 A3.30: Who has ownership and use rights to the parcel (estimates are Parcels) ................................................ 125 A3.31: Who works on this parcel (estimates are Parcels).................................................................................... 126 A3.32: Distribution of Parcels by type of Manager .............................................................................................. 126 A3.33: Ever had any land disputes over ownership/Use Rights on this Parcel .................................................... 126 A3.34: In which year did the most recent dispute start (estimates are Parcels)................................................... 126 A3.35: With whom (col 11) (estimates are Parcels) ............................................................................................. 126 A3.36: Number of all parcels by Primary Land Use during the Second Season of 2004 by Region (‘000) ......... 127 A3.37: Number of all parcels owned by Primary Land Use during the First Season of 2005 (‘000) ..................... 127 A3.38: Number of Parcel with Formal Certificate of Title or Customary Certificate of Title of Ownership ............ 127 A4.1: Crop area (Ha) by stand for the Second Season of 2004 (CENTRAL) - Within District.............................. 128 A4.2: Crop area (Ha) by stand for the Second Season of 2004 (EASTERN) - Within District ............................. 128 A4.3: Crop area (Ha) by stand for the Second Season of 2004 (NORTHERN) – Within District ......................... 129 A4.4: Crop area (Ha) by stand for the Second Season of 2004 (WESTERN) – Within District............................ 129 A4.5: Crop area (Ha) by stand for the Second Season of 2004 (UGANDA) – Within District .............................. 130 A4.6: Crop area (Ha) by stand for the First Season of 2005 (CENTRAL) – Within District .................................. 130 A4.7: Crop area (Ha) by stand for the First Season 2005 (EASTERN) – Within District...................................... 131 A4.8: Crop area (Ha) by stand for the First Season 2005 (NORTHERN) - Within District ................................... 131 A4.9: Crop area (Ha) by stand for the First Season of 2005 (WESTERN) - Within District.................................. 132 A4.10: Crop area (Ha) by stand for the First Season of 2005 (UGANDA) - Within District .................................. 132 A4.11: Crop Area in Ha (Within District), by Region for the Second Season of 2004 (‘000) ................................ 133 A4.12: Crop Area in Ha (Within District), by Region for the First Season of 2005 (‘000) ..................................... 133 A4.13: Crop Area in Ha (Within District), by Region for the Second Season of 2004 - UGANDA) (‘000) ............ 134 A4.14: Number of Crop Plots by stand (Within District) in the Second Season of 2004 (CENTRAL) .................. 134 A4.15: Number of Crop Plots by stand (Within District) in the Second Season of 2004 (EASTERN) .................. 135 A4.16: Number of Crop Plots by stand (Within District) in the Second Season of 2004 (NORTHERN)............... 135 A4.17: Number of Crop Plots by stand (Within District) in the Second Season of 2004 (WESTERN) ................. 136 A4.18: Number of Crop Plots by stand (Within District) in the Second Season of 2004(UGANDA).................... 136 A4.19: Number of Crop Plots by stand (Within District) in the First Season of 2005 (CENTRAL) ....................... 137 A4.20: Number of Crop Plots by stand (Within District) in the First Season of 2005 (EASTERN) ....................... 137 A4.21: Number of Crop Plots by stand (Within District) in the First Season of 2005 (NORTHERN)................... 138 A4.22: Number of Crop Plots by stand (Within District) in the First Season of 2005 (WESTERN) ...................... 138 A4.23: Number of Crop Plots by stand (Within District) in the First Season of 2005 (UGANDA)......................... 139 A4.24: Number of Crop Plots (Within District), by Region for the Second Season of 2004 ................................. 139 A4.25: Number of Crop Plots (Within District), by Region for the First Season of 2005....................................... 140 A4.26: Number of Crop Plots (‘000) (Within District), by Region for the Second Season of 2004 for Uganda)... 140 A4.27: Average Plot sizes (Ha) 1995/96 - 2005/06.............................................................................................. 141 A4.28: Output of Major Seasonal Crops (Metric Tons) 2nd Season 2004 within District, UNHS 2005/2006......... 141 A4.29: Output of Major Seasonal Crops (Metric Tons) First Season of 2005, UNHS 2005/2006 ........................ 142 A4.30: Output (2nd SEASON 2004 + 1st SEASON 2005) of Major Crops in Metric tons, UNHS 2005/2006 ........ 142 A5.1: Distribution of Ag HHs that reared Indigenous cattle between PHC 2002 and UNHS 2005/06 by Region. 142 A5.2: Distribution of Ag HHs that reared Exotic cattle between PHC 2002 and UNHS 2005/06 by Region......... 143 A5.3: Cattle numbers (’000), 1991 – 2005/06 ...................................................................................................... 143 A5.4: A comparison of the No. of Agric. Households with goats, between PHC 2002 and UNHS 2005/06 ......... 143 A5.5: Goats numbers (’000), 1991 – 2005/06...................................................................................................... 143 A5.6: A comparison of the No. of Agric. Households with Sheep, between PHC 2002 and UNHS 2005/06........ 143 A5.7: Sheep numbers (’000), 1991 – 2005/06 ..................................................................................................... 144 A5.8: A comparison of the No. of Agric. Households with Pigs, between PHC 2002 and UNHS 2005/06 ........... 144 A5.9: Pig numbers (’000), 1991 – 2005/06 .......................................................................................................... 144 A5.10: A comparison of the Number of Agricultural Households with local Chicken............................................ 144 A5.11: A comparison of the Number of Agricultural Households with exotic/cross Chicken ................................ 144 A5.12: Chicken numbers (’000), 1991 – 2005/06................................................................................................. 145 A5.13: Number of Agricultural Households with or without Rabbits ..................................................................... 145 A5.14: Number of Agricultural Households with or without Beehives................................................................... 145 A5.15: Number of Agricultural Households with or without Turkeys..................................................................... 145 A5.16: Number of Agricultural Households with or without Ducks ....................................................................... 145 A5.17: Number of Agricultural Households with or without Geese and other birds .............................................. 146 A5.18: Number of Agricultural Households with or without Rabbits ..................................................................... 146 A5.19: Number of Turkeys, Ducks, Geese and Other Birds ................................................................................ 146 A6.1: Distribution of Plots according to type of seeds used in the First Season of 2005, by Region ................... 146 A6.2: Distribution of Plots according to Application of Manure First Season of 2005 by Region.......................... 147 A6.3: Distribution of Plots according to Application of Chemical Fertilizers First Season of 2005 by Region ...... 147 A6.4: Distribution of Plots according to Application of Pesticides, Herbicides or Fungicides by Region .............. 147 A6.5: Average number of Labor days by activity, Sex and region (Second Season of 2004) .............................. 147 A6.6: Average number of Labor days by activity, Sex and region (First season 2005) ........................................ 148 A6.7: Distribution of Parcels by Status of practice of bunds (soil, Stone or grass) by Region on Enum. Day...... 148 A6.8: Distribution of Parcels by Status of practice of bunds (soil. Stone or grass) practice 2000 by Region ....... 148 A6.9: Distribution of Parcels by Status of practice of terracing on date of Enumeration by Region ..................... 148
viii
A6.10: Distribution of Parcels by Status of practice of terracing in 2000 by Region............................................. 149 A6.11: Distribution of Parcels by Status of practicing mulching on date of Enumeration by Region .................... 149 A6.12: Distribution of Parcels by Status of practicing mulching by Region in 2000 ............................................. 149 A6.13: Distribution of Labour Days (Hired and Household Labour) by season .................................................... 149 A6.14: Distribution of total Labour Days (Hired and Household Labour) by Region ............................................ 150 A6.15: Number and average man days of hired labour (Second Season of 2004) .............................................. 150 A6.16: Distribution of Total and Average Cost of Labor including in kind Payment by Region ........................... 150 A6.17: Number and average man days of hired labour (First Season of 2005) ................................................... 150 A6.18: Distribution of Total and average cost of Labour including in Kind Payment by Region .......................... 151 A6.19: Distribution of Households according to crops that can improve soil fertility by Region ........................... 151 A6.20: Distribution of Households according to cassava planting methods by Region........................................ 151 A6.21: Distribution of Households according to methods that increase Susceptibility of crops to pests ............. 151 A6.22: Distribution of Households according to crop to follow beans in rotation by Region................................. 152 A6.23: Distribution of Households according to best results for bananas by Region ........................................... 152 A6.24: Distribution of Households according to most common pest on bananas by Region ............................... 152 A6.25: Distribution of Households according to recommended quantity of DAP by Region................................. 152 A6.26: Distribution of Households by knowledge of Variety................................................................................. 153 A6.27: Percentage Distribution of Households with knowledge of Variety according to Information Source........ 153 A6.28: Percentage Distribution of Households that have ever used variety......................................................... 153
LIST OF STANDARD ERROR TABLES SE 1: Standard Errors (SE) ................................................................................................................................. 156 SE2: Number of plots - Second Season of 2004, Uganda................................................................................... 157 SE3: Number of plots - Second Season of 2004, Eastern Region....................................................................... 157 SE4: Number of plots - Second Season of 2004, Northern Region ..................................................................... 158 SE5: Number of plots - Second Season of 2004, Western Region...................................................................... 158 SE6: Number of plots – First Season of 2005, Uganda ....................................................................................... 159 SE7: Number of plots – First Season of 2005, Central Region............................................................................ 159 SE8: Number of plots – First Season of 2005, Eastern Region ........................................................................... 160 SE9: Number of plots – First Season of 2005, Northern Region ......................................................................... 160 SE10: Number of plots – First Season of 2005, Western Region ........................................................................ 161 SE11: Crop area in Ha – Second Season of 2004, Uganda ................................................................................ 161 SE12: Crop area in Ha – Second Season of 2004, Central Region..................................................................... 162 SE13: Crop area in Ha – Second Season of 2004, Eastern Region .................................................................... 162 SE14: Crop area in Ha – Second Season of 2004, Northern Region .................................................................. 162 SE15: Crop area in Ha – Second Season of 2004, Western Region ................................................................... 163 SE16: Crop area in Ha – First Season of 2005, Uganda ..................................................................................... 163 SE17: Crop area in Ha – First Season of 2005, Central Region.......................................................................... 164 SE18: Crop area in Ha – First Season of 2005, Eastern Region ......................................................................... 164 SE19: Crop area in Ha - First Season of 2005, Northern Region ........................................................................ 165 SE20: Crop area in Ha - First Season of 2005, Western Region......................................................................... 165 SE 21: Production of Crops (Metric tons) - Second Season of 2004, Uganda..................................................... 166 SE22:Production of Crops (Metric tons) - Second Season of 2004, Central Region ........................................... 166 SE23: Production of Crops (Metric tons) - Second Season of 2004, Eastern Region.......................................... 167 SE24: Production of Crops (Metric tons) - Second Season of 2004, Northern Region ........................................ 167 SE25: Production of Crops (Metric tons) - Second Season of 2004, Western Region......................................... 167 SE 26: Production of Crops (Metric tons) - First Season of 2005, Uganda.......................................................... 168 SE27: Production of Crops (Metric tons) - First Season of 2005, Central Region ............................................... 168 SE28: Production of Crops (Metric tons) - First Season of 2005, Eastern Region............................................... 168 SE29: Production of Crops (Metric tons) - First Season of 2005, Northern Region ............................................. 169 SE30: Production of Crops (Metric tons) - First Season of 2005, Western Region.............................................. 169 SE31: Cattle and pack animals, Uganda ............................................................................................................. 169 SE32: Cattle and pack animals, Central Region.................................................................................................. 169 SE33: Cattle and pack animals, Eastern Region ................................................................................................. 170 SE34: Cattle and pack animals, Northern Region................................................................................................ 170 SE35: Cattle and pack animals, Western Region ................................................................................................ 170 SE36: Small animals, Uganda ............................................................................................................................. 170 SE37: Small animals, Central Region.................................................................................................................. 170 SE38: Small animals, Eastern Region................................................................................................................. 171 SE39: Small animals, Northern Region ............................................................................................................... 171 SE40: Small animals, Western Region................................................................................................................ 171 SE41: Poultry and Others, Uganda...................................................................................................................... 171 SE42: Poultry and Others, Central Region .......................................................................................................... 172 SE44: Poultry and Others, Northern Region........................................................................................................ 172 SE45: Poultry and Others, Western Region ........................................................................................................ 172
ix
LIST OF FIGURES Figure 2.1: Number of Agricultural Households ..................................................................................................... 12 Figure 2.2: Agricultural Households by Region...................................................................................................... 12 Figure 2.3: Average Holding Size (Ha) for Land Owned and Land With Use Rights by Region ............................ 13 Figure 2.4: A Comparison of Average Agricultural Holding Size (Ha), 1992/93- 2005/06...................................... 14 Figure 2.5: Agricultural Households by Total Size by Season ............................................................................... 15 Figure 2.6: Percentage Distribution of Parcels Owned Within EA and Elsewhere ................................................. 17 Figure 2.7: Percentage Distribution of Parcels Owned and Those with Use Rights .............................................. 18 Figure 2.8: Percentage Distribution of Plots by Plot size and Season ................................................................... 20 Figure 3.1: Comparison of Percentage Distribution of Owned and Use Rights Parcels by Location...................... 28 Figure 3.2: Percentage distribution parcels Owned and with Use Rights by Land Tenure System within EA. ....... 29 Figure 3.3: Methods of Acquisition of Parcels (Within EA).................................................................................... 31 Figure 3.4: Primary Land Use for Owned Parcels by Season................................................................................ 32 Figure 3.5: Distribution of All Parcels by Primary Use ........................................................................................... 34 Figure 4.1: Production of Maize by Region............................................................................................................ 50 Figure 4.2: Maize Production Trend UNHS 1995/96 –2005/06.............................................................................. 50 Figure 4.3: Production of Finger Millet by Region.................................................................................................. 51 Figure 4.4: Finger Millet Production Trend UNHS 1995/96 – 2005/06................................................................... 52 Figure 4.5: Production of Sorghum by Region....................................................................................................... 52 Figure 4.6: Sorghum Production Trend UNHS 1995/96 – 2005/06........................................................................ 53 Figure 4.7: Production of Rice by Region .............................................................................................................. 54 Figure 4.8: Production of Beans by region............................................................................................................ 54 Figure 4.9: Beans Production Trend UNHS 1995/96 – 2005/06 ............................................................................ 55 Figure 4.10: Production of Groundnuts by Region................................................................................................. 56 Figure 4.11: Groundnuts Production Trend UNHS 1995/96 – 2005/06.................................................................. 56 Figure 4.12: Production of Banana (Food Type) by Region................................................................................... 57 Figure 4.13: Banana (Food Type) Production Trend UNHS 1995/96 – 2005/06.................................................... 58 Figure 4.14: Production of Cassava by Region...................................................................................................... 59 Figure 4.15: Cassava Production Trend UNHS 1995/96 – 2005/06 ...................................................................... 59 Figure 4.16: Production of Sweet Potatoes by Region .......................................................................................... 60 Figure 4.17: Sweet Potatoes Production Trend UNHS 1995/96 – 2005/06 ........................................................... 61 Figure 4.18: Production of Coffee (All) by Region.................................................................................................. 61 Figure 5.1: Percentage distribution of Ag HHs with Indigenous Cattle between 2002 PHC and UNHS 2005/06 ... 68 Figure 5.2: Percentage distribution of Agric. HHs with Exotic Cattle between PHC 2002 and UNHS 2005/06...... 69 Figure 5.3: Percentage distribution of Cattle number by breed and region............................................................ 70 Figure 5.4: Trend in Cattle Numbers (‘000) ........................................................................................................... 71 Figure 5.5: Percentage distribution of Ag HHs with Exotic Goats between 2002 PHC and UNHS 2005/06 .......... 72 Figure 5.6: Percentage distribution of Goats number by Breed and Region.......................................................... 73 Figure 5.7: Trend in Goat Numbers (‘000) ............................................................................................................. 74 Figure 5.8: Percentage distribution of Ag HHs with Sheep between 2002 PHC and UNHS 2005/06 .................... 75 Figure 5.9: Percentage distribution of Sheep by Breed and Region ...................................................................... 76 Figure 5.10: Sheep Trend (‘000)............................................................................................................................ 76 Figure 5.13: Percentage distribution of Ag HHs with Local Chicken between PHC 2002 and UNHS 2005/06 ...... 80 Figure 5.14: Percentage distribution of Ag HHs with exotic/cross Chicken bet. 2002 PHC and UNHS 2005/06 ... 81 Figure 5.15: Percentage distribution of Chicken number by breed and region ...................................................... 82 Figure 5.16: Chicken Trend (‘000) ......................................................................................................................... 83 Figure 6.1: Composition of Labour Days, UNHS 2005/06 ..................................................................................... 87 Figure 6.2: Distribution of Average Labour Cost by Season and Region (shs.) ..................................................... 89 Figure 6.3: Labour Days for Seedbed Preparation or Sowing................................................................................ 90 Figure 6.4: Labour Days for Application of Inputs .................................................................................................. 91 Figure 6.5: Labour Days for Weeding or Pruning................................................................................................... 92 Figure 6.6: Labour Days for Harvesting ................................................................................................................. 93 Figure 6.7: Major Causes of Crop Damage ........................................................................................................... 95 Figure 6.8: Distribution of Parcels by Use of Soil Conservation Measures ............................................................ 96 Figure 6.9: Percentage Distribution of Agric. Households visited by Extension Workers....................................... 98 Figure 6.10: Percentage Distribution of Agric. Hhds with a member having attended a NAADS training program 99 Figure 6.11: Percentage distribution of Membership of Agric. Hhds members under the FIDS of NAADS.......... 100 Figure 6.12: Percentage distribution of Agric. Hhds member participation in PEDAS under NAADS programs. . 101 Figure 6.13: Percentage distribution of Agric. Hhds Heads regarding Knowledge about changes in LTS ........... 102 Figure 6.14: Percentage distribution of Ag HHs Heads’ Spouses regarding Knowledge about changes in LTS . 103 Figure 6.15 Number of Ag HHs with no access to Information by Technology (‘000). ......................................... 106 Figure 6.16 Percentage Distribution of Ag HHs according to Knowledge of improved varieties. ......................... 111 Figure 6.17 Percentage Distribution of Ag HHs according to Information Source by Crop. ................................. 112 Figure 6.18 Percentage Distribution of Ag HHs according to use of variety ........................................................ 113
x
LIST OF ACRONYMS
Ag HHs Agricultural Households
Ag Mod Agricultural Module
APS Average Plot Size
CF Conversion Factors
CV Coefficient of Variation
DFID The UK Department for International Development
EA Enumeration Area
EFMPII Economic and Financial Management Project II
EPRC Economic Policy Research Center
FAO Food and Agricultural Organization
FAS Food and Agricultural Statistics
FMS First Monitoring Survey
GPS Global Positioning System
Ha Hectares
IDP Internally Displaced People
IHS Integrated Household Survey
ICBT Informal Cross Border Trade
MAAIF Ministry of Agriculture, Animal Industry and Fisheries
Mt Metric tons
NAADS National Agricultural Advisory Services
NCAL National Census of Agriculture and Livestock
NGO Non-Government Organization
PASS Permanent Agricultural Statistics System
PCA Pilot Census of Agriculture 2003
PEAP Poverty Eradication Action Plan
PHC Population and Housing Census 2002
PMA Plan for Modernization of Agriculture
PPS Probability Proportional to Size
SE Standard Errors
SMS Second Monitoring Survey
TMS Third Monitoring Survey
UBOS Uganda Bureau of Statistics
UNDP United Nations Development Organization
UNHS Uganda National Household Survey
FIDS Farmer Institutional Development Scheme
PEDAS Prioritizing Enterprises to Demand for Advisory Services
xi
EXECUTIVE SUMMARY
Due to paucity of Food and Agricultural Statistics (FAS), it was decided to include an Agricultural
Module in the UNHS 2005/06. Crop surveys were included as modules in the Third Monitoring Survey
(TMS) of 1995/96 and the Uganda National Household Survey 1999/00.
The results have once again demonstrated that it is possible to carry out a country wide agricultural
survey through the household approach and to provide reasonably accurate estimates of area and
production of major crops, livestock and poultry numbers and other characteristics at national and
regional levels.
The main objective of the UNHS 2005/06 Agricultural Module was to collect high quality and timely
data on the agricultural sector. In particular the module was intended to:
Give a better descriptive picture of Uganda’s agricultural economy, and deeper insight into factors
affecting farm incomes. These would include a better understanding of the influence of farmers’
resources and marketing opportunities on farm-household income.
Provide useful guidance to decision-makers charged with implementing the Plan for Modernization of
Agriculture (PMA) in line with the Poverty Eradication Action Programme (PEAP).
Provide both descriptive and analytical reports on current farm-household structure, technology use,
level of land, labor and capital resources, and degree of involvement in both output and input
markets.
During the first field visit (May – October 2005) agricultural production data was collected on the
second season of 2004 (July – December, 2004), while the second visit (November 2005 – April
2005) collected agricultural production data of the First Season of 2005 (January – July 2005).
The data in the report is therefore categorized between Second Season of 2004 and First Season
of 2005 which when combined gives results for the two seasons’ data.
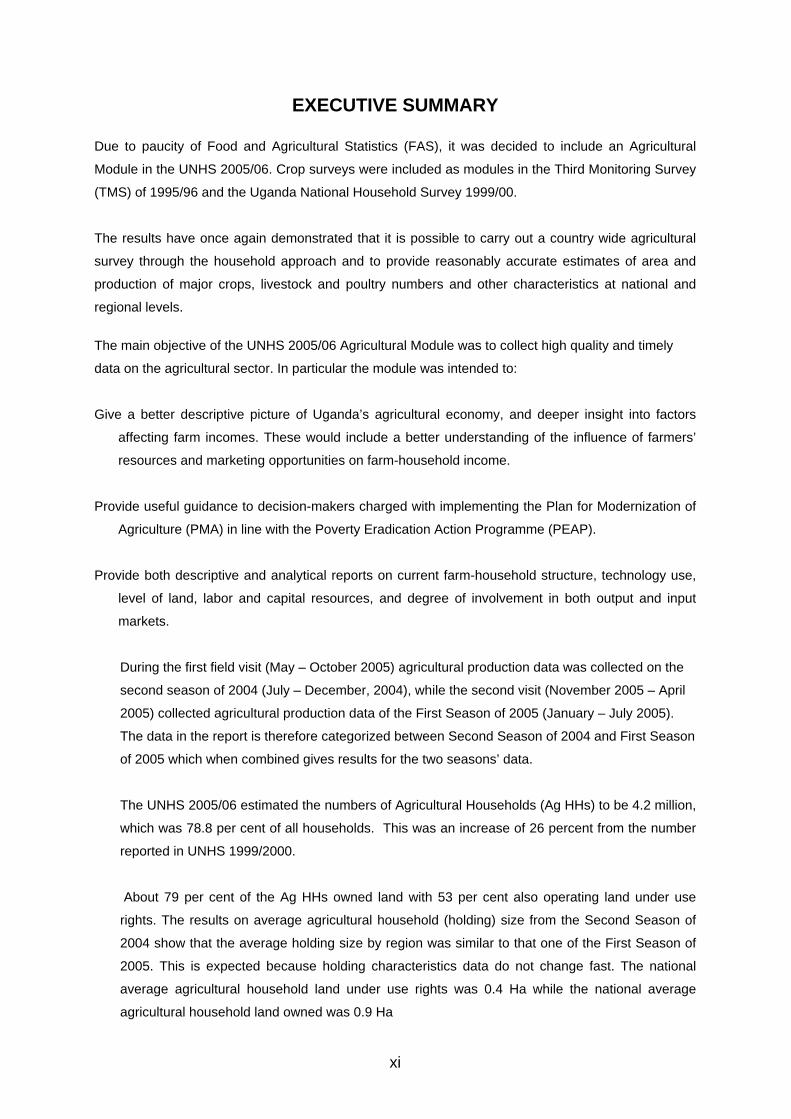
The UNHS 2005/06 estimated the numbers of Agricultural Households (Ag HHs) to be 4.2 million,
which was 78.8 per cent of all households. This was an increase of 26 percent from the number
reported in UNHS 1999/2000.
About 79 per cent of the Ag HHs owned land with 53 per cent also operating land under use
rights. The results on average agricultural household (holding) size from the Second Season of
2004 show that the average holding size by region was similar to that one of the First Season of
2005. This is expected because holding characteristics data do not change fast. The national
average agricultural household land under use rights was 0.4 Ha while the national average
agricultural household land owned was 0.9 Ha
xii
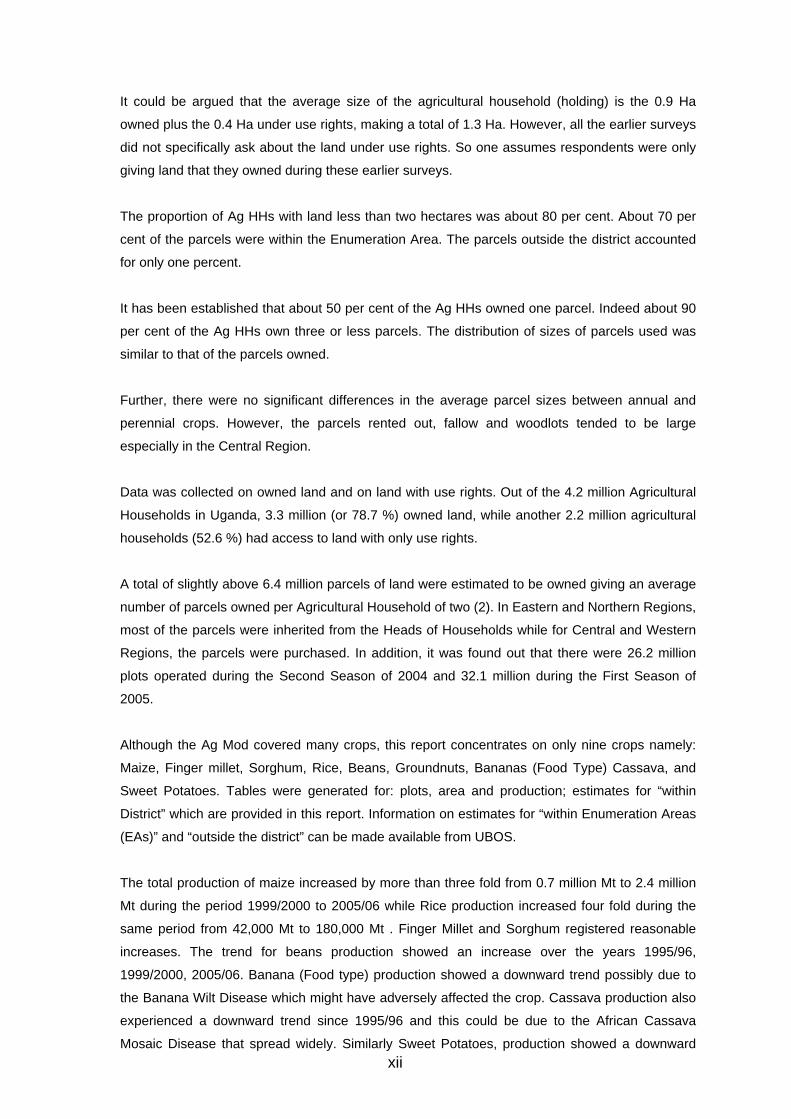
It could be argued that the average size of the agricultural household (holding) is the 0.9 Ha
owned plus the 0.4 Ha under use rights, making a total of 1.3 Ha. However, all the earlier surveys
did not specifically ask about the land under use rights. So one assumes respondents were only
giving land that they owned during these earlier surveys.
The proportion of Ag HHs with land less than two hectares was about 80 per cent. About 70 per
cent of the parcels were within the Enumeration Area. The parcels outside the district accounted
for only one percent.
It has been established that about 50 per cent of the Ag HHs owned one parcel. Indeed about 90
per cent of the Ag HHs own three or less parcels. The distribution of sizes of parcels used was
similar to that of the parcels owned.
Further, there were no significant differences in the average parcel sizes between annual and
perennial crops. However, the parcels rented out, fallow and woodlots tended to be large
especially in the Central Region.
Data was collected on owned land and on land with use rights. Out of the 4.2 million Agricultural
Households in Uganda, 3.3 million (or 78.7 %) owned land, while another 2.2 million agricultural
households (52.6 %) had access to land with only use rights.
A total of slightly above 6.4 million parcels of land were estimated to be owned giving an average
number of parcels owned per Agricultural Household of two (2). In Eastern and Northern Regions,
most of the parcels were inherited from the Heads of Households while for Central and Western
Regions, the parcels were purchased. In addition, it was found out that there were 26.2 million
plots operated during the Second Season of 2004 and 32.1 million during the First Season of
2005.
Although the Ag Mod covered many crops, this report concentrates on only nine crops namely:
Maize, Finger millet, Sorghum, Rice, Beans, Groundnuts, Bananas (Food Type) Cassava, and
Sweet Potatoes. Tables were generated for: plots, area and production; estimates for “within
District” which are provided in this report. Information on estimates for “within Enumeration Areas
(EAs)” and “outside the district” can be made available from UBOS.
The total production of maize increased by more than three fold from 0.7 million Mt to 2.4 million
Mt during the period 1999/2000 to 2005/06 while Rice production increased four fold during the
same period from 42,000 Mt to 180,000 Mt . Finger Millet and Sorghum registered reasonable
increases. The trend for beans production showed an increase over the years 1995/96,
1999/2000, 2005/06. Banana (Food type) production showed a downward trend possibly due to
the Banana Wilt Disease which might have adversely affected the crop. Cassava production also
experienced a downward trend since 1995/96 and this could be due to the African Cassava
Mosaic Disease that spread widely. Similarly Sweet Potatoes, production showed a downward
xiii
trend. Perhaps, poor rainfall distribution or disease or both could provide possible explanation for
this performance.
The national cattle herd was estimated at 7.5 Million. Of these, nearly 1.3 million were
exotic/cross and the majority (0.9 Million) were in the Western Region. The Central Region with
nearly 2.0 Million indigenous cattle had the largest share of this breed. Cattle population trend
showed an increase over the years.
At the national level, the number of goats, sheep and pigs was estimated at 8.1, 1.2 and nearly
1.7 million, respectively. The Western Region led in goats rearing with 2.9 million (36.3%); the
Northern Region led in sheep rearing with 0.5 million (41.7%); the Central Region on the other
hand led in pig rearing with 0.8 million (47.1%)
The total number of chicken was estimated at 23.5 million, of which 3.7 million (15.7 %) were
exotic / cross. The local chicken/backyards were 19.8 million (84.3 %). Generally, over the years,
the chicken population has been increasing except those reported in the PHC 2002 where the
number was low possibly due to under-reporting.
The use of non-labour inputs is still very low especially the improved seeds which were reported
by only 6.8% of all the parcels; manure 6.8%; chemical fertilizers 1.0% and the combined
pesticides, herbicides, and fungicides by 3.4%.
The number of labour days for both seasons totaled to 1,263 million and hired labour constituted
116 million (9.2%) with Western Region using the highest labour days (47 million).
Out of 24.1 million crop plots, 4.7 million (19.4%) reported to have experienced rain shortage as
the main cause of crop damage.
Generally, there were small increments between 2000 and 2005 for practice of three soil
conservation measures namely bunds, terracing and mulching.
Agricultural extension services are still poor. Only 300,000 (7.3%) of the 4.2 million Ag HHs
reported having been visited by an extension worker with the Northern Region reporting the least
(14%) of those visited.
About 10 percent of the Ag HHs reported a household member having participated in a training
programme organized by NAADS. In addition, about 5.4% of the Ag HHs had at least a member
in Farmer Groups under NAADS.
However, it should be noted that at the time of the survey, NAADS coverage was only in 282 (29
%) out of 957 sub-counties and there was no stratification between NAADS sub-counties (or even
xiv
EAs) and non-NAADS ones. So these results are unlikely to properly reflect the coverage by
NAADS even where it operates.
About 44 per cent of Ag HHs were willing to pay for information on improved varieties while 68
percent of Ag HHs had no access to information on farm management.
Finally, the most common source of information regarding improved varieties was reported by 60
percent of the farmers as by talking to other farmers.
1
CHAPTER ONE: INTRODUCTION
1.1 Background
As a key contributor to the monitoring framework, Uganda Bureau of Statistics
(UBOS) has conducted national household surveys large-scale surveys since 1989.
The surveys have had a nationwide coverage with varying objectives and core
modules. The UNHS 2005/06 round of household surveys was yet another in a series
conducted by UBOS.
1.2 Survey Objectives The main objective of the Uganda National Household Survey (UNHS 2005/06) was
to collect high quality and timely data on demographic, social and economic
characteristics of the household population for national and international development
frameworks.
The main objective of the UNHS 2005/06 Agricultural Module was to collect high
quality and timely data on the farm economy. In particular the crop module was
intended to:
i) Give a better descriptive picture of Uganda’s farm economy, and a deeper insight
into factors affecting farm incomes so as to better understand the influence of
farmers’ resources and marketing opportunities on farm-household income.
ii) Provide useful guidance to decision-makers charged with implementing the Plan for
Modernization of Agriculture (PMA) and Poverty Eradication Action Programme
(PEAP).
(iii) Provide both descriptive and analytical output that should be of use to line
ministries involved in PMA implementation, as well as other agencies.
(iv) Assess the relative importance of different factors affecting farm incomes, and
the priority they should be assigned in attacking the problem of low farm incomes.
1.3 Scope and Coverage
The UNHS 2005/06 covered all the districts in Uganda. Efforts were made to ensure
that all clusters in each district were canvassed. The Agricultural Module covered the
household crop farming enterprise particulars with emphasis on land, crop area,
inputs, outputs and other allied characteristics. The components of the module
included: investments on land, crop areas, labour and non labour inputs for the
Second Season of 2004 and First Season of 2005, crop disposition, land rights,
disputes and certificates; livestock, small animals and poultry reared or owned,
expenditure on livestock and agricultural extension services and technologies.
More specifically, the following data was collected:
Objectives of the UNHS 2005/06
UNHS 2005/06 covered all districts of Uganda
UNHS 2005/2006 Agricultural Module related to PMA and PEAP
2
• Current land holdings and ownership;
• Crop plot numbers by parcels operated within the Enumeration Area (EA) and
within the District;
• The data was divided between pure and mixed cropping with an indication of
the percentages of the mixtures;
• Holders’ pre-harvest and post-harvest estimates;
• Agricultural sales and prices at the holding level;
• The price data collection was preceded by first screening as to whether
anything was sold during the past month; if so, the volume sold the last time
and the price at which it was sold ; and,
• Livestock and poultry numbers.
The questionnaire used in the survey is given in the Annex 4
1.4 Earlier Food and Agricultural Statistics Collection Activities Due to paucity of Food and Agricultural Statistics (FAS), an Agricultural Module was
included in the UNHS Programme. The Agricultural Module of the 2005/06 Household
survey is the third effort since the start of the household survey programme in 1989.
The first and second were included in the Third Monitoring Survey (1995/96) and the
UNHS 1999/2000 respectively.
UBOS also included an Agricultural Module in the 2002 Uganda Population and
Housing Census (PHC). The data generated from the PHC included; number of crop-
plots planted during the first agricultural season of 2002; type of crop stand; livestock
and poultry numbers: (by local and exotic/improved breed) and information about fish
farming.
Other UBOS activities that have provided FAS include; the Pilot Census of Agriculture
(PCA) 2003 whose aim was to test methodology and Instruments, the Pilot
Permanent Agricultural Statistics System (PASS 2004) which collected data on Crop
Areas and Production, Livestock Numbers and Crop Utilization, and the Informal
Cross Boarder Trade (ICBT) which collected data on cross border agricultural trade
between Uganda, Kenya, Tanzania, Democratic Republic of Congo, Rwanda and the
Sudan.
In addition to UBOS, the Ministry of Agriculture, Animal Industry and Fisheries
collected FAS through:
i) The Census of Agriculture 1963/1965.
ii) Follow-up Surveys in 1967/68 & 1968
iii) National Census of Agriculture and Livestock (NCAL), 1990/91.
iv) Two follow-up annual sample surveys in 1991/92 and 1992/93 agricultural
years.
FAS in MAAIF
3
Wherever possible and relevant, comparisons are made in the report between the
UNHS 2005/06 results and these earlier sources.
1.5 Sample Design A two stage sampling design1 was used to draw the sample. At the first stage
Enumeration Areas (EAs) were drawn with Probability Proportional to Size (PPS), and
at the second stage, households which are the Ultimate Sampling Units were drawn
using Simple Random Sampling (SRS).
This time round, districts were not treated as separate strata as in previous
household surveys. Rather, the stratification focused on rural-urban and regional
levels. Thus all districts were categorized into the above classifications during the
sample selection.
The sample of Enumeration Areas (EAs) for the UNHS 2005/06 was selected using
the PHC 2002 Frame. Initially, a total of 600 EAs was selected. These EAs were
allocated to each region on the basis of the population size of the region. However, in
the Northern region, the number of EAs drawn was doubled. The extra EAs were to
be held in reserve to allow for EA attrition due to the civil war. It was also realized that
the sample in 10 districts needed to be increased to about 30 EAs to have an
adequate sample size for reliable district level estimates. These changes led to
drawing an extra 153 EAs.
Due to a considerable proportion of the population in Internally Displaced People
(IDPs) camps, the IDPs were treated as a separate selection stratum and a sample of
30 EAs were drawn from the camps. Thus, a total of 753 EAs representing the
general household population, and 30 EAs representing the displaced population
were selected for the UNHS 2005/06.
The administration of the Agricultural Module in the IDP camps was restricted to only
information provided by the respondents. No attempt was made to measure the size
of the agricultural parcels due to the security concerns outside the IDPs.
The selection of households was done using stratification by crop farming categories
and by the size of the land under crops. Households were classified in four categories
namely; non farming households, households with less than 2.5 acres (small-scale),
households with more than two and half acres but less than five acres (medium-
scale), and households with over 5 acres (large-scale). A total of 10 households were
selected in each EA and the sample was proportionally allocated based on number of
households per class size. Thus if all households in an EA were engaged in
agricultural activities, there would be 10 households interviewed. The UNHS 2005/06
covered a sample size of 7,417 households of which 5877 were Ag HHs.
A two stage sampling design used
10 Districts had enough EAs for their estimates
753 EAs selected including 30 EAs in IDP Camps
Households stratified by area of holding
4
1.6 Survey Organization 1.6.1 Survey Teams A centralized approach to data collection was used and comprised of 15 field teams.
Each team consisted of one Supervisor, one Editor, four (4) Enumerators and one
Driver. Fieldwork was undertaken with the use of mobile field teams whereby work
was programmed from the headquarters to all the sampled areas. The teams were
recruited based on the languages mostly used in each region. In total, there were 15
Supervisors, 15 Editors, 60 Enumerators, four (4) Regional Supervisors, four (4)
Senior Supervisors and 15 Drivers.
1.6.2 Number of visits to Household Before the actual data collection started, all households/holdings in the EA were
visited and listed. Section 18 of Socio-Economic Questionnaire helped to determine
whether the household carried out any agricultural activity. i.e. Cultivating crops or
raising livestock, poultry or fish farming at any point during the past 12 months prior to
the listing exercise.
Two visits were made to each selected Agricultural Household in order to capture
seasonality patterns in both the Socio-Economic and Agricultural Module where
applicable. The visits were as follows:
i) The first visit (May-October 2005)
The Agricultural module was administered to all households that were engaged in
agricultural activities to collect information for the Second Season of 2004 (July –
December). In addition, the Socio-Economic Module was administered to five out of
the ten selected households in each EA.
ii) Second visit (November 2005-April 2006)
The Agricultural Module was administered to all households that were engaged in
agriculture to collect information for the First Season of 2005 (January – July). The
Socio-Economic module was then administered to the remaining five out of the ten
selected households in each EA.
The data was collected for the Second Season of 2004 and First Season of 2005.
This Agricultural Module report results are for a combination of both seasons.
1.7 Data Management and Processing To ensure good quality of data, a system of double entry was used for data capture. A
manual system of editing questionnaires was set-up and two office editors were
recruited to further assess the consistency of the data collected. A computer program
Data collected by moving teams of staff
First visit was for listing
Two other visits for data collection
Double entry employed for data quality
5
(hot-deck scrutiny) for verification and validation was developed and operated during
data processing.
Range and consistency checks were included in the data-entry program. More
intensive and thorough checks were carried out using MS-ACCESS by the data
processing team.
1.8 Funding
The Government of Uganda and the World Bank through the Second Phase of the
Economic and Financial Management Project (EFMP II), and the Department For
International Development (DFID) provided the financial support that enabled the
survey to be undertaken. This was part of the six year programme that has enabled
UBOS to undertake two household surveys.
1.9 Reliability of Estimates
The estimates presented in this report were derived from a scientifically selected
sample and analysis of survey data was undertaken at national and regional levels.
Standard Errors (SE) and Coefficients of Variations (CVs) of some of the variables
have been presented in Appendix 2 to show the precision levels.
1.10 Further Analysis
A lot of data was collected during the Survey. However, a large proportion has not
been analyzed and put in this report. Below are some of the highlights of the possible
further analyses that need to be carried out.
1.10.1 Comparison of Area Estimates between Global Positioning System
(GPS) Equipment and Farmers’ Estimates Estimates of parcel areas regardless of location were made by the farmers and then
for those within EA Enumerators measured using the GPS equipment. Similarly,
during the second visit, farmers made estimates of the areas of the crop plots for the
First Season of 2005. Then the crop plots within the EA were supposed to be
measured by the enumerators using the GPS equipment. However, in this report, only
farmers’ estimates are used in the analysis. This is to enable a comparison with
results from earlier surveys where farmers’ estimates were obtained. Analysis of the
data using the two methods is therefore required.
District Estimates Data for the 10 Districts which were over sampled has not been presented in this
report. It may be possible to have estimates for the districts of Apac, Arua, Bushenyi,
Mbarara, Mbale, Iganga, Kamuli, Mubende, Masaka and Mukono.
Funding by EFMP II, DFID and GOU
6
Food Balance Sheets There have been decreases in the production of Cassava, Sweet Potatoes and
Banana (Food Type) in UNHS 2005/06 in comparison with UNHS 1999/2000 and
UNHS 1995/96. On the other hand, there have been increases in the production of
maize, beans and rice. To determine whether there is insufficient food, it is necessary
to attempt another Food Balance Sheet study.
Crop Cards Estimation of production from own-produce is a major challenge to Agricultural
Statistics. It is even more challenging for the frequently harvested crops like Cassava,
Sweet Potatoes and Banana. Crop Cards were developed and administered to all
sampled Households with an agricultural activity. Respondents were requested to
record all harvests from own produce. The cards were distributed to respondents
during the first visit and retrieved at the second visit to the household. The duration
between the first and second visit was about five months.
Crop Cards were distributed to all households that reported crop farming activity. All
harvests were supposed to be recorded by the respondent assisted by a Crop Card
Monitor (CCM) who was recruited during the first visit to the EA and trained on how to
fill the questionnaire. The CCM covered one cluster and was supposed to visit all the
crop farming households at least once a week.
In a number of clusters, the crop cards were properly filled but in others the following
observations were made;
The CCM did not visit the households regularly;
In some cases, purchases were also recorded;
Various units of quantities have to be converted into standard ones. These vary
according to area;
There were many fruits harvested that were usually not reported by
respondents during surveys; and,
Some respondents were not able to record the harvested crops.
It is however felt that, if regularly monitored, the CCM could be a better method in
recording actual harvests in selected clusters. It is considered a possible source of
annual data on agricultural production for a few selected variables. If the interview
was done immediately or shortly after full harvest, the respondents were considered
to provide accurate values of harvests and its disposition. Data on Crop Cards will be
analyzed and as mentioned above, the results are expected to be disseminated in a
separate report.
7
Stratification for NAADS The sample design in the survey was based on getting national and regional
estimates. However, in the Agricultural Seasons under reference, National
Agricultural Advisory Services (NAADS) coverage was only in 282 Sub-Counties (i.e.
29% of all the Sub Counties) in Uganda. Unfortunately, no stratification was done
between NAADS and non-NAADS Sub Counties (or even EAs). A post enumeration
stratification of NAADS and non-NAADS sub-counties or even EAs could be
attempted with a subsequent re-analysis of the data. There is however, no guarantee
that there will be enough observations for the areas covered by NAADS.
1.11 Problems Encountered and Constraints
During the survey some problems and experiences related to the agricultural module
were observed as outlined below:
Measuring Large Areas: In Section 2 of the questionnaire, the grazing land e.g. in Sembabule District
and some parts of Western Uganda were enormously big to measure using
Global Positioning System (GPS) tool and yet in some circumstances the
owners did not know the size of this grazing land nor could they accurately
estimate its area. The solution given was to measure the entire piece which
took a lot of time.
Timing of the two Visits: Information collected on the two major seasons entailed the respondents to
recall what took place several months back since information was collected
long after the harvests. The memory lapses of the respondents led to
production of more of estimated information instead of the actual especially
during the first visit.
Conversion Factors: There is need for comprehensive data on conversion factors. The units of
quantities used in estimating the various crop harvests varied a lot from area to
area. For example, a heap as one of the most common units of quantity for
measuring cassava, vary tremendously from area to area. This requires
determining Conversion Factors for each area and crop. The data on
Conversion Factors collected under this survey and that earlier collected under
the PCA 2003 need to be consolidated. Further more, the data on Conversion
Factors for the state and condition of crops is from the 1960s. Crop utilization
tables in sections 7A and 7B of the questionnaire are not reliable as information
was not collected on the conditions and state of each item utilized. It is
therefore not possible to convert them to some standard condition.
8
Problems of GPS tool use: The Enumerators were committing an error in the beginning of the exercise
regarding area measurement using the GPS tool in section 2 and area
estimation in sections 4A and 4B. The GPS tool was set by Enumerators to
read acres instead of recommended square meters. This could lead to
conflicting information between measured and estimated areas. The problem
was subsequently solved by measuring in square meters to cater for such
discrepancies.
Resistance to area measurement: Some respondents did not want their plot areas measured. So measuring land
in some districts was a real challenge and in a number of cases, the
communities refused to cooperate despite the intervention of the district
leadership. These were not measured.
No Area Measurement in IDP Camps: No attempt was made to measure area in the Internally Displaced People (IDP)
camps. Only estimates by the farmer were taken. This was because the plots
were a distance from the camp.
Under-reporting: Under-reporting of livestock and poultry numbers still a challenge to data
collectors.
Incomplete coverage: Institutional and Private Large-Scale Farms were not covered as the UNHS is
household-based.
Single Criterion used in Classification or Stratification The classification of Ag HHs was based only on single criteria of holding size
rather than the multi-criteria which was set up after PCA 2003. Application of
the multi-criteria would require longer listing procedures and more intensive
training of field staff.
Open Segment (i.e. Outside EA) used A closed segment (i.e. within Enumeration Areas) is often used when data on
characteristics of land is required e.g. Land areas, Crop areas, production,
livestock and poultry and crop trees.

9
On the other hand, open segment is used when collecting economic data e.g.
income, prices, farm labour and wages etc, since these characteristics mainly
relate to the farm harvests.
During the survey, crop production data was collected for even parcels within
District and also outside district. Similarly, livestock numbers were collected
using the open segment approach.
There is need to judiciously choose either open or closed segment, basing on
existing evidence vis-à-vis what theory recommends to be done since Socio-
economic cross-tabulations have been carried out in order to get a comparison
of the data. Crop data has also been analyzed on an open-segment basis
covering the whole district rather than within the EA.
1.12 Structure of the Report
The UNHS 2005/06 Agricultural Module report is structured as follows: Chapter One
presents the introduction while in chapter two; an overview of the Ag HHs
characteristics is discussed. Highlights on land ownership and user rights are
comprehensively addressed in chapter three. In chapter four, information on area,
production and utilization of various crops are presented and in chapter five, livestock
and poultry figures are discussed. Chapter six provides highlights of the labour and
non labour inputs, while the detailed tables are given in the respective Annex tables.
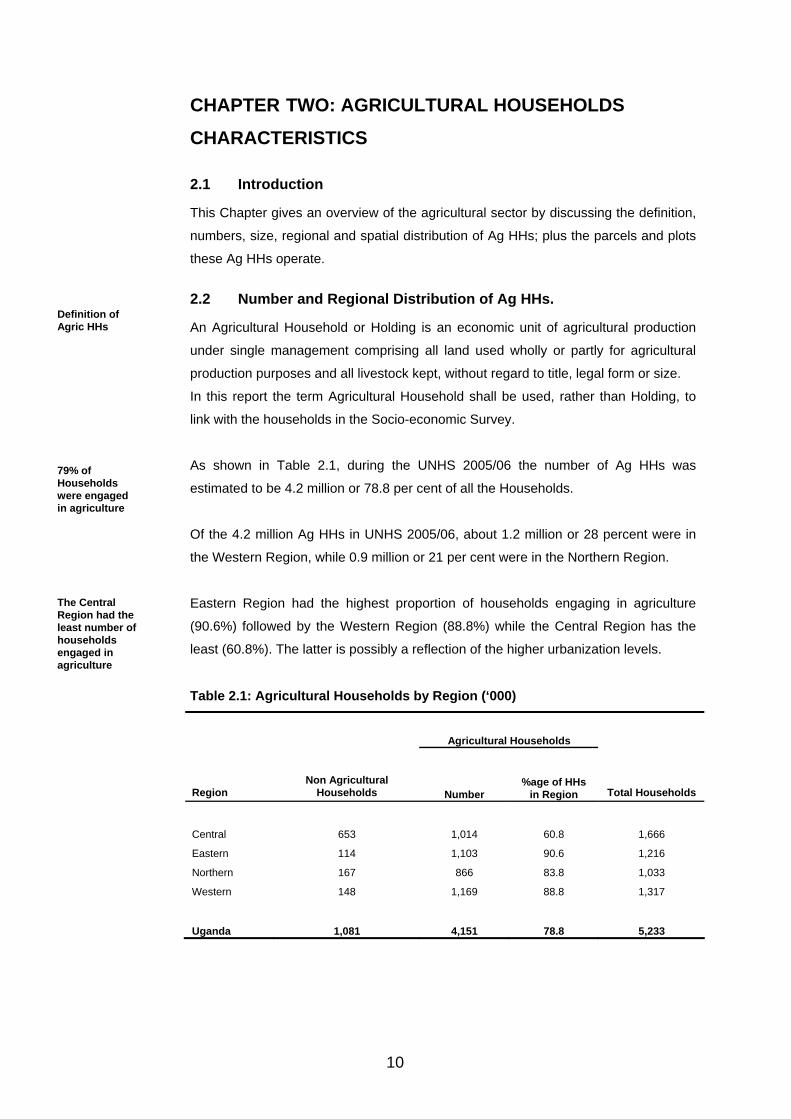
10
CHAPTER TWO: AGRICULTURAL HOUSEHOLDS
CHARACTERISTICS
2.1 Introduction
This Chapter gives an overview of the agricultural sector by discussing the definition,
numbers, size, regional and spatial distribution of Ag HHs; plus the parcels and plots
these Ag HHs operate.
2.2 Number and Regional Distribution of Ag HHs.
An Agricultural Household or Holding is an economic unit of agricultural production
under single management comprising all land used wholly or partly for agricultural
production purposes and all livestock kept, without regard to title, legal form or size.
In this report the term Agricultural Household shall be used, rather than Holding, to
link with the households in the Socio-economic Survey.
As shown in Table 2.1, during the UNHS 2005/06 the number of Ag HHs was
estimated to be 4.2 million or 78.8 per cent of all the Households.
Of the 4.2 million Ag HHs in UNHS 2005/06, about 1.2 million or 28 percent were in
the Western Region, while 0.9 million or 21 per cent were in the Northern Region.
Eastern Region had the highest proportion of households engaging in agriculture
(90.6%) followed by the Western Region (88.8%) while the Central Region has the
least (60.8%). The latter is possibly a reflection of the higher urbanization levels.
Table 2.1: Agricultural Households by Region (‘000)
Agricultural Households
Region Non Agricultural
Households Number %age of HHs
in Region Total Households
Central 653 1,014 60.8 1,666
Eastern 114 1,103 90.6 1,216
Northern 167 866 83.8 1,033
Western 148 1,169 88.8 1,317
Uganda 1,081 4,151 78.8 5,233
Definition of Agric HHs
79% of Households were engaged in agriculture
The Central Region had the least number of households engaged in agriculture
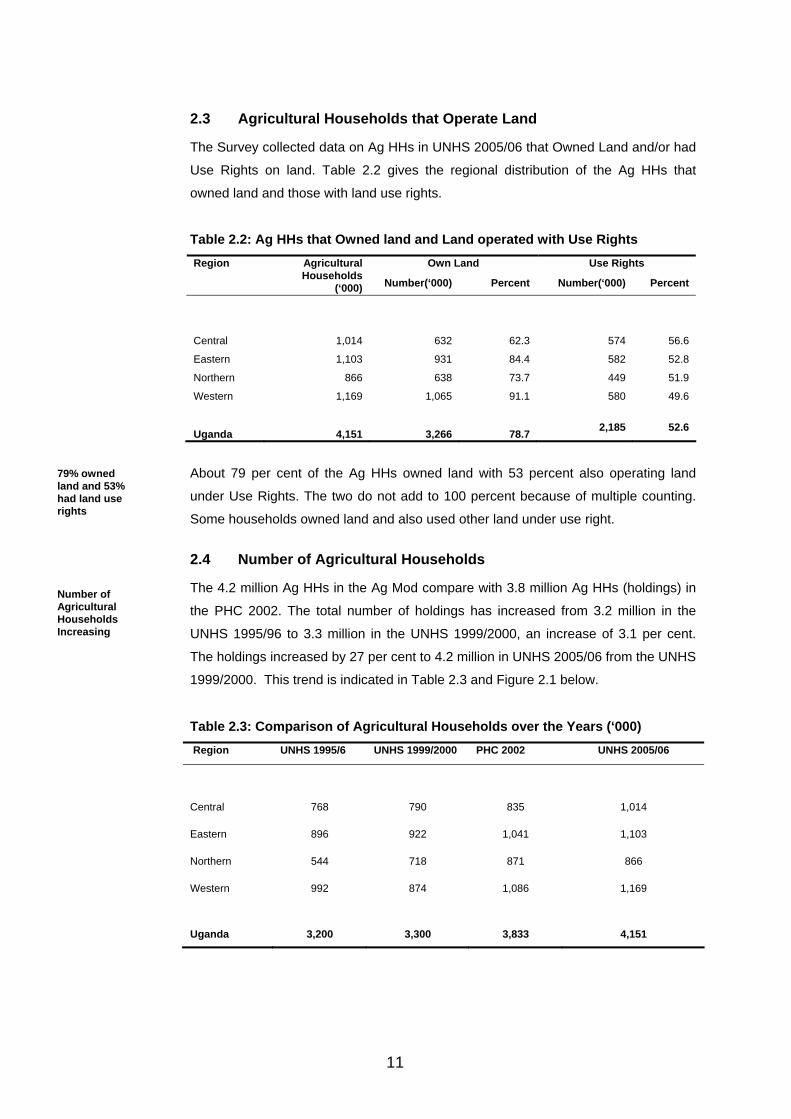
11
2.3 Agricultural Households that Operate Land
The Survey collected data on Ag HHs in UNHS 2005/06 that Owned Land and/or had
Use Rights on land. Table 2.2 gives the regional distribution of the Ag HHs that
owned land and those with land use rights.
Table 2.2: Ag HHs that Owned land and Land operated with Use Rights Own Land Use Rights Region Agricultural
Households (‘000) Number(‘000) Percent Number(‘000) Percent
Central 1,014 632 62.3 574 56.6
Eastern 1,103 931 84.4 582 52.8
Northern 866 638 73.7 449 51.9
Western 1,169 1,065 91.1 580 49.6
Uganda 4,151 3,266 78.7 2,185 52.6
About 79 per cent of the Ag HHs owned land with 53 percent also operating land
under Use Rights. The two do not add to 100 percent because of multiple counting.
Some households owned land and also used other land under use right.
2.4 Number of Agricultural Households
The 4.2 million Ag HHs in the Ag Mod compare with 3.8 million Ag HHs (holdings) in
the PHC 2002. The total number of holdings has increased from 3.2 million in the
UNHS 1995/96 to 3.3 million in the UNHS 1999/2000, an increase of 3.1 per cent.
The holdings increased by 27 per cent to 4.2 million in UNHS 2005/06 from the UNHS
1999/2000. This trend is indicated in Table 2.3 and Figure 2.1 below.
Table 2.3: Comparison of Agricultural Households over the Years (‘000) Region UNHS 1995/6 UNHS 1999/2000 PHC 2002 UNHS 2005/06
Central 768 790 835 1,014
Eastern 896 922 1,041 1,103
Northern 544 718 871 866
Western 992 874 1,086 1,169
Uganda 3,200 3,300 3,833 4,151
79% owned land and 53% had land use rights
Number of Agricultural Households Increasing
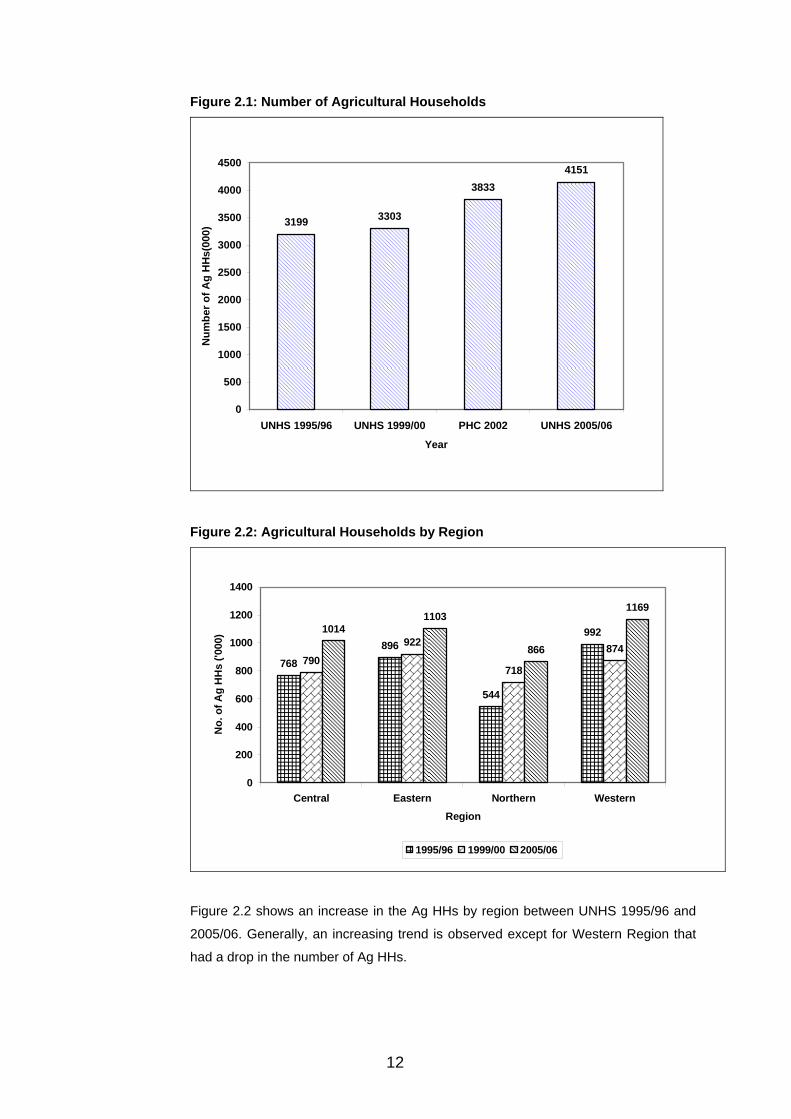
12
Figure 2.1: Number of Agricultural Households
3199 3303
38334151
0
500
1000
1500
2000
2500
3000
3500
4000
4500
UNHS 1995/96 UNHS 1999/00 PHC 2002 UNHS 2005/06
Year
Num
ber o
f Ag
HH
s(00
0)
Figure 2.2: Agricultural Households by Region
768896
544
992
790
922
718
874
10141103
866
1169
0
200
400
600
800
1000
1200
1400
Central Eastern Northern WesternRegion
No.
of A
g H
Hs
('000
)
1995/96 1999/00 2005/06
Figure 2.2 shows an increase in the Ag HHs by region between UNHS 1995/96 and
2005/06. Generally, an increasing trend is observed except for Western Region that
had a drop in the number of Ag HHs.
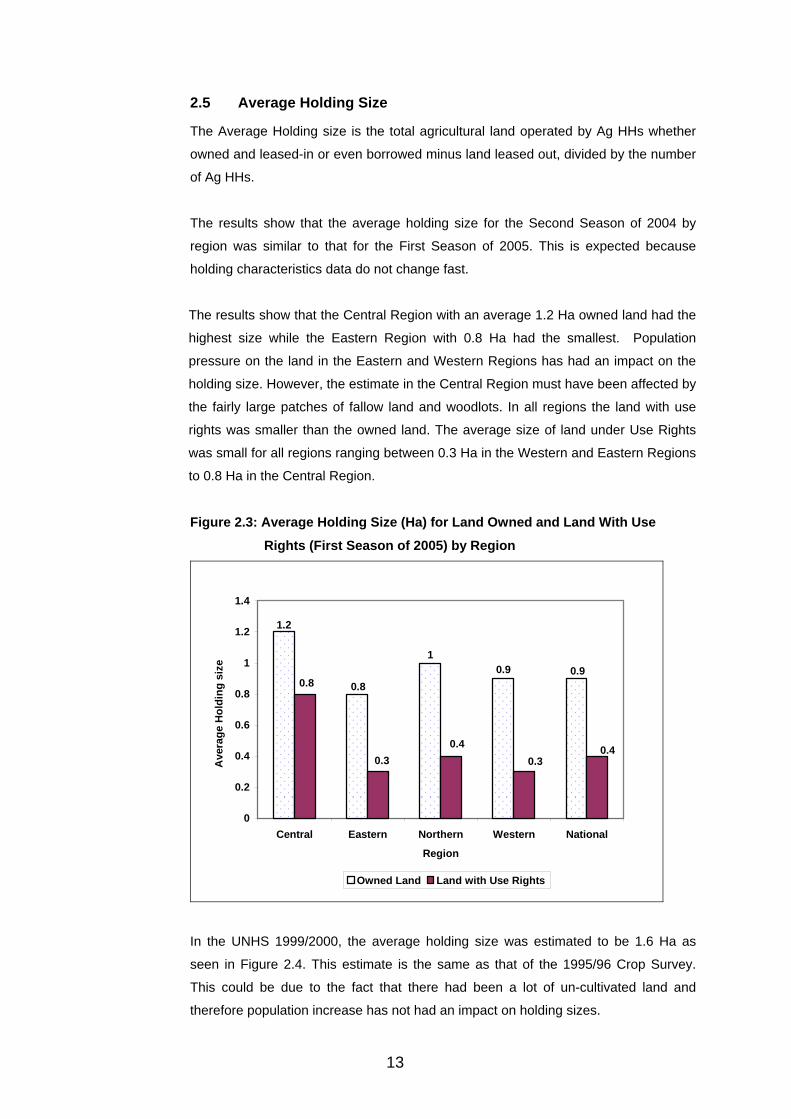
13
2.5 Average Holding Size The Average Holding size is the total agricultural land operated by Ag HHs whether
owned and leased-in or even borrowed minus land leased out, divided by the number
of Ag HHs.
The results show that the average holding size for the Second Season of 2004 by
region was similar to that for the First Season of 2005. This is expected because
holding characteristics data do not change fast.
The results show that the Central Region with an average 1.2 Ha owned land had the
highest size while the Eastern Region with 0.8 Ha had the smallest. Population
pressure on the land in the Eastern and Western Regions has had an impact on the
holding size. However, the estimate in the Central Region must have been affected by
the fairly large patches of fallow land and woodlots. In all regions the land with use
rights was smaller than the owned land. The average size of land under Use Rights
was small for all regions ranging between 0.3 Ha in the Western and Eastern Regions
to 0.8 Ha in the Central Region.
Figure 2.3: Average Holding Size (Ha) for Land Owned and Land With Use
Rights (First Season of 2005) by Region
0.8
1.2
10.9 0.9
0.8
0.30.4
0.30.4
0
0.2
0.4
0.6
0.8
1
1.2
1.4
Central Eastern Northern Western National
Region
Ave
rage
Hol
ding
siz
e
Owned Land Land with Use Rights
In the UNHS 1999/2000, the average holding size was estimated to be 1.6 Ha as
seen in Figure 2.4. This estimate is the same as that of the 1995/96 Crop Survey.
This could be due to the fact that there had been a lot of un-cultivated land and
therefore population increase has not had an impact on holding sizes.
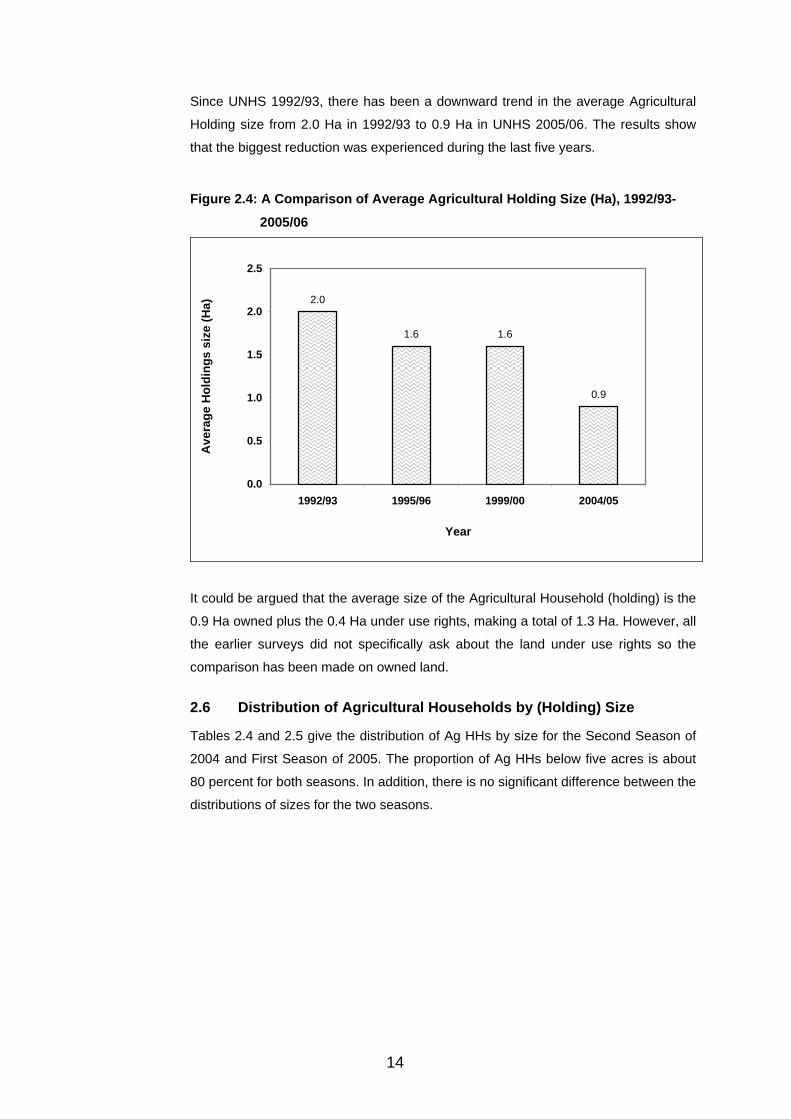
14
Since UNHS 1992/93, there has been a downward trend in the average Agricultural
Holding size from 2.0 Ha in 1992/93 to 0.9 Ha in UNHS 2005/06. The results show
that the biggest reduction was experienced during the last five years.
Figure 2.4: A Comparison of Average Agricultural Holding Size (Ha), 1992/93-
2005/06
2.0
1.6 1.6
0.9
0.0
0.5
1.0
1.5
2.0
2.5
1992/93 1995/96 1999/00 2004/05
Year
Ave
rage
Hol
ding
s si
ze (H
a)
It could be argued that the average size of the Agricultural Household (holding) is the
0.9 Ha owned plus the 0.4 Ha under use rights, making a total of 1.3 Ha. However, all
the earlier surveys did not specifically ask about the land under use rights so the
comparison has been made on owned land.
2.6 Distribution of Agricultural Households by (Holding) Size
Tables 2.4 and 2.5 give the distribution of Ag HHs by size for the Second Season of
2004 and First Season of 2005. The proportion of Ag HHs below five acres is about
80 percent for both seasons. In addition, there is no significant difference between the
distributions of sizes for the two seasons.

15
Table 2.4: Percentage Distribution of Holdings by size in Second Season of
2004 and First Season of 2005, (land owned with in EA in Acres)
Second Season 2004
Region Central Eastern Northern Western Total <.0.1 0.5 0.1 0 0.8 0.4 0.1-0.9 21.5 25 14.9 23.3 22.1 1.0-1.9 22.6 25.7 18.9 24.4 23.5 2-4.9 31.1 33.3 40.7 33.3 34.1 5-9.9 15.2 11.6 17.9 10.7 13 10-49.9 7.1 3.8 6.8 6.7 5.9 50-99.9 0.8 0.4 0.5 0.3 0.5 100-499.9 0.7 0.1 0 0.4 0.3 >500 0.5 0.1 0.2 0 0.1
Total 100 100 100 100 100
First Season, 2005
<.0.1 0.5 0.1 0 0.8 0.4 0.1-0.9 21.7 24.9 15.2 23.5 22.2 1.0-1.9 22.5 25.7 18.8 24.3 23.5 2-4.9 31.2 33.2 40.7 33.5 34.2 5-9.9 15.1 11.7 17.7 10.5 12.9 10-49.9 7.1 3.8 6.8 6.7 5.9 50-99.9 0.8 0.4 0.5 0.3 0.5 100-499.9 0.7 0.1 0 0.4 0.3 >500 0.5 0.1 0.2 0 0.1
Total 100 100 100 100 100 Note: excluding parcels rented out during the season
Figure 2.5: Agricultural Households by Total Size by Season
642
11
679
990
374
172
3211
639681
988
377
172
310
200
400
600
800
1000
1200
<0.1 0.1-0.9 1.0-1.9 2-4.9 5-9.9 10-49.9 50+
Acres
No
of A
gric
HH
s ('0
00)
2nd season 2004 1st season 2005

16
2.7 Agricultural HHs by Geographical Location of Parcels
The table below gives the distribution of Ag HHs by geographical location of parcels
owned. About 70 percent of Ag HHs owned parcels within the EA. The Ag HHs that
had parcels outside the district accounted for only one per cent. Northern Region had
the highest percentage of Ag HHs that owned parcels outside the parish, and this can
be due to the re-location of people to the IDP camps.
Table 2.5: Percentage Distribution of Agricultural Households by geographical
location of the parcels owned
Region
Parcels inside
EA/LC1
Parcel within
Parish but outside EA
Parcel Outside
Parish but within S/Cty
Else where in district
Other districts Total
Central 53.8 10.6 2.5 1.5 1.4 100
Eastern 78.0 15.9 4.7 3.4 1.1 100
Northern 55.7 12.6 8.2 6.9 1.3 100
Western 86.5 17.9 4.2 2.6 0.7 100
Total 69.8 14.5 4.8 3.4 1.1 100
2.8 Parcels operated by Ag HHs
2.8.1 Owned Within the EA/LC1 Table 2.6 below gives the distribution of Ag HHs by number of parcels owned within
EA/LCI. The majority of the Ag HHs 57.4 owned one parcel. The Ag HHs who owned
six and above parcels were about one percent
Table 2.6: Percentage of Agricultural Households by parcels owned within the
EA/LC1 Parcels
Region 1 2 3 4 5 6 7 8 + Total
Central 67.92 21.25 7.69 1.70 0.73 0.43 0.06 0.22 100
Eastern 58.46 26.86 9.94 2.98 1.42 0.16 0.00 0.18 100
Northern 44.73 27.39 15.24 8.71 3.00 0.45 0.35 0.13 100
Western 56.85 24.66 10.46 3.45 2.48 1.01 0.47 0.63 100
Total 57.40 25.12 10.58 3.8 1.92 0.56 0.23 0.34 100
2.8.2 Parcels Owned Elsewhere
At the national level, about 50 per cent of the Ag HHs owned one parcel. Indeed
about 90 per cent of the Ag HHs owned three or less parcels. The highest percentage
of Ag HHs with one parcel is in the Central Region (61%). The Eastern and Western
70% of parcels owned within EA
50% of Agric HHs own one parcel
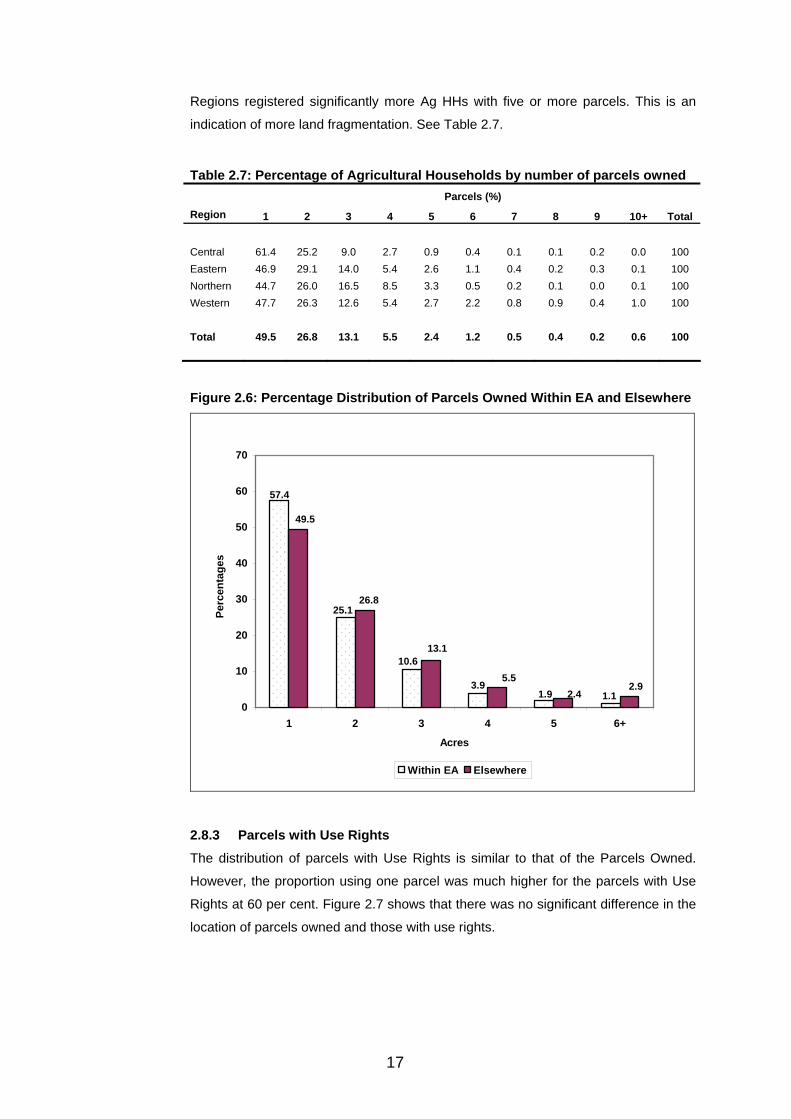
17
Regions registered significantly more Ag HHs with five or more parcels. This is an
indication of more land fragmentation. See Table 2.7.
Table 2.7: Percentage of Agricultural Households by number of parcels owned
Parcels (%) Region 1 2 3 4 5 6 7 8 9 10+ Total Central 61.4 25.2 9.0 2.7 0.9 0.4 0.1 0.1 0.2 0.0 100 Eastern 46.9 29.1 14.0 5.4 2.6 1.1 0.4 0.2 0.3 0.1 100 Northern 44.7 26.0 16.5 8.5 3.3 0.5 0.2 0.1 0.0 0.1 100 Western 47.7 26.3 12.6 5.4 2.7 2.2 0.8 0.9 0.4 1.0 100 Total 49.5 26.8 13.1 5.5 2.4 1.2 0.5 0.4 0.2 0.6 100
Figure 2.6: Percentage Distribution of Parcels Owned Within EA and Elsewhere
25.1
57.4
10.6
3.91.9 1.1
49.5
26.8
13.1
5.52.4
2.9
0
10
20
30
40
50
60
70
1 2 3 4 5 6+
Acres
Perc
enta
ges
Within EA Elsewhere
2.8.3 Parcels with Use Rights The distribution of parcels with Use Rights is similar to that of the Parcels Owned.
However, the proportion using one parcel was much higher for the parcels with Use
Rights at 60 per cent. Figure 2.7 shows that there was no significant difference in the
location of parcels owned and those with use rights.
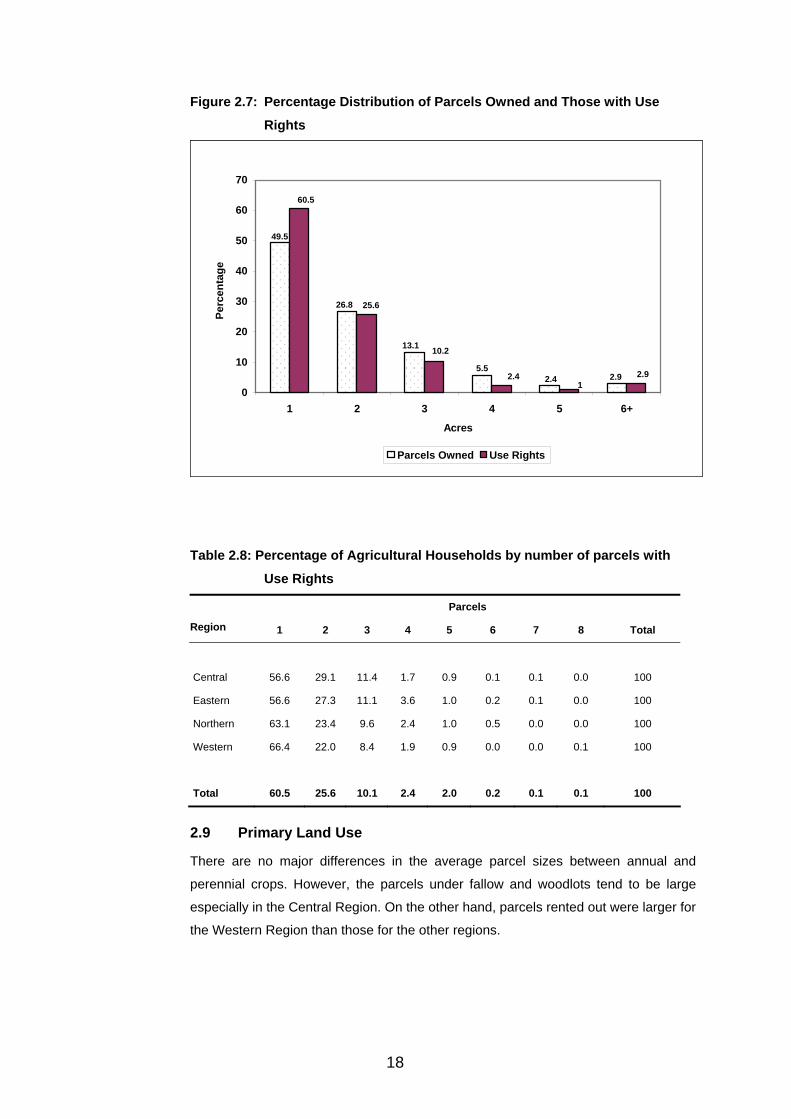
18
Figure 2.7: Percentage Distribution of Parcels Owned and Those with Use
Rights
26.8
49.5
13.1
5.52.4 2.9
60.5
25.6
10.2
2.41
2.9
0
10
20
30
40
50
60
70
1 2 3 4 5 6+
Acres
Perc
enta
ge
Parcels Owned Use Rights
Table 2.8: Percentage of Agricultural Households by number of parcels with
Use Rights
Parcels
Region 1 2 3 4 5 6 7 8 Total
Central 56.6 29.1 11.4 1.7 0.9 0.1 0.1 0.0 100
Eastern 56.6 27.3 11.1 3.6 1.0 0.2 0.1 0.0 100
Northern 63.1 23.4 9.6 2.4 1.0 0.5 0.0 0.0 100
Western 66.4 22.0 8.4 1.9 0.9 0.0 0.0 0.1 100
Total 60.5 25.6 10.1 2.4 2.0 0.2 0.1 0.1 100
2.9 Primary Land Use
There are no major differences in the average parcel sizes between annual and
perennial crops. However, the parcels under fallow and woodlots tend to be large
especially in the Central Region. On the other hand, parcels rented out were larger for
the Western Region than those for the other regions.
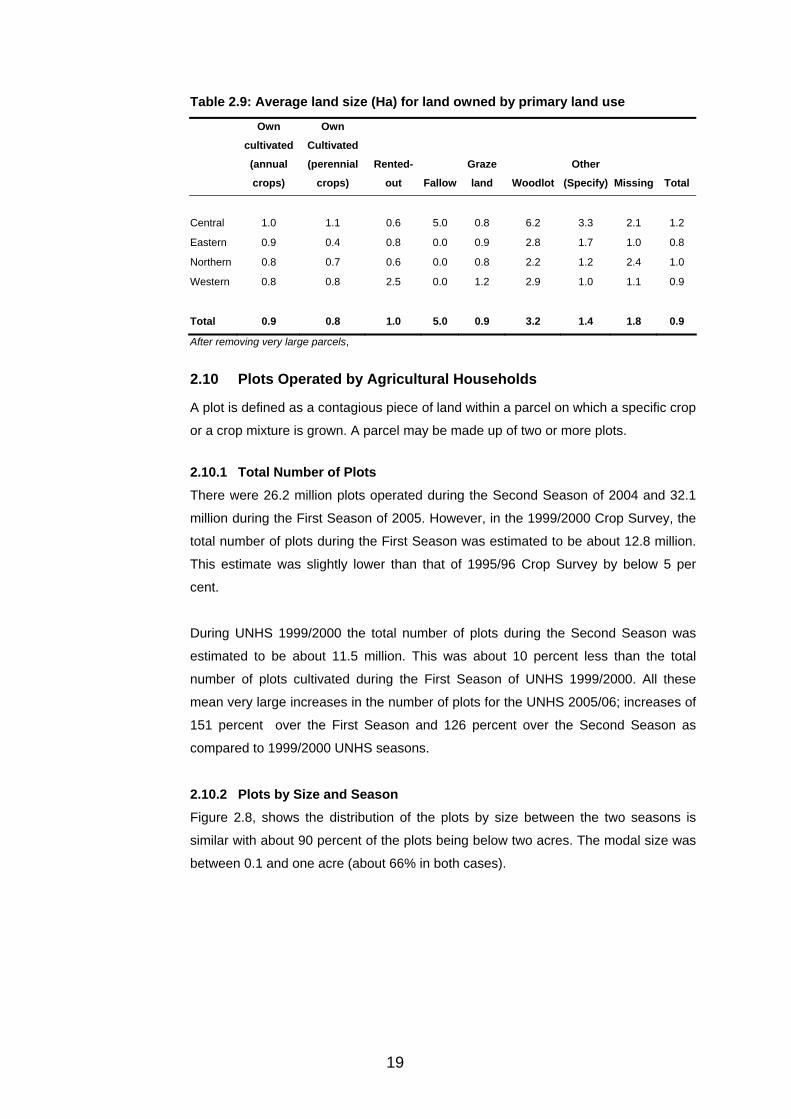
19
Table 2.9: Average land size (Ha) for land owned by primary land use
Own
cultivated
(annual
crops)
Own
Cultivated
(perennial
crops)
Rented-
out Fallow
Graze
land Woodlot
Other
(Specify) Missing Total
Central 1.0 1.1 0.6 5.0 0.8 6.2 3.3 2.1 1.2
Eastern 0.9 0.4 0.8 0.0 0.9 2.8 1.7 1.0 0.8
Northern 0.8 0.7 0.6 0.0 0.8 2.2 1.2 2.4 1.0
Western 0.8 0.8 2.5 0.0 1.2 2.9 1.0 1.1 0.9
Total 0.9 0.8 1.0 5.0 0.9 3.2 1.4 1.8 0.9
After removing very large parcels,
2.10 Plots Operated by Agricultural Households
A plot is defined as a contagious piece of land within a parcel on which a specific crop
or a crop mixture is grown. A parcel may be made up of two or more plots.
2.10.1 Total Number of Plots There were 26.2 million plots operated during the Second Season of 2004 and 32.1
million during the First Season of 2005. However, in the 1999/2000 Crop Survey, the
total number of plots during the First Season was estimated to be about 12.8 million.
This estimate was slightly lower than that of 1995/96 Crop Survey by below 5 per
cent.
During UNHS 1999/2000 the total number of plots during the Second Season was
estimated to be about 11.5 million. This was about 10 percent less than the total
number of plots cultivated during the First Season of UNHS 1999/2000. All these
mean very large increases in the number of plots for the UNHS 2005/06; increases of
151 percent over the First Season and 126 percent over the Second Season as
compared to 1999/2000 UNHS seasons.
2.10.2 Plots by Size and Season Figure 2.8, shows the distribution of the plots by size between the two seasons is
similar with about 90 percent of the plots being below two acres. The modal size was
between 0.1 and one acre (about 66% in both cases).

20
Figure 2.8: Percentage Distribution of Plots by Plot size and Season
66.4
2.2
21.1
8.6
1.0 0.52.6
66.7
18.7
7.2
0.84.2
0
10
20
30
40
50
60
70
80
<.0.1 0.1-0.9 1.0-1.9 2-4.9 5-9.9 10+
Acres
Perc
enta
ge
2nd Season 2004 1st Season 2005
2.11 Summary of Findings
The number of Ag HHs was estimated to be 4.2 million or 78.8 per cent of the
households. This was an increase of 26 percent from the UNHS 1999/2000.
About 79 per cent of the Ag HHs owned land with 53 per cent also operating land
under use rights. The results from the Second Season of 2004 show that the average
holding size by region was similar to that for the First Season of 2005. This is
expected because data on holding characteristics does not change quickly. The
national average agricultural household land under Use Rights was 0.4 Ha which
compares to 0.92 Ha national average agricultural household land owned.
The average size of the agricultural holding is the 0.9 Ha owned plus the 0.4 Ha
under use rights, making a total of 1.3 Ha. However, all the earlier surveys did not
specifically ask about the land under use rights. So one assumes respondents were
only giving land owned during these earlier surveys.
The proportion of agricultural holdings below two hectares was about 80 per cent.
About 70 per cent of the parcels were within the EA and the parcels outside the
district accounted for only one percent.
At the national level, about 50 per cent of the Ag HHs owned one parcel and about 90
percent of the Ag HHs owned three or less parcels. The distribution of parcels used is
similar to that of the parcels owned. Further, there were no significant differences in
21
the average parcel sizes between annual and perennial crops. However, the parcels
rented out, fallow and woodlots tended to be larger especially in the Central Region.
There were 26.2 million plots operated during the Second Season of 2004 and 32.1
million during the First Season of 2005.
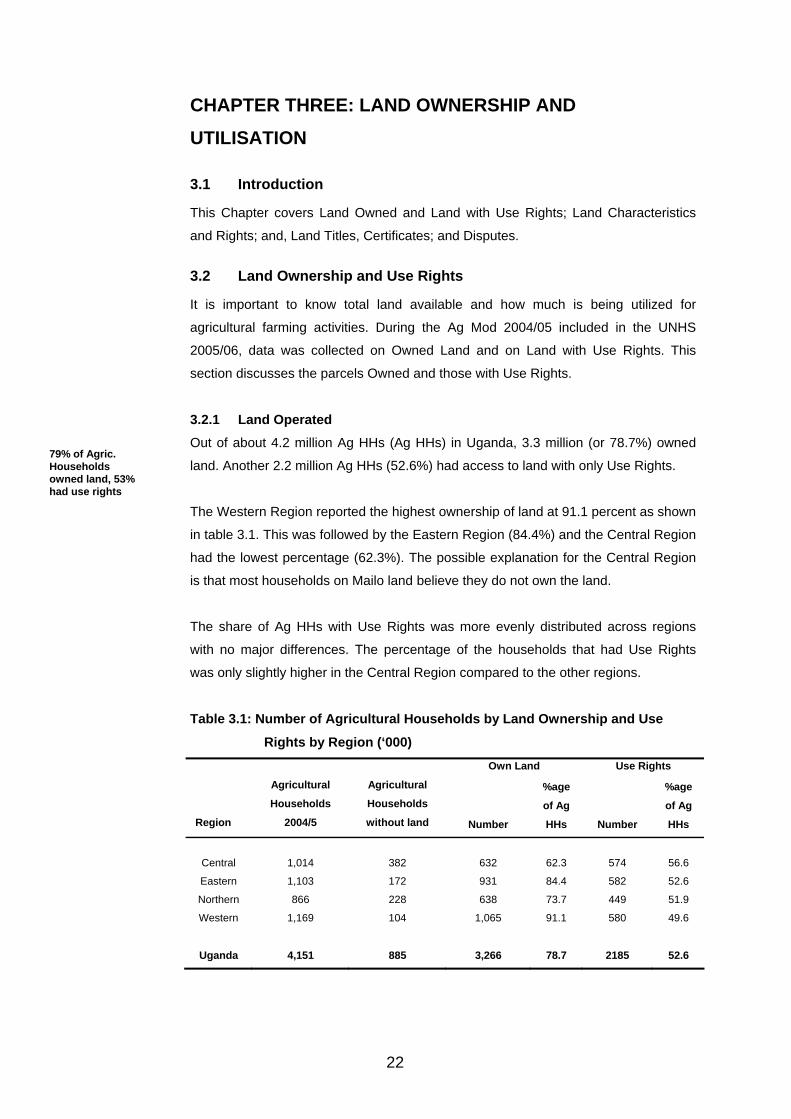
22
CHAPTER THREE: LAND OWNERSHIP AND
UTILISATION
3.1 Introduction
This Chapter covers Land Owned and Land with Use Rights; Land Characteristics
and Rights; and, Land Titles, Certificates; and Disputes.
3.2 Land Ownership and Use Rights
It is important to know total land available and how much is being utilized for
agricultural farming activities. During the Ag Mod 2004/05 included in the UNHS
2005/06, data was collected on Owned Land and on Land with Use Rights. This
section discusses the parcels Owned and those with Use Rights.
3.2.1 Land Operated Out of about 4.2 million Ag HHs (Ag HHs) in Uganda, 3.3 million (or 78.7%) owned
land. Another 2.2 million Ag HHs (52.6%) had access to land with only Use Rights.
The Western Region reported the highest ownership of land at 91.1 percent as shown
in table 3.1. This was followed by the Eastern Region (84.4%) and the Central Region
had the lowest percentage (62.3%). The possible explanation for the Central Region
is that most households on Mailo land believe they do not own the land.
The share of Ag HHs with Use Rights was more evenly distributed across regions
with no major differences. The percentage of the households that had Use Rights
was only slightly higher in the Central Region compared to the other regions.
Table 3.1: Number of Agricultural Households by Land Ownership and Use
Rights by Region (‘000) Own Land Use Rights
Region
Agricultural
Households
2004/5
Agricultural
Households
without land Number
%age
of Ag
HHs Number
%age
of Ag
HHs
Central 1,014 382 632 62.3 574 56.6
Eastern 1,103 172 931 84.4 582 52.6
Northern 866 228 638 73.7 449 51.9
Western 1,169 104 1,065 91.1 580 49.6
Uganda 4,151 885 3,266 78.7 2185 52.6
79% of Agric. Households owned land, 53% had use rights

23
3.2.2 Number of Agricultural Parcels Owned A total of about 6.4 million parcels of land were estimated to be owned as shown in
Table 3.2. The Central Region had the smallest number (1.0 Million) while the
Western Region had the biggest number totaling to 2.3 Million.
When these results are compared with those of UNHS 1999/2000, at the national
level, there was a significant increase in the number of parcels owned from about 4.8
million to about 6.4 million. This could be as a result of a number of factors; one
being that people have recognized the importance of owning land and have therefore
been able to buy the land that they could have been operating under other
arrangements and others have even moved a step further and obtained land titles.
Another factor could be land fragmentation caused by increased population pressure
on the land.
There was a significant increase in the number of parcels owned for all the regions
except the Central Region. In the Central Region the number of parcels owned
declined probably due to urbanization or the fact that landlords have made people
more aware that they do not own what they previously thought they owned.
Table 3.2: Parcels of Land Owned by Region (‘000)
Region 1999/2000 % 2005/2006 %
Central 1,093 22.7 1,008 15.7
Eastern 1,279 26.5 1,823 28.4
Northern 923 19.1 1,304 20.3
Western 1,530 31.7 2,281 35.6
Uganda 4,825 100 6,416 100
3.2.3 Ownership of Parcels by Sex of Ag HH head As tables 3.3 and 3.4 show, the parcels owned by male- headed households are
almost 5.0 million (77.4%). The Central Region had the highest proportion (26.8%) of
the parcels owned by female headed households
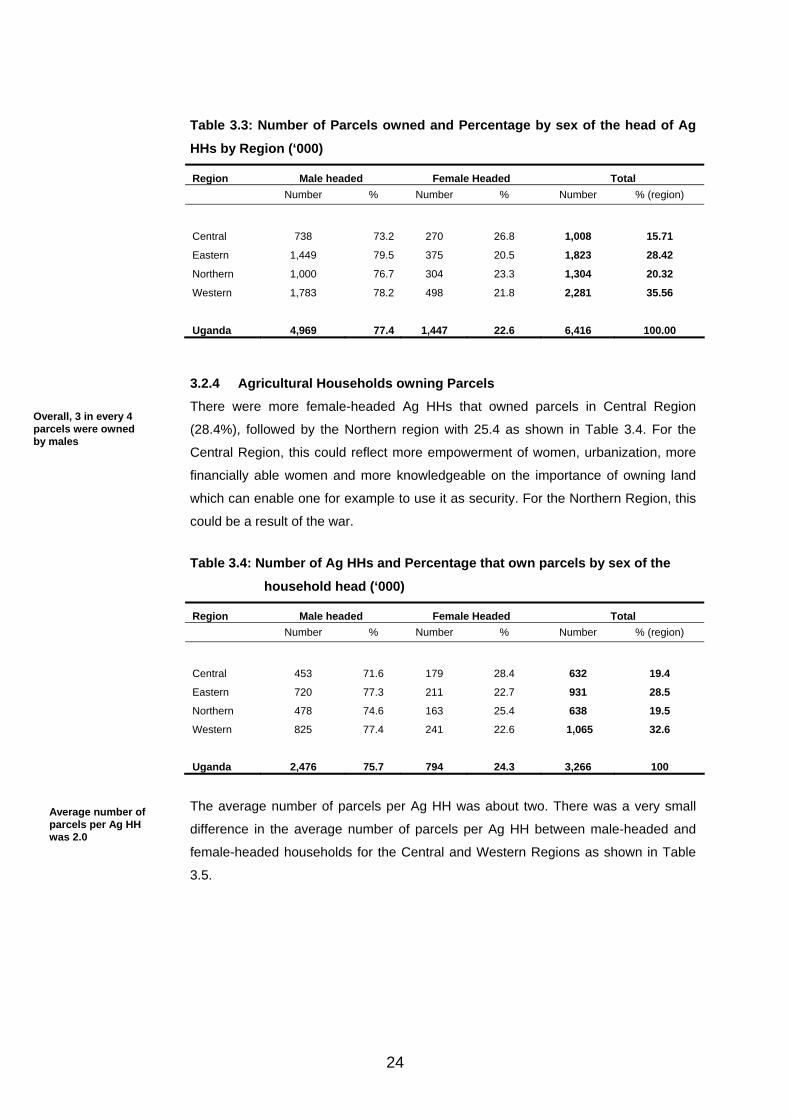
24
Table 3.3: Number of Parcels owned and Percentage by sex of the head of Ag
HHs by Region (‘000)
Region Male headed Female Headed Total
Number % Number % Number % (region)
Central 738 73.2 270 26.8 1,008 15.71
Eastern 1,449 79.5 375 20.5 1,823 28.42
Northern 1,000 76.7 304 23.3 1,304 20.32
Western 1,783 78.2 498 21.8 2,281 35.56
Uganda 4,969 77.4 1,447 22.6 6,416 100.00
3.2.4 Agricultural Households owning Parcels There were more female-headed Ag HHs that owned parcels in Central Region
(28.4%), followed by the Northern region with 25.4 as shown in Table 3.4. For the
Central Region, this could reflect more empowerment of women, urbanization, more
financially able women and more knowledgeable on the importance of owning land
which can enable one for example to use it as security. For the Northern Region, this
could be a result of the war.
Table 3.4: Number of Ag HHs and Percentage that own parcels by sex of the
household head (‘000)
Region Male headed Female Headed Total
Number % Number % Number % (region)
Central 453 71.6 179 28.4 632 19.4
Eastern 720 77.3 211 22.7 931 28.5
Northern 478 74.6 163 25.4 638 19.5
Western 825 77.4 241 22.6 1,065 32.6
Uganda 2,476 75.7 794 24.3 3,266 100 The average number of parcels per Ag HH was about two. There was a very small
difference in the average number of parcels per Ag HH between male-headed and
female-headed households for the Central and Western Regions as shown in Table
3.5.
Average number of parcels per Ag HH was 2.0
Overall, 3 in every 4 parcels were owned by males
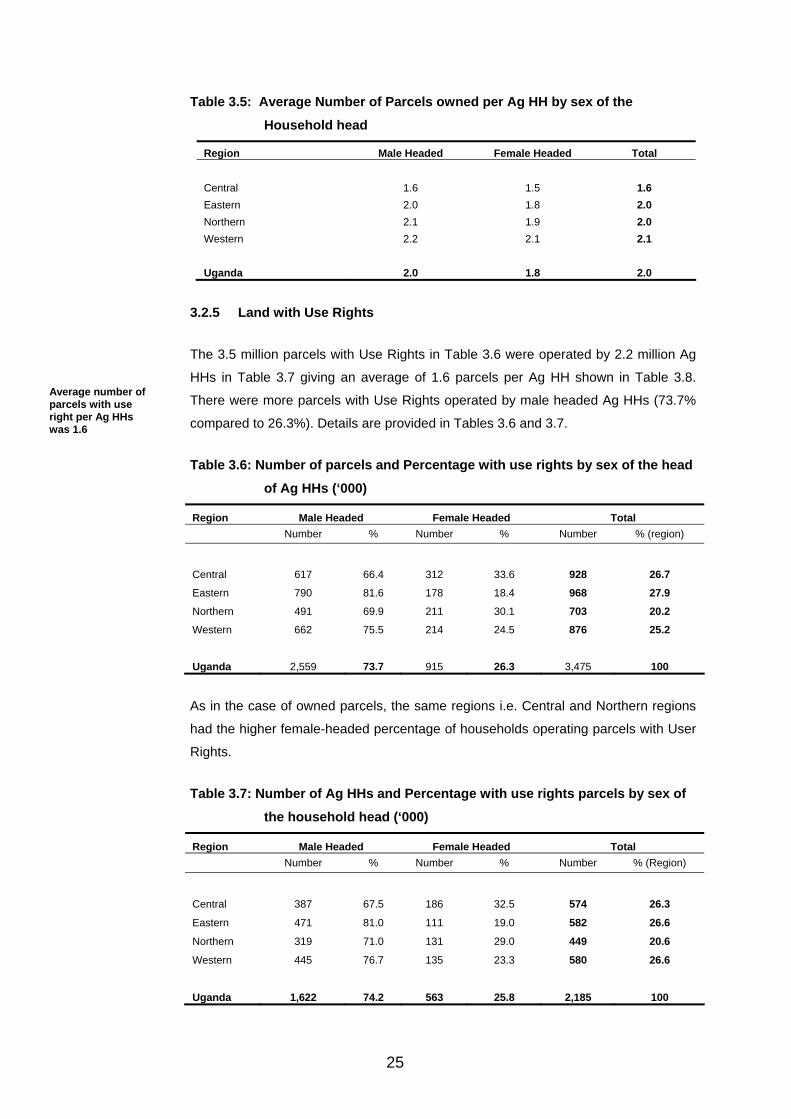
25
Table 3.5: Average Number of Parcels owned per Ag HH by sex of the
Household head
Region Male Headed Female Headed Total Central 1.6 1.5 1.6 Eastern 2.0 1.8 2.0 Northern 2.1 1.9 2.0 Western 2.2 2.1 2.1 Uganda 2.0 1.8 2.0
3.2.5 Land with Use Rights
The 3.5 million parcels with Use Rights in Table 3.6 were operated by 2.2 million Ag
HHs in Table 3.7 giving an average of 1.6 parcels per Ag HH shown in Table 3.8.
There were more parcels with Use Rights operated by male headed Ag HHs (73.7%
compared to 26.3%). Details are provided in Tables 3.6 and 3.7.
Table 3.6: Number of parcels and Percentage with use rights by sex of the head
of Ag HHs (‘000)
Region Male Headed Female Headed Total
Number % Number % Number % (region)
Central 617 66.4 312 33.6 928 26.7 Eastern 790 81.6 178 18.4 968 27.9 Northern 491 69.9 211 30.1 703 20.2 Western 662 75.5 214 24.5 876 25.2 Uganda 2,559 73.7 915 26.3 3,475 100 As in the case of owned parcels, the same regions i.e. Central and Northern regions
had the higher female-headed percentage of households operating parcels with User
Rights.
Table 3.7: Number of Ag HHs and Percentage with use rights parcels by sex of
the household head (‘000)
Region Male Headed Female Headed Total
Number % Number % Number % (Region)
Central 387 67.5 186 32.5 574 26.3
Eastern 471 81.0 111 19.0 582 26.6
Northern 319 71.0 131 29.0 449 20.6
Western 445 76.7 135 23.3 580 26.6
Uganda 1,622 74.2 563 25.8 2,185 100
Average number of parcels with use right per Ag HHs was 1.6
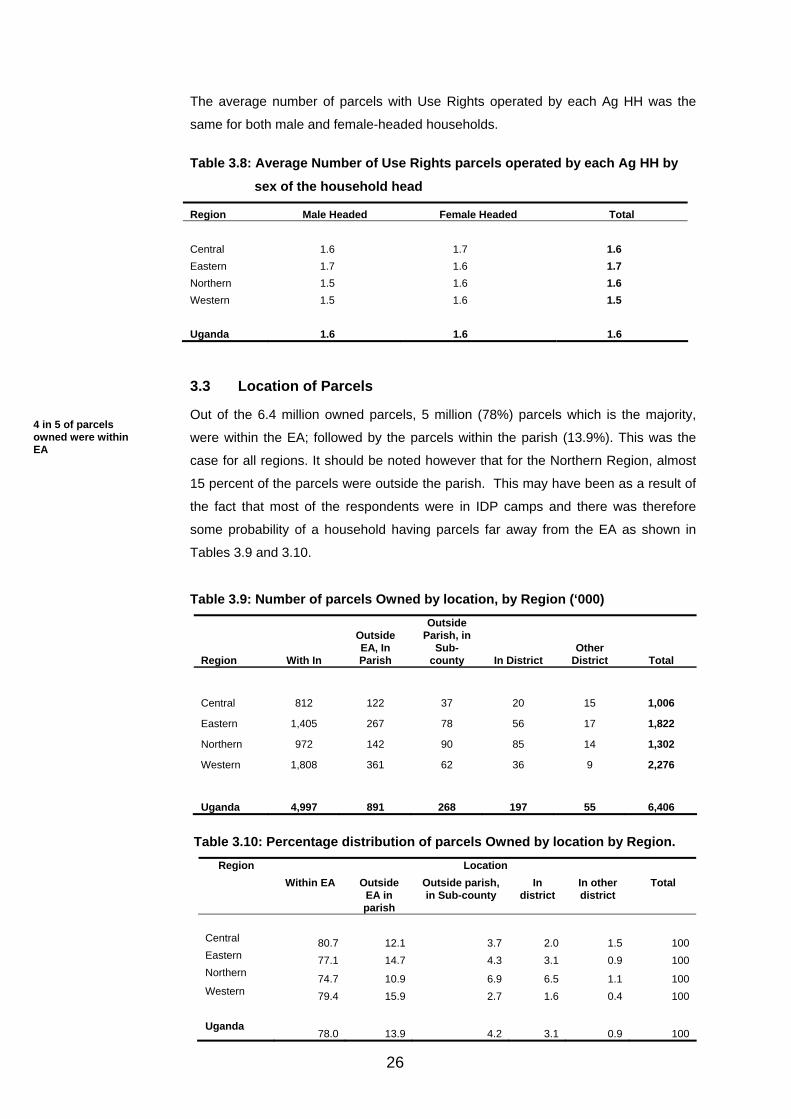
26
The average number of parcels with Use Rights operated by each Ag HH was the
same for both male and female-headed households.
Table 3.8: Average Number of Use Rights parcels operated by each Ag HH by
sex of the household head
Region Male Headed Female Headed Total Central 1.6 1.7 1.6 Eastern 1.7 1.6 1.7 Northern 1.5 1.6 1.6 Western 1.5 1.6 1.5 Uganda 1.6 1.6 1.6
3.3 Location of Parcels
Out of the 6.4 million owned parcels, 5 million (78%) parcels which is the majority,
were within the EA; followed by the parcels within the parish (13.9%). This was the
case for all regions. It should be noted however that for the Northern Region, almost
15 percent of the parcels were outside the parish. This may have been as a result of
the fact that most of the respondents were in IDP camps and there was therefore
some probability of a household having parcels far away from the EA as shown in
Tables 3.9 and 3.10.
Table 3.9: Number of parcels Owned by location, by Region (‘000)
Region With In
Outside EA, In Parish
Outside Parish, in
Sub-county In District
Other District Total
Central 812 122 37 20 15 1,006
Eastern 1,405 267 78 56 17 1,822
Northern 972 142 90 85 14 1,302
Western 1,808 361 62 36 9 2,276
Uganda 4,997 891 268 197 55 6,406
Table 3.10: Percentage distribution of parcels Owned by location by Region.
Location Region Within EA Outside
EA in parish
Outside parish, in Sub-county
In district
In other district
Total
Central 80.7 12.1 3.7 2.0 1.5 100 Eastern 77.1 14.7 4.3 3.1 0.9 100 Northern 74.7 10.9 6.9 6.5 1.1 100 Western 79.4 15.9 2.7 1.6 0.4 100 Uganda
78.0 13.9 4.2 3.1 0.9 100
4 in 5 of parcels owned were within EA

27
For the parcels with Use Rights, about 2 million (56.9%) out of 3.5 million were within
the EA. In the case of parcels outside the EA but in the same parish, the percentages
were significantly higher for parcels where the Ag HH just have Use Right (30.5%)
compared to 13.9% for the parcels owned. This pattern is similar at the regional
level. See Tables 3.11 – 3.12.
Table 3.11: Number of parcels with Use Rights by location by Region (‘000).
Location Region
Within EA Outside EA in parish
Outside parish, in Sub-county
In district
In other district
Total
Central 670 204 33 15 7 928
Eastern 556 280 76 44 10 968 Northern 283 261 108 40 9 703 Western
463 312 58 26 14 876 Uganda
1,972 1,058 274 124 40 3,475
Table 3.12: Percentage distribution of parcels with Use Rights by location by
Region. Location Region
Within EA Outside EA in parish
Outside parish, in Sub-county
In district
In other district
Total
Central 72.2 22.0 3.6 1.6 0.8 100
Eastern 57.6 29.0 7.9 4.6 1.0 100
Northern 40.3 37.2 15.4 5.7 1.3 100
Western 53.0 35.7 6.6 3.0 1.6 100
Uganda 56.9 30.5 7.9 3.6 1.2 100
The percentage of parcels within the EA was significantly higher for the parcels that
were owned (78%) compared to the parcels with Use Rights (56.9%)
About 57% parcels with Use Right were within EA
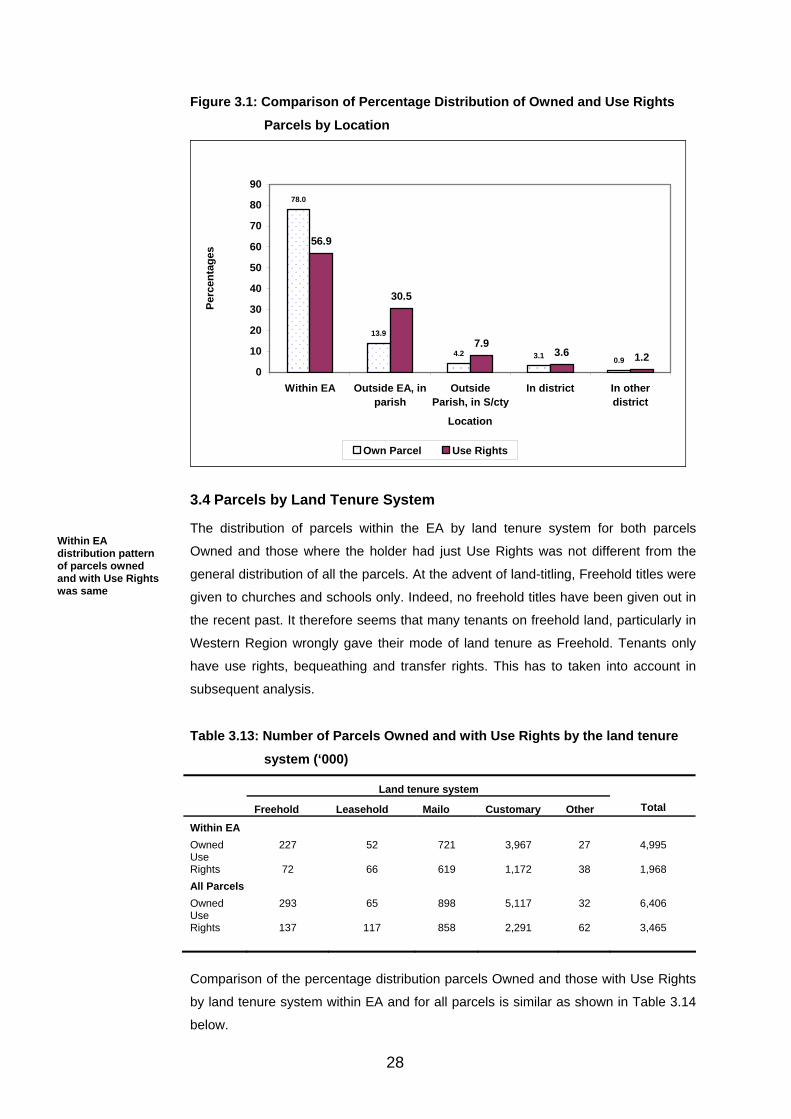
28
Figure 3.1: Comparison of Percentage Distribution of Owned and Use Rights
Parcels by Location
78.0
13.9
4.2 3.1 0.9
56.9
30.5
7.93.6 1.2
0
10
20
30
40
50
60
70
80
90
Within EA Outside EA, inparish
OutsideParish, in S/cty
In district In otherdistrict
Location
Perc
enta
ges
Own Parcel Use Rights
3.4 Parcels by Land Tenure System
The distribution of parcels within the EA by land tenure system for both parcels
Owned and those where the holder had just Use Rights was not different from the
general distribution of all the parcels. At the advent of land-titling, Freehold titles were
given to churches and schools only. Indeed, no freehold titles have been given out in
the recent past. It therefore seems that many tenants on freehold land, particularly in
Western Region wrongly gave their mode of land tenure as Freehold. Tenants only
have use rights, bequeathing and transfer rights. This has to taken into account in
subsequent analysis.
Table 3.13: Number of Parcels Owned and with Use Rights by the land tenure
system (‘000)
Land tenure system
Freehold Leasehold Mailo Customary Other Total
Within EA Owned 227 52 721 3,967 27 4,995 Use Rights 72 66 619 1,172 38 1,968 All Parcels Owned 293 65 898 5,117 32 6,406 Use Rights 137 117 858 2,291 62 3,465
Comparison of the percentage distribution parcels Owned and those with Use Rights
by land tenure system within EA and for all parcels is similar as shown in Table 3.14
below.
Within EA distribution pattern of parcels owned and with Use Rights was same
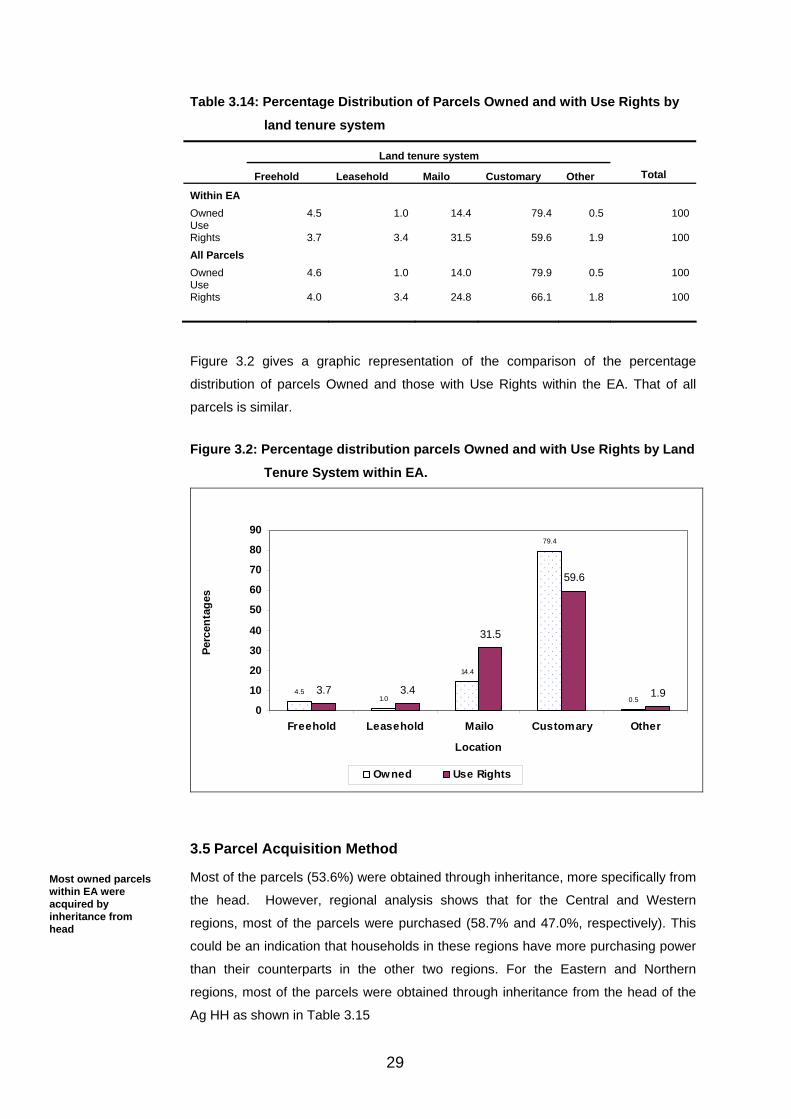
29
Table 3.14: Percentage Distribution of Parcels Owned and with Use Rights by
land tenure system
Land tenure system
Freehold Leasehold Mailo Customary Other Total
Within EA Owned 4.5 1.0 14.4 79.4 0.5 100 Use Rights 3.7 3.4 31.5 59.6 1.9 100 All Parcels Owned 4.6 1.0 14.0 79.9 0.5 100 Use Rights 4.0 3.4 24.8 66.1 1.8 100
Figure 3.2 gives a graphic representation of the comparison of the percentage
distribution of parcels Owned and those with Use Rights within the EA. That of all
parcels is similar.
Figure 3.2: Percentage distribution parcels Owned and with Use Rights by Land
Tenure System within EA.
4.51.0
14.4
79.4
0.53.7 3.4
31.5
59.6
1.90
10
20
30
40
50
60
70
80
90
Freehold Leasehold Mailo Customary Other
Location
Perc
enta
ges
Owned Use Rights
3.5 Parcel Acquisition Method
Most of the parcels (53.6%) were obtained through inheritance, more specifically from
the head. However, regional analysis shows that for the Central and Western
regions, most of the parcels were purchased (58.7% and 47.0%, respectively). This
could be an indication that households in these regions have more purchasing power
than their counterparts in the other two regions. For the Eastern and Northern
regions, most of the parcels were obtained through inheritance from the head of the
Ag HH as shown in Table 3.15
Most owned parcels within EA were acquired by inheritance from head

30
Table 3.15: Distribution of Parcels Owned within EA by Method of Acquisition
by Region (‘000)
Region Purchased Inherited From Head
Inherited From Spouse Cleared Other Total
% % % % % %
Central 58.7 37.2 2.8 0.3 1.0 100
Eastern 38.9 56.2 4.2 0.6 0.1 100
Northern 6.4 78.6 12.3 2.4 0.5 100
Western 47.0 45.6 3.8 2.8 0.8 100
Total 38.7 53.6 5.4 1.7 0.6 100
The parcels where the holder just has Use Rights, most of the parcels were acquired
by merely clearing the land (58.5%) and this is very common in the Eastern, Northern
and Western regions where most of the parcels were under a customary
arrangement. This was followed by acquiring parcels through “other” means (22.8%)
and then those acquired through inheritance from the head’s family (11.6%) as shown
in Table 3.16.
Table 3.16: Distribution of Parcels with Use Rights within EA by Method of
Acquisition by Region (‘000).
Region
Purchased Inherited from
head’s family
Inherited from
spouse’s family
Cleared Other
Total
No: % No: % No % No: % No % No: %
Central 103 15.6 138 20.9 13 2.0 234 35.5 172 26.1 659 100
Eastern - - 38 7.1 3 0.6 401 74.5 96 17.8 538 100
Northern 2 0.7 33 11.8 13 4.7 181 64.9 50 17.9 279 100
Western 5 1.1 16 3.5 0 0.0 316 69.0 121 26.4 458 100
Total 110 5.7 224 11.6 29 1.5 1,131 58.5 440 22.8 1934 100
Figure 3.3 clearly demonstrates the differences in the methods of acquisition between
owned parcels and those with Use Rights, the former are mainly inherited (53.6%),
purchased (38.7%) while the latter, land is mainly cleared (58.5%)
Most owned parcels within EA were inherited from Head’s family
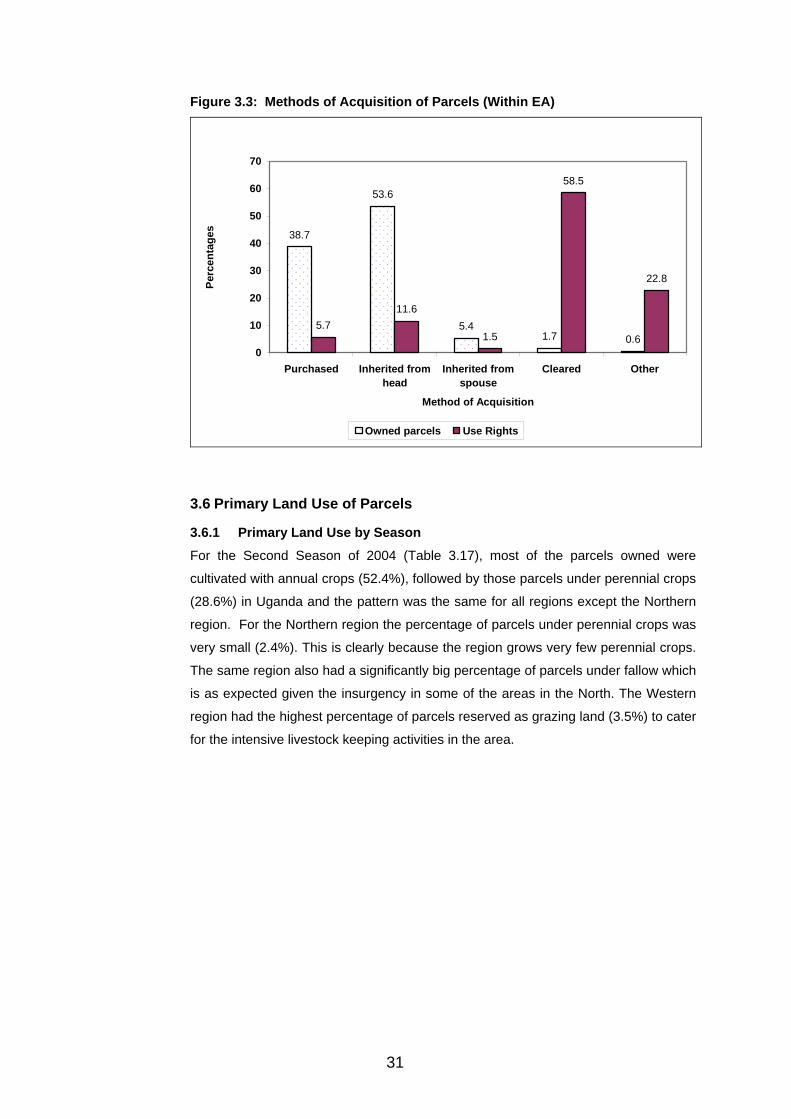
31
Figure 3.3: Methods of Acquisition of Parcels (Within EA)
38.7
53.6
5.41.7 0.6
5.711.6
1.5
58.5
22.8
0
10
20
30
40
50
60
70
Purchased Inherited fromhead
Inherited fromspouse
Cleared Other
Method of Acquisition
Perc
enta
ges
Owned parcels Use Rights
3.6 Primary Land Use of Parcels
3.6.1 Primary Land Use by Season For the Second Season of 2004 (Table 3.17), most of the parcels owned were
cultivated with annual crops (52.4%), followed by those parcels under perennial crops
(28.6%) in Uganda and the pattern was the same for all regions except the Northern
region. For the Northern region the percentage of parcels under perennial crops was
very small (2.4%). This is clearly because the region grows very few perennial crops.
The same region also had a significantly big percentage of parcels under fallow which
is as expected given the insurgency in some of the areas in the North. The Western
region had the highest percentage of parcels reserved as grazing land (3.5%) to cater
for the intensive livestock keeping activities in the area.
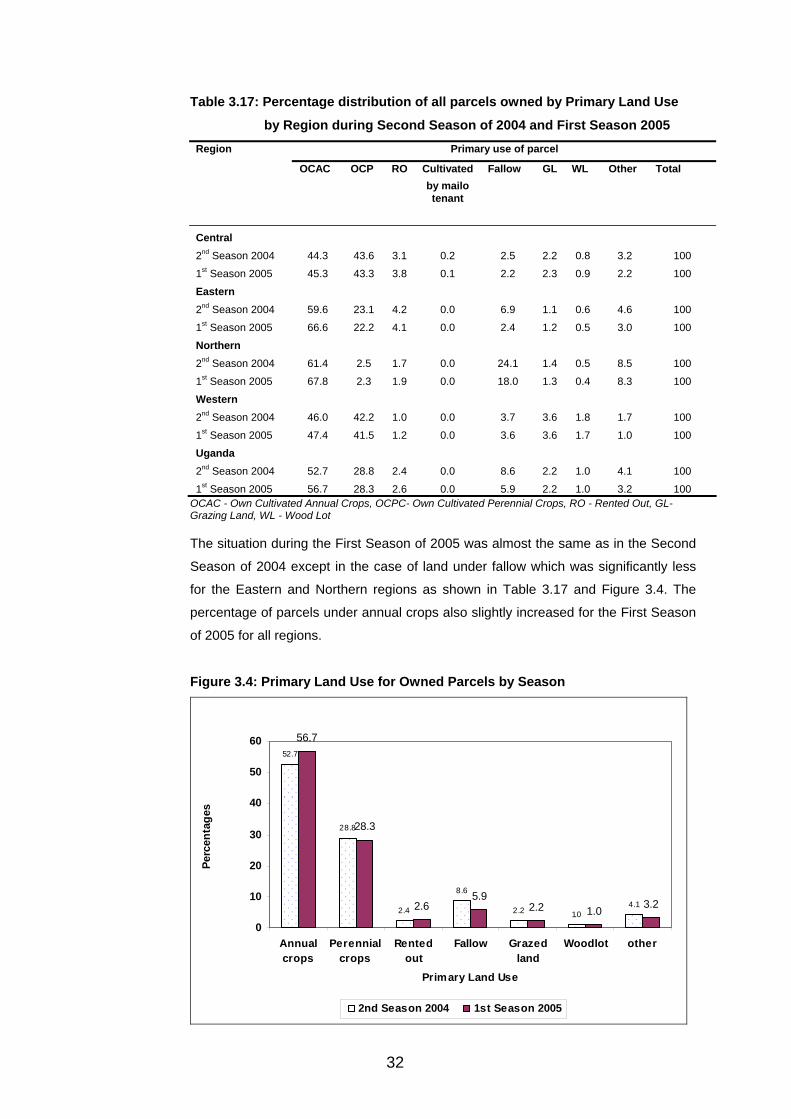
32
Table 3.17: Percentage distribution of all parcels owned by Primary Land Use
by Region during Second Season of 2004 and First Season 2005 Primary use of parcel
Cultivated
Region
OCAC OCP RO by mailo tenant
Fallow GL WL Other Total
Central
2nd Season 2004 44.3 43.6 3.1 0.2 2.5 2.2 0.8 3.2 100
1st Season 2005 45.3 43.3 3.8 0.1 2.2 2.3 0.9 2.2 100
Eastern
2nd Season 2004 59.6 23.1 4.2 0.0 6.9 1.1 0.6 4.6 100
1st Season 2005 66.6 22.2 4.1 0.0 2.4 1.2 0.5 3.0 100
Northern
2nd Season 2004 61.4 2.5 1.7 0.0 24.1 1.4 0.5 8.5 100
1st Season 2005 67.8 2.3 1.9 0.0 18.0 1.3 0.4 8.3 100
Western
2nd Season 2004 46.0 42.2 1.0 0.0 3.7 3.6 1.8 1.7 100
1st Season 2005 47.4 41.5 1.2 0.0 3.6 3.6 1.7 1.0 100
Uganda
2nd Season 2004 52.7 28.8 2.4 0.0 8.6 2.2 1.0 4.1 100
1st Season 2005 56.7 28.3 2.6 0.0 5.9 2.2 1.0 3.2 100 OCAC - Own Cultivated Annual Crops, OCPC- Own Cultivated Perennial Crops, RO - Rented Out, GL- Grazing Land, WL - Wood Lot
The situation during the First Season of 2005 was almost the same as in the Second
Season of 2004 except in the case of land under fallow which was significantly less
for the Eastern and Northern regions as shown in Table 3.17 and Figure 3.4. The
percentage of parcels under annual crops also slightly increased for the First Season
of 2005 for all regions.
Figure 3.4: Primary Land Use for Owned Parcels by Season
52.7
28.8
2.4
8.6
2.2 1.04.1
56.7
28.3
2.65.9
2.2 1.0 3.2
0
10
20
30
40
50
60
Annualcrops
Perennialcrops
Rentedout
Fallow Grazedland
Woodlot other
Primary Land Use
Perc
enta
ges
2nd Season 2004 1st Season 2005
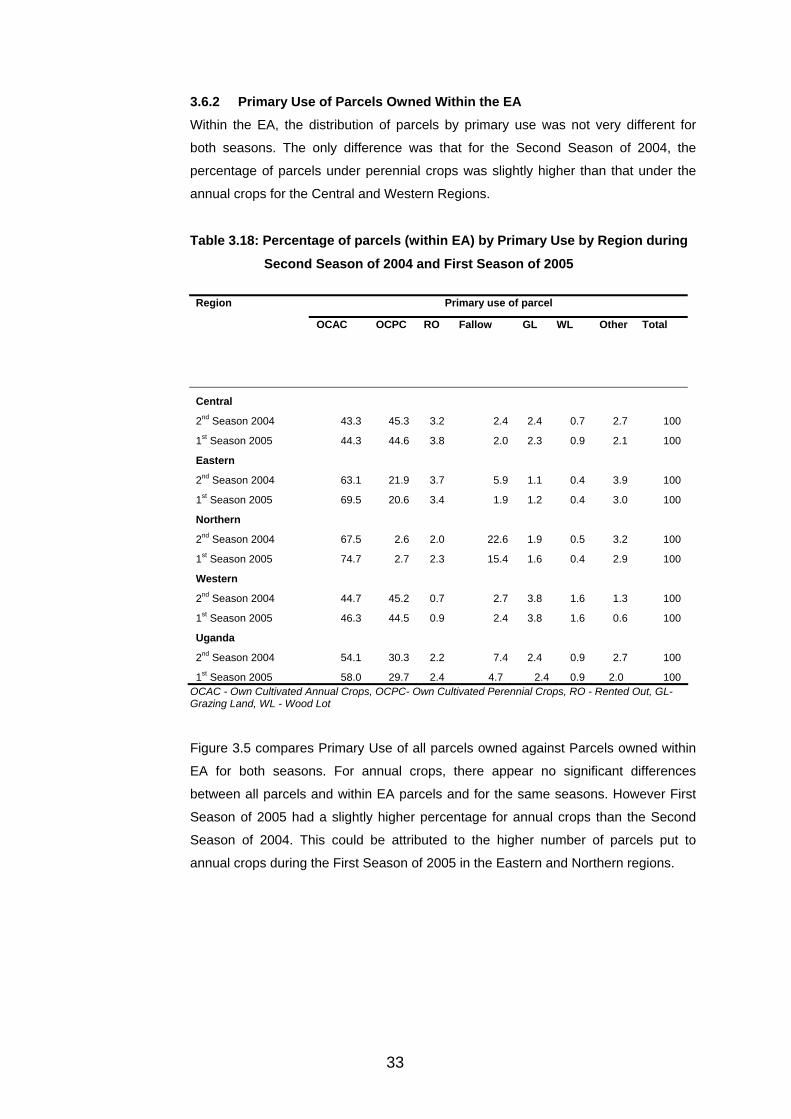
33
3.6.2 Primary Use of Parcels Owned Within the EA Within the EA, the distribution of parcels by primary use was not very different for
both seasons. The only difference was that for the Second Season of 2004, the
percentage of parcels under perennial crops was slightly higher than that under the
annual crops for the Central and Western Regions.
Table 3.18: Percentage of parcels (within EA) by Primary Use by Region during
Second Season of 2004 and First Season of 2005
Primary use of parcel Region
OCAC OCPC RO Fallow GL WL Other Total
Central
2nd Season 2004 43.3 45.3 3.2 2.4 2.4 0.7 2.7 100
1st Season 2005 44.3 44.6 3.8 2.0 2.3 0.9 2.1 100
Eastern
2nd Season 2004 63.1 21.9 3.7 5.9 1.1 0.4 3.9 100
1st Season 2005 69.5 20.6 3.4 1.9 1.2 0.4 3.0 100
Northern
2nd Season 2004 67.5 2.6 2.0 22.6 1.9 0.5 3.2 100
1st Season 2005 74.7 2.7 2.3 15.4 1.6 0.4 2.9 100
Western
2nd Season 2004 44.7 45.2 0.7 2.7 3.8 1.6 1.3 100
1st Season 2005 46.3 44.5 0.9 2.4 3.8 1.6 0.6 100
Uganda
2nd Season 2004 54.1 30.3 2.2 7.4 2.4 0.9 2.7 100
1st Season 2005 58.0 29.7 2.4 4.7 2.4 0.9 2.0 100 OCAC - Own Cultivated Annual Crops, OCPC- Own Cultivated Perennial Crops, RO - Rented Out, GL- Grazing Land, WL - Wood Lot
Figure 3.5 compares Primary Use of all parcels owned against Parcels owned within
EA for both seasons. For annual crops, there appear no significant differences
between all parcels and within EA parcels and for the same seasons. However First
Season of 2005 had a slightly higher percentage for annual crops than the Second
Season of 2004. This could be attributed to the higher number of parcels put to
annual crops during the First Season of 2005 in the Eastern and Northern regions.
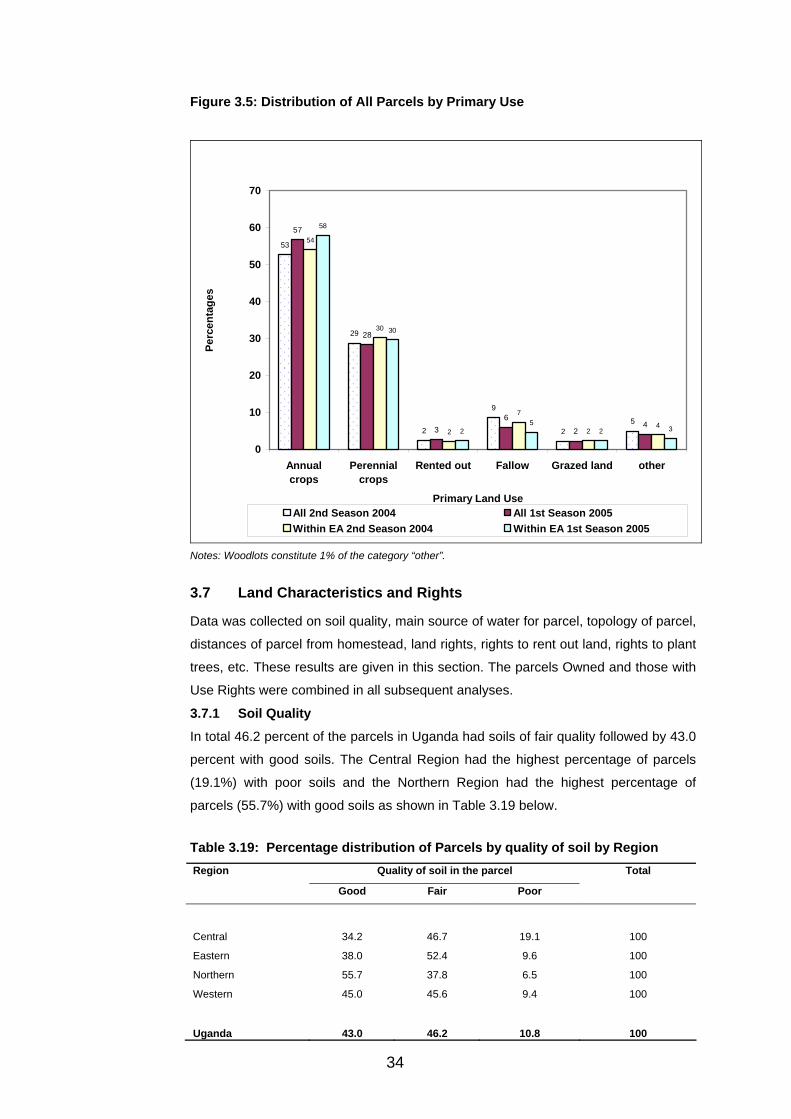
34
Figure 3.5: Distribution of All Parcels by Primary Use
53
29
2
9
25
57
28
36
24
54
30
2
7
24
58
30
25
2 3
0
10
20
30
40
50
60
70
Annualcrops
Perennialcrops
Rented out Fallow Grazed land other
Primary Land Use
Perc
enta
ges
All 2nd Season 2004 All 1st Season 2005Within EA 2nd Season 2004 Within EA 1st Season 2005
Notes: Woodlots constitute 1% of the category “other”.
3.7 Land Characteristics and Rights
Data was collected on soil quality, main source of water for parcel, topology of parcel,
distances of parcel from homestead, land rights, rights to rent out land, rights to plant
trees, etc. These results are given in this section. The parcels Owned and those with
Use Rights were combined in all subsequent analyses.
3.7.1 Soil Quality In total 46.2 percent of the parcels in Uganda had soils of fair quality followed by 43.0
percent with good soils. The Central Region had the highest percentage of parcels
(19.1%) with poor soils and the Northern Region had the highest percentage of
parcels (55.7%) with good soils as shown in Table 3.19 below.
Table 3.19: Percentage distribution of Parcels by quality of soil by Region
Quality of soil in the parcel Region
Good Fair Poor
Total
Central 34.2 46.7 19.1 100
Eastern 38.0 52.4 9.6 100
Northern 55.7 37.8 6.5 100
Western 45.0 45.6 9.4 100
Uganda 43.0 46.2 10.8 100
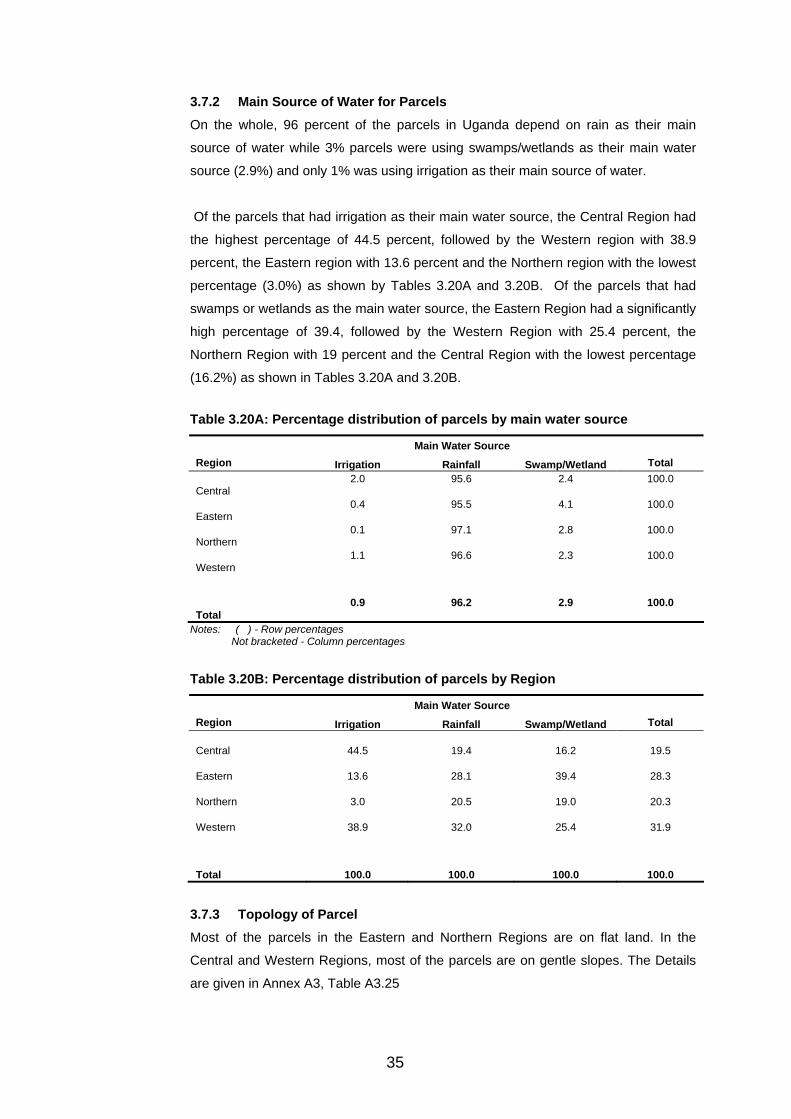
35
3.7.2 Main Source of Water for Parcels On the whole, 96 percent of the parcels in Uganda depend on rain as their main
source of water while 3% parcels were using swamps/wetlands as their main water
source (2.9%) and only 1% was using irrigation as their main source of water.
Of the parcels that had irrigation as their main water source, the Central Region had
the highest percentage of 44.5 percent, followed by the Western region with 38.9
percent, the Eastern region with 13.6 percent and the Northern region with the lowest
percentage (3.0%) as shown by Tables 3.20A and 3.20B. Of the parcels that had
swamps or wetlands as the main water source, the Eastern Region had a significantly
high percentage of 39.4, followed by the Western Region with 25.4 percent, the
Northern Region with 19 percent and the Central Region with the lowest percentage
(16.2%) as shown in Tables 3.20A and 3.20B.
Table 3.20A: Percentage distribution of parcels by main water source
Main Water Source Region Irrigation Rainfall Swamp/Wetland Total
Central 2.0
95.6
2.4
100.0
Eastern 0.4
95.5
4.1
100.0
Northern 0.1
97.1
2.8
100.0
Western 1.1
96.6
2.3
100.0
Total 0.9
96.2
2.9
100.0
Notes: ( ) - Row percentages Not bracketed - Column percentages
Table 3.20B: Percentage distribution of parcels by Region
Main Water Source Region Irrigation Rainfall Swamp/Wetland Total
Central 44.5
19.4
16.2 19.5
Eastern
13.6
28.1 39.4
28.3
Northern
3.0
20.5
19.0
20.3
Western
38.9
32.0
25.4
31.9
Total
100.0
100.0
100.0
100.0
3.7.3 Topology of Parcel Most of the parcels in the Eastern and Northern Regions are on flat land. In the
Central and Western Regions, most of the parcels are on gentle slopes. The Details
are given in Annex A3, Table A3.25
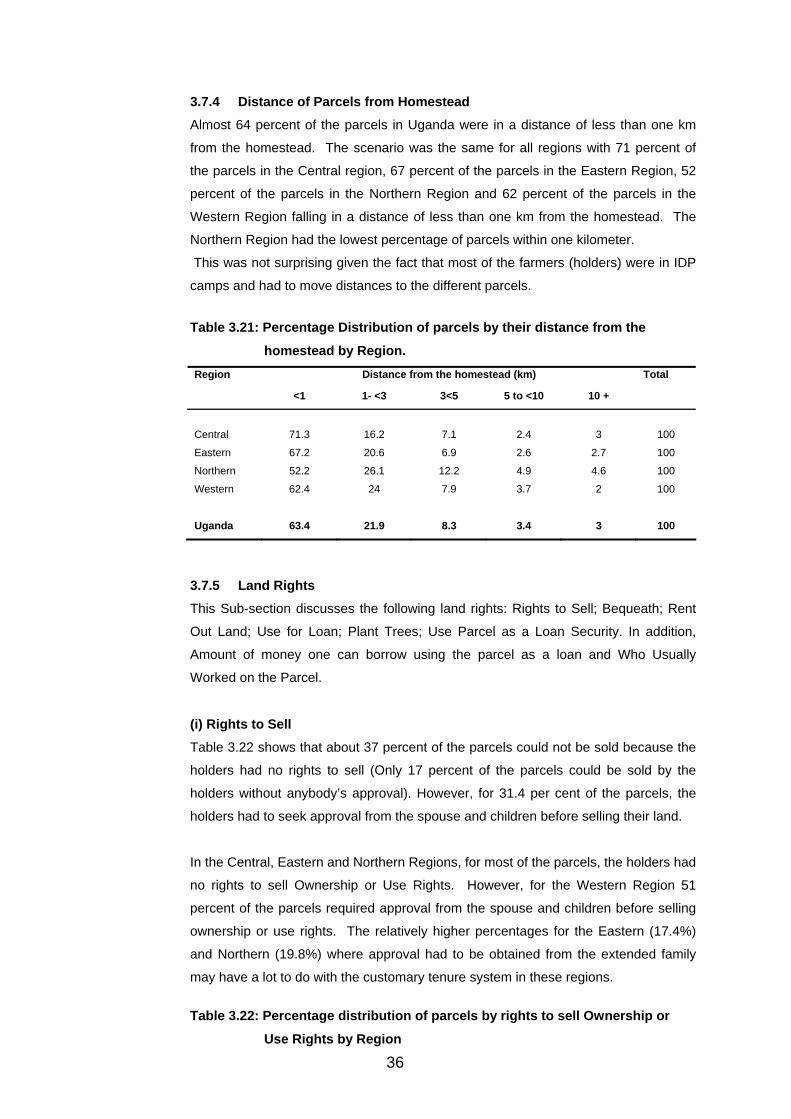
36
3.7.4 Distance of Parcels from Homestead Almost 64 percent of the parcels in Uganda were in a distance of less than one km
from the homestead. The scenario was the same for all regions with 71 percent of
the parcels in the Central region, 67 percent of the parcels in the Eastern Region, 52
percent of the parcels in the Northern Region and 62 percent of the parcels in the
Western Region falling in a distance of less than one km from the homestead. The
Northern Region had the lowest percentage of parcels within one kilometer.
This was not surprising given the fact that most of the farmers (holders) were in IDP
camps and had to move distances to the different parcels.
Table 3.21: Percentage Distribution of parcels by their distance from the
homestead by Region. Distance from the homestead (km) Region
<1 1- <3 3<5 5 to <10 10 +
Total
Central 71.3 16.2 7.1 2.4 3 100
Eastern 67.2 20.6 6.9 2.6 2.7 100
Northern 52.2 26.1 12.2 4.9 4.6 100
Western 62.4 24 7.9 3.7 2 100
Uganda 63.4 21.9 8.3 3.4 3 100
3.7.5 Land Rights This Sub-section discusses the following land rights: Rights to Sell; Bequeath; Rent
Out Land; Use for Loan; Plant Trees; Use Parcel as a Loan Security. In addition,
Amount of money one can borrow using the parcel as a loan and Who Usually
Worked on the Parcel.
(i) Rights to Sell Table 3.22 shows that about 37 percent of the parcels could not be sold because the
holders had no rights to sell (Only 17 percent of the parcels could be sold by the
holders without anybody’s approval). However, for 31.4 per cent of the parcels, the
holders had to seek approval from the spouse and children before selling their land.
In the Central, Eastern and Northern Regions, for most of the parcels, the holders had
no rights to sell Ownership or Use Rights. However, for the Western Region 51
percent of the parcels required approval from the spouse and children before selling
ownership or use rights. The relatively higher percentages for the Eastern (17.4%)
and Northern (19.8%) where approval had to be obtained from the extended family
may have a lot to do with the customary tenure system in these regions.
Table 3.22: Percentage distribution of parcels by rights to sell Ownership or
Use Rights by Region
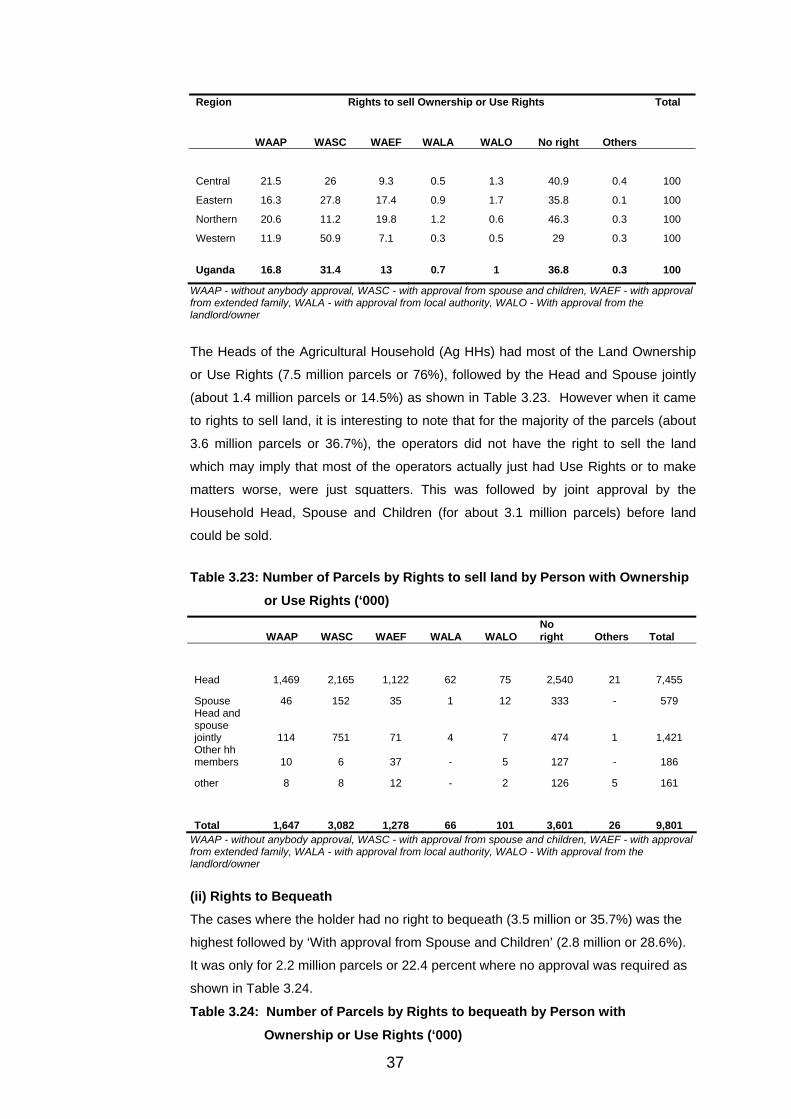
37
Rights to sell Ownership or Use Rights Region
WAAP WASC WAEF WALA WALO No right Others
Total
Central 21.5 26 9.3 0.5 1.3 40.9 0.4 100
Eastern 16.3 27.8 17.4 0.9 1.7 35.8 0.1 100
Northern 20.6 11.2 19.8 1.2 0.6 46.3 0.3 100
Western 11.9 50.9 7.1 0.3 0.5 29 0.3 100
Uganda 16.8 31.4 13 0.7 1 36.8 0.3 100
WAAP - without anybody approval, WASC - with approval from spouse and children, WAEF - with approval from extended family, WALA - with approval from local authority, WALO - With approval from the landlord/owner
The Heads of the Agricultural Household (Ag HHs) had most of the Land Ownership
or Use Rights (7.5 million parcels or 76%), followed by the Head and Spouse jointly
(about 1.4 million parcels or 14.5%) as shown in Table 3.23. However when it came
to rights to sell land, it is interesting to note that for the majority of the parcels (about
3.6 million parcels or 36.7%), the operators did not have the right to sell the land
which may imply that most of the operators actually just had Use Rights or to make
matters worse, were just squatters. This was followed by joint approval by the
Household Head, Spouse and Children (for about 3.1 million parcels) before land
could be sold.
Table 3.23: Number of Parcels by Rights to sell land by Person with Ownership
or Use Rights (‘000)
WAAP WASC WAEF WALA WALO No right Others Total
Head 1,469 2,165 1,122 62 75 2,540 21 7,455
Spouse 46 152 35 1 12 333 - 579 Head and spouse jointly 114 751 71 4 7 474 1 1,421 Other hh members 10 6 37 - 5 127 - 186
other 8 8 12 - 2 126 5 161
Total 1,647 3,082 1,278 66 101 3,601 26 9,801 WAAP - without anybody approval, WASC - with approval from spouse and children, WAEF - with approval from extended family, WALA - with approval from local authority, WALO - With approval from the landlord/owner (ii) Rights to Bequeath The cases where the holder had no right to bequeath (3.5 million or 35.7%) was the
highest followed by ‘With approval from Spouse and Children’ (2.8 million or 28.6%).
It was only for 2.2 million parcels or 22.4 percent where no approval was required as
shown in Table 3.24.
Table 3.24: Number of Parcels by Rights to bequeath by Person with
Ownership or Use Rights (‘000)
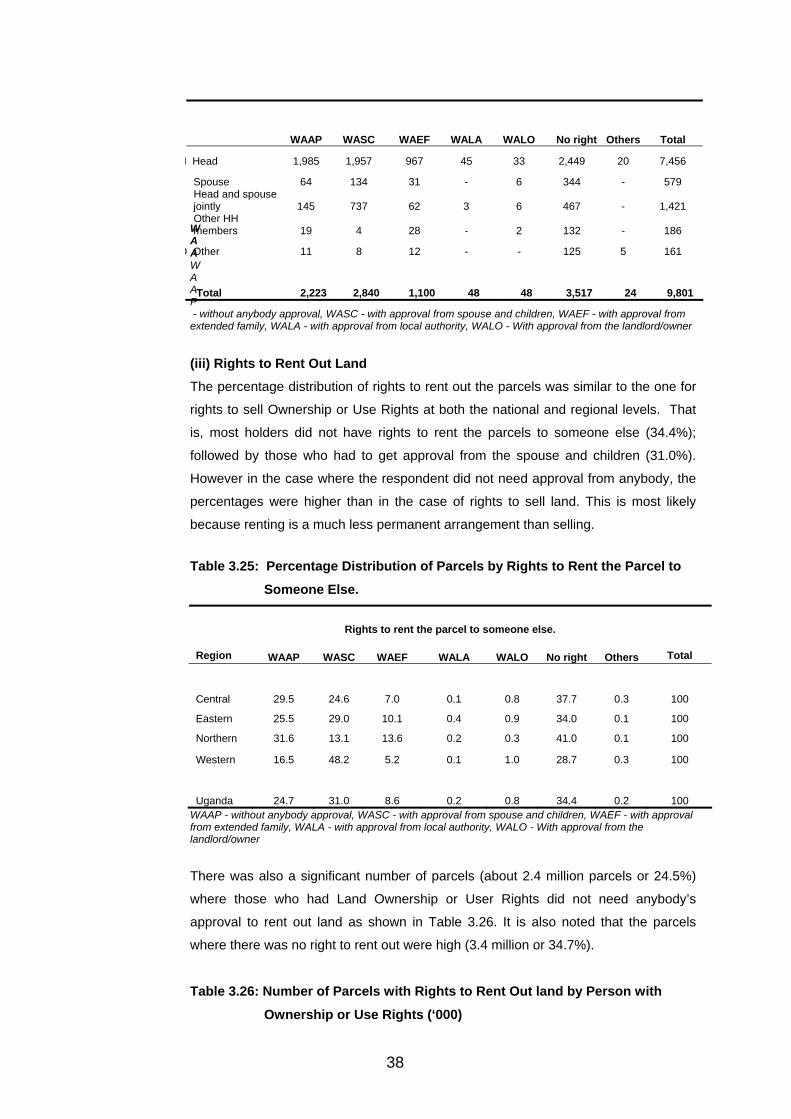
38
WAA WAAP - without anybody approval, WASC - with approval from spouse and children, WAEF - with approval from extended family, WALA - with approval from local authority, WALO - With approval from the landlord/owner
(iii) Rights to Rent Out Land The percentage distribution of rights to rent out the parcels was similar to the one for
rights to sell Ownership or Use Rights at both the national and regional levels. That
is, most holders did not have rights to rent the parcels to someone else (34.4%);
followed by those who had to get approval from the spouse and children (31.0%).
However in the case where the respondent did not need approval from anybody, the
percentages were higher than in the case of rights to sell land. This is most likely
because renting is a much less permanent arrangement than selling.
Table 3.25: Percentage Distribution of Parcels by Rights to Rent the Parcel to
Someone Else.
Rights to rent the parcel to someone else.
Region WAAP WASC WAEF WALA WALO No right Others Total
Central 29.5 24.6 7.0 0.1 0.8 37.7 0.3 100
Eastern 25.5 29.0 10.1 0.4 0.9 34.0 0.1 100
Northern 31.6 13.1 13.6 0.2 0.3 41.0 0.1 100
Western 16.5 48.2 5.2 0.1 1.0 28.7 0.3 100
Uganda 24.7 31.0 8.6 0.2 0.8 34.4 0.2 100 WAAP - without anybody approval, WASC - with approval from spouse and children, WAEF - with approval from extended family, WALA - with approval from local authority, WALO - With approval from the landlord/owner
There was also a significant number of parcels (about 2.4 million parcels or 24.5%)
where those who had Land Ownership or User Rights did not need anybody’s
approval to rent out land as shown in Table 3.26. It is also noted that the parcels
where there was no right to rent out were high (3.4 million or 34.7%).
Table 3.26: Number of Parcels with Rights to Rent Out land by Person with
Ownership or Use Rights (‘000)
WAAP WASC WAEF WALA WALO No right Others Total
H Head 1,985 1,957 967 45 33 2,449 20 7,456
Spouse 64 134 31 - 6 344 - 579 Head and spouse jointly 145 737 62 3 6 467 - 1,421
Other HH members 19 4 28 - 2 132 - 186
O Other 11 8 12 - - 125 5 161
Total 2,223 2,840 1,100 48 48 3,517 24 9,801
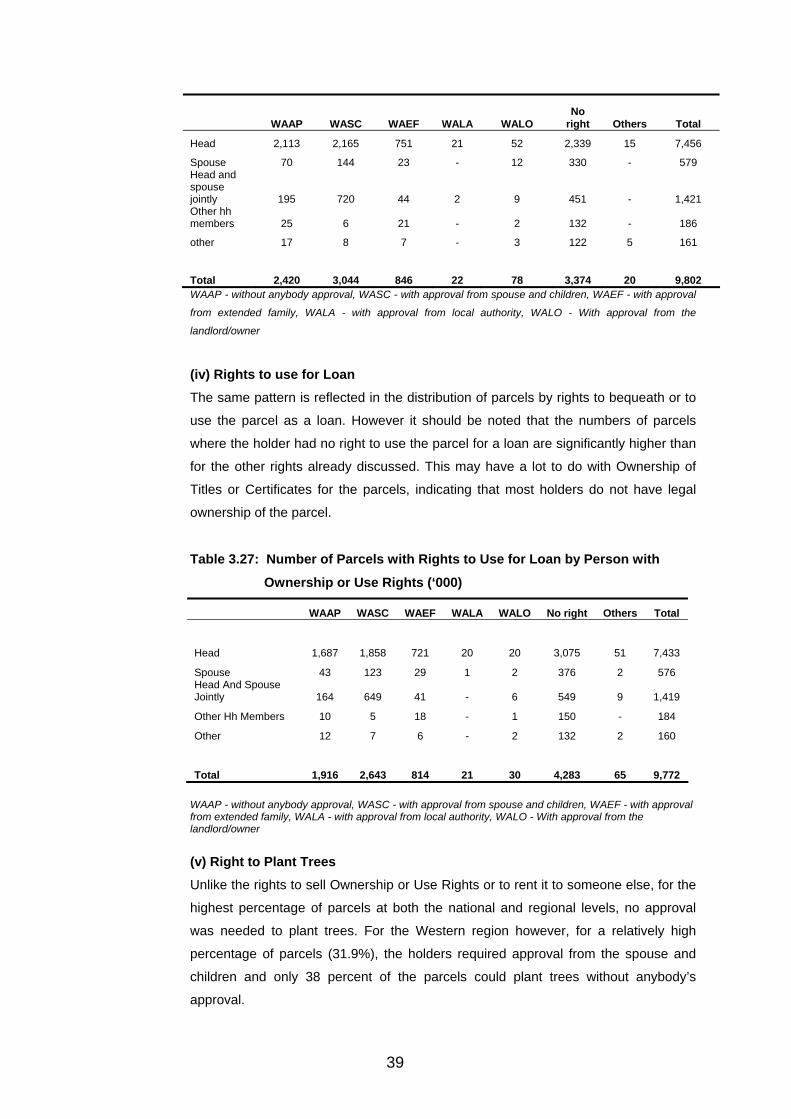
39
WAAP WASC WAEF WALA WALO No
right Others Total
Head 2,113 2,165 751 21 52 2,339 15 7,456
Spouse 70 144 23 - 12 330 - 579 Head and spouse jointly 195 720 44 2 9 451 - 1,421 Other hh members 25 6 21 - 2 132 - 186
other 17 8 7 - 3 122 5 161
Total 2,420 3,044 846 22 78 3,374 20 9,802 WAAP - without anybody approval, WASC - with approval from spouse and children, WAEF - with approval
from extended family, WALA - with approval from local authority, WALO - With approval from the
landlord/owner
(iv) Rights to use for Loan The same pattern is reflected in the distribution of parcels by rights to bequeath or to
use the parcel as a loan. However it should be noted that the numbers of parcels
where the holder had no right to use the parcel for a loan are significantly higher than
for the other rights already discussed. This may have a lot to do with Ownership of
Titles or Certificates for the parcels, indicating that most holders do not have legal
ownership of the parcel.
Table 3.27: Number of Parcels with Rights to Use for Loan by Person with
Ownership or Use Rights (‘000)
WAAP WASC WAEF WALA WALO No right Others Total
Head 1,687 1,858 721 20 20 3,075 51 7,433
Spouse 43 123 29 1 2 376 2 576 Head And Spouse Jointly 164 649 41 - 6 549 9 1,419
Other Hh Members 10 5 18 - 1 150 - 184
Other 12 7 6 - 2 132 2 160
Total 1,916 2,643 814 21 30 4,283 65 9,772
WAAP - without anybody approval, WASC - with approval from spouse and children, WAEF - with approval from extended family, WALA - with approval from local authority, WALO - With approval from the landlord/owner
(v) Right to Plant Trees Unlike the rights to sell Ownership or Use Rights or to rent it to someone else, for the
highest percentage of parcels at both the national and regional levels, no approval
was needed to plant trees. For the Western region however, for a relatively high
percentage of parcels (31.9%), the holders required approval from the spouse and
children and only 38 percent of the parcels could plant trees without anybody’s
approval.
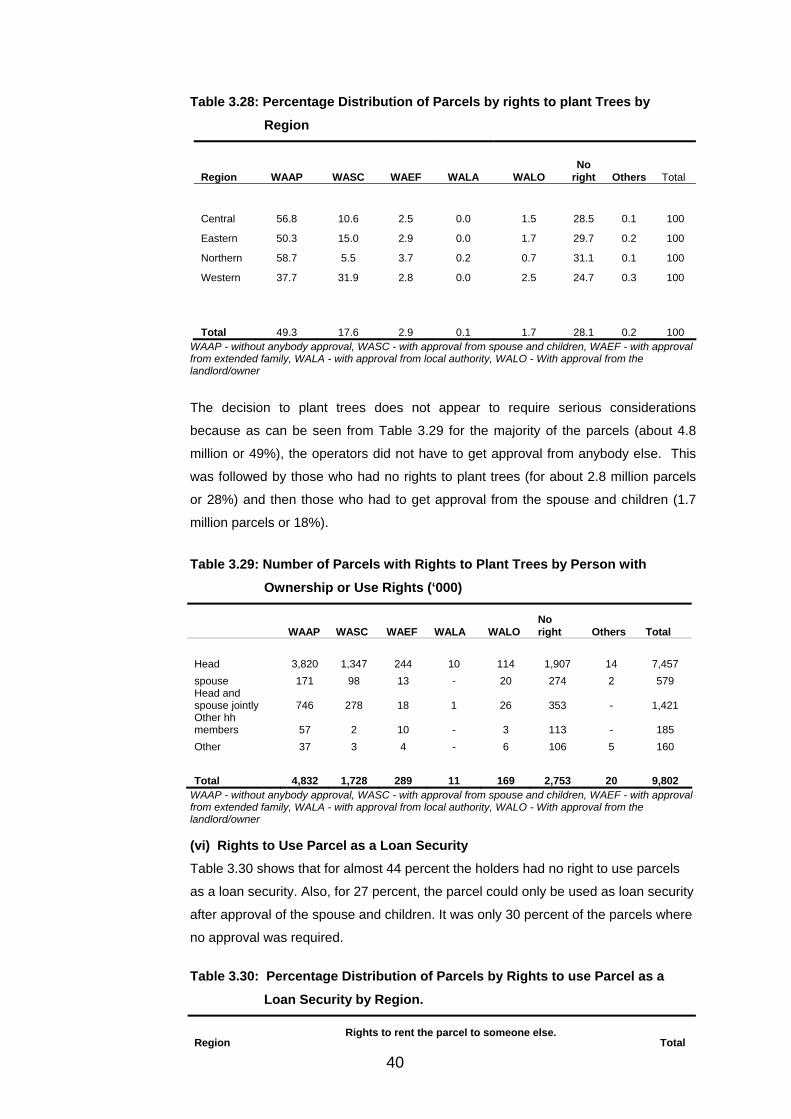
40
Table 3.28: Percentage Distribution of Parcels by rights to plant Trees by
Region
Region WAAP WASC WAEF WALA WALO No
right Others Total
Central 56.8 10.6 2.5 0.0 1.5 28.5 0.1 100
Eastern 50.3 15.0 2.9 0.0 1.7 29.7 0.2 100
Northern 58.7 5.5 3.7 0.2 0.7 31.1 0.1 100
Western 37.7 31.9 2.8 0.0 2.5 24.7 0.3 100
Total 49.3 17.6 2.9 0.1 1.7 28.1 0.2 100 WAAP - without anybody approval, WASC - with approval from spouse and children, WAEF - with approval from extended family, WALA - with approval from local authority, WALO - With approval from the landlord/owner
The decision to plant trees does not appear to require serious considerations
because as can be seen from Table 3.29 for the majority of the parcels (about 4.8
million or 49%), the operators did not have to get approval from anybody else. This
was followed by those who had no rights to plant trees (for about 2.8 million parcels
or 28%) and then those who had to get approval from the spouse and children (1.7
million parcels or 18%).
Table 3.29: Number of Parcels with Rights to Plant Trees by Person with
Ownership or Use Rights (‘000)
WAAP WASC WAEF WALA WALO No right Others Total
Head 3,820 1,347 244 10 114 1,907 14 7,457 spouse 171 98 13 - 20 274 2 579 Head and spouse jointly 746 278 18 1 26 353 - 1,421 Other hh members 57 2 10 - 3 113 - 185 Other 37 3 4 - 6 106 5 160 Total 4,832 1,728 289 11 169 2,753 20 9,802
WAAP - without anybody approval, WASC - with approval from spouse and children, WAEF - with approval from extended family, WALA - with approval from local authority, WALO - With approval from the landlord/owner (vi) Rights to Use Parcel as a Loan Security Table 3.30 shows that for almost 44 percent the holders had no right to use parcels
as a loan security. Also, for 27 percent, the parcel could only be used as loan security
after approval of the spouse and children. It was only 30 percent of the parcels where
no approval was required.
Table 3.30: Percentage Distribution of Parcels by Rights to use Parcel as a
Loan Security by Region.
Region Rights to rent the parcel to someone else.
Total

41
WAAP WASC WAEF WALA WALO No
right Others Central 20.2 17.8 5.5 0.2 0.8 54.3 1.1 100 Eastern 22.6 25.6 10.8 0.3 0.2 40.3 0.2 100 Northern 24.4 9.9 14.7 0.3 0.2 49.8 0.7 100
Western 13.5 44.8 3.8 0.2 0.1 36.9 0.7 100
Total 29.6 27.0 8.3 0.2 0.3 43.8 0.7 100 WAAP - without anybody approval, WASC - with approval from spouse and children, WAEF - with approval from extended family, WALA - with approval from local authority, WALO - With approval from the landlord/owner
(vii) Amount of money one can borrow using the parcel as a Security The average amount of money one can borrow using the parcel as collateral is, as
expected, higher for the urban parcels given the value one attaches to them if he/she
is to sell. For the urban parcels, those on leasehold had the highest average value of
about 9.7 million UShs, followed by those on mailo land (about 6.3 million shillings)
and then those on freehold (about 2.9 million shillings). In the case of rural parcels,
those on freehold had the highest value on average (about 1.9 million shillings),
followed by those on leasehold (1.0 million shillings) and then those on mailo land
(1.0 million shillings) as shown in Table 3.31.
Table 3.31: Average amount one can borrow using the Parcel as a Loan
Security by Rural/Urban by Land Tenure System (‘000)
Land Tenure System
Location Freehold Leasehold Mailo Customary Other Total
Urban 2,868 9,721 6,253 1,877 12,700 2,873 Rural 1,903 1,014 1,004 738 1,053 832
Total 2,093 5,738 1,310 852 1,985 1,044
(viii) Who usually worked on the Parcel At the national level, most of the parcels were worked on by the head of the
household (36.0%) or by both the head and the spouse (35.6%) followed by those
worked on by the spouse (20.4%). In the Central and Eastern regions, most of the
parcels were worked on by the household head followed by those worked on by both
the head and the spouse. In the Northern and Western regions, the pattern is
reversed with most parcels being worked on by both the household head and spouse
followed by those where it was only the household head that worked on the parcel. In
the Northern Region it was not common for the spouse to work alone as shown in
Table 3.32.
Table 3.32: Percentage distribution of Parcels by who works on the Parcel by
Region. Location Who Works on Parcel Total

42
Head Spouse Both Other hhd member Other
Central 39.0 17.5 31.3 4.4 7.7 100
Eastern 37.5 22.4 34.3 2.4 3.4 100
Northern 40.9 8.9 43.0 3.5 3.7 100
Western 29.6 27.8 34.6 4.1 3.9 100
Total 36.0 20.4 35.6 3.6 4.4 100
3.8 Land Title, Certificates and Disputes
3.8.1 Parcels with Titles/Certificates The ownership of land titles and Certificates was very low with 94.9 percent of the
parcels having no Titles. The Central Region had the highest percentage (12.4) of
parcels with Certificates of Title. This could have been mainly due to the presence of
the Mailo land Tenure System. A summary of the findings are given in Table 3.33.
Table 3.33: Percentage distribution of Parcels with/without Certificates by
Region
Region Certificate
of title
Certificate of customary ownership
Certificate of occupancy No document Total
Central 12.4 0.5 0.3 86.8 100.0 Eastern 1.3 0.6 0.2 97.9 100.0 Northern 1.8 0.7 0.0 97.5 100.0 Western 2.8 1.2 0.5 95.6 100.0
Total 4.1 0.8 0.3 94.9 100.0
3.8.2 Land Disputes The percentage of parcels that had disputes was relatively small at about seven (7)
percent of all parcels at the national level. All regions had less than eight percent with
Western region having the lowest percentage of parcels that had disputes.
Table 3.34: Percentage distribution of Parcels by ever having a land dispute
over Ownership/Use Rights by Region Ever had land disputes Region
Yes No Total
Central 8.1 91.9 100 Eastern 7.0 93.0 100 Northern 6.7 93.3 100 Western 5.1 94.9 100 Total 6.5 93.5 100 Most of the parcels with disputes had the most recent disputes after 1999. The
exception is Western region which had 20 per cent of the recent disputes starting
before 1999.
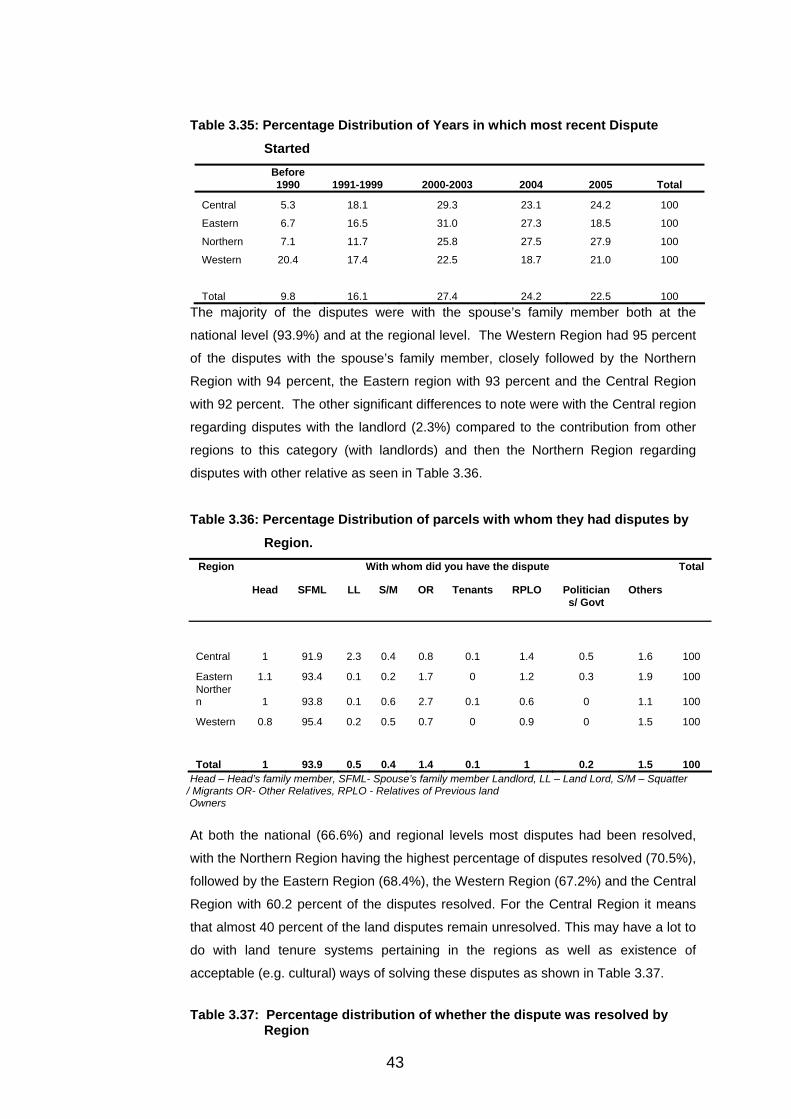
43
Table 3.35: Percentage Distribution of Years in which most recent Dispute
Started
Before 1990 1991-1999 2000-2003 2004 2005 Total
Central 5.3 18.1 29.3 23.1 24.2 100
Eastern 6.7 16.5 31.0 27.3 18.5 100
Northern 7.1 11.7 25.8 27.5 27.9 100
Western 20.4 17.4 22.5 18.7 21.0 100
Total 9.8 16.1 27.4 24.2 22.5 100 The majority of the disputes were with the spouse’s family member both at the
national level (93.9%) and at the regional level. The Western Region had 95 percent
of the disputes with the spouse’s family member, closely followed by the Northern
Region with 94 percent, the Eastern region with 93 percent and the Central Region
with 92 percent. The other significant differences to note were with the Central region
regarding disputes with the landlord (2.3%) compared to the contribution from other
regions to this category (with landlords) and then the Northern Region regarding
disputes with other relative as seen in Table 3.36.
Table 3.36: Percentage Distribution of parcels with whom they had disputes by
Region. With whom did you have the dispute Region
Head SFML LL S/M OR Tenants RPLO Politicians/ Govt
Others
Total
Central 1 91.9 2.3 0.4 0.8 0.1 1.4 0.5 1.6 100
Eastern 1.1 93.4 0.1 0.2 1.7 0 1.2 0.3 1.9 100 Northern 1 93.8 0.1 0.6 2.7 0.1 0.6 0 1.1 100
Western 0.8 95.4 0.2 0.5 0.7 0 0.9 0 1.5 100
Total 1 93.9 0.5 0.4 1.4 0.1 1 0.2 1.5 100 Head – Head’s family member, SFML- Spouse’s family member Landlord, LL – Land Lord, S/M – Squatter / Migrants OR- Other Relatives, RPLO - Relatives of Previous land Owners
At both the national (66.6%) and regional levels most disputes had been resolved,
with the Northern Region having the highest percentage of disputes resolved (70.5%),
followed by the Eastern Region (68.4%), the Western Region (67.2%) and the Central
Region with 60.2 percent of the disputes resolved. For the Central Region it means
that almost 40 percent of the land disputes remain unresolved. This may have a lot to
do with land tenure systems pertaining in the regions as well as existence of
acceptable (e.g. cultural) ways of solving these disputes as shown in Table 3.37.
Table 3.37: Percentage distribution of whether the dispute was resolved by
Region

44
Was the dispute resolved
Region Yes No Total
Central 60.2 39.8 100
Eastern 68.4 31.6 100
Northern 70.5 29.5 100
Western 67.2 32.8 100
Total 66.6 33.4 100
3.9 Summary of Findings
During UNHS 2005/06, data was collected on owned land and on land with use
rights. There were a total of about 4.2 million Ag HHs in Uganda. Of these 3.3 million
(or 78.7%) owned land while 2.2 million Ag HHs (52.6%) had access to land with only
use rights.
A total of slightly above 6.4 million parcels of land were estimated to be owned in the
UNHS Agricultural Module survey. These results show a significant increase in the
number of parcels owned from about 4.8 million in the UNHS 1999/2000.
The average number of parcels owned per agricultural household was about two (2).
There was a very small difference in the average number of parcels per household
between male-headed and female-headed households for the Central and Western
regions. A total of 2.2 million Ag HHs had use rights for 3.5 million parcels implying an
average of 1.6 parcels per agricultural household. There were more male headed Ag
HHs with land use rights.
The majority of the parcels were within the enumeration area of the agricultural
household’s dwelling house; followed by the parcels within the parish. This was the
case for all regions. The distribution of parcels by location at the national level was
not very different between the parcels that were owned and those where the holders
just had use rights. Most of the parcels were within the enumeration areas.
The distribution of parcels within the enumeration area by land tenure system for
both parcels owned and those where the holder has just use rights is not different
from the general distribution of all the parcels. That is, the Central region had most of
its parcels on mailo land whereas for the other regions most of the parcels were
under a customary arrangement.
Most of the parcels were obtained through inheritance most specifically from the
head. However regional analysis shows that for the Central and Western regions,
most of the parcels were purchased (60.5% and 50.2% respectively). While, for the
45
Eastern and Northern regions, most of the parcels were obtained through inheritance
from the head of the household.
For the Second Season of 2004, most of the parcels owned were cultivated with
annual crops (52.4%), followed by those parcels under perennial crops (28.6%). The
situation was almost the same for the first season of 2005 except for the land under
fallow which was significantly less for the Eastern and Northern regions.
In the Central, Eastern and Northern regions, the most expensive land when selling
was under leasehold, whereas for the Western Region it was Mailo land.
The Central Region had the highest percentage of parcels (19.1%) with poor soils
and the Northern Region had the highest percentage of parcels (55.7%) with good
soils. In total 46.2 percent of the parcels in Uganda had soils of fair quality followed
by 43.0 percent with good soils.
All regions had their main source of water being rainfall. Most of the parcels in the
Eastern and Northern regions were on flat land. In the Central and Western regions,
most of the parcels were on gentle slopes.
Almost 64 percent of the parcels in Uganda were in a distance of less than 1 km from
the homestead. The heads of the household had most of the land ownership or Use
Rights (for about 7.5 million parcels), followed by the head and spouse jointly (about
1.4 million parcels). The distribution of rights to rent out land were the same as for
rights to sell land except that there was also a significant number of parcels (about
2.4 million parcels) where those who had land ownership or user rights did not need
anybody’s approval to rent out land.
Western Region recorded the highest percentage (36%) of parcels with Certificate of
Title followed by the Central Region (32%); the Eastern recorded least (13%).
The percentage of parcels that have had disputes is relatively small at 6.5% of all
parcels at the national level. Most of the parcels with disputes had the most recent
disputes after 1999. The majority of the disputes were with the spouse’s family
member both at the national level (93.9%) and at the regional level. At both the
national (66.6%) and regional levels most disputes had been resolved.

46
CHAPTER FOUR: AREA AND PRODUCTION OF MAJOR
CROPS
4.1 Introduction
Information was collected on both area and production of crops during the Second
Season of 2004 and the First Season of 2005.
The crops grown by most Ag HHs (Ag HHs) were: Maize, Beans, Cassava and
Bananas. This is shown by the fact that each one was grown by at least 3 million
households. The total estimated number of Ag HHs was 4.2 million which means that
Maize, Beans, Cassava and Banana (Food-type) were grown by: 85.8, 80.8, 74.3 and
73.1 percent of total Ag HHs, respectively. These were followed by Sweet Potatoes
and Coffee with about 2 and 1.7 million Ag HHs (or 47.4 and 41.6 %) respectively.
The same pattern was observed for the different regions except for the Northern
Region where Sorghum and Simsim replaced Sweet Potatoes and Coffee.
In terms of some selected crops, Cassava and Sweet Potatoes were grown mostly by
the Central Region with 23.3 and 15.7 percent of the total Ag HHs respectively; Maize
was grown mostly by the Eastern Region with 29.7 percent of the Ag HHs. In the case
of Sorghum, the Northern Region grew it mostly with 6 percent; Finger Millet, Beans
and Banana (Food-type) were mostly grown by Ag HHs in the Western Region with
percentages of 11.3, 34.3 and 30.2, respectively as Table 4.1 shows.
It is observed that the total number of Ag HHs that grew crops grouped under
“Others’’, was 4.7 million is greater than 4.2 million. The explanation for this is that
there was multiple counting as a result of the Ag HHs that grew several crops being
counted several times.
Mostly grown crops were: Maize, Beans, Cassava and Banana (Food)
Most Ag HHs in the Eastern, Western & Central grew Maize, Banana & Cassava
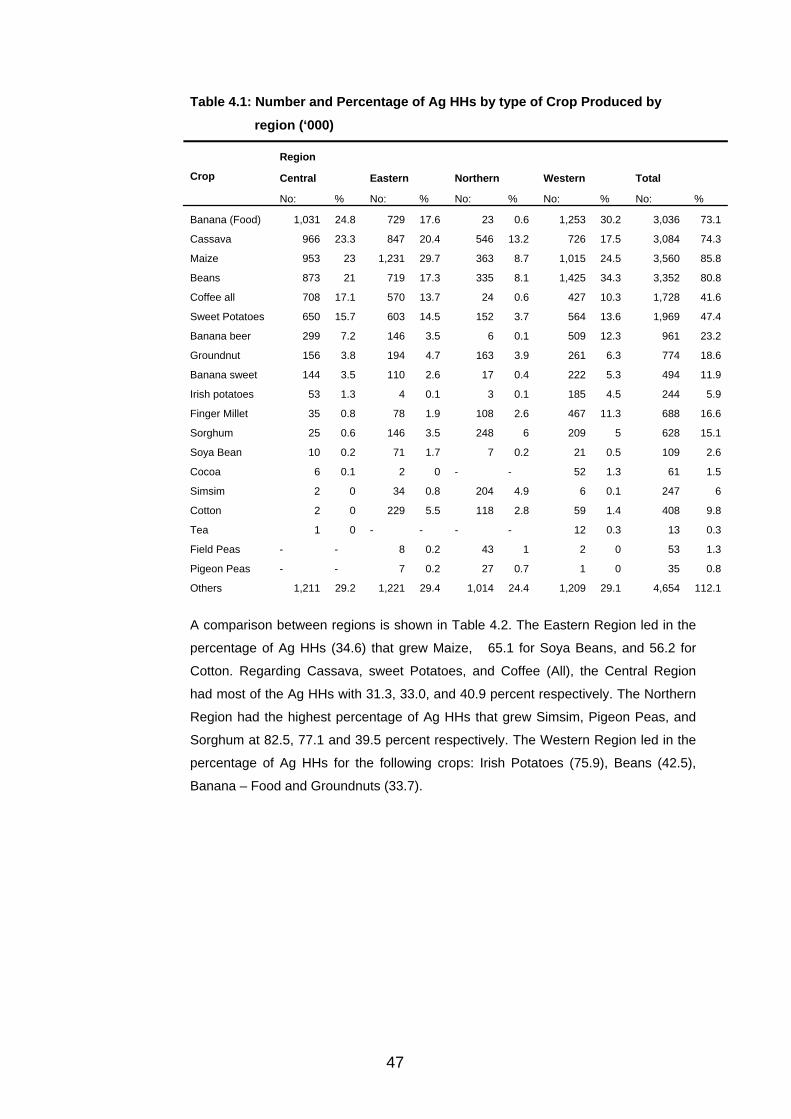
47
Table 4.1: Number and Percentage of Ag HHs by type of Crop Produced by
region (‘000)
Region Crop Central Eastern Northern Western Total
No: % No: % No: % No: % No: %
Banana (Food) 1,031 24.8 729 17.6 23 0.6 1,253 30.2 3,036 73.1
Cassava 966 23.3 847 20.4 546 13.2 726 17.5 3,084 74.3
Maize 953 23 1,231 29.7 363 8.7 1,015 24.5 3,560 85.8
Beans 873 21 719 17.3 335 8.1 1,425 34.3 3,352 80.8
Coffee all 708 17.1 570 13.7 24 0.6 427 10.3 1,728 41.6
Sweet Potatoes 650 15.7 603 14.5 152 3.7 564 13.6 1,969 47.4
Banana beer 299 7.2 146 3.5 6 0.1 509 12.3 961 23.2
Groundnut 156 3.8 194 4.7 163 3.9 261 6.3 774 18.6
Banana sweet 144 3.5 110 2.6 17 0.4 222 5.3 494 11.9
Irish potatoes 53 1.3 4 0.1 3 0.1 185 4.5 244 5.9
Finger Millet 35 0.8 78 1.9 108 2.6 467 11.3 688 16.6
Sorghum 25 0.6 146 3.5 248 6 209 5 628 15.1
Soya Bean 10 0.2 71 1.7 7 0.2 21 0.5 109 2.6
Cocoa 6 0.1 2 0 - - 52 1.3 61 1.5
Simsim 2 0 34 0.8 204 4.9 6 0.1 247 6
Cotton 2 0 229 5.5 118 2.8 59 1.4 408 9.8
Tea 1 0 - - - - 12 0.3 13 0.3
Field Peas - - 8 0.2 43 1 2 0 53 1.3
Pigeon Peas - - 7 0.2 27 0.7 1 0 35 0.8
Others 1,211 29.2 1,221 29.4 1,014 24.4 1,209 29.1 4,654 112.1
A comparison between regions is shown in Table 4.2. The Eastern Region led in the
percentage of Ag HHs (34.6) that grew Maize, 65.1 for Soya Beans, and 56.2 for
Cotton. Regarding Cassava, sweet Potatoes, and Coffee (All), the Central Region
had most of the Ag HHs with 31.3, 33.0, and 40.9 percent respectively. The Northern
Region had the highest percentage of Ag HHs that grew Simsim, Pigeon Peas, and
Sorghum at 82.5, 77.1 and 39.5 percent respectively. The Western Region led in the
percentage of Ag HHs for the following crops: Irish Potatoes (75.9), Beans (42.5),
Banana – Food and Groundnuts (33.7).

48
Table 4.2: A Comparison of Percentage Distribution of Ag HHs by type of crop
produced by Region
Region Crop Central Eastern Northern Western Total
No: % No: % No: % No: % No: %
Maize 953 26.8 1,231 34.6 363 10.2 1,015 28.5 3,560 100
Finger Millet 35 5.1 78 11.3 108 15.8 467 67.8 688 100
Sorghum 25 4.0 146 23.2 248 39.5 209 33.3 628 100
Beans 873 26.0 719 21.5 335 10.0 1,425 42.5 3,352 100
Pigeon Peas - 0.0 7 20.5 27 77.1 1 2.4 35 100
Groundnut 156 20.1 194 25.1 163 21.1 261 33.7 774 100
Simsim 2 0.9 34 14.0 204 82.5 6 2.6 247 100
Soya Bean 10 9.6 71 65.1 7 6.3 21 19.0 109 100
Cassava 966 31.3 847 27.5 546 17.7 726 23.5 3,084 100 Sweet Potatoes 650 33.0 603 30.6 152 7.7 564 28.6 1,969 100
Irish potatoes 53 21.7 4 1.4 3 1.0 185 75.9 244 100
Banana (Food) 1,031 34.0 729 24.0 23 0.8 1,253 41.3 3,036 100
Banana (Beer) 299 31.1 146 15.2 6 0.7 509 53.0 961 100 Banana (Sweet) 144 29.3 110 22.4 17 3.3 222 45.0 494 100
Coffee all 708 40.9 570 33.0 24 1.4 427 24.7 1,728 100
Others 1,211 26.0 1,221 26.2 1,014 21.8 1,209 26.0 4,654 100
4.2 Production (Mt) and Area (Ha) of major crops
Data on crop production estimates was obtained by asking farmers for all the
production they obtained from all agricultural parcels in the district. It is worth-noting
that since data collection for the Second Season of 2004 was carried out during 2005,
it was impossible to ask for area and production within EA. On the other hand, it was
reasonable to ask for data within district and outside the district. The levels at which
the data was collected are shown in Table 4.3.
Table 4.3: Data collection level (on crop area and production) during the
Second Season of 2004 and First Season of 2005 2nd season 1st season
2004 2005 Level
Area Production Area Production
1) Within EA No No Yes Yes
2) Within District Yes Yes Yes Yes
3) Outside District Yes Yes Yes Yes
Data was collected on crop area and production by farmers’ estimates
Three levels at which data was collected
49
The production which is reported was obtained from level 2 in Table 4.3 above. Level
(1) above could not be chosen since there were no estimates for area and production
for the Second Season of 2004 and therefore, it would be impossible to compare data
between the Second Season of 2004 and the First Season of 2005.
Level (3) above could not be chosen because the proportions of area and production
from this level were found to be extremely small.
The area reported is a summation of the area under pure and mixed stand because
data on production was based on all area where the crop was grown regardless of
crop stand. However, tables on area by crop stand (i.e. Pure or Mixed) are available
in Annex 4.
Data by region is given in the appendix Tables. Similarly for each chart and graph the
data is given in Annex 4. For crops in mixed plots, an estimate of the proportion of the
crop in the mixture was collected by the Enumerators observing the crops. These
proportions were used to convert the mixed plot area to its equivalent in pure stand.
These computed areas were then added to the pure stand areas to get the total areas
under the crop.
4.2.1 Maize The National production of maize during the period under reference was 2.4 million
metric tons (Mt), which came from an estimated area of 1,539,000 hectares (Ha). It is
observed from Figure 4.1 that the Eastern Region had the highest production of
1,070,000 Mt, which was 44 percent of the national production. The lowest production
was reported by the Northern Region; it was 239,000 Mt and this accounted for 10
percent of national production
There was a dramatic increase of area under maize from 665,000 Ha during UNHS
1999/2000 to 1, 539,000 Ha during the UNHS 2005/06 Ag Mod, an increase of 131.4
percent.
Area provided is pure and mixed
Area under mixed stand was converted into its pure stand equivalent
Eastern Region led with 42% of Maize Production
Area under maize increased substantially.
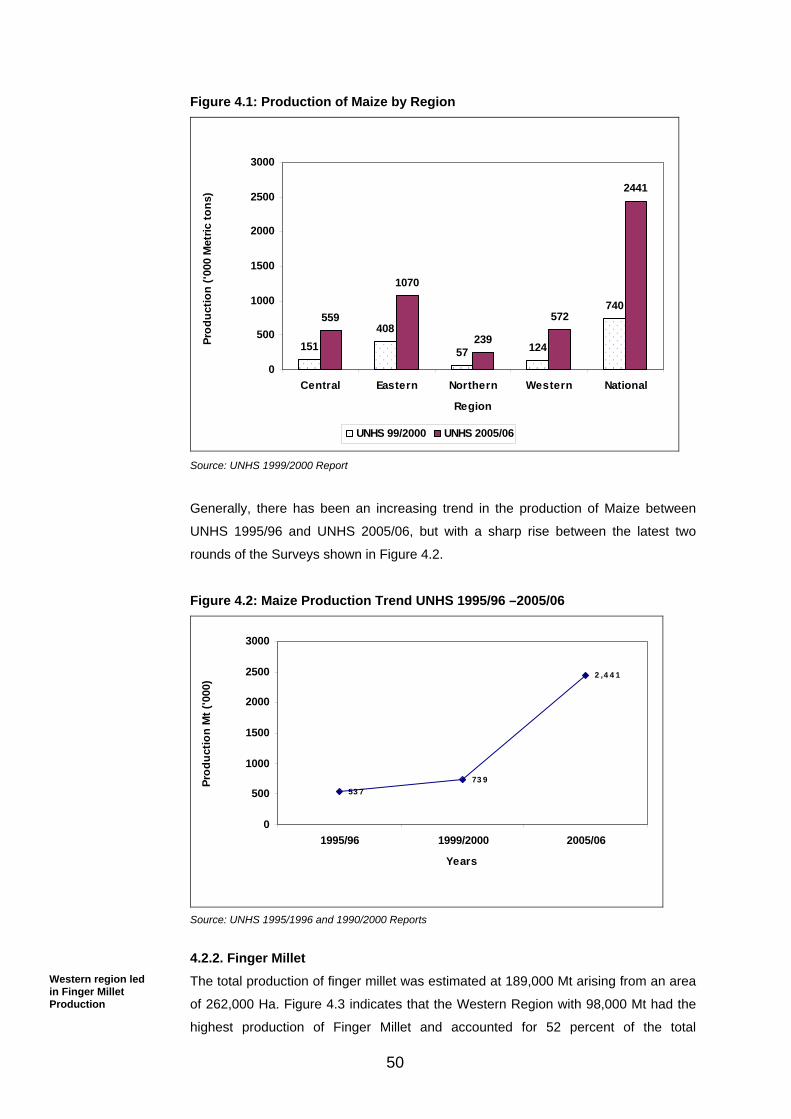
50
Figure 4.1: Production of Maize by Region
151408
57 124
740559
1070
239
572
2441
0
500
1000
1500
2000
2500
3000
Central Eastern Northern Western National
Region
Prod
uctio
n ('0
00 M
etric
tons
)
UNHS 99/2000 UNHS 2005/06
Source: UNHS 1999/2000 Report
Generally, there has been an increasing trend in the production of Maize between
UNHS 1995/96 and UNHS 2005/06, but with a sharp rise between the latest two
rounds of the Surveys shown in Figure 4.2.
Figure 4.2: Maize Production Trend UNHS 1995/96 –2005/06
53 773 9
2 ,4 4 1
0
500
1000
1500
2000
2500
3000
1995/96 1999/2000 2005/06
Years
Prod
uctio
n M
t ('0
00)
Source: UNHS 1995/1996 and 1990/2000 Reports
4.2.2. Finger Millet The total production of finger millet was estimated at 189,000 Mt arising from an area
of 262,000 Ha. Figure 4.3 indicates that the Western Region with 98,000 Mt had the
highest production of Finger Millet and accounted for 52 percent of the total
Western region led in Finger Millet Production
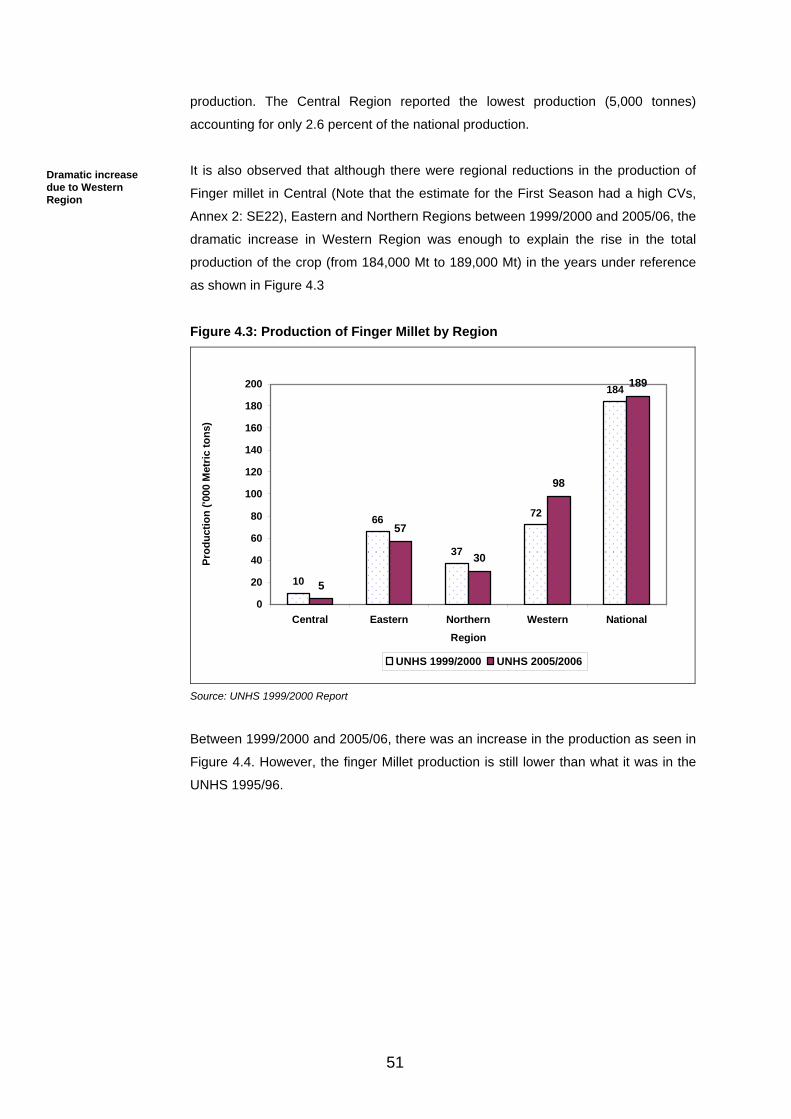
51
production. The Central Region reported the lowest production (5,000 tonnes)
accounting for only 2.6 percent of the national production.
It is also observed that although there were regional reductions in the production of
Finger millet in Central (Note that the estimate for the First Season had a high CVs,
Annex 2: SE22), Eastern and Northern Regions between 1999/2000 and 2005/06, the
dramatic increase in Western Region was enough to explain the rise in the total
production of the crop (from 184,000 Mt to 189,000 Mt) in the years under reference
as shown in Figure 4.3
Figure 4.3: Production of Finger Millet by Region
10
66
37
72
184
5
57
30
98
189
0
20
40
60
80
100
120
140
160
180
200
Central Eastern Northern Western NationalRegion
Prod
uctio
n ('0
00 M
etric
tons
)
UNHS 1999/2000 UNHS 2005/2006
Source: UNHS 1999/2000 Report
Between 1999/2000 and 2005/06, there was an increase in the production as seen in
Figure 4.4. However, the finger Millet production is still lower than what it was in the
UNHS 1995/96.
Dramatic increase due to Western Region

52
Figure 4.4: Finger Millet Production Trend UNHS 1995/96 – 2005/06
193
184
189
178
180
182
184
186
188
190
192
194
1995/96 1999/2000 2004/05
Years
Prod
uctio
n M
t ('0
00)
Source: UNHS 1995/96 and 1999/2000 Respective Reports
4.2.3. Sorghum The estimated production of sorghum was 162,000 Mt on an area of about 328,000
Ha. At regional level, sorghum was predominant in both the Eastern (58,000 Mt) and
Western (66,000 Mt) Regions as seen in Figure 4.5. The production in the Eastern
and Western Regions accounted for 36 and 41 percent of total production,
respectively. Only 3,000 tons or 2 percent of the total Sorghum production was
produced in the Central Region.
Figure 4.5: Production of Sorghum by Region
8
44
2437
113
3
58
34
66
162
0
20
40
60
80
100
120
140
160
180
Central Eastern Northern Western National
Region
Prod
uctio
n ('0
00 M
etric
tons
)
UNHS 99/2000 UNHS 2005/06
Eastern Region topped Sorghum production
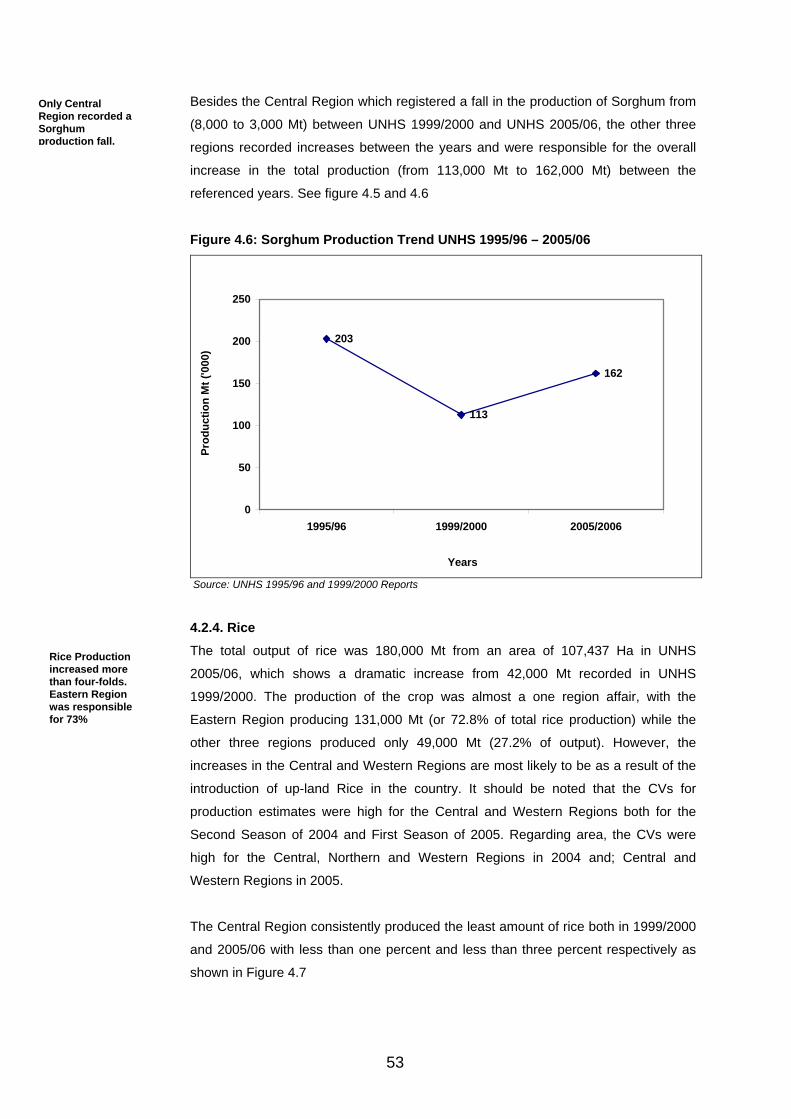
53
Besides the Central Region which registered a fall in the production of Sorghum from
(8,000 to 3,000 Mt) between UNHS 1999/2000 and UNHS 2005/06, the other three
regions recorded increases between the years and were responsible for the overall
increase in the total production (from 113,000 Mt to 162,000 Mt) between the
referenced years. See figure 4.5 and 4.6
Figure 4.6: Sorghum Production Trend UNHS 1995/96 – 2005/06
203
113
162
0
50
100
150
200
250
1995/96 1999/2000 2005/2006
Years
Prod
uctio
n M
t ('0
00)
Source: UNHS 1995/96 and 1999/2000 Reports
4.2.4. Rice The total output of rice was 180,000 Mt from an area of 107,437 Ha in UNHS
2005/06, which shows a dramatic increase from 42,000 Mt recorded in UNHS
1999/2000. The production of the crop was almost a one region affair, with the
Eastern Region producing 131,000 Mt (or 72.8% of total rice production) while the
other three regions produced only 49,000 Mt (27.2% of output). However, the
increases in the Central and Western Regions are most likely to be as a result of the
introduction of up-land Rice in the country. It should be noted that the CVs for
production estimates were high for the Central and Western Regions both for the
Second Season of 2004 and First Season of 2005. Regarding area, the CVs were
high for the Central, Northern and Western Regions in 2004 and; Central and
Western Regions in 2005.
The Central Region consistently produced the least amount of rice both in 1999/2000
and 2005/06 with less than one percent and less than three percent respectively as
shown in Figure 4.7
Only Central Region recorded a Sorghum production fall.
Rice Production increased more than four-folds. Eastern Region was responsible for 73%
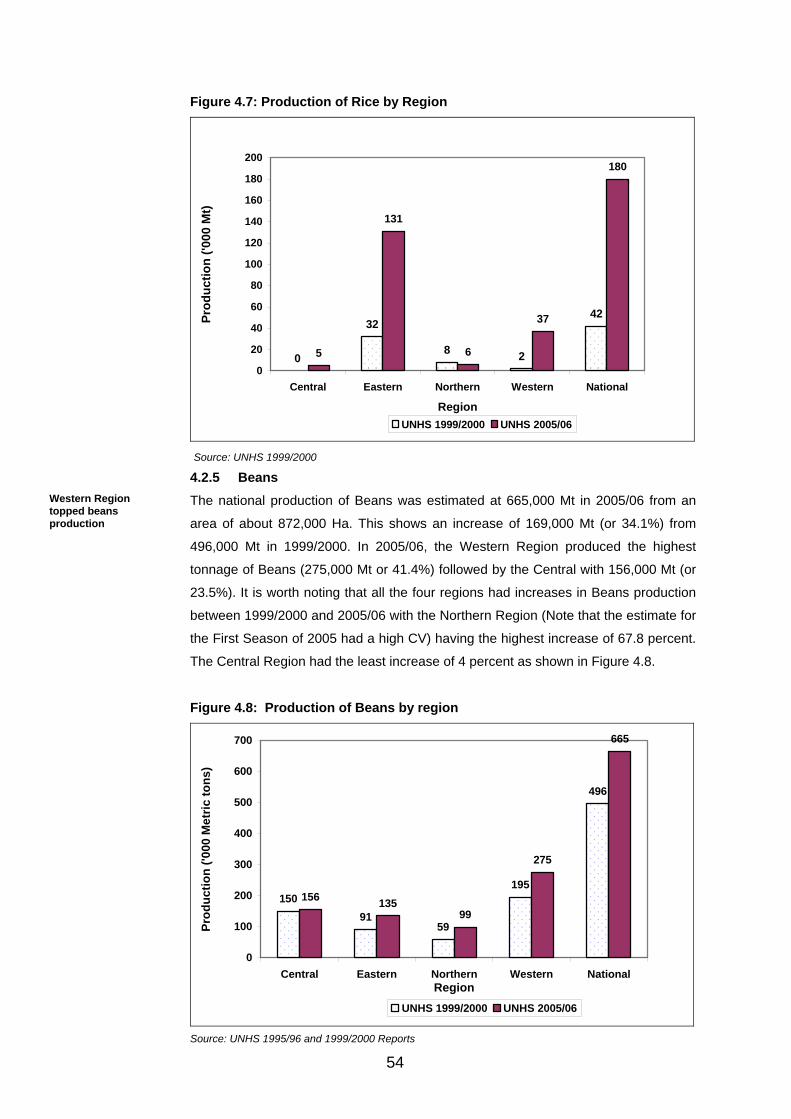
54
Figure 4.7: Production of Rice by Region
0
32
8 2
42
5
131
6
37
180
0
20
40
60
80
100
120
140
160
180
200
Central Eastern Northern Western National
Region
Prod
uctio
n ('0
00 M
t)
UNHS 1999/2000 UNHS 2005/06
Source: UNHS 1999/2000 4.2.5 Beans The national production of Beans was estimated at 665,000 Mt in 2005/06 from an
area of about 872,000 Ha. This shows an increase of 169,000 Mt (or 34.1%) from
496,000 Mt in 1999/2000. In 2005/06, the Western Region produced the highest
tonnage of Beans (275,000 Mt or 41.4%) followed by the Central with 156,000 Mt (or
23.5%). It is worth noting that all the four regions had increases in Beans production
between 1999/2000 and 2005/06 with the Northern Region (Note that the estimate for
the First Season of 2005 had a high CV) having the highest increase of 67.8 percent.
The Central Region had the least increase of 4 percent as shown in Figure 4.8.
Figure 4.8: Production of Beans by region
15091
59
195
496
156 13599
275
665
0
100
200
300
400
500
600
700
Central Eastern Northern Western NationalRegion
Prod
uctio
n ('0
00 M
etric
tons
)
UNHS 1999/2000 UNHS 2005/06
Source: UNHS 1995/96 and 1999/2000 Reports
Western Region topped beans production
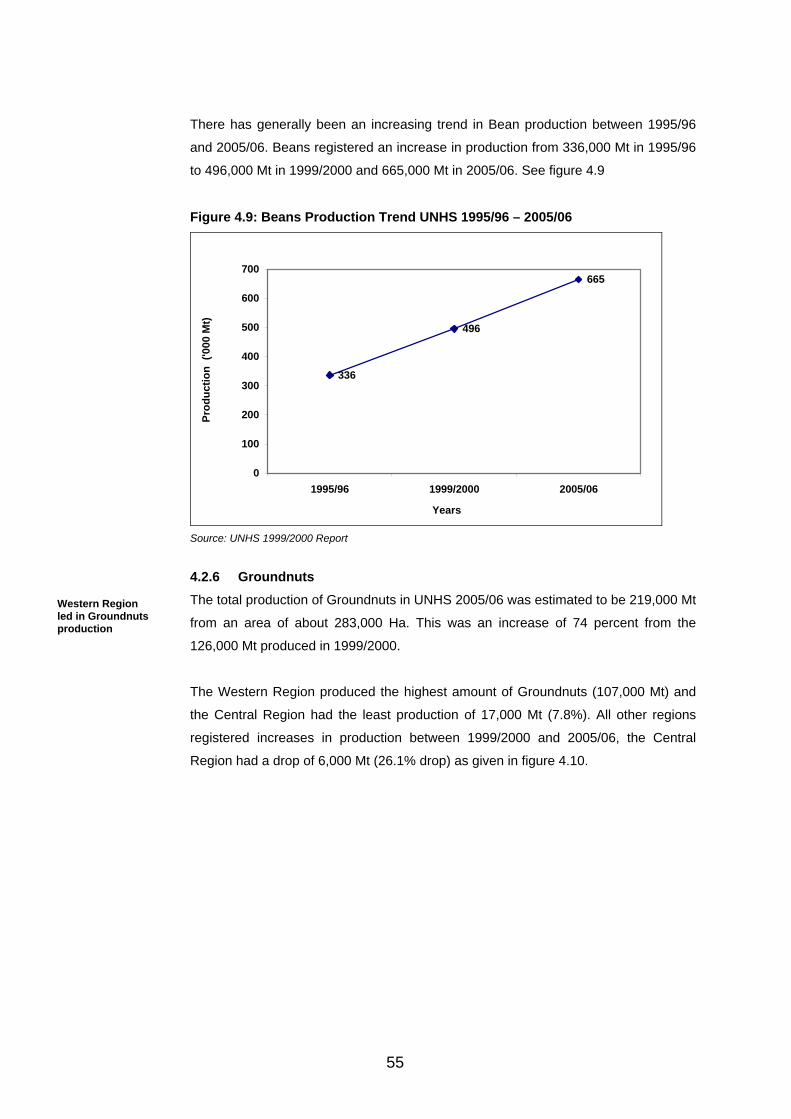
55
There has generally been an increasing trend in Bean production between 1995/96
and 2005/06. Beans registered an increase in production from 336,000 Mt in 1995/96
to 496,000 Mt in 1999/2000 and 665,000 Mt in 2005/06. See figure 4.9
Figure 4.9: Beans Production Trend UNHS 1995/96 – 2005/06
336
496
665
0
100
200
300
400
500
600
700
1995/96 1999/2000 2005/06
Years
Prod
uctio
n ('
000
Mt)
Source: UNHS 1999/2000 Report
4.2.6 Groundnuts The total production of Groundnuts in UNHS 2005/06 was estimated to be 219,000 Mt
from an area of about 283,000 Ha. This was an increase of 74 percent from the
126,000 Mt produced in 1999/2000.
The Western Region produced the highest amount of Groundnuts (107,000 Mt) and
the Central Region had the least production of 17,000 Mt (7.8%). All other regions
registered increases in production between 1999/2000 and 2005/06, the Central
Region had a drop of 6,000 Mt (26.1% drop) as given in figure 4.10.
Western Region led in Groundnuts production
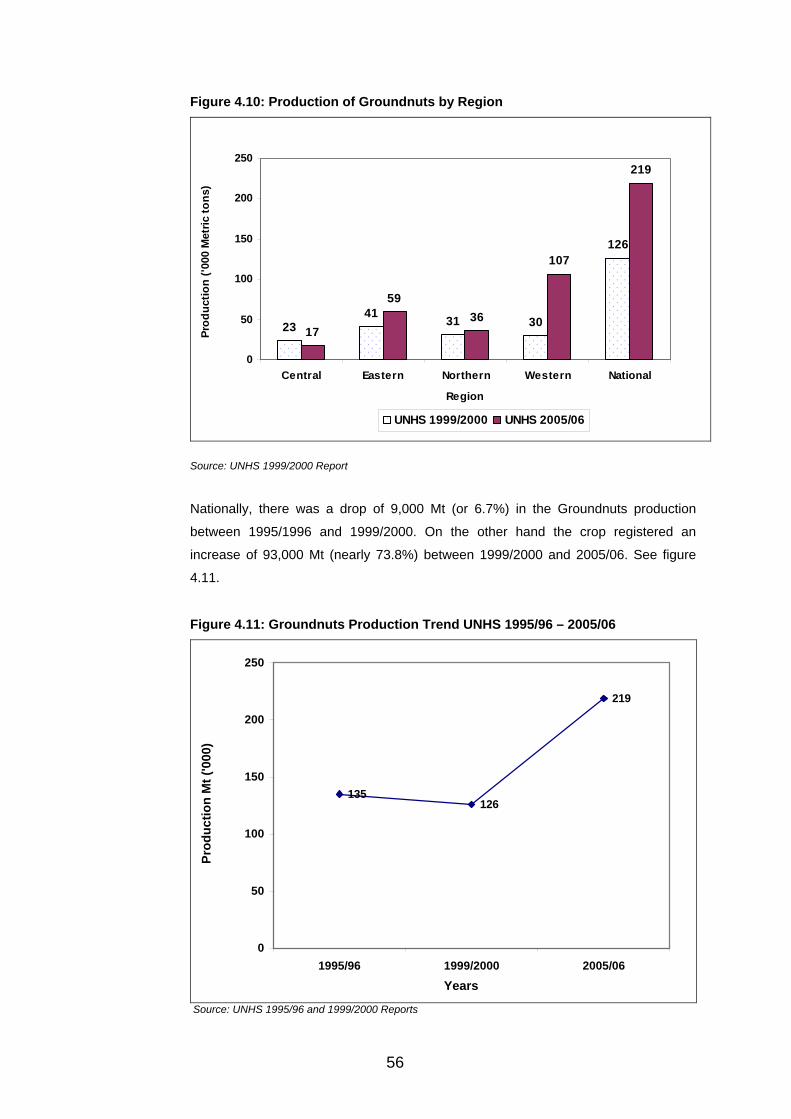
56
Figure 4.10: Production of Groundnuts by Region
2341 31 30
126
17
5936
107
219
0
50
100
150
200
250
Central Eastern Northern Western National
Region
Prod
uctio
n ('0
00 M
etric
tons
)
UNHS 1999/2000 UNHS 2005/06
Source: UNHS 1999/2000 Report
Nationally, there was a drop of 9,000 Mt (or 6.7%) in the Groundnuts production
between 1995/1996 and 1999/2000. On the other hand the crop registered an
increase of 93,000 Mt (nearly 73.8%) between 1999/2000 and 2005/06. See figure
4.11.
Figure 4.11: Groundnuts Production Trend UNHS 1995/96 – 2005/06
135126
219
0
50
100
150
200
250
1995/96 1999/2000 2005/06
Years
Prod
uctio
n M
t ('0
00)
Source: UNHS 1995/96 and 1999/2000 Reports
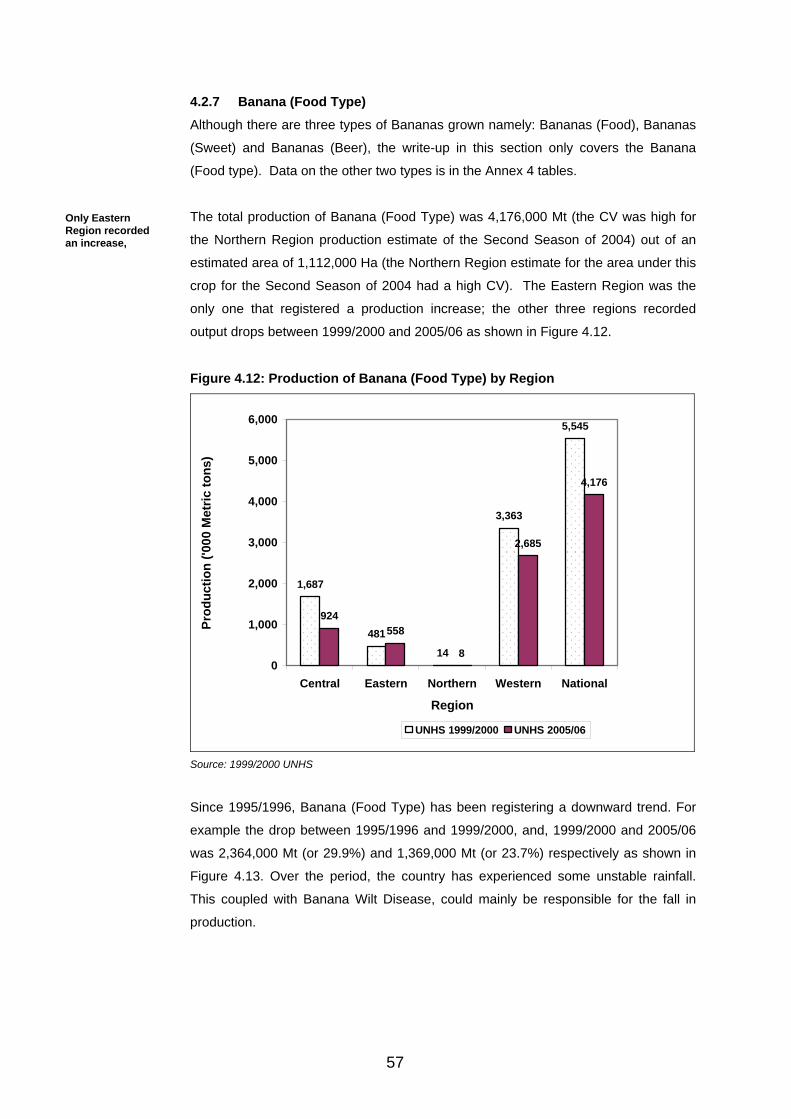
57
4.2.7 Banana (Food Type) Although there are three types of Bananas grown namely: Bananas (Food), Bananas
(Sweet) and Bananas (Beer), the write-up in this section only covers the Banana
(Food type). Data on the other two types is in the Annex 4 tables.
The total production of Banana (Food Type) was 4,176,000 Mt (the CV was high for
the Northern Region production estimate of the Second Season of 2004) out of an
estimated area of 1,112,000 Ha (the Northern Region estimate for the area under this
crop for the Second Season of 2004 had a high CV). The Eastern Region was the
only one that registered a production increase; the other three regions recorded
output drops between 1999/2000 and 2005/06 as shown in Figure 4.12.
Figure 4.12: Production of Banana (Food Type) by Region
1,687
481
14
3,363
5,545
924558
8
2,685
4,176
0
1,000
2,000
3,000
4,000
5,000
6,000
Central Eastern Northern Western National
Region
Prod
uctio
n ('0
00 M
etric
tons
)
UNHS 1999/2000 UNHS 2005/06
Source: 1999/2000 UNHS
Since 1995/1996, Banana (Food Type) has been registering a downward trend. For
example the drop between 1995/1996 and 1999/2000, and, 1999/2000 and 2005/06
was 2,364,000 Mt (or 29.9%) and 1,369,000 Mt (or 23.7%) respectively as shown in
Figure 4.13. Over the period, the country has experienced some unstable rainfall.
This coupled with Banana Wilt Disease, could mainly be responsible for the fall in
production.
Only Eastern Region recorded an increase,

58
Figure 4.13: Banana (Food Type) Production Trend UNHS 1995/96 – 2005/06
7909
5545
4176
0
1000
2000
3000
4000
5000
6000
7000
8000
9000
1995/96 1999/2000 2005/06Years
Prod
uctio
n M
t ('0
00)
Source: 1995/96 and 1999/2000 UNHS
4.2.8 Cassava The total output of cassava in 2005/06 was estimated to be 1,656,000 Mt from an
area of 1,070,000 Ha. This output was about 26.3 percent lower than 2,246,000 tons
produced in 1999/2000. The crop was largely produced in the Eastern Region with
590,000 Mt (35.6%); the Northern Region produced the least amount (340,000 Mt or
20.5%).
Unlike the Central Region which registered an increase of 156,000 Mt, the other three
regions recorded decreases between 1999/2000 and 2005/06, with the Eastern
Region having a substantial drop of about 623,000 Mt (51.4%). The possible
explanation for this drop could be mainly due to the effect of Cassava Mosaic Disease
well as Cassava Streak Disease or introduction of other crops with more value and
less bulky. The details on production are shown in Figure 4.14.
Cassava was largely produced by the Eastern Region
Only the Central Region recorded an increase

59
Figure 4.14: Production of Cassava by Region
195
1,213
457 381
2,246
351
590
340 375
1,656
0
500
1,000
1,500
2,000
2,500
Central Eastern Northern Western National
Region
Prod
uctio
n ('0
00 M
t)
UNHS 1999/2000 UNHS 2005/06
There has been a downward trend of cassava production since UNHS 1995/1996.
This is shown by production of 2,246,000 Mt in 1995/1996, 2,246,000 Mt in
1999/2000 and 1,656,000 Mt in UNHS 2005/06. The drop was 22.3 percent between
1995/1996 and 1999/2000. On the other hand the drop in production between
1999/2000 and 2005/06 was 26.3 percent. The performance of production trend is
shown in Figure 4.15
Figure 4.15: Cassava Production Trend UNHS 1995/96 – 2005/06
2746
2246
1656
0
500
1000
1500
2000
2500
3000
1995/96 1999/2000 2005/06Years
Prod
uctio
n M
t ('0
00)

60
4.2.9 Sweet Potatoes During 2005/06, the production of Sweet Potatoes was 1,695,000 Mt from an
estimated area of 672,000 Ha. In 1999/2000, the production was 2,620,000 Mt, which
was a drop.
It is observed that with the exception of the Northern Region (which registered an
increase), each of the remaining regions recorded a drop in production. The Eastern
Region produced the highest quantity of 831,000 Mt, and this was 49.0 percent of the
total production. This was followed by the Central Region with 405,000 Mt (or 23.9%).
The least quantity of 164,000 Mt (or 9.7%) was produced by the Northern Region.
Figure 4.16: Production of Sweet Potatoes by Region
507
1,029
51
1,034
2,620
405
831
164294
1,695
0
500
1,000
1,500
2,000
2,500
3,000
Central Eastern Northern Western National
Region
Prod
uctio
n ('0
00 M
etric
tons
)
UNHS 1999/2000 UNHS 2005/06
Like Cassava, Sweet potatoes registered a downward trend since 1995/96. The drop
between 1995/1996 and 1999/2000, and, between 1999/2000 and 2005/06 was
370,000 Mt (or 12.4%) and 925,000 Mt (or 35.5%) respectively as shown in Figure
4.17
All regions except Northern registered a decrease
Sweet Potatoes registered a downward trend
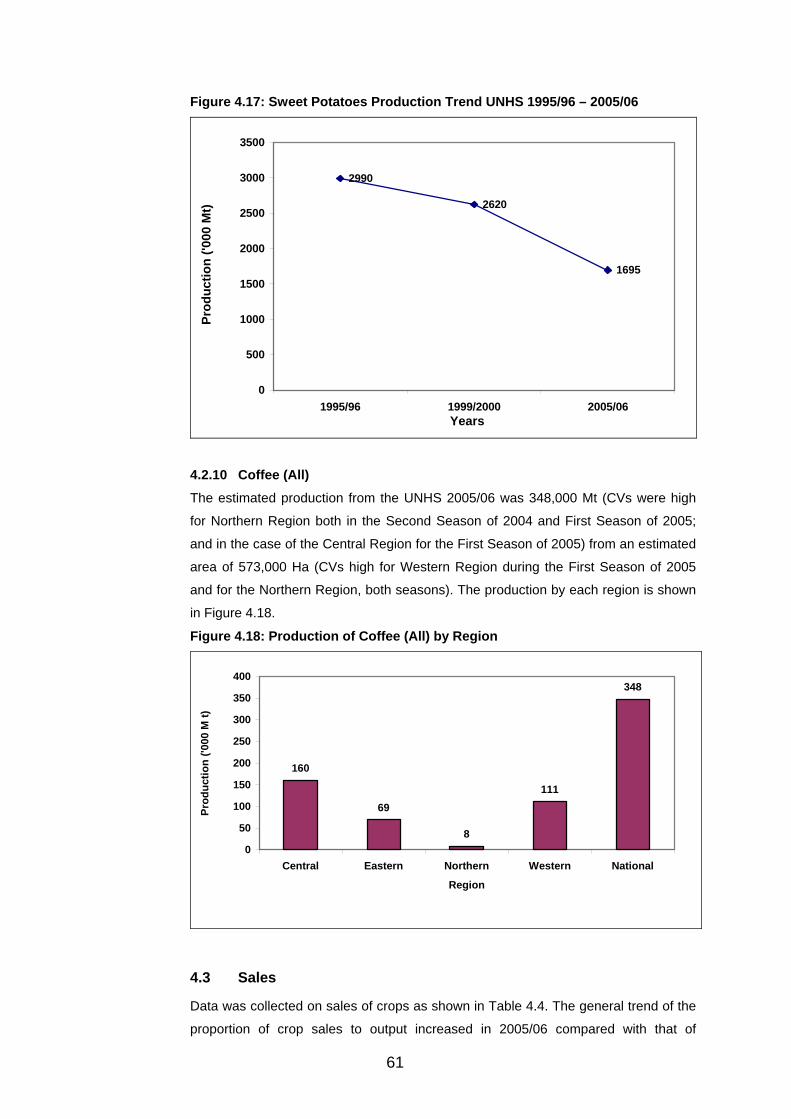
61
Figure 4.17: Sweet Potatoes Production Trend UNHS 1995/96 – 2005/06
2990
2620
1695
0
500
1000
1500
2000
2500
3000
3500
1995/96 1999/2000 2005/06Years
Prod
uctio
n ('0
00 M
t)
4.2.10 Coffee (All) The estimated production from the UNHS 2005/06 was 348,000 Mt (CVs were high
for Northern Region both in the Second Season of 2004 and First Season of 2005;
and in the case of the Central Region for the First Season of 2005) from an estimated
area of 573,000 Ha (CVs high for Western Region during the First Season of 2005
and for the Northern Region, both seasons). The production by each region is shown
in Figure 4.18.
Figure 4.18: Production of Coffee (All) by Region
160
69
8
111
348
0
50
100
150
200
250
300
350
400
Central Eastern Northern Western National
Region
Prod
uctio
n ('0
00 M
t)
4.3 Sales
Data was collected on sales of crops as shown in Table 4.4. The general trend of the
proportion of crop sales to output increased in 2005/06 compared with that of

62
1999/2000. The exceptions were Banana (Food type) and Cassava. The reason for
Cassava and Banana (Food-type) falls in terms of proportions sold could be that due
to high demand for household consumption, relatively big amounts were retained for
domestic consumption. The Sale proportions for the different crops over the period
1995/96 to 2005/06 are shown in Table 4.4.
Table 4.4: Proportion of Crop Sales to Output 1999/2000 – 2005/06
Crop type 1995/96 1999/2000 2005/06
Maize 44 14 52
Finger Millet 18 4 29
Sorghum 23 6 18
Beans 31 9 16
Field Peas 31 - 20
Pigeon Peas 19 - 11
Groundnuts 21 - 27
Simsim - - 41
Soya Beans 60 - 80
Cassava 16 61 23
Sweet Potatoes 6 25 26
Irish Potatoes 48 - 13
Banana ( Food Type) 17 44 32
Banana ( Beer Type) 55 15 29
Banana ( Sweet Type) 40 41 50 Note: - NA means Not available/covered during the survey
4.4 Crop Disposition (Utilization)
Apart from the sales, which are already discussed above, data was also collected on
crop utilization, disposition. This had other components namely quantity:
• For processed food;
• Given to landlords or proprietor;
• Already consumed;
• Still stored; and,
• Wasted after harvest.
Quantity wasted after harvest was obtained as a product of percent waste and
estimated production for each of the crops covered. For each of the crops, a
comparison was made between two estimates of production: one derived from the
summation of the quantities under utilization and the other one directly estimated from
quantities provided by the respondents.
Ideally, the two should have been equal but were not. The difference between them
was due to the fact that in the case of the farmers production estimate, condition and

63
state were provided which helped in applying Conversion Factors. On the other hand,
in the case of production derived from the components of utilization, with the
exception of sold quantities whose condition and state had been stated, the rest of
the components did not have them. Hence the estimated production from the
respondents was lower than the estimate derived from different utilization
components.
Mention of the causes of the difference has been made above, for purposes of
providing important lessons in future, so that the data accuracy can be improved.
4.5 Crop Plots, Area and Average Plot Sizes (APS)
This section deals with average plot sizes (APSs) which are computed from area (Ha)
and number of plots. The approach was to divide area (obtained by a summation of
area under pure and computed mixed stand) by number of plots (a summation of
plots under pure and mixed stand). Crops covered in this section are: Maize, Finger
Millet, Sorghum, Beans, Groundnuts, Cassava, Sweet Potatoes, Irish Potatoes and
Banana (Food-type), among others. Tables 4.5 – 4.11 formed the basis for providing
the data and information on Crop Area, Plots and APSs.
Table 4.5: Average Plot sizes (Ha) 2005/06
Crop Crop Area1 (Ha) (‘000) Number of Plots2 (‘000) Average plot size (Ha)
Maize 1,539 8,422 0.18
Finger millet 262 1,353 0.19
Sorghum 328 1,678 0.20
Beans 873 6,599 0.13
Field peas 27 127 0.22
Pigeon peas 22 192 0.12
Groundnuts 283 1,851 0.15
Simsim 109 430 0.25
Soya beans 31 229 0.14
Cassava 1,070 7,376 0.15
Sweet potatoes 672 4,704 0.14
Irish potatoes 47 494 0.10
Banana (food-type) 1,112 6,214 0.18
Banana beer 299 1,943 0.15
Banana sweet 66 999 0.07
Coffee all 572 3,505 0.16
Tea 40 27 1.48
Cocoa 54 134 0.40
Cotton 200 484 0.41
Tobacco 24 102 0.23
Notes: 1. Total of pure and imputed mixed crop areas
2. Both Pure and mixed
Average plot size obtained by a division of Area (ha) by number of Plots
64
4.5.1 Maize The total number of plots under Maize was estimated to be 8,422,000. Of these,
3,523,000 (41.8%) were in the second season of 2004 and 4,899,000 (58.2%) were
in the First Season of 2005.
Total estimated area under the crop was 1,539,000 Ha, implying that the APS was
0.18 Ha. During 1995/96 and 1999/2000 the APS was estimated at 0.20 and 0.28 Ha.
This means that there has been a drop in the APS. One of the major explanations for
this could be that the number of Ag HHs is increasing and yet the area with maize
growing potential is relatively fixed. This explanation could be applicable to other
similar observation on the APSs of other crops.
4.5.2 Finger Millet The total number of plots under Finger Millet was estimated to be 686,000 during the
second season of 2004 and 667,000 in the First Season of 2005. The total for these
two seasons was 1,353,000. APS was estimated at 0.19 Ha which was lower than
0.27 Ha in 1995/96 and 0.32 Ha during 1999/2000.
4.5.3 Sorghum The total number of plots under Sorghum was estimated to be 1,678,000 of which
644,000 (38.4%) were in the Second Season of 2004 and 1,034,000 (61.6%) were in
the First Season of 2005. The APS was 0.20 Ha compared with 0.27 Ha recorded for
both 1995/96 and 1999/2000.
4.5.4 Beans During the Second Season of 2004, the number of plots under beans was 3,313,000
(50.2%). For the First Season of 2005, the number was 3,287,000 (49.8%). The APS
was 0.13 Ha. Once more, this was smaller than 0.17 Ha recorded in 1995/96 and
0.21 Ha in 1999/2000.
4.5.5 Groundnuts The Groundnut crop was grown on 1,851,000 plots of which 772,000 and 1,079,000
were in the Second Season of 2004 and First Season of 2005 respectively; their
respective percentages were 41.7 percent and 58.3 percent. The average plot size
was 0.15 Ha, a fall from 0.25 Ha in 1999/2000.
4.5.6 Cassava In terms of number of plots, Cassava with 7,376,000 was the second most important
crop after Maize. Of these, 3,073,000 (41.7%) were in the Second Season of 2004
and 4,303,000 (58.3%) were in the First Season of 2005. The APS size was 0.15 Ha
down from 0.26 Ha in 1999/2000.
Nearly 60% of plots were in First Season 2005
Maize APS registered a decrease
Plots were about equal in 2004 and 2005
There was a fall in APS
APS fell from 0.27 (1995 & 1999) to 0.2 Ha to 2005/06
A fall from 0.21 Ha to 0.13 Ha
Decreased APS from 0.25 Ha to 0.15 Ha
APS fell from 0.26 Ha to 0.15 Ha
65
4.5.7 Sweet Potatoes The total number of plots under Sweet Potatoes was estimated to be 4,704,000 of
which 1,945,000 (41.3%) were in Second Season of 2004 and 2,759,000 (58.7%)
were in the First Season of 2005. The average plot size was 0.14 Ha which was the
same as recorded in 1995/96. However, the APS was 0.16 in 1999/2000.
4.5.8 Irish Potatoes This crop was grown on 494,000 plots (CVs for the estimated plots were high for the
Eastern Region (both Seasons) and, the Northern Region (First Season of 2005)) of
which 237,000 (48.0%) were in the Second Season of 2004 and 256,000 (52.0%)
were in the First Season of 2005. The average plot size rose from 0.14Ha in 1995/96
to 0.16Ha in 1999/2000 and dropped to 0.10 Ha in 2005/06.
4.5.9 Banana (Food-type) The total number of plots under this crop was 6,214,000. It is observed that from the
point of plot number, this crop was the fourth most important after Maize, Cassava,
and, Beans. During the second season of 2004, the number of plots was 2,993,000
(48.2%) and 3,221,000 plots or 51.8 percent for the First Season of 2005. The
average plot size was 0.18 Ha.
For 1995/96 and 1999/2000, the average plot size was 0.24 and 0.26 Ha respectively;
it is worth-noting however that for 1995/96, this average was computed for all types of
banana (i.e. Food, Beer and Sweet). In general, the APS is decreasing.
4.5.10 Coffee (All) The estimated total number of plots was 3,505,000 (CVs for the Northern Region for
both seasons were high). They were almost equally divided between the two
seasons. The APS was 0.16 Ha.
4.6 Summary of Findings
Although many crops were covered in the survey, the focuses on nine crops namely:
Maize, Finger Millet, Sorghum, Rice, Beans, Ground nuts, Bananas (Food Type),
Cassava, and Sweet Potatoes and Coffee (All). For the other crops, either Cvs were
high or observations few or both and therefore could not be reported on. Estimates of
plots, area and production were computed for the data within District and are the ones
provided in this report. Estimates from within Enumeration Areas (EAs) and outside
the district can be accessed in UBOS.
The findings show that production for Bananas (Food-Type), Cassava and Sweet
Potatoes registered a drop compared with quantities produced in 1999/2000. For
Bananas (Food-Type), Banana Wilt Disease is likely to have affected the production.
APS decreased from 0.16 Ha to 0.14 Ha
APS decreased from 0.16 Ha to 0.10 Ha
Only banana (Food type) covered
A fall in APS from 0.26 Ha to 0.18 Ha

66
In the case of Cassava, both the Cassava Mosaic Disease and Streak Disease may
have adversely impacted on its production. Regarding Sweet Potatoes, poor rainfall
distribution could have been a major factor in reducing production.
However, Maize, Sorghum, Finger Millet, Beans and Groundnuts registered increases
compared with the quantities produced in the UNHS 1999/2000.
The CVs for crop production were generally higher than for both crop plots and area.
About half of the crops had CVs higher than 40% or less than 25 observations or both
namely: Field Peas, Pigeon Peas, Simsim, Soya Beans, Banana (Beer), Tea,
Tobacco, Cocoa, Cotton and Groundnuts. It was the widely grown crops that had
acceptable CVs.
It can therefore be concluded that for some crops it is necessary to use other
methods of data collection other than the one used in Household Surveys. Such
crops include tea, tobacco, cocoa, cotton and to some extent coffee. The current
approach to use bottlenecks in the marketing chain may offer better data.
For the food crops whose estimates had high CVs, either the sample size should be
increased, or there is need to construct and use appropriate Sampling Frames.

67
CHAPTER FIVE: LIVESTOCK AND POULTRY NUMBERS
5.1 Introduction
The survey collected information on livestock, poultry and other related animals
owned by the household, on earnings from the sale of such animals, expenditures on
purchases, and in general on the dynamics of such animals over the reference
period.
It is worth noting that the reference periods varied for different subsections; cattle and
pack animals figures were collected using a 12 months recall period, while small
stock (i.e. Goats, Sheep and Pigs) had a reference period of 6 months. In addition,
poultry and other related animals had a reference period of 3 months prior to the
survey date.
In addition, data on livestock/poultry was collected regardless of whether the
livestock/poultry were inside or outside the Enumeration Area (EA). This approach to
data collection could have a bearing on the numbers compared with collection
confined to within selected EAs. The tendency with this approach would be to
overestimate the numbers.
5.2 Cattle Rearing
5.2.1 Distribution of Ag HHs that reared Indigenous Cattle The survey findings show that out of the approximately 4.2 million Ag HHs, there were
about 1.1 million Ag HHs with Indigenous Cattle, which was 26.8 percent. This implies
that the majority of the Ag HHs (73.2%) do not rear this type of cattle.
Out of the 1.1 million Ag HHs that reported rearing Indigenous Cattle, 37.6 percent
were in the Eastern Region followed by the Central Region (25.6%). The Western
Region recorded the least percentage (15.8%) Ag HHs as shown in Table 5.1.
Table 5.1: Number of Agric HHs with indigenous Cattle (‘000)
Number of Agricultural Households: Region
With (%)
Central 285 25.8 Eastern 416 37.7 Northern 229 20.7 Western 175 15.8
Total 1,106 100
A comparison of households that reared indigenous cattle at the national level shows
that there was an increase from 19.6 percent in PHC 2002 to 26.6 percent in UNHS
Out of 10 Agricultural HHs 3 reared indigenous Cattle
Eastern Region recorded highest number of Ag HHs with indigenous cattle
Eastern and Central recorded reasonable increases
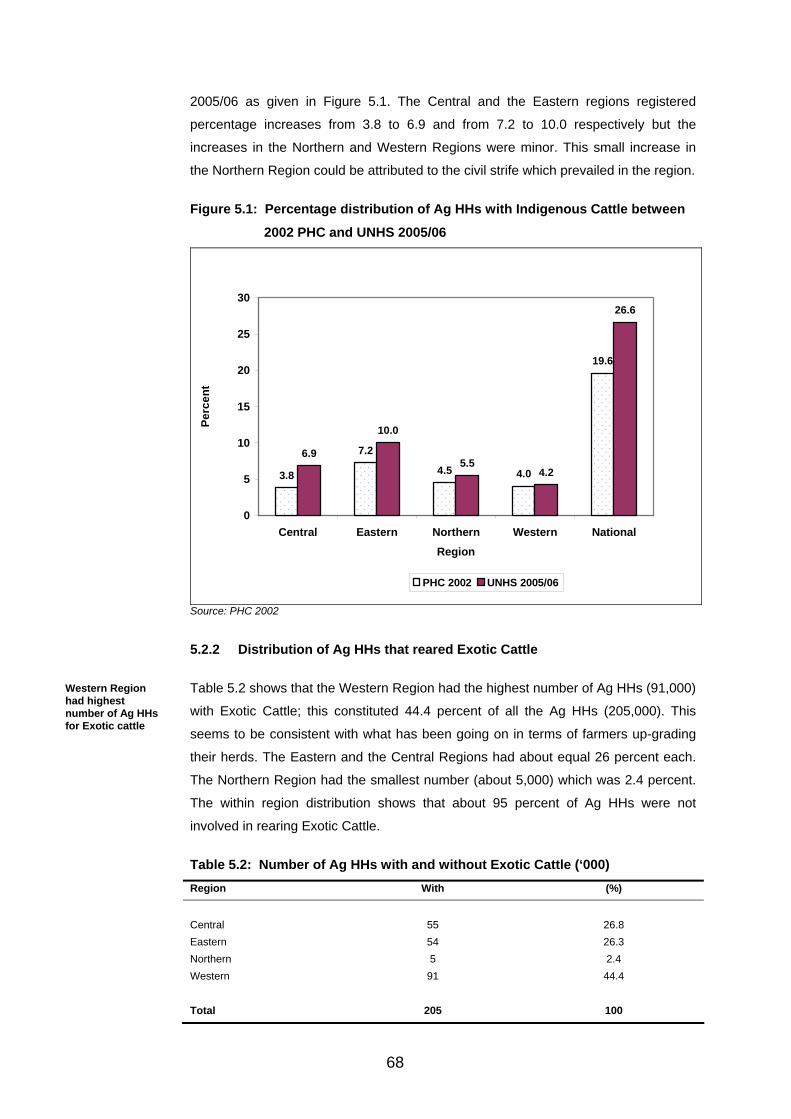
68
2005/06 as given in Figure 5.1. The Central and the Eastern regions registered
percentage increases from 3.8 to 6.9 and from 7.2 to 10.0 respectively but the
increases in the Northern and Western Regions were minor. This small increase in
the Northern Region could be attributed to the civil strife which prevailed in the region.
Figure 5.1: Percentage distribution of Ag HHs with Indigenous Cattle between
2002 PHC and UNHS 2005/06
3.8
7.2
4.5 4.0
19.6
6.9
10.0
5.54.2
26.6
0
5
10
15
20
25
30
Central Eastern Northern Western NationalRegion
Perc
ent
PHC 2002 UNHS 2005/06
Source: PHC 2002 5.2.2 Distribution of Ag HHs that reared Exotic Cattle
Table 5.2 shows that the Western Region had the highest number of Ag HHs (91,000)
with Exotic Cattle; this constituted 44.4 percent of all the Ag HHs (205,000). This
seems to be consistent with what has been going on in terms of farmers up-grading
their herds. The Eastern and the Central Regions had about equal 26 percent each.
The Northern Region had the smallest number (about 5,000) which was 2.4 percent.
The within region distribution shows that about 95 percent of Ag HHs were not
involved in rearing Exotic Cattle.
Table 5.2: Number of Ag HHs with and without Exotic Cattle (‘000) Region With (%)
Central 55 26.8 Eastern 54 26.3 Northern 5 2.4 Western 91 44.4 Total 205 100
Western Region had highest number of Ag HHs for Exotic cattle
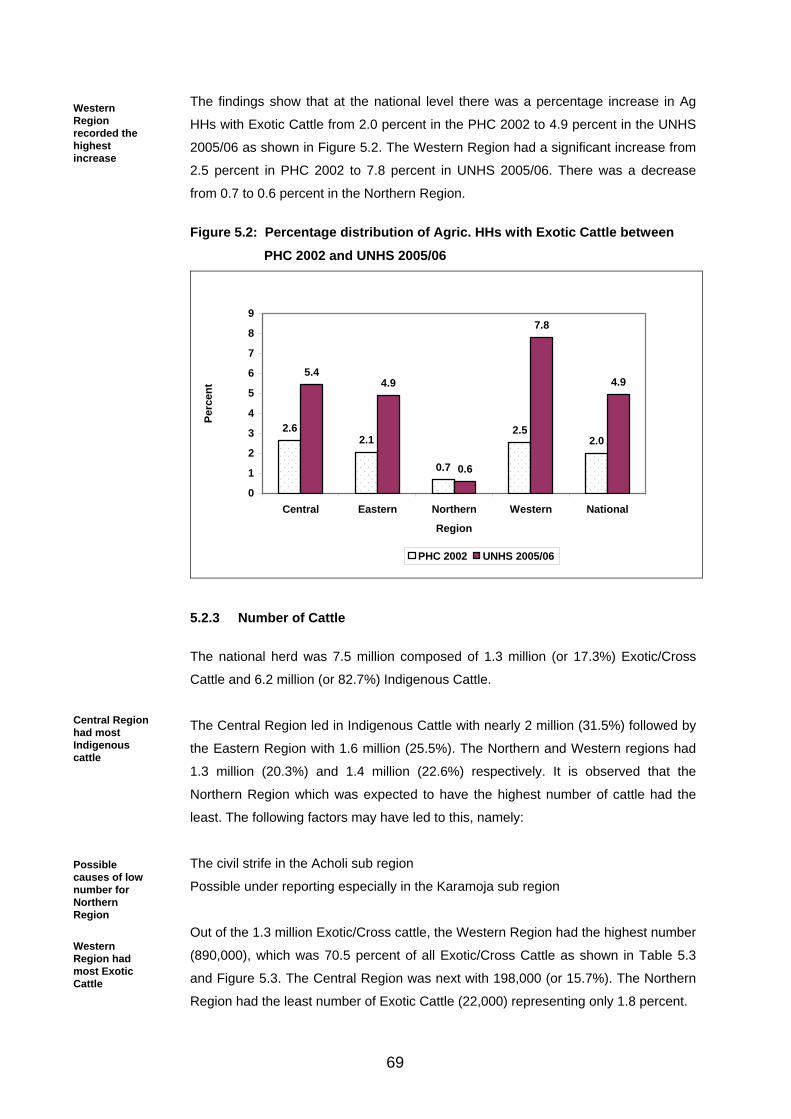
69
The findings show that at the national level there was a percentage increase in Ag
HHs with Exotic Cattle from 2.0 percent in the PHC 2002 to 4.9 percent in the UNHS
2005/06 as shown in Figure 5.2. The Western Region had a significant increase from
2.5 percent in PHC 2002 to 7.8 percent in UNHS 2005/06. There was a decrease
from 0.7 to 0.6 percent in the Northern Region.
Figure 5.2: Percentage distribution of Agric. HHs with Exotic Cattle between
PHC 2002 and UNHS 2005/06
2.62.1
0.7
2.52.0
5.44.9
0.6
7.8
4.9
0
1
2
3
4
5
6
7
8
9
Central Eastern Northern Western National
Region
Perc
ent
PHC 2002 UNHS 2005/06
5.2.3 Number of Cattle
The national herd was 7.5 million composed of 1.3 million (or 17.3%) Exotic/Cross
Cattle and 6.2 million (or 82.7%) Indigenous Cattle.
The Central Region led in Indigenous Cattle with nearly 2 million (31.5%) followed by
the Eastern Region with 1.6 million (25.5%). The Northern and Western regions had
1.3 million (20.3%) and 1.4 million (22.6%) respectively. It is observed that the
Northern Region which was expected to have the highest number of cattle had the
least. The following factors may have led to this, namely:
The civil strife in the Acholi sub region
Possible under reporting especially in the Karamoja sub region
Out of the 1.3 million Exotic/Cross cattle, the Western Region had the highest number
(890,000), which was 70.5 percent of all Exotic/Cross Cattle as shown in Table 5.3
and Figure 5.3. The Central Region was next with 198,000 (or 15.7%). The Northern
Region had the least number of Exotic Cattle (22,000) representing only 1.8 percent.
Western Region recorded the highest increase
Central Region had most Indigenous cattle
Possible causes of low number for Northern Region Western Region had most Exotic Cattle
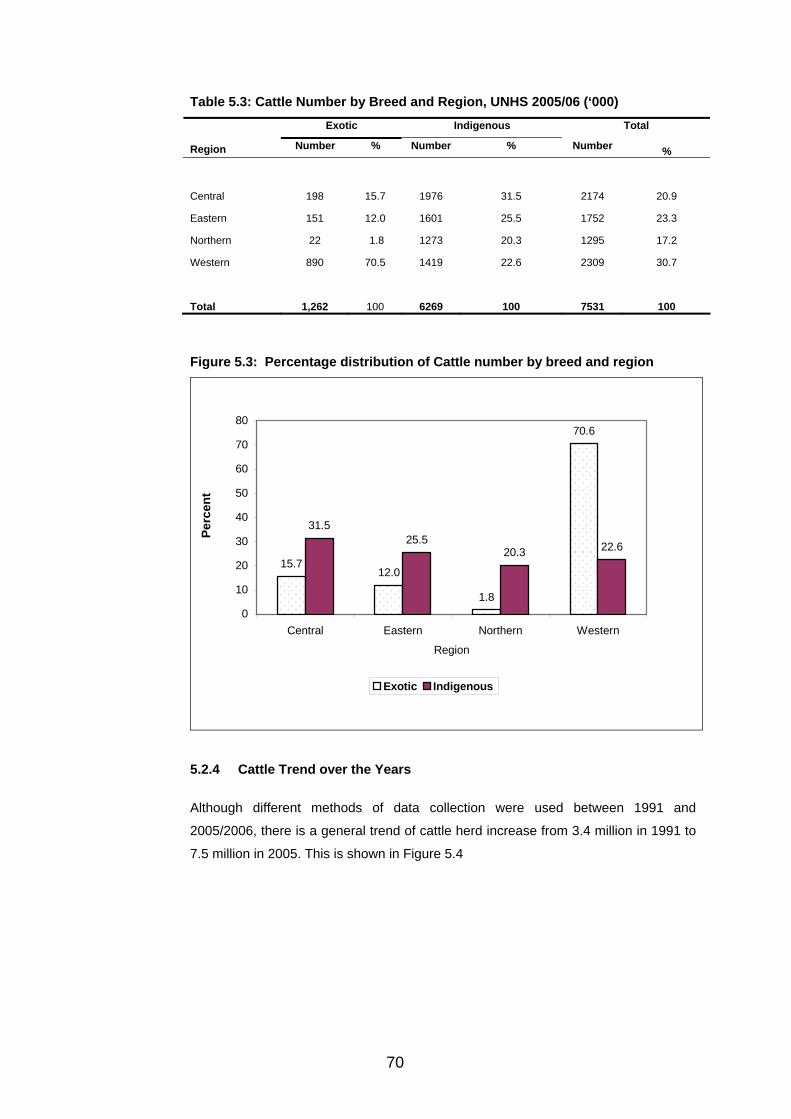
70
Table 5.3: Cattle Number by Breed and Region, UNHS 2005/06 (‘000) Exotic Indigenous Total
Region Number % Number % Number %
Central 198 15.7 1976 31.5 2174 20.9
Eastern 151 12.0 1601 25.5 1752 23.3
Northern 22 1.8 1273 20.3 1295 17.2
Western 890 70.5 1419 22.6 2309 30.7
Total 1,262 100 6269 100 7531 100
Figure 5.3: Percentage distribution of Cattle number by breed and region
15.712.0
1.8
70.6
31.525.5
20.3 22.6
0
10
20
30
40
50
60
70
80
Central Eastern Northern Western
Region
Perc
ent
Exotic Indigenous
5.2.4 Cattle Trend over the Years Although different methods of data collection were used between 1991 and
2005/2006, there is a general trend of cattle herd increase from 3.4 million in 1991 to
7.5 million in 2005. This is shown in Figure 5.4
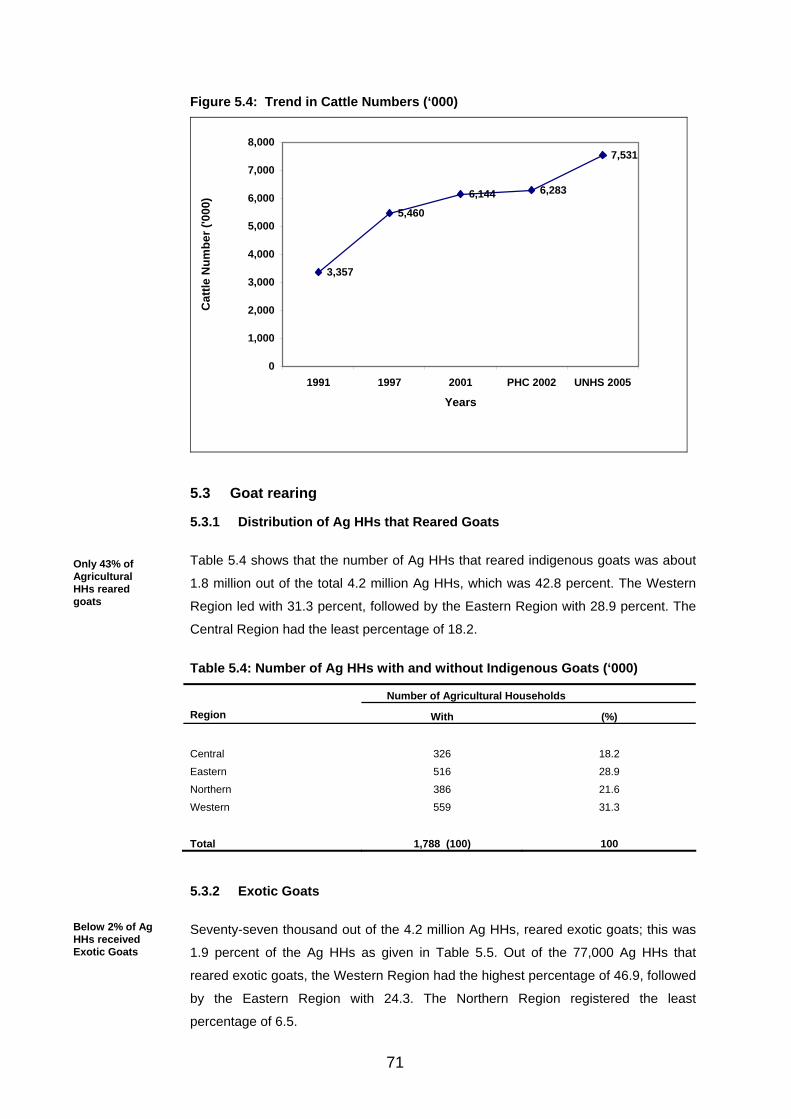
71
Figure 5.4: Trend in Cattle Numbers (‘000)
3,357
5,460
6,144 6,283
7,531
0
1,000
2,000
3,000
4,000
5,000
6,000
7,000
8,000
1991 1997 2001 PHC 2002 UNHS 2005
Years
Cat
tle N
umbe
r ('0
00)
5.3 Goat rearing
5.3.1 Distribution of Ag HHs that Reared Goats Table 5.4 shows that the number of Ag HHs that reared indigenous goats was about
1.8 million out of the total 4.2 million Ag HHs, which was 42.8 percent. The Western
Region led with 31.3 percent, followed by the Eastern Region with 28.9 percent. The
Central Region had the least percentage of 18.2.
Table 5.4: Number of Ag HHs with and without Indigenous Goats (‘000)
Number of Agricultural Households
Region With (%)
Central 326 18.2
Eastern 516 28.9
Northern 386 21.6
Western 559 31.3
Total 1,788 (100) 100 5.3.2 Exotic Goats Seventy-seven thousand out of the 4.2 million Ag HHs, reared exotic goats; this was
1.9 percent of the Ag HHs as given in Table 5.5. Out of the 77,000 Ag HHs that
reared exotic goats, the Western Region had the highest percentage of 46.9, followed
by the Eastern Region with 24.3. The Northern Region registered the least
percentage of 6.5.
Only 43% of Agricultural HHs reared goats
Below 2% of Ag HHs received Exotic Goats
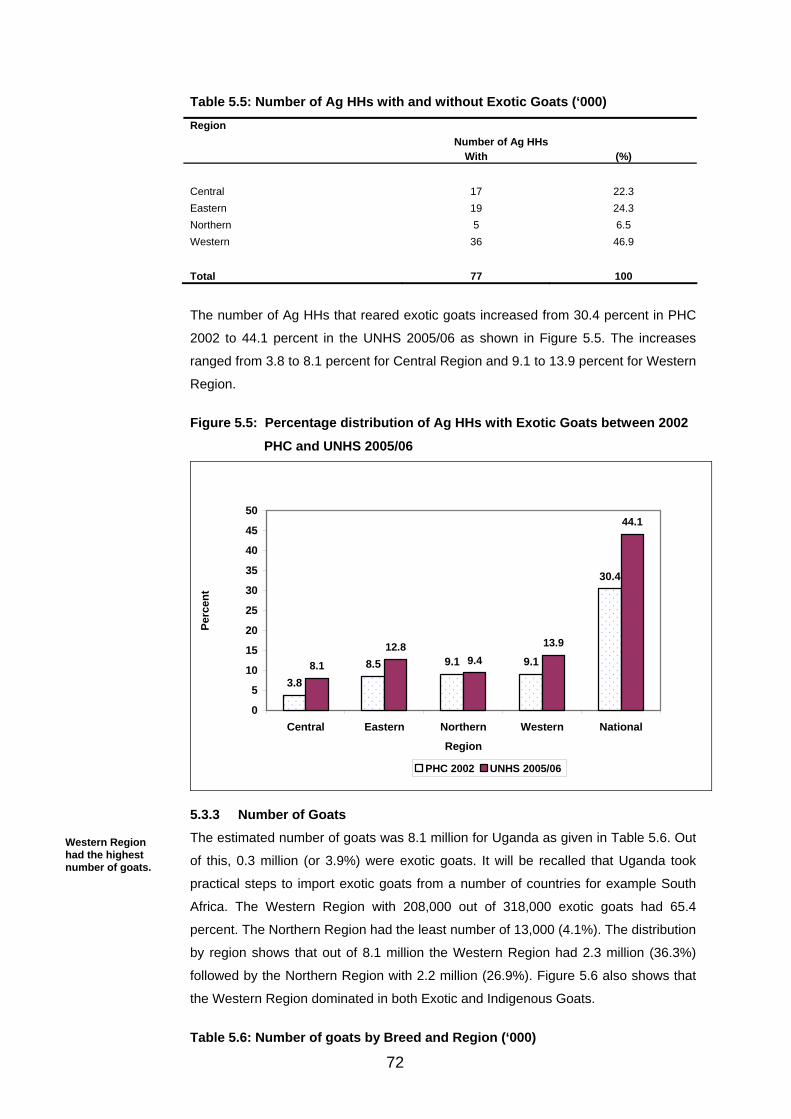
72
Table 5.5: Number of Ag HHs with and without Exotic Goats (‘000)
Number of Ag HHs Region
With (%) Central 17 22.3 Eastern 19 24.3 Northern 5 6.5 Western 36 46.9
Total 77 100
The number of Ag HHs that reared exotic goats increased from 30.4 percent in PHC
2002 to 44.1 percent in the UNHS 2005/06 as shown in Figure 5.5. The increases
ranged from 3.8 to 8.1 percent for Central Region and 9.1 to 13.9 percent for Western
Region.
Figure 5.5: Percentage distribution of Ag HHs with Exotic Goats between 2002
PHC and UNHS 2005/06
3.88.5 9.1 9.1
30.4
8.1
12.89.4
13.9
44.1
0
5
10
15
20
25
30
35
40
45
50
Central Eastern Northern Western National
Region
Perc
ent
PHC 2002 UNHS 2005/06
5.3.3 Number of Goats The estimated number of goats was 8.1 million for Uganda as given in Table 5.6. Out
of this, 0.3 million (or 3.9%) were exotic goats. It will be recalled that Uganda took
practical steps to import exotic goats from a number of countries for example South
Africa. The Western Region with 208,000 out of 318,000 exotic goats had 65.4
percent. The Northern Region had the least number of 13,000 (4.1%). The distribution
by region shows that out of 8.1 million the Western Region had 2.3 million (36.3%)
followed by the Northern Region with 2.2 million (26.9%). Figure 5.6 also shows that
the Western Region dominated in both Exotic and Indigenous Goats.
Table 5.6: Number of goats by Breed and Region (‘000)
Western Region had the highest number of goats.
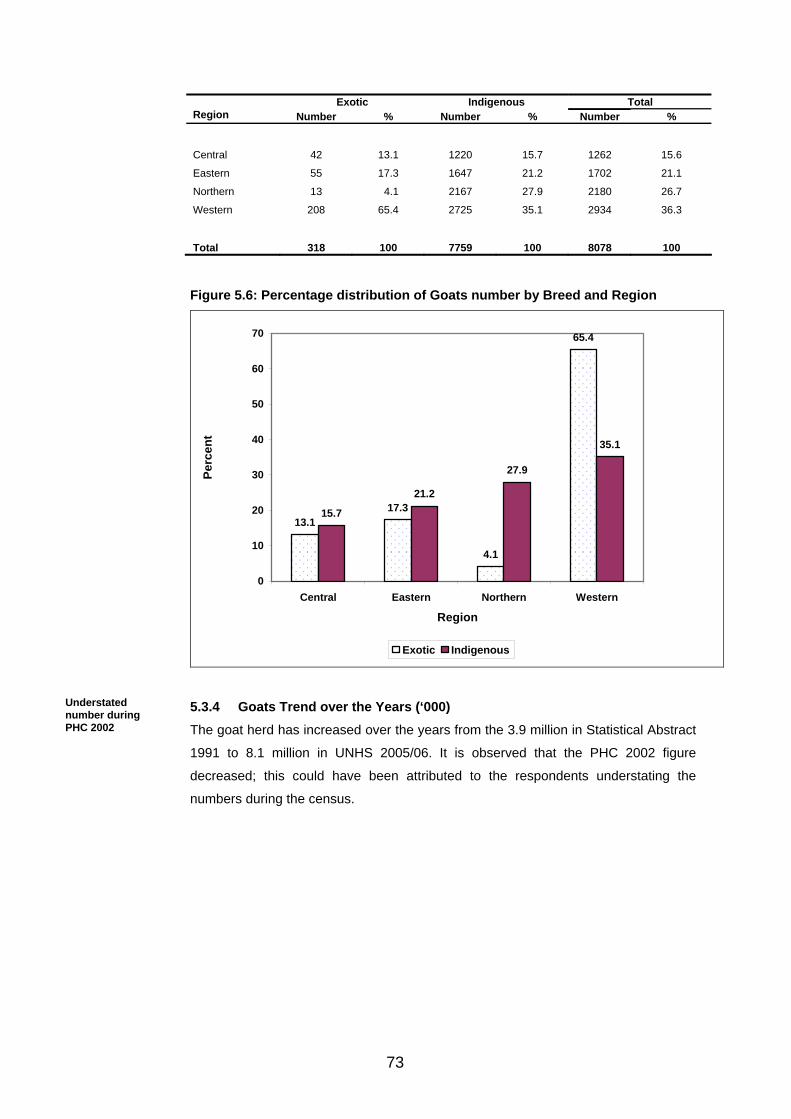
73
Exotic Indigenous Total Region Number % Number % Number %
Central 42 13.1 1220 15.7 1262 15.6
Eastern 55 17.3 1647 21.2 1702 21.1
Northern 13 4.1 2167 27.9 2180 26.7
Western 208 65.4 2725 35.1 2934 36.3
Total 318 100 7759 100 8078 100 Figure 5.6: Percentage distribution of Goats number by Breed and Region
13.117.3
4.1
65.4
15.7
21.2
27.9
35.1
0
10
20
30
40
50
60
70
Central Eastern Northern Western
Region
Perc
ent
Exotic Indigenous
5.3.4 Goats Trend over the Years (‘000) The goat herd has increased over the years from the 3.9 million in Statistical Abstract
1991 to 8.1 million in UNHS 2005/06. It is observed that the PHC 2002 figure
decreased; this could have been attributed to the respondents understating the
numbers during the census.
Understated number during PHC 2002
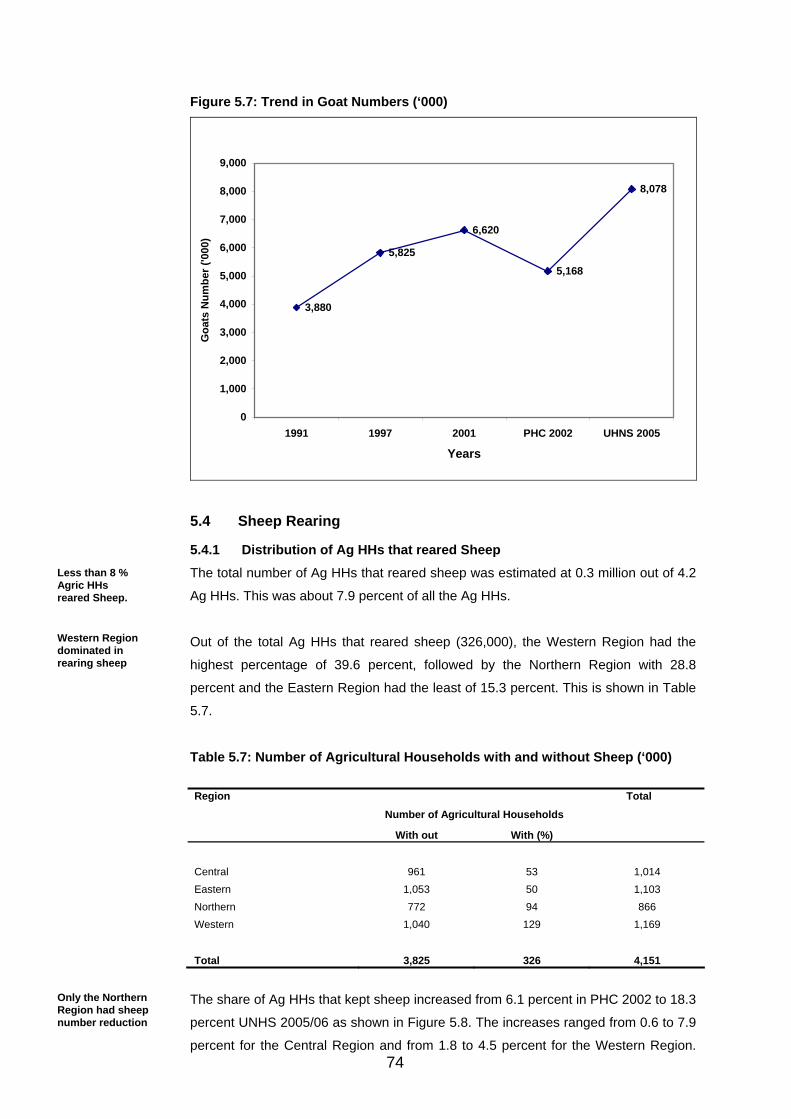
74
Figure 5.7: Trend in Goat Numbers (‘000)
3,880
5,825
6,620
5,168
8,078
0
1,000
2,000
3,000
4,000
5,000
6,000
7,000
8,000
9,000
1991 1997 2001 PHC 2002 UHNS 2005
Years
Goa
ts N
umbe
r ('0
00)
5.4 Sheep Rearing
5.4.1 Distribution of Ag HHs that reared Sheep The total number of Ag HHs that reared sheep was estimated at 0.3 million out of 4.2
Ag HHs. This was about 7.9 percent of all the Ag HHs.
Out of the total Ag HHs that reared sheep (326,000), the Western Region had the
highest percentage of 39.6 percent, followed by the Northern Region with 28.8
percent and the Eastern Region had the least of 15.3 percent. This is shown in Table
5.7.
Table 5.7: Number of Agricultural Households with and without Sheep (‘000)
Number of Agricultural Households Region
With out With (%)
Total
Central 961 53 1,014 Eastern 1,053 50 1,103 Northern 772 94 866 Western 1,040 129 1,169
Total 3,825 326 4,151
The share of Ag HHs that kept sheep increased from 6.1 percent in PHC 2002 to 18.3
percent UNHS 2005/06 as shown in Figure 5.8. The increases ranged from 0.6 to 7.9
percent for the Central Region and from 1.8 to 4.5 percent for the Western Region.
Less than 8 % Agric HHs reared Sheep. Western Region dominated in rearing sheep
Only the Northern Region had sheep number reduction
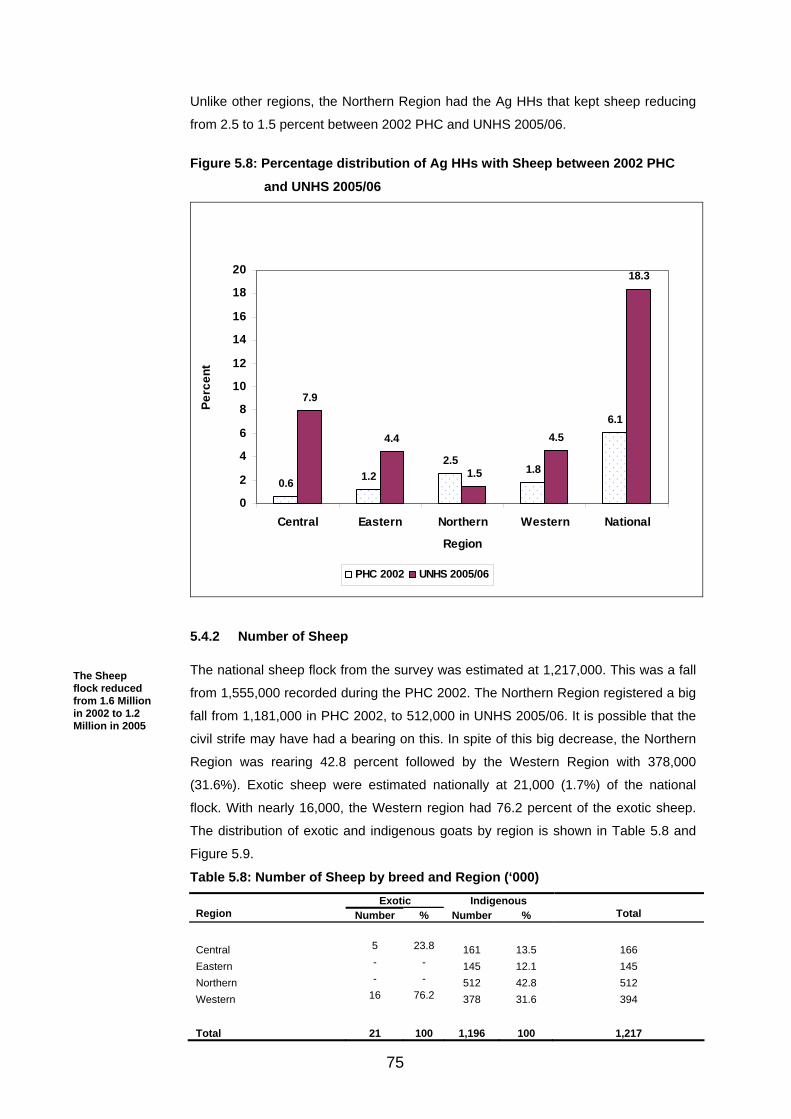
75
Unlike other regions, the Northern Region had the Ag HHs that kept sheep reducing
from 2.5 to 1.5 percent between 2002 PHC and UNHS 2005/06.
Figure 5.8: Percentage distribution of Ag HHs with Sheep between 2002 PHC
and UNHS 2005/06
0.6 1.22.5
1.8
6.1
7.9
4.4
1.5
4.5
18.3
0
2
4
6
8
10
12
14
16
18
20
Central Eastern Northern Western National
Region
Perc
ent
PHC 2002 UNHS 2005/06
5.4.2 Number of Sheep
The national sheep flock from the survey was estimated at 1,217,000. This was a fall
from 1,555,000 recorded during the PHC 2002. The Northern Region registered a big
fall from 1,181,000 in PHC 2002, to 512,000 in UNHS 2005/06. It is possible that the
civil strife may have had a bearing on this. In spite of this big decrease, the Northern
Region was rearing 42.8 percent followed by the Western Region with 378,000
(31.6%). Exotic sheep were estimated nationally at 21,000 (1.7%) of the national
flock. With nearly 16,000, the Western region had 76.2 percent of the exotic sheep.
The distribution of exotic and indigenous goats by region is shown in Table 5.8 and
Figure 5.9.
Table 5.8: Number of Sheep by breed and Region (‘000) Exotic Indigenous
Region Number % Number % Total
Central 5 23.8 161 13.5 166 Eastern - - 145 12.1 145 Northern - - 512 42.8 512 Western 16 76.2 378 31.6 394 Total 21 100 1,196 100 1,217
The Sheep flock reduced from 1.6 Million in 2002 to 1.2 Million in 2005

76
Figure 5.9: Percentage distribution of Sheep by Breed and Region
25.8
0.0 0.0
74.2
13.5 12.1
42.8
31.6
0
10
20
30
40
50
60
70
80
Central Eastern Northern Western
Region
Perc
ent
Exotic Indigenous
Trend in Sheep Numbers (‘000)
The sheep flock trend over the years shows a general increase although there was a
fall in the estimate from the UNHS 2005/06 as given in Figure 5.10. This seems to
have come as a result of a substantial fall in the estimate of the Northern Region,
where the biggest proportion of the national flock is expected to be. It is possible that
the respondents grossly under-stated the number. Another contributing factor could
be that the flock size was reduced due to the civil strife in the sub-region.
Figure 5.10: Sheep Trend (‘000)
744
9801,108
1,555
1,217
0
200
400
600
800
1,000
1,200
1,400
1,600
1,800
1991 1997 2001 PHC 2002 UHNS2005/06
Years
Shee
p N
umbe
r ('0
00)
Northern region had the biggest reduction possibly due Civil strife

77
5.5 Distribution of Ag HHs that reared Pigs, by region
5.5.1 Pigs There were nearly 0.8 million Ag HHs that reared pigs out of the 4.2 million country-
wide. This constituted 18.3 percent of all Ag HHs.
The regional distribution was dominated by the Central Region with 329,000 (43.29%)
Ag HHs rearing pigs as shown in Table 5.9. This number is backed by an observation
that pork consumption is more common in the region than in any other region. The
Central Region was followed by the Western Region with 187,000 (24.5%). On the
other hand, the Northern Region had the least number of Ag HHs rearing pigs
(61,000 or 8.0%).
Table 5.9: Number of Ag HHs with Pigs (‘000)
Number of Agricultural Households:
Region
Number %
Central 329 43.2
Eastern 185 24.3
Northern 61 8.0
Western 187 24.5
Total 761 100
5.5.2 Numbers of Pigs The number of pigs for Uganda was estimated to be 1,707,000 which was a
substantial increase from 773,000 recorded during PHC 2002 as given in Table 5.10
and Figure 5.11. With 835,000, the Central Region had 48.9 percent of the pigs,
followed by the Eastern region with 387,000 (22.7%). The Northern Region had the
least number of 138,000 (8.1%).
Table 5.10: Number of Pigs UNHS 2005/06 (‘000)
Region Number of Pigs
Central 835
Eastern 387
Northern 138
Western 347
Total 1,707
Central region had the highest number of Agric. HHs with pigs

78
Figure 5.11: Percentage Distribution of Pigs by Region
48.9
22.6
8.1
20.3
0.0
10.0
20.0
30.0
40.0
50.0
60.0
Central Eastern Northern Western
Region
Perc
ent
5.5.3 Trend in Pig Numbers (‘000) In general, the number of pigs has been increasing except for PHC 2002 where there
was a drastic fall from 1.6 million (Statistical Abstract) to 0.8 million pigs (PHC 2002)
as shown in Figure 5.12. It is highly probable that there must have been some under-
reporting by respondents in PHC 2002.
Figure 5.12: Pigs Trend (‘000)
672
1,425
1,644
773
1,708
0
200
400
600
800
1,000
1,200
1,400
1,600
1,800
1991 1997 2001 PHC 2002 UNHS2005/06
Years
Pig
Num
ber (
'000
)
A fall was recorded only in PHC 2002
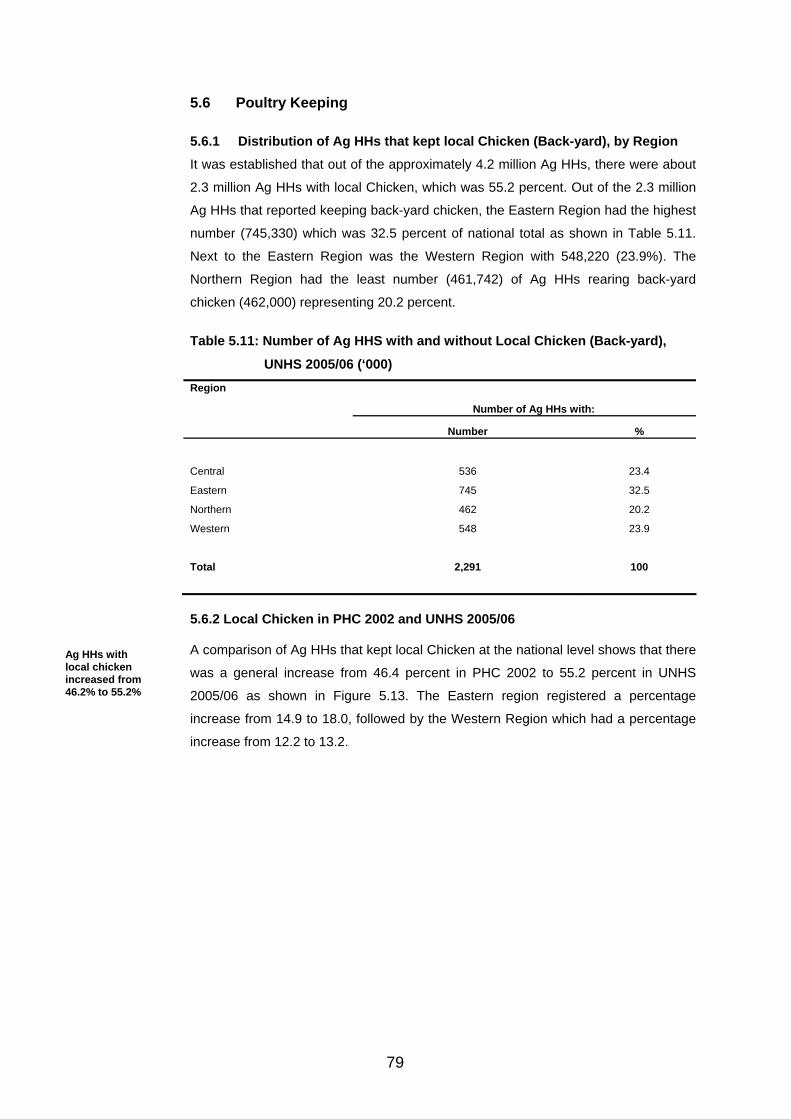
79
5.6 Poultry Keeping
5.6.1 Distribution of Ag HHs that kept local Chicken (Back-yard), by Region It was established that out of the approximately 4.2 million Ag HHs, there were about
2.3 million Ag HHs with local Chicken, which was 55.2 percent. Out of the 2.3 million
Ag HHs that reported keeping back-yard chicken, the Eastern Region had the highest
number (745,330) which was 32.5 percent of national total as shown in Table 5.11.
Next to the Eastern Region was the Western Region with 548,220 (23.9%). The
Northern Region had the least number (461,742) of Ag HHs rearing back-yard
chicken (462,000) representing 20.2 percent.
Table 5.11: Number of Ag HHS with and without Local Chicken (Back-yard),
UNHS 2005/06 (‘000)
Number of Ag HHs with:
Region
Number %
Central 536 23.4
Eastern 745 32.5
Northern 462 20.2
Western 548 23.9
Total 2,291 100
5.6.2 Local Chicken in PHC 2002 and UNHS 2005/06 A comparison of Ag HHs that kept local Chicken at the national level shows that there
was a general increase from 46.4 percent in PHC 2002 to 55.2 percent in UNHS
2005/06 as shown in Figure 5.13. The Eastern region registered a percentage
increase from 14.9 to 18.0, followed by the Western Region which had a percentage
increase from 12.2 to 13.2.
Ag HHs with local chicken increased from 46.2% to 55.2%
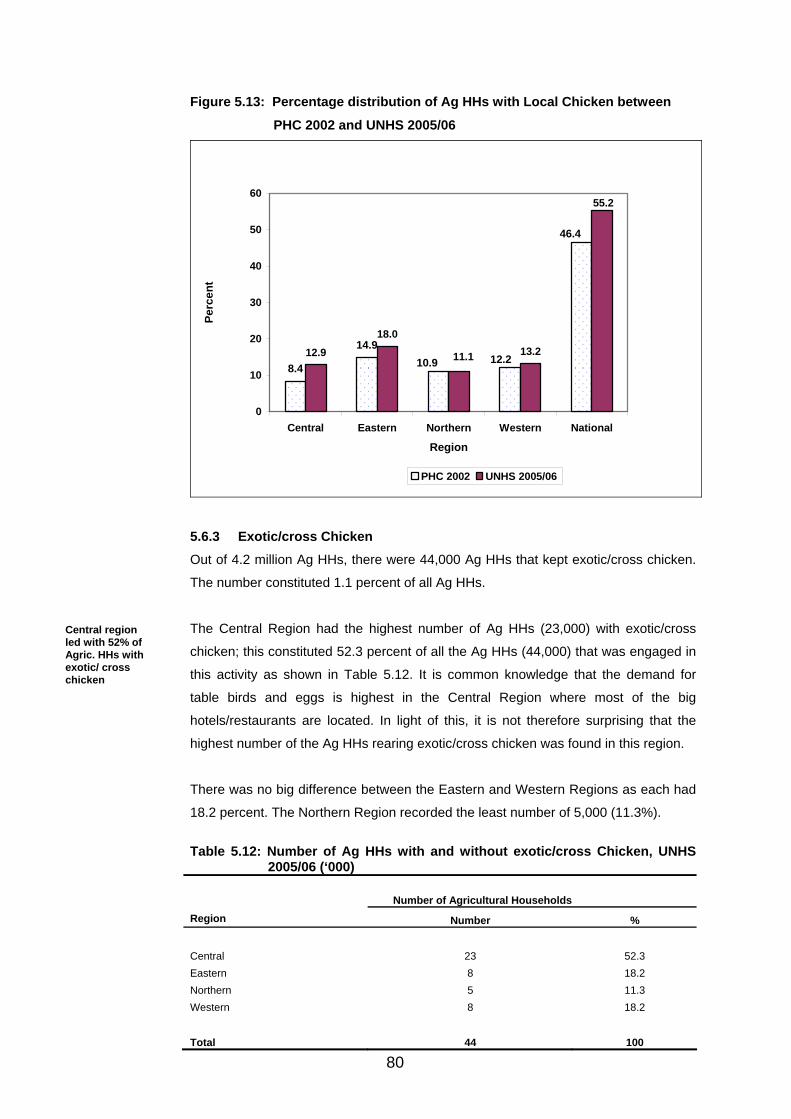
80
Figure 5.13: Percentage distribution of Ag HHs with Local Chicken between
PHC 2002 and UNHS 2005/06
8.4
14.912.9
18.013.2
46.4
12.210.9
55.2
11.1
0
10
20
30
40
50
60
Central Eastern Northern Western National
Region
Perc
ent
PHC 2002 UNHS 2005/06
5.6.3 Exotic/cross Chicken Out of 4.2 million Ag HHs, there were 44,000 Ag HHs that kept exotic/cross chicken.
The number constituted 1.1 percent of all Ag HHs.
The Central Region had the highest number of Ag HHs (23,000) with exotic/cross
chicken; this constituted 52.3 percent of all the Ag HHs (44,000) that was engaged in
this activity as shown in Table 5.12. It is common knowledge that the demand for
table birds and eggs is highest in the Central Region where most of the big
hotels/restaurants are located. In light of this, it is not therefore surprising that the
highest number of the Ag HHs rearing exotic/cross chicken was found in this region.
There was no big difference between the Eastern and Western Regions as each had
18.2 percent. The Northern Region recorded the least number of 5,000 (11.3%).
Table 5.12: Number of Ag HHs with and without exotic/cross Chicken, UNHS
2005/06 (‘000)
Number of Agricultural Households Region Number %
Central 23 52.3 Eastern 8 18.2 Northern 5 11.3 Western 8 18.2
Total 44 100
Central region led with 52% of Agric. HHs with exotic/ cross chicken
81
A comparison of Ag HHs that kept exotic/cross Chicken at the national level shows
that there was a small increase from 0.7 percent in PHC 2002 to 1.1 percent in UNHS
2005/06.
The Central Region registered a percentage change from 0.3 to 0.6 as shown in
Figure 5.14. The Western and Eastern Regions had a similar percentage change,
from 0.1 to 0.2. For the Northern Region, there was no percentage change.
Figure 5.14: Percentage distribution of Ag HHs with exotic/cross Chicken
between 2002 PHC and UNHS 2005/06
0.3
0.1 0.1 0.1
0.7
0.6
0.20.1
0.2
1.1
0.0
0.2
0.4
0.6
0.8
1.0
1.2
Central Eastern Northern Western National
Region
Perc
ent
PHC 2002 UNHS 2005/06
5.6.4 Number of Chicken The national chicken flock, which was 23.5 million composed of 3.7 million (15.8%)
exotic/cross Chicken and 19.8 million (84.2%) back-yard.
Regarding back-yard Local Chicken, the Eastern Region had the highest share of
nearly 7.4 million birds (37.3%). The Central and Northern regions followed closely
with 4.3 million (21.7%) and 4.2 million (21.3%) respectively. The Western Region
with 3.9 million had the least number of Local Chicken among the four regions.
Out of the 3.7 million exotic/cross chicken national wide, the Central Region had the
biggest number with 2.4 million (64.5%) and the Northern Region had the least with
0.05 million (1.3%) as shown in Table 5.13 and Figure 5.15.
Western & Eastern Region had similar % age change
Chicken number was about 24 Million
Central Region had 2/3 of exotic chicken

82
Table 5.13: Number of Chicken by breed and region (‘000)
Exotic Local Chicken/ Backyard Region
Number % Number % Total
Central 2,398 64.5 4291
21.7 6,689
Eastern 854 23.0 7382
37.3 8,236
Northern 49 1.3 4227
21.3 4,276
Western 416 11.2 3905
19.7 4,322
-
Total 3,717 100 19,806
100 23,523 Figure 5.15: Percentage distribution of Chicken number by breed and region
64.5
23.0
1.3
11.2
21.7
37.3
21.3 19.7
0
10
20
30
40
50
60
70
Central Eastern Northern Western
Region
Perc
ent
Exotic Indigenous
5.6.5 Chicken Trend over the Years Although there was a general increase in the number of chicken (exotic plus local)
between 1991 and 2005/06 from 11.4 to 23.5 million, a sharp fall in the number was
observed in PHC, 2002. It should be noted however, that the trend data does not
come from similar methods of data collection. This could partly explain some of the
differences as shown in Figure 5.16.There were most likely understating of chicken
numbers in the PHC 2002, particularly the young ones.
Over the year there was a general increase
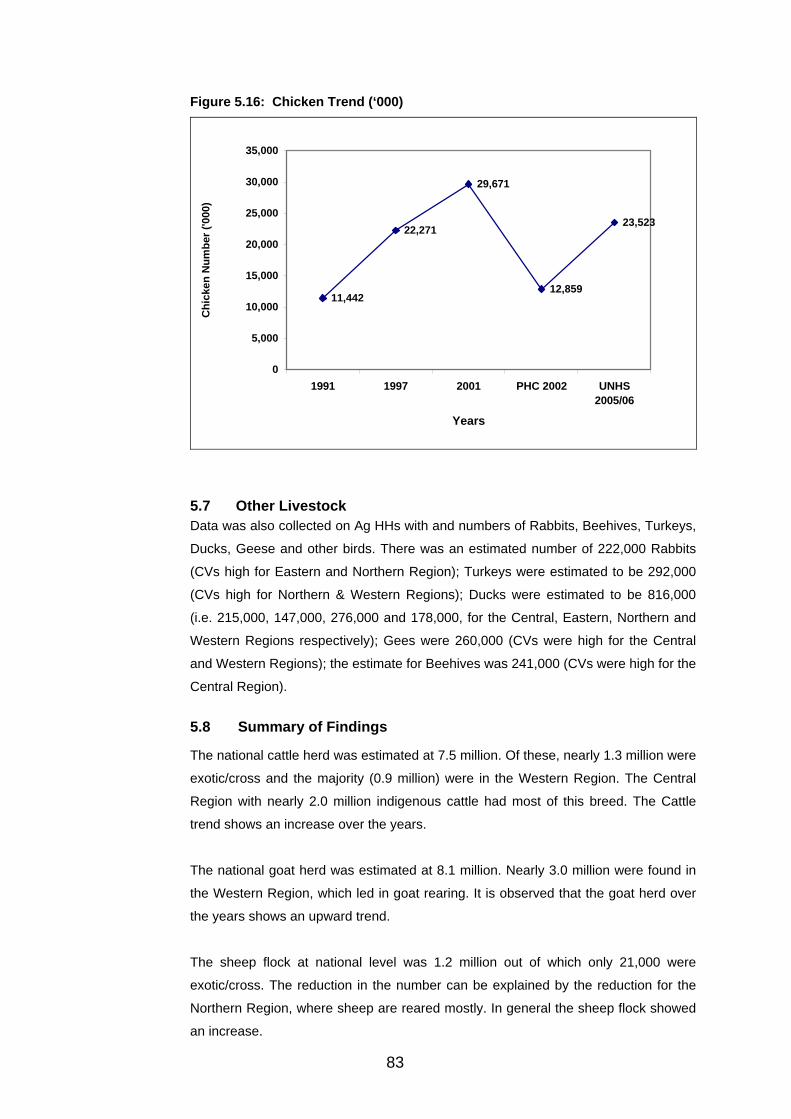
83
Figure 5.16: Chicken Trend (‘000)
11,442
22,271
29,671
12,859
23,523
0
5,000
10,000
15,000
20,000
25,000
30,000
35,000
1991 1997 2001 PHC 2002 UNHS2005/06
Years
Chi
cken
Num
ber (
'000
)
5.7 Other Livestock Data was also collected on Ag HHs with and numbers of Rabbits, Beehives, Turkeys,
Ducks, Geese and other birds. There was an estimated number of 222,000 Rabbits
(CVs high for Eastern and Northern Region); Turkeys were estimated to be 292,000
(CVs high for Northern & Western Regions); Ducks were estimated to be 816,000
(i.e. 215,000, 147,000, 276,000 and 178,000, for the Central, Eastern, Northern and
Western Regions respectively); Gees were 260,000 (CVs were high for the Central
and Western Regions); the estimate for Beehives was 241,000 (CVs were high for the
Central Region).
5.8 Summary of Findings
The national cattle herd was estimated at 7.5 million. Of these, nearly 1.3 million were
exotic/cross and the majority (0.9 million) were in the Western Region. The Central
Region with nearly 2.0 million indigenous cattle had most of this breed. The Cattle
trend shows an increase over the years.
The national goat herd was estimated at 8.1 million. Nearly 3.0 million were found in
the Western Region, which led in goat rearing. It is observed that the goat herd over
the years shows an upward trend.
The sheep flock at national level was 1.2 million out of which only 21,000 were
exotic/cross. The reduction in the number can be explained by the reduction for the
Northern Region, where sheep are reared mostly. In general the sheep flock showed
an increase.
84
The pigs were estimated to be nearly 1.7 million at national level. With 835,000
(49.1%) the Central Region had most pigs. The Northern Region had 138,000 (or
8.1%). The National trend showed an increase in pig population over the years.
The total number of chicken was 23.5 million, of which 3.7 million (15.7%) were exotic
/cross and the local chicken/ backyard were 19.8 million (84.3%). Generally, over the
years, the chicken population has shown an upward trend except for PHC 2002
where the number was low. The 2001 figure is very high and this is because there
was a different method of getting the estimate from that one used in UNHS 2005/06.
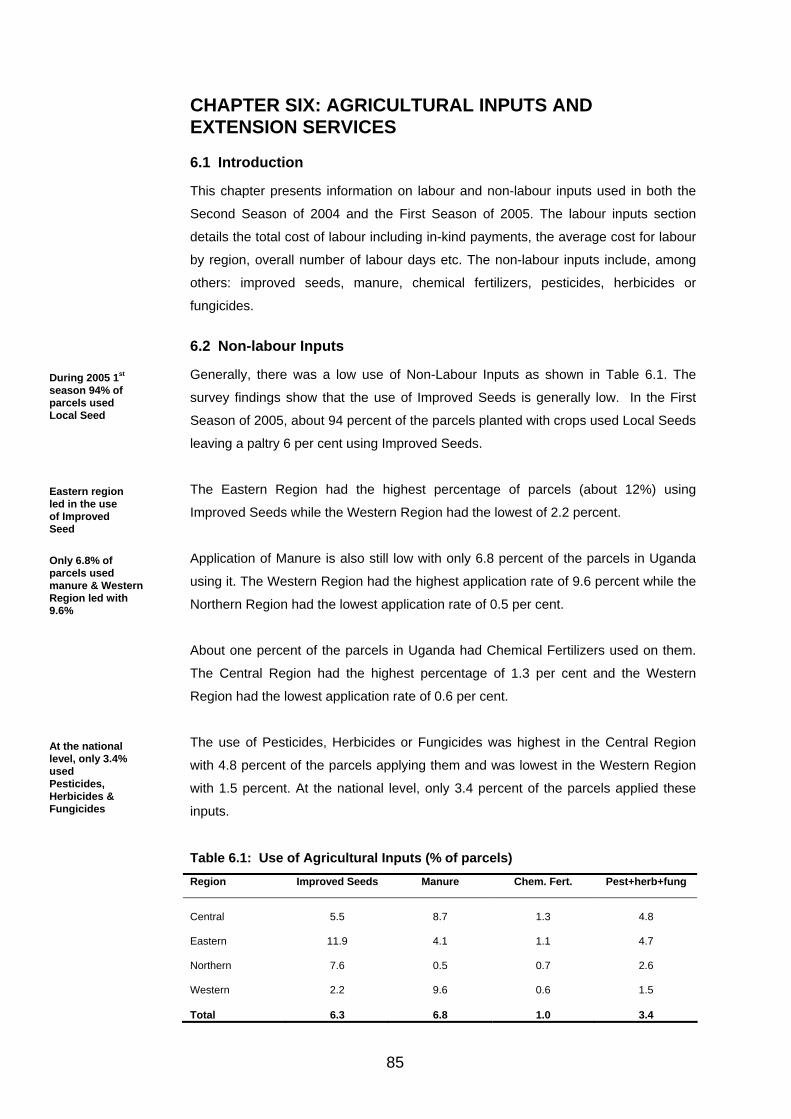
85
CHAPTER SIX: AGRICULTURAL INPUTS AND EXTENSION SERVICES
6.1 Introduction
This chapter presents information on labour and non-labour inputs used in both the
Second Season of 2004 and the First Season of 2005. The labour inputs section
details the total cost of labour including in-kind payments, the average cost for labour
by region, overall number of labour days etc. The non-labour inputs include, among
others: improved seeds, manure, chemical fertilizers, pesticides, herbicides or
fungicides.
6.2 Non-labour Inputs
Generally, there was a low use of Non-Labour Inputs as shown in Table 6.1. The
survey findings show that the use of Improved Seeds is generally low. In the First
Season of 2005, about 94 percent of the parcels planted with crops used Local Seeds
leaving a paltry 6 per cent using Improved Seeds.
The Eastern Region had the highest percentage of parcels (about 12%) using
Improved Seeds while the Western Region had the lowest of 2.2 percent.
Application of Manure is also still low with only 6.8 percent of the parcels in Uganda
using it. The Western Region had the highest application rate of 9.6 percent while the
Northern Region had the lowest application rate of 0.5 per cent.
About one percent of the parcels in Uganda had Chemical Fertilizers used on them.
The Central Region had the highest percentage of 1.3 per cent and the Western
Region had the lowest application rate of 0.6 per cent.
The use of Pesticides, Herbicides or Fungicides was highest in the Central Region
with 4.8 percent of the parcels applying them and was lowest in the Western Region
with 1.5 percent. At the national level, only 3.4 percent of the parcels applied these
inputs.
Table 6.1: Use of Agricultural Inputs (% of parcels) Region Improved Seeds Manure Chem. Fert. Pest+herb+fung
Central 5.5 8.7 1.3 4.8 Eastern 11.9 4.1 1.1 4.7 Northern 7.6 0.5 0.7 2.6 Western 2.2 9.6 0.6 1.5 Total 6.3 6.8 1.0 3.4
During 2005 1st season 94% of parcels used Local Seed
Eastern region led in the use of Improved Seed Only 6.8% of parcels used manure & Western Region led with 9.6%
At the national level, only 3.4% used Pesticides, Herbicides & Fungicides

86
Overall, the reported values of non-labour inputs were lower in the Second Season of
2004 compared with the First Season of 2005. This was the case with seeds and
seedlings as well as pesticides/herbicides. However, Manure registered a decline
as a result of a decrease in average value in Eastern, Northern and Central Regions.
Average value of chemical fertilizers for those Ag HHs (Ag HHs) utilizing them stayed
more or less the same for both seasons except for the Central Region as shown in
Tables 6.2 and 6.3.
Table 6.2: Average value of Non-Labour Inputs used in crop farming Second
Season of 2004 (‘000 shs)
Central Eastern Northern Western Uganda
Purchased seeds and seedlings 12 11 6 8 9
Chemical fertilizers 49 25 41 54 37
Pesticides, herbicides 18 12 8 15 14
Manure 59 10 9 49 48
Table 6.3: Average value of Non-Labour Inputs used in crop farming: First
Season of 2005 (‘000 shs) Region
Type of Input Central Eastern Northern Western Uganda Purchased seeds and seedlings 13 15 6 10 11
Chemical fertilizers 21 25 41 54 37
Pesticides, herbicides 19 10 7 42 18
Manure 26 6 1 63 34
6.3 Labour Inputs
6.3.1 Number of Labour Days The number of Labour Days for the Second Season of 2004 and the First Season of
2005 totaled 1,263 million with Hired Labour Days as 116 million (9%) while 1,147
million (91%) was household supplied as shown in Table 6.4 and Figure 6.1 . The
Western Region registered the highest amount of both hired labour days 47 million
which constituted 3.7 percent of total labour days. Each of The Central and the
Northern Regions registered the smallest percentage of hired labour days (1.7%).
Both the Eastern and Western Regions had about the same number of labour days
which was 28.6 percent.
Generally values were lower in the 2nd season 2004 than in 1st season 2005
Hired Labour was only 9.2% of all labour used
The Western region had the highest hired labour days (47 Million)
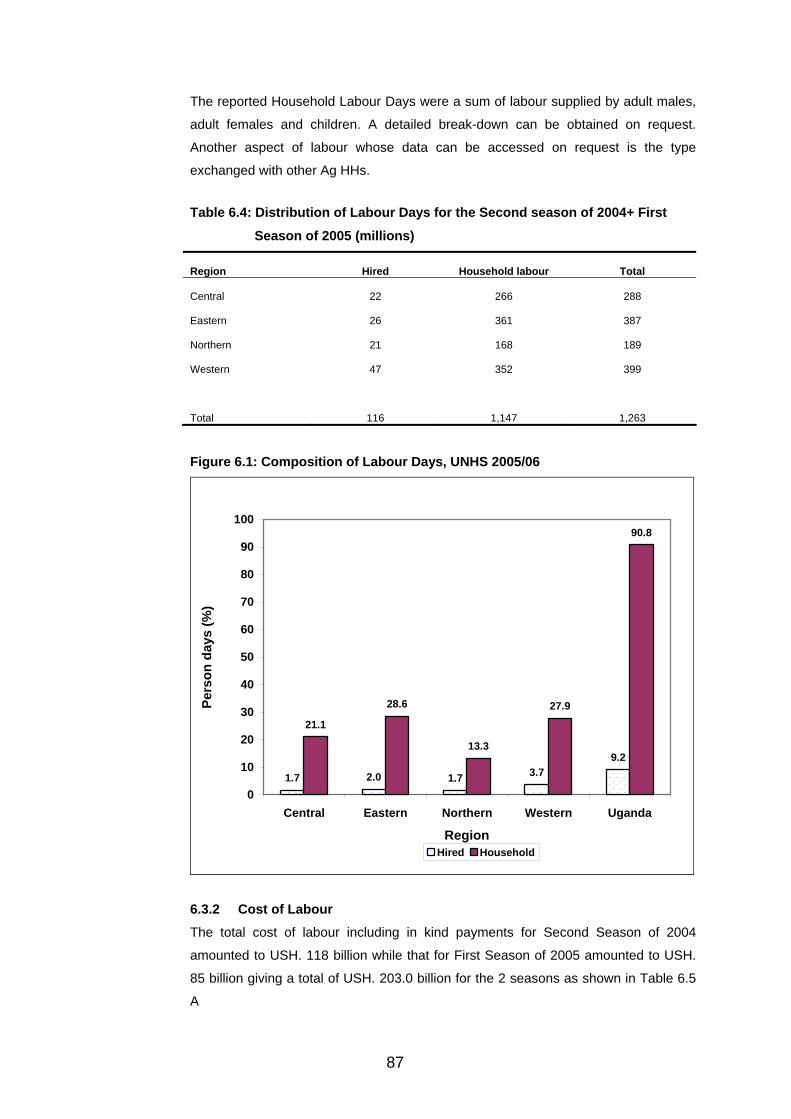
87
The reported Household Labour Days were a sum of labour supplied by adult males,
adult females and children. A detailed break-down can be obtained on request.
Another aspect of labour whose data can be accessed on request is the type
exchanged with other Ag HHs.
Table 6.4: Distribution of Labour Days for the Second season of 2004+ First
Season of 2005 (millions)
Region Hired Household labour Total
Central 22 266 288
Eastern 26 361 387
Northern 21 168 189
Western 47 352 399
Total 116 1,147 1,263
Figure 6.1: Composition of Labour Days, UNHS 2005/06
1.7 2.0 1.7 3.79.2
21.1
28.6
13.3
27.9
90.8
0
10
20
30
40
50
60
70
80
90
100
Central Eastern Northern Western Uganda
Region
Pers
on d
ays
(%)
Hired Household
6.3.2 Cost of Labour The total cost of labour including in kind payments for Second Season of 2004
amounted to USH. 118 billion while that for First Season of 2005 amounted to USH.
85 billion giving a total of USH. 203.0 billion for the 2 seasons as shown in Table 6.5
A

88
Table 6.5A: Distribution of Cost of Labour including in Kind Payment by Season
and Region (Billion shs.)
Total cost of Labour for Agricultural Households for:
Region Second Season, 2004 First Season, 2005 Total
Central 33.2 23.3 56.5
Eastern 21.7 21.9 43.6
Northern 16.3 10.1 26.4
Western 46.5 30 76.5
Total 117.7 85.3 203
It is observed that in general, the Average Cost of labour was higher during the
Second Season of 2004 compared with that of First Season of 2005. In addition, the
national average cost for labour dropped from USH. 32,000 in the Second Season of
2004 to USH. 26,000 in the First Season of 2005. The Central Region reported the
highest average cost of labour amounting to 40,000 shillings and 34,000 shillings for
Second Season of 2004 and First Season of 2005 respectively as shown in Table
6.5B and Figure 6.2.
Table 6.5B: Average Cost of Labour including in Kind Payment by Season and
Region (‘000 shs.)
Average cost of Labour for Ag HHs for: Region Second Season, 2004 First Season, 2005
Central 40 34
Eastern 25 23
Northern 24 17
Western 35 27
Total 32 26
Average cost of labour was higher in 2nd season 2004 than in 1st season 2005
Central Region reported the highest average cost
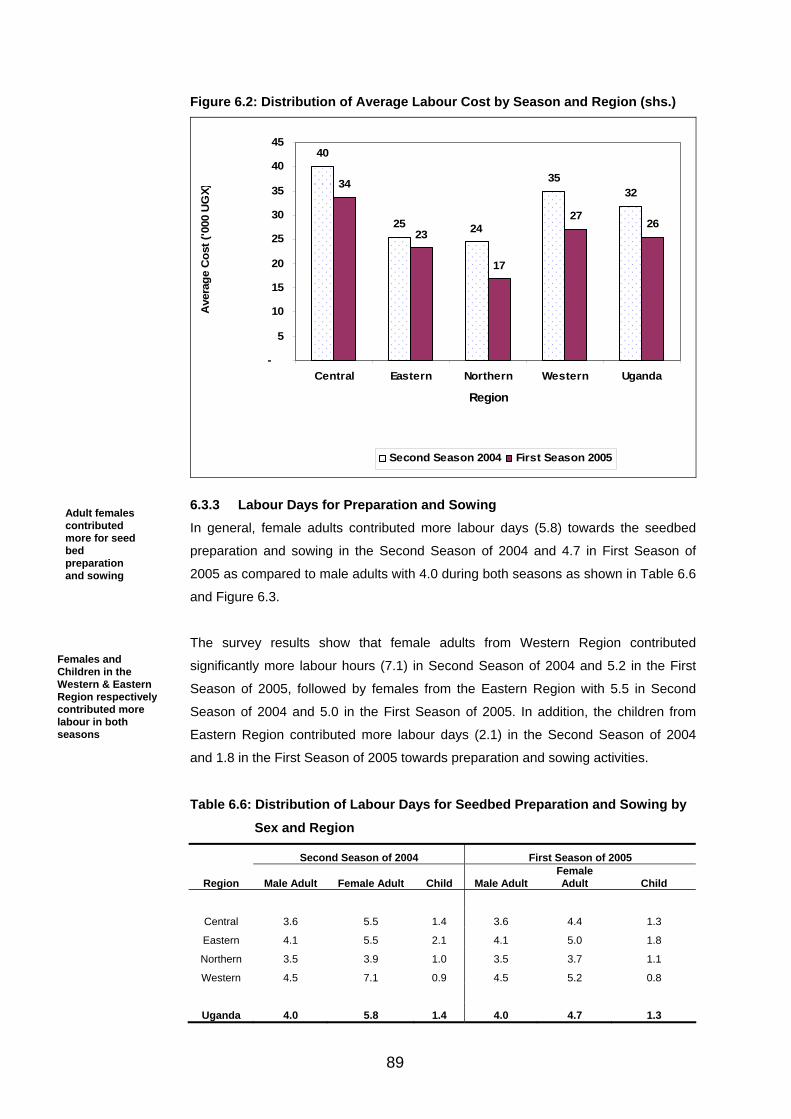
89
Figure 6.2: Distribution of Average Labour Cost by Season and Region (shs.)
40
25 24
3532
34
23
17
2726
-
5
10
15
20
25
30
35
40
45
Central Eastern Northern Western Uganda
Region
Ave
rage
Cos
t ('0
00 U
GX)
Second Season 2004 First Season 2005
6.3.3 Labour Days for Preparation and Sowing In general, female adults contributed more labour days (5.8) towards the seedbed
preparation and sowing in the Second Season of 2004 and 4.7 in First Season of
2005 as compared to male adults with 4.0 during both seasons as shown in Table 6.6
and Figure 6.3.
The survey results show that female adults from Western Region contributed
significantly more labour hours (7.1) in Second Season of 2004 and 5.2 in the First
Season of 2005, followed by females from the Eastern Region with 5.5 in Second
Season of 2004 and 5.0 in the First Season of 2005. In addition, the children from
Eastern Region contributed more labour days (2.1) in the Second Season of 2004
and 1.8 in the First Season of 2005 towards preparation and sowing activities.
Table 6.6: Distribution of Labour Days for Seedbed Preparation and Sowing by
Sex and Region
Second Season of 2004 First Season of 2005
Region Male Adult Female Adult Child Male Adult Female Adult Child
Central 3.6 5.5 1.4 3.6 4.4 1.3
Eastern 4.1 5.5 2.1 4.1 5.0 1.8
Northern 3.5 3.9 1.0 3.5 3.7 1.1
Western 4.5 7.1 0.9 4.5 5.2 0.8
Uganda 4.0 5.8 1.4 4.0 4.7 1.3
Adult females contributed more for seed bed preparation and sowing
Females and Children in the Western & Eastern Region respectively contributed more labour in both seasons
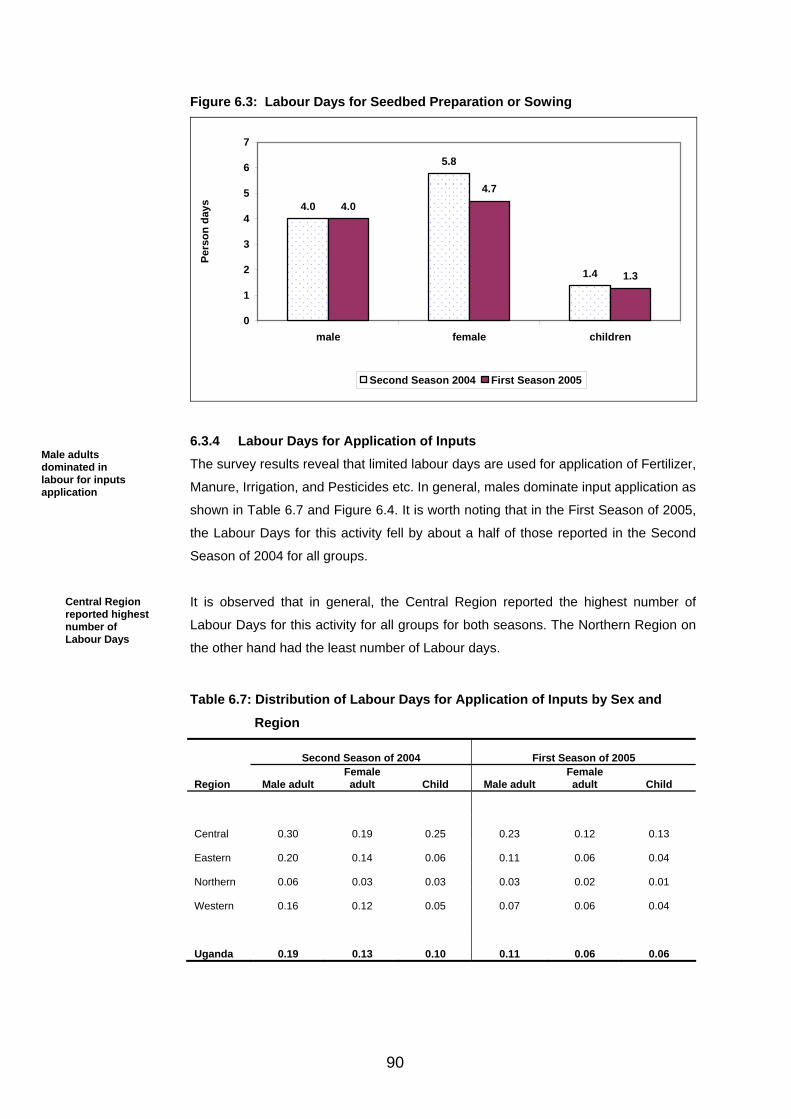
90
Figure 6.3: Labour Days for Seedbed Preparation or Sowing
4.0
5.8
1.4
4.04.7
1.3
0
1
2
3
4
5
6
7
male female children
Pers
on d
ays
Second Season 2004 First Season 2005
6.3.4 Labour Days for Application of Inputs The survey results reveal that limited labour days are used for application of Fertilizer,
Manure, Irrigation, and Pesticides etc. In general, males dominate input application as
shown in Table 6.7 and Figure 6.4. It is worth noting that in the First Season of 2005,
the Labour Days for this activity fell by about a half of those reported in the Second
Season of 2004 for all groups.
It is observed that in general, the Central Region reported the highest number of
Labour Days for this activity for all groups for both seasons. The Northern Region on
the other hand had the least number of Labour days.
Table 6.7: Distribution of Labour Days for Application of Inputs by Sex and
Region
Second Season of 2004 First Season of 2005
Region Male adult Female adult Child Male adult
Female adult Child
Central 0.30 0.19 0.25 0.23 0.12 0.13
Eastern 0.20 0.14 0.06 0.11 0.06 0.04
Northern 0.06 0.03 0.03 0.03 0.02 0.01
Western 0.16 0.12 0.05 0.07 0.06 0.04
Uganda 0.19 0.13 0.10 0.11 0.06 0.06
Male adults dominated in labour for inputs application
Central Region reported highest number of Labour Days
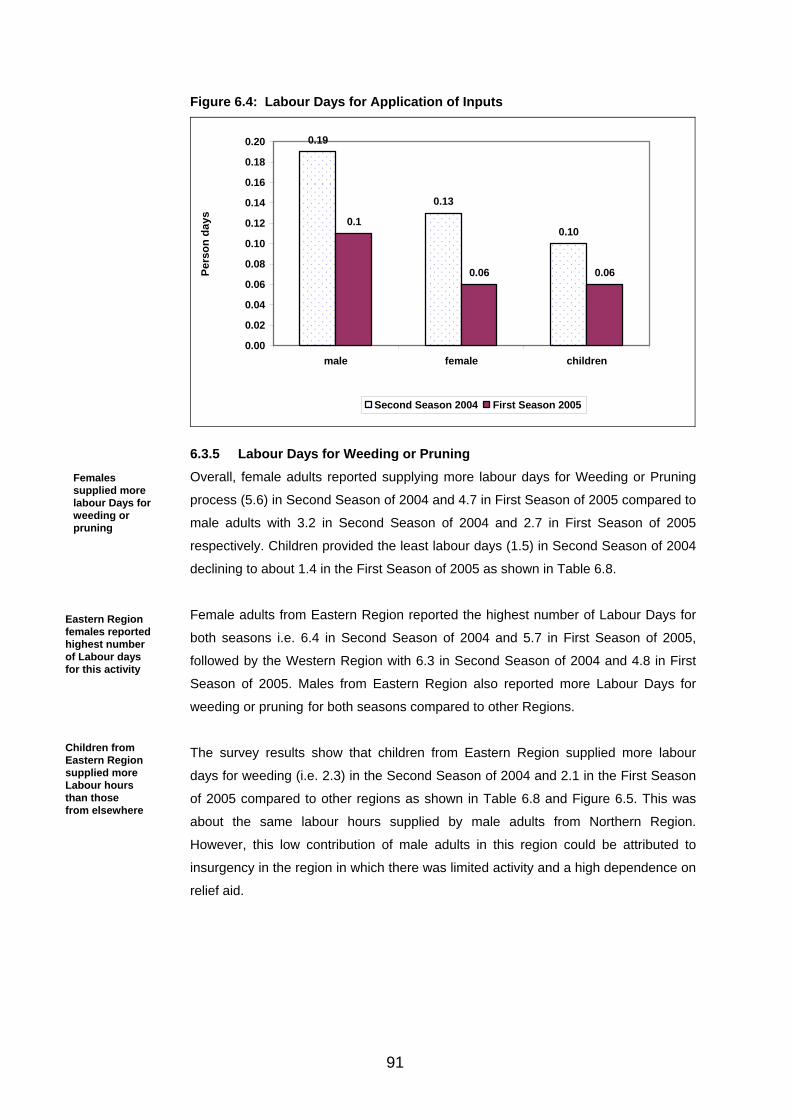
91
Figure 6.4: Labour Days for Application of Inputs
0.19
0.13
0.100.1
0.06 0.06
0.00
0.02
0.04
0.06
0.08
0.10
0.12
0.14
0.16
0.18
0.20
male female children
Pers
on d
ays
Second Season 2004 First Season 2005
6.3.5 Labour Days for Weeding or Pruning Overall, female adults reported supplying more labour days for Weeding or Pruning
process (5.6) in Second Season of 2004 and 4.7 in First Season of 2005 compared to
male adults with 3.2 in Second Season of 2004 and 2.7 in First Season of 2005
respectively. Children provided the least labour days (1.5) in Second Season of 2004
declining to about 1.4 in the First Season of 2005 as shown in Table 6.8.
Female adults from Eastern Region reported the highest number of Labour Days for
both seasons i.e. 6.4 in Second Season of 2004 and 5.7 in First Season of 2005,
followed by the Western Region with 6.3 in Second Season of 2004 and 4.8 in First
Season of 2005. Males from Eastern Region also reported more Labour Days for
weeding or pruning for both seasons compared to other Regions.
The survey results show that children from Eastern Region supplied more labour
days for weeding (i.e. 2.3) in the Second Season of 2004 and 2.1 in the First Season
of 2005 compared to other regions as shown in Table 6.8 and Figure 6.5. This was
about the same labour hours supplied by male adults from Northern Region.
However, this low contribution of male adults in this region could be attributed to
insurgency in the region in which there was limited activity and a high dependence on
relief aid.
Females supplied more labour Days for weeding or pruning
Eastern Region females reported highest number of Labour days for this activity
Children from Eastern Region supplied more Labour hours than those from elsewhere

92
Table 6.8: Distribution of Labour Days for Weeding or Pruning by Sex and
Region
Second Season of 2004 First Season of 2005
Region Male Adult Female Adult Child Male Adult
Female Adult Child
Central 2.7 4.7 1.6 2.2 3.9 1.4
Eastern 4.1 6.4 2.3 3.6 5.7 2.1
Northern 2.2 4.3 1.1 2.2 3.7 1.1
Western 3.2 6.3 1.0 2.6 4.8 0.8
Uganda 3.2 5.6 1.5 2.7 4.7 1.4
Figure 6.5: Labour Days for Weeding or Pruning
3.2
5.6
1.5
2.7
4.7
1.4
0
1
2
3
4
5
6
male female children
Pers
on d
ays
Second Season 2004 First Season 2005
6.3.6 Labour Days for Harvesting Harvesting is one of the most important activities in the crop production process
during an agricultural year. The survey results show that this activity was dominated
by females supplying more than double the Labour Days compared to male adults for
both seasons as clearly shown in Table 6.9 and Figure 6.6. Overall, the contribution
of children was limited to below 2 Labour Days. This could be explained by an
observation that children tend to be mainly engaged in transporting or ferrying the
harvest home or to the drying grounds.
In general, the distribution of Labour days showed more labour days being used in
the Second Season of 2004 than for the First Season of 2005 for all the different
agricultural activities covered.
Females dominated in the supply of labour Days for harvesting
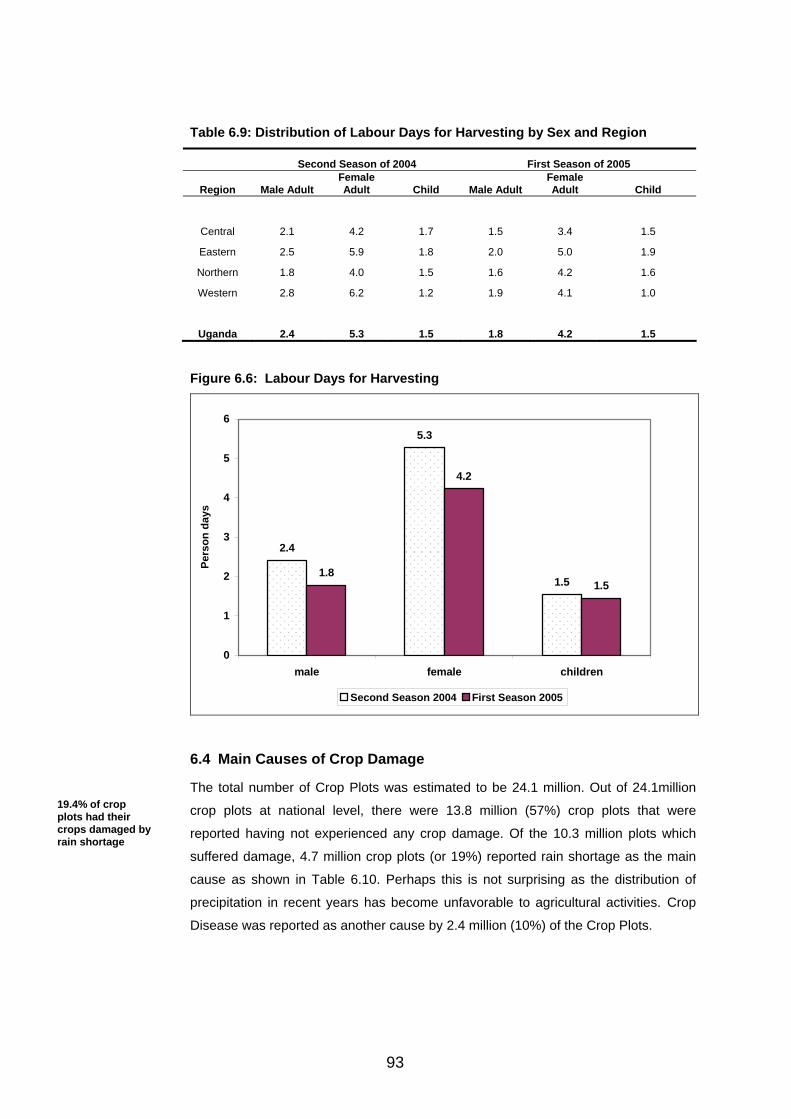
93
Table 6.9: Distribution of Labour Days for Harvesting by Sex and Region
Second Season of 2004 First Season of 2005
Region Male Adult Female Adult Child Male Adult
Female Adult Child
Central 2.1 4.2 1.7 1.5 3.4 1.5
Eastern 2.5 5.9 1.8 2.0 5.0 1.9
Northern 1.8 4.0 1.5 1.6 4.2 1.6
Western 2.8 6.2 1.2 1.9 4.1 1.0
Uganda 2.4 5.3 1.5 1.8 4.2 1.5
Figure 6.6: Labour Days for Harvesting
2.4
5.3
1.51.8
4.2
1.5
0
1
2
3
4
5
6
male female children
Pers
on d
ays
Second Season 2004 First Season 2005
6.4 Main Causes of Crop Damage
The total number of Crop Plots was estimated to be 24.1 million. Out of 24.1million
crop plots at national level, there were 13.8 million (57%) crop plots that were
reported having not experienced any crop damage. Of the 10.3 million plots which
suffered damage, 4.7 million crop plots (or 19%) reported rain shortage as the main
cause as shown in Table 6.10. Perhaps this is not surprising as the distribution of
precipitation in recent years has become unfavorable to agricultural activities. Crop
Disease was reported as another cause by 2.4 million (10%) of the Crop Plots.
19.4% of crop plots had their crops damaged by rain shortage
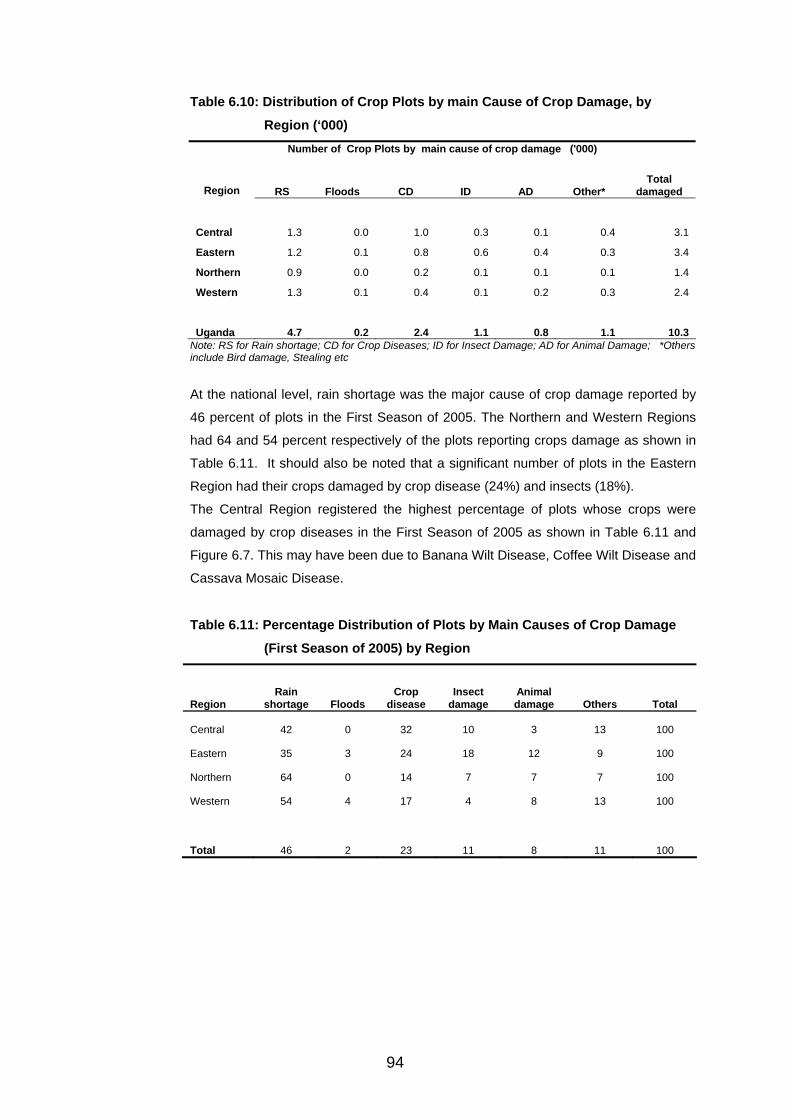
94
Table 6.10: Distribution of Crop Plots by main Cause of Crop Damage, by
Region (‘000) Number of Crop Plots by main cause of crop damage ('000)
RS Floods CD ID AD Other* Total
damaged Region
Central 1.3 0.0 1.0 0.3 0.1 0.4 3.1
Eastern 1.2 0.1 0.8 0.6 0.4 0.3 3.4
Northern 0.9 0.0 0.2 0.1 0.1 0.1 1.4
Western 1.3 0.1 0.4 0.1 0.2 0.3 2.4
Uganda 4.7 0.2 2.4 1.1 0.8 1.1 10.3 Note: RS for Rain shortage; CD for Crop Diseases; ID for Insect Damage; AD for Animal Damage; *Others
include Bird damage, Stealing etc
At the national level, rain shortage was the major cause of crop damage reported by
46 percent of plots in the First Season of 2005. The Northern and Western Regions
had 64 and 54 percent respectively of the plots reporting crops damage as shown in
Table 6.11. It should also be noted that a significant number of plots in the Eastern
Region had their crops damaged by crop disease (24%) and insects (18%).
The Central Region registered the highest percentage of plots whose crops were
damaged by crop diseases in the First Season of 2005 as shown in Table 6.11 and
Figure 6.7. This may have been due to Banana Wilt Disease, Coffee Wilt Disease and
Cassava Mosaic Disease.
Table 6.11: Percentage Distribution of Plots by Main Causes of Crop Damage
(First Season of 2005) by Region
Region Rain
shortage Floods Crop
disease Insect
damage Animal damage Others Total
Central 42 0 32 10 3 13 100
Eastern 35 3 24 18 12 9 100
Northern 64 0 14 7 7 7 100
Western 54 4 17 4 8 13 100
Total 46 2 23 11 8 11 100
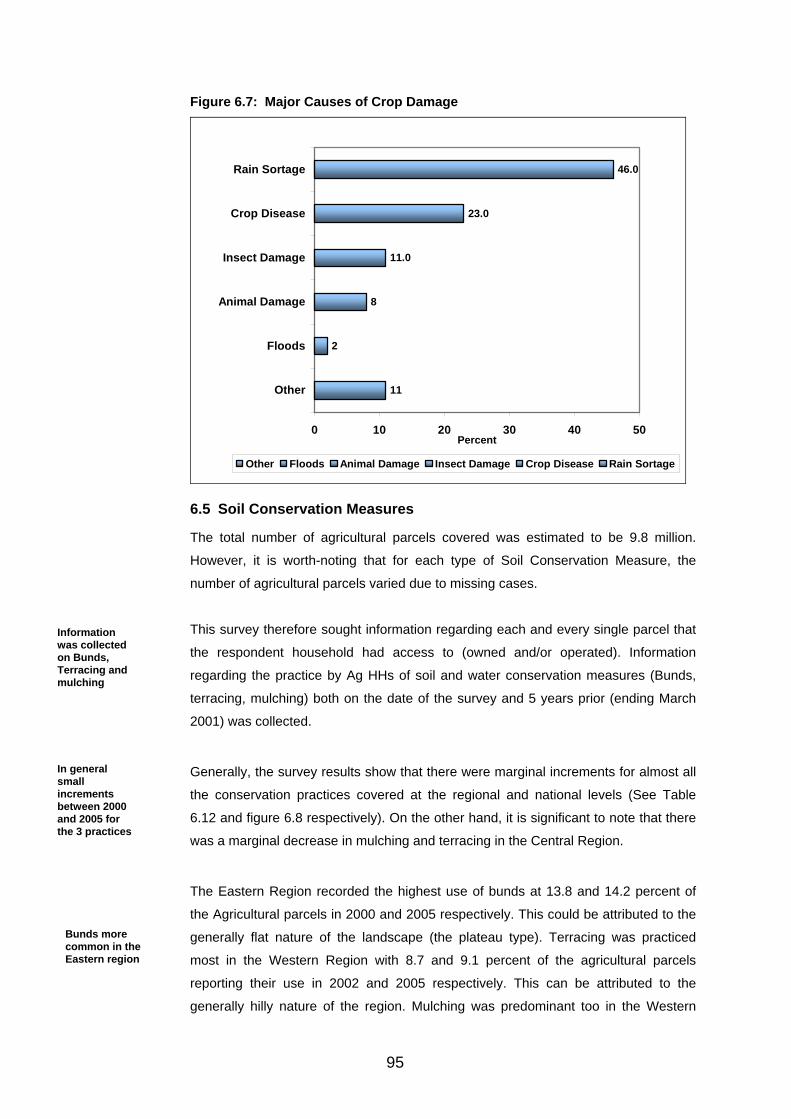
95
Figure 6.7: Major Causes of Crop Damage
11
2
8
11.0
23.0
46.0
0 10 20 30 40 50
Other
Floods
Animal Damage
Insect Damage
Crop Disease
Rain Sortage
Percent
Other Floods Animal Damage Insect Damage Crop Disease Rain Sortage
6.5 Soil Conservation Measures
The total number of agricultural parcels covered was estimated to be 9.8 million.
However, it is worth-noting that for each type of Soil Conservation Measure, the
number of agricultural parcels varied due to missing cases.
This survey therefore sought information regarding each and every single parcel that
the respondent household had access to (owned and/or operated). Information
regarding the practice by Ag HHs of soil and water conservation measures (Bunds,
terracing, mulching) both on the date of the survey and 5 years prior (ending March
2001) was collected.
Generally, the survey results show that there were marginal increments for almost all
the conservation practices covered at the regional and national levels (See Table
6.12 and figure 6.8 respectively). On the other hand, it is significant to note that there
was a marginal decrease in mulching and terracing in the Central Region.
The Eastern Region recorded the highest use of bunds at 13.8 and 14.2 percent of
the Agricultural parcels in 2000 and 2005 respectively. This could be attributed to the
generally flat nature of the landscape (the plateau type). Terracing was practiced
most in the Western Region with 8.7 and 9.1 percent of the agricultural parcels
reporting their use in 2002 and 2005 respectively. This can be attributed to the
generally hilly nature of the region. Mulching was predominant too in the Western
Information was collected on Bunds, Terracing and mulching
In general small increments between 2000 and 2005 for the 3 practices
Bunds more common in the Eastern region

96
Region followed by the Central Region and this could mainly be attributed to the
growing of Bananas and Coffee both of which require mulching.
Table 6.12: Percentage of Agricultural Parcels that used various Soil
Conservation Measures by Region (2000, 2005): Bunds Terracing Mulching
Region 2000 2005 2000 2005 2000 2005
Central 9.20 10.14 3.48 3.32 17.10 15.69
Eastern 13.77 14.18 2.84 3.17 6.53 7.66
Northern 1.54 1.72 0.23 0.33 2.19 2.15
Western 11.20 13.29 8.73 9.05 21.28 22.35
Uganda 9.65 10.75 4.46 4.59 12.71 13.03
Figure 6.8: Distribution of Parcels by Use of Soil Conservation Measures
9.7
4.5
12.7
10.8
5.0
13.0
0
2
4
6
8
10
12
14
Bunds Terrracing Mulching
Soil conservation measure
Perc
ent
UNHS 1999/2000 UNHS 2005/06
6.6 Extension Services
This section sought information from Ag HHs on Extension Services delivery. A
respondent was asked whether the Agricultural household had been visited by an
Extension Worker twelve months prior to the date of the survey. Further, the section
sought information on the following:
Participation of Agricultural Household members in NAADS training programmes;
Membership of an Agricultural Household member in a farmers’ group under
Farmer Institutional Development Scheme under NAADS;
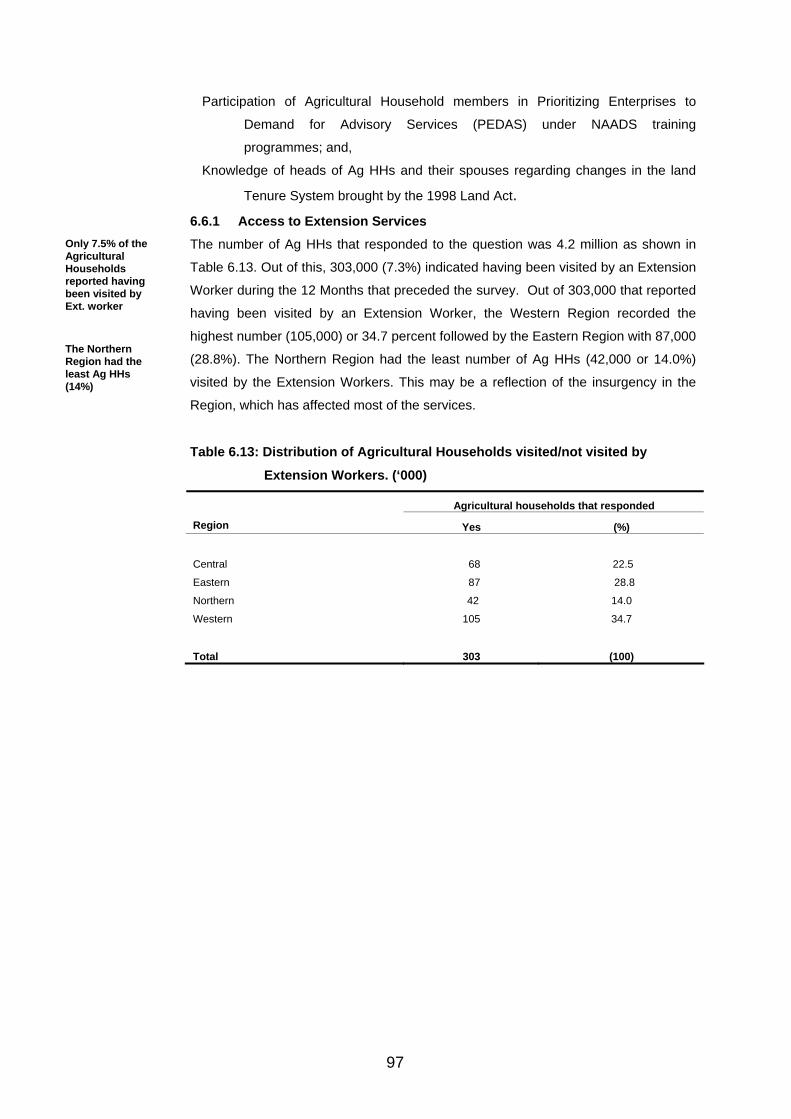
97
Participation of Agricultural Household members in Prioritizing Enterprises to
Demand for Advisory Services (PEDAS) under NAADS training
programmes; and,
Knowledge of heads of Ag HHs and their spouses regarding changes in the land
Tenure System brought by the 1998 Land Act. 6.6.1 Access to Extension Services The number of Ag HHs that responded to the question was 4.2 million as shown in
Table 6.13. Out of this, 303,000 (7.3%) indicated having been visited by an Extension
Worker during the 12 Months that preceded the survey. Out of 303,000 that reported
having been visited by an Extension Worker, the Western Region recorded the
highest number (105,000) or 34.7 percent followed by the Eastern Region with 87,000
(28.8%). The Northern Region had the least number of Ag HHs (42,000 or 14.0%)
visited by the Extension Workers. This may be a reflection of the insurgency in the
Region, which has affected most of the services.
Table 6.13: Distribution of Agricultural Households visited/not visited by
Extension Workers. (‘000)
Agricultural households that responded
Region Yes (%)
Central 68 22.5
Eastern 87 28.8
Northern 42 14.0
Western 105 34.7
Total 303 (100)
Only 7.5% of the Agricultural Households reported having been visited by Ext. worker The Northern Region had the least Ag HHs (14%)
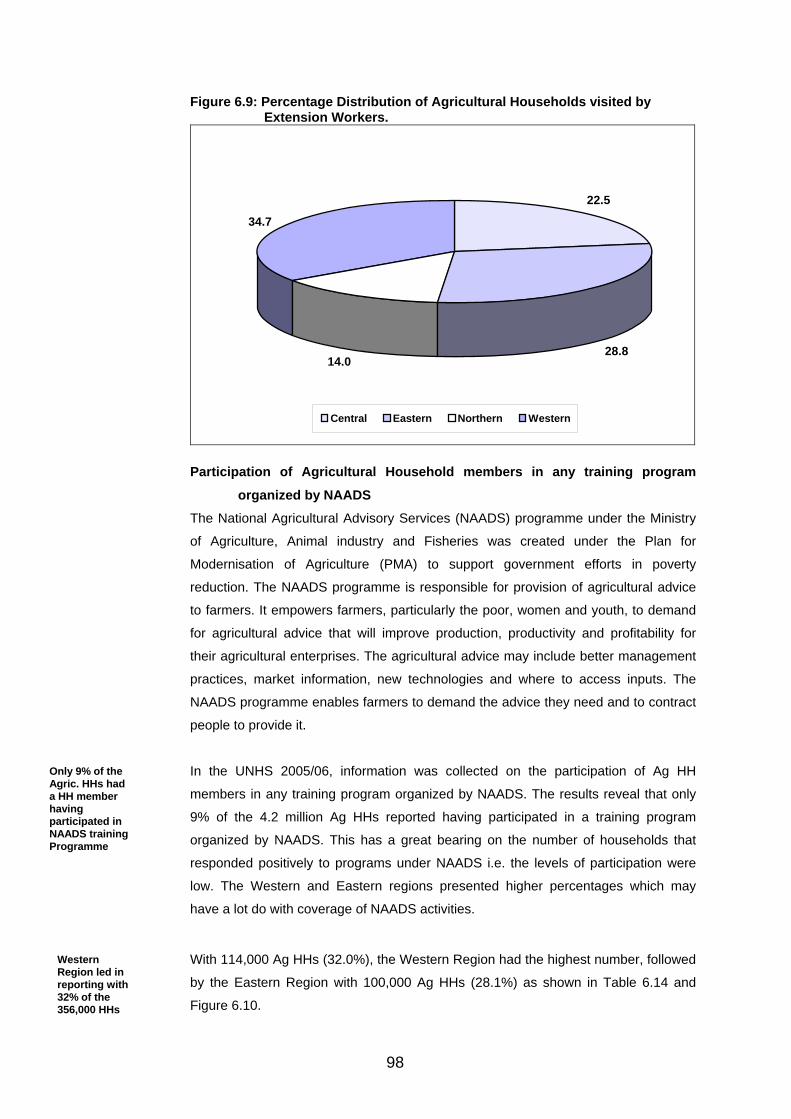
98
Figure 6.9: Percentage Distribution of Agricultural Households visited by Extension Workers.
22.5
28.814.0
34.7
Central Eastern Northern Western
Participation of Agricultural Household members in any training program
organized by NAADS The National Agricultural Advisory Services (NAADS) programme under the Ministry
of Agriculture, Animal industry and Fisheries was created under the Plan for
Modernisation of Agriculture (PMA) to support government efforts in poverty
reduction. The NAADS programme is responsible for provision of agricultural advice
to farmers. It empowers farmers, particularly the poor, women and youth, to demand
for agricultural advice that will improve production, productivity and profitability for
their agricultural enterprises. The agricultural advice may include better management
practices, market information, new technologies and where to access inputs. The
NAADS programme enables farmers to demand the advice they need and to contract
people to provide it.
In the UNHS 2005/06, information was collected on the participation of Ag HH
members in any training program organized by NAADS. The results reveal that only
9% of the 4.2 million Ag HHs reported having participated in a training program
organized by NAADS. This has a great bearing on the number of households that
responded positively to programs under NAADS i.e. the levels of participation were
low. The Western and Eastern regions presented higher percentages which may
have a lot do with coverage of NAADS activities.
With 114,000 Ag HHs (32.0%), the Western Region had the highest number, followed
by the Eastern Region with 100,000 Ag HHs (28.1%) as shown in Table 6.14 and
Figure 6.10.
Only 9% of the Agric. HHs had a HH member having participated in NAADS training Programme
Western Region led in reporting with 32% of the 356,000 HHs
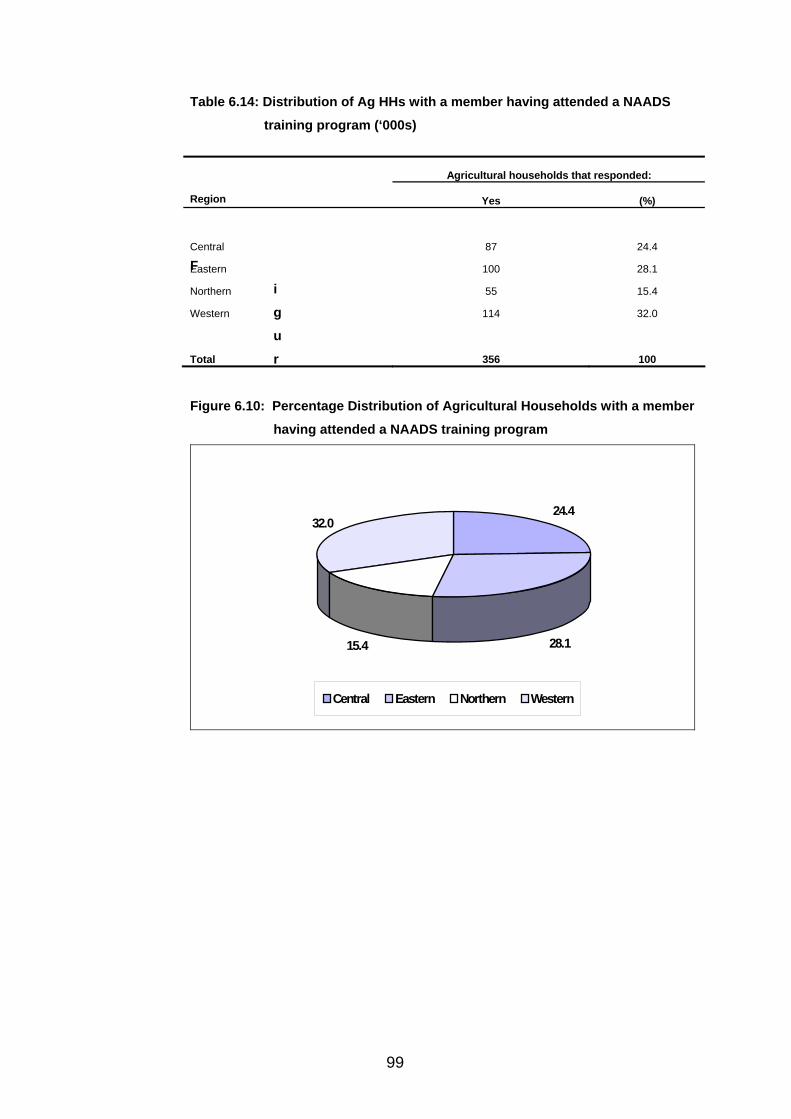
99
Table 6.14: Distribution of Ag HHs with a member having attended a NAADS
training program (‘000s)
F
i
g
u
r
Figure 6.10: Percentage Distribution of Agricultural Households with a member
having attended a NAADS training program
24.4
28.115.4
32.0
Central Eastern Northern Western
Agricultural households that responded:
Region Yes (%)
Central 87 24.4
Eastern 100 28.1
Northern 55 15.4
Western 114 32.0
Total 356 100

100
Membership of Agricultural Household members under the FIDS of NAADS Information on Agricultural Household members having members of the Farmers’
Groups under the Farmer Institutional Development Scheme (FIDS) of NAADS was
also sought.
The survey results reveal that 5.4% reported having at least one of its members
involved in a farmers’ group under NAADS as shown in Table 6.15 and Figure 6.11.
The Western Region had the highest percentage of Ag HHs 32.2% that reported
having at least one of its members involved in the farmers group under this scheme.
The Central and Northern Regions had the least 21.2% and 20.8% respectively.
Table 6.15: Membership of Agricultural Households members under the FIDS of
NAADS (‘000)
Agricultural households that responded
Region Yes (%)
Central 47 21.2
Eastern 57 25.8
Northern 46 20.8
Western 71 32.2
Total 220 100
Figure 6.11: Percentage distribution of Membership of Agricultural Households
members under the FIDS of NAADS
21.2
25.8
20.8
32.2
Central Eastern Northern Western
5.4 % of Ag HHs had at least a member in Farmer Groups under NAADS
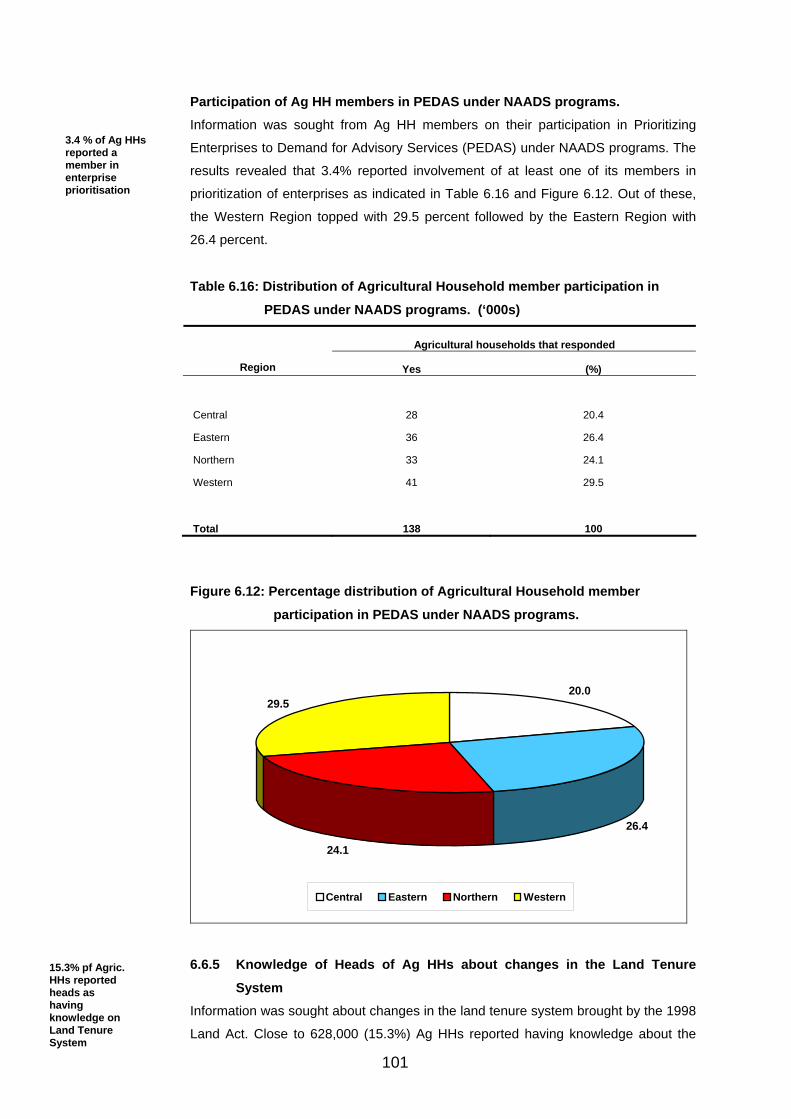
101
Participation of Ag HH members in PEDAS under NAADS programs. Information was sought from Ag HH members on their participation in Prioritizing
Enterprises to Demand for Advisory Services (PEDAS) under NAADS programs. The
results revealed that 3.4% reported involvement of at least one of its members in
prioritization of enterprises as indicated in Table 6.16 and Figure 6.12. Out of these,
the Western Region topped with 29.5 percent followed by the Eastern Region with
26.4 percent.
Table 6.16: Distribution of Agricultural Household member participation in
PEDAS under NAADS programs. (‘000s)
Agricultural households that responded
Region Yes (%)
Central 28 20.4
Eastern 36 26.4
Northern 33 24.1
Western 41 29.5
Total 138 100
Figure 6.12: Percentage distribution of Agricultural Household member
participation in PEDAS under NAADS programs.
20.0
26.4
24.1
29.5
Central Eastern Northern Western
6.6.5 Knowledge of Heads of Ag HHs about changes in the Land Tenure
System Information was sought about changes in the land tenure system brought by the 1998
Land Act. Close to 628,000 (15.3%) Ag HHs reported having knowledge about the
3.4 % of Ag HHs reported a member in enterprise prioritisation
15.3% pf Agric. HHs reported heads as having knowledge on Land Tenure System
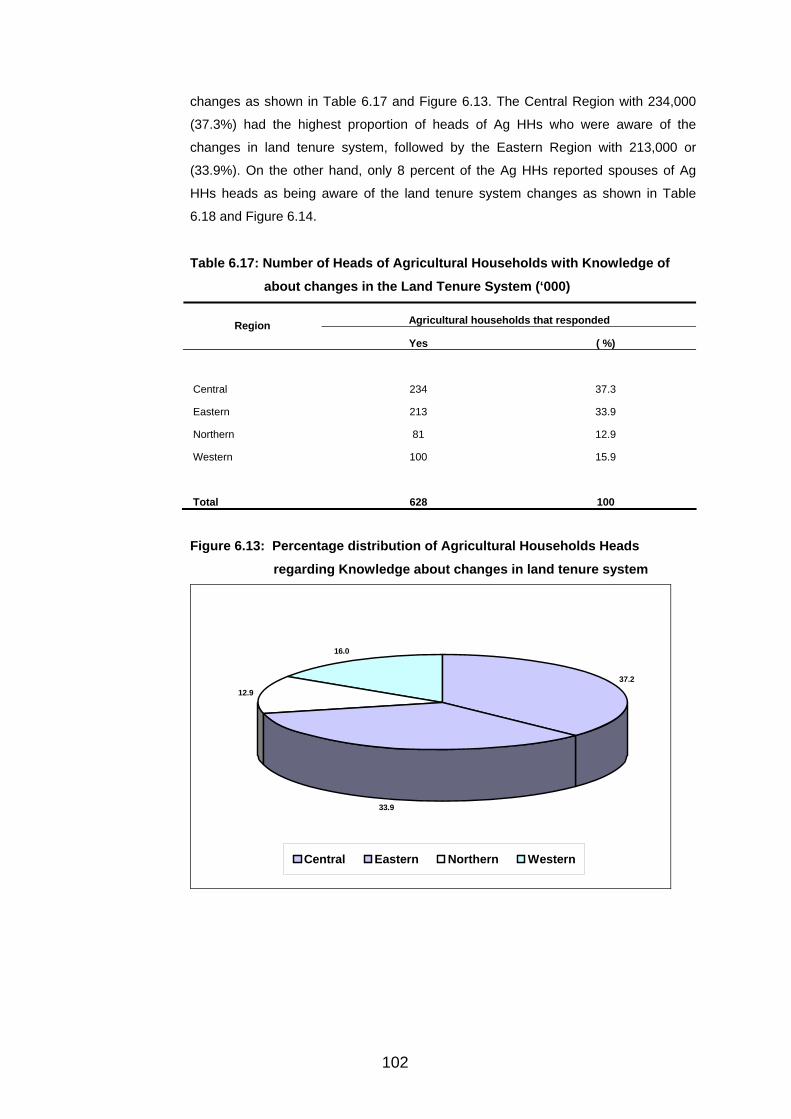
102
changes as shown in Table 6.17 and Figure 6.13. The Central Region with 234,000
(37.3%) had the highest proportion of heads of Ag HHs who were aware of the
changes in land tenure system, followed by the Eastern Region with 213,000 or
(33.9%). On the other hand, only 8 percent of the Ag HHs reported spouses of Ag
HHs heads as being aware of the land tenure system changes as shown in Table
6.18 and Figure 6.14.
Table 6.17: Number of Heads of Agricultural Households with Knowledge of
about changes in the Land Tenure System (‘000)
Agricultural households that responded Region Yes ( %)
Central 234 37.3
Eastern 213 33.9
Northern 81 12.9
Western 100 15.9
Total 628 100
Figure 6.13: Percentage distribution of Agricultural Households Heads
regarding Knowledge about changes in land tenure system
37.2
33.9
12.9
16.0
Central Eastern Northern Western

103
Table 6.18: Number of Spouses in Ag HHs with Knowledge about changes in
the Land Tenure System (‘000)
Agricultural households that responded Region Yes (%)
Central 109 34.1
Eastern 102 31.8
Northern 44 13.8
Western 65 20.3
Total 320 100
Figure 6.14: Percentage distribution of Ag HHs Heads’ Spouses regarding
Knowledge about changes in land tenure system
34.1
31.8
13.8
20.3
Central Eastern Northern Western
6.7 Access to and Demand for Agricultural Technology
This section sought information from Ag HHs on the adoption of Agricultural
Technologies. It should be noted that information regarding access to specific
Agricultural Technology was recorded regardless of whether the Ag HHs had access
to extension service or not. The types of technology for which information was sought
included Soil Fertility Management, Crop Protection, Farm Management, Improved
Produce Quality/Varieties, On-Farm Storage (Post Harvest), Improved Individual and
Group Marketing as well as Disease Control measures.
6.7.1 Change of Practices in Past Five Years About 1 million (24%) Ag HHs reported having changed their practices with respect to
use of Improved Produce Quality/ Varieties during the five years preceding the survey
date as shown in Table 6.19. The majority were from the Eastern Region (431,000
44.2%). The Central Region had the highest number of Ag HHs at 279,000 (30.6%)
who changed Soil Fertility Management practice. In addition, the Central Region
reported the highest number of Ag HHs that practiced Disease Control at 310,000
24% of Agric. HHS reported having used improved varieties
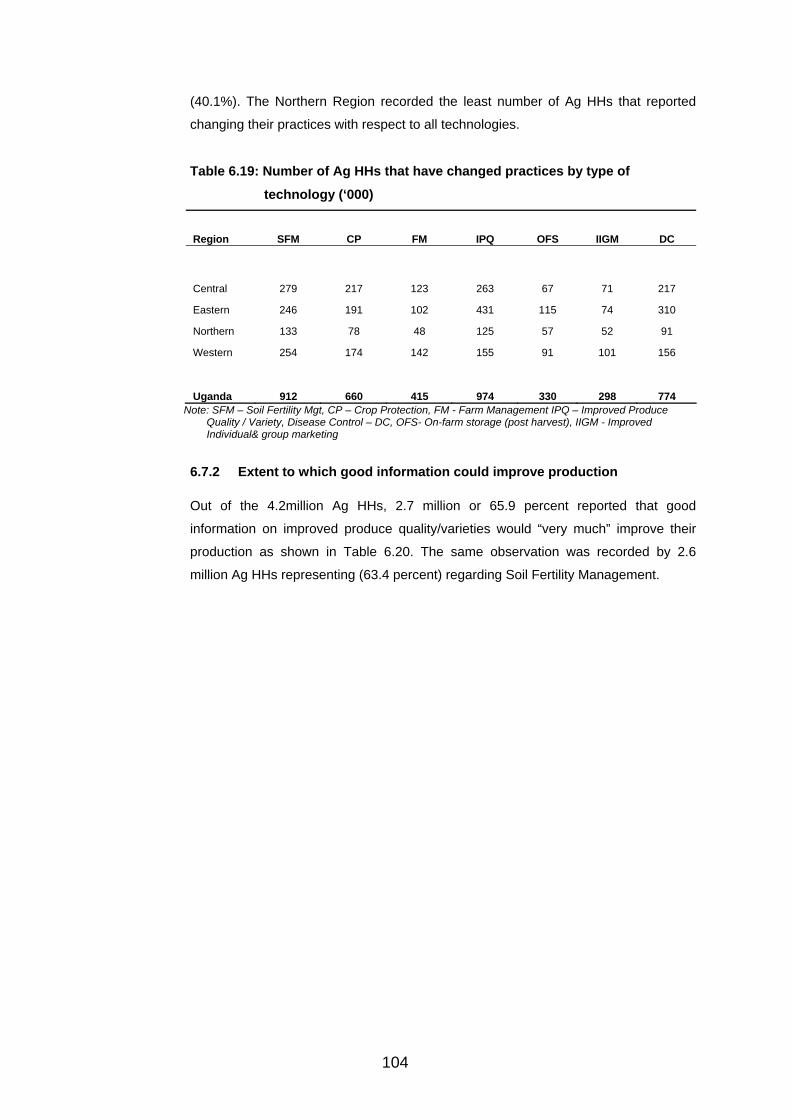
104
(40.1%). The Northern Region recorded the least number of Ag HHs that reported
changing their practices with respect to all technologies.
Table 6.19: Number of Ag HHs that have changed practices by type of
technology (‘000)
Region SFM CP FM IPQ OFS IIGM DC
Central 279 217 123 263 67 71 217
Eastern 246 191 102 431 115 74 310
Northern 133 78 48 125 57 52 91
Western 254 174 142 155 91 101 156
Uganda 912 660 415 974 330 298 774 Note: SFM – Soil Fertility Mgt, CP – Crop Protection, FM - Farm Management IPQ – Improved Produce Quality / Variety, Disease Control – DC, OFS- On-farm storage (post harvest), IIGM - Improved Individual& group marketing
6.7.2 Extent to which good information could improve production Out of the 4.2million Ag HHs, 2.7 million or 65.9 percent reported that good
information on improved produce quality/varieties would “very much” improve their
production as shown in Table 6.20. The same observation was recorded by 2.6
million Ag HHs representing (63.4 percent) regarding Soil Fertility Management.
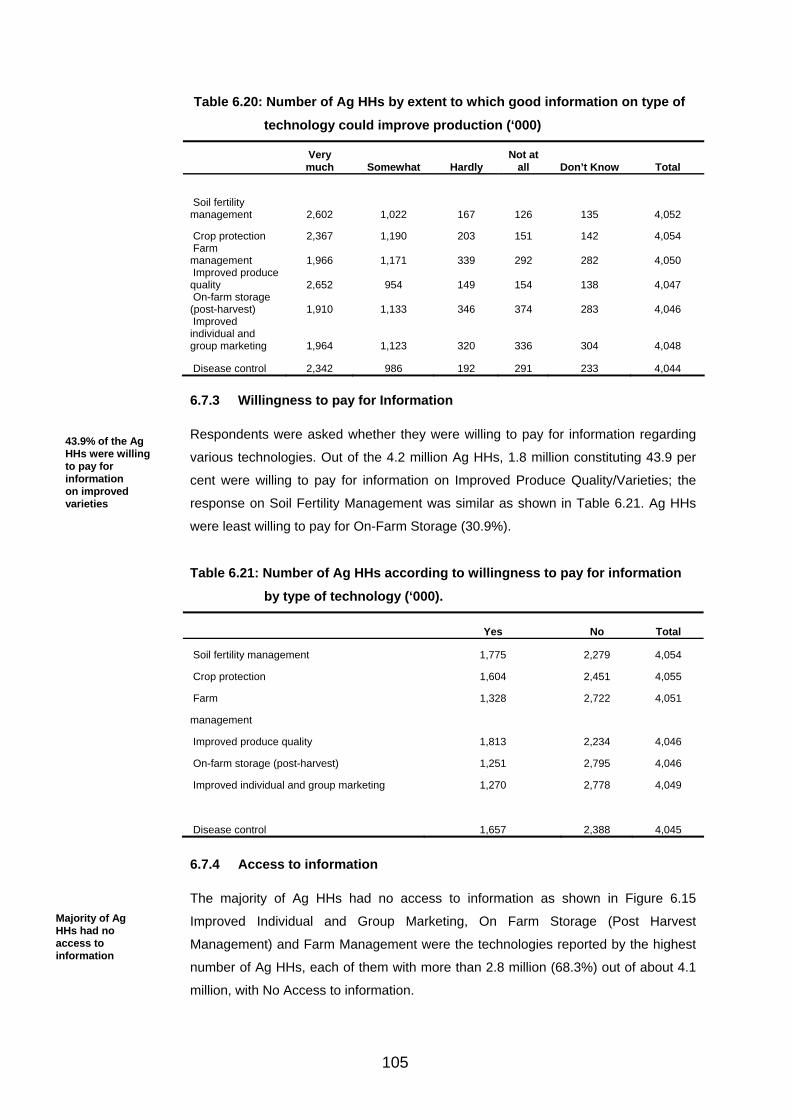
105
Table 6.20: Number of Ag HHs by extent to which good information on type of
technology could improve production (‘000)
Very much Somewhat Hardly
Not at all Don’t Know Total
Soil fertility management 2,602 1,022 167 126 135 4,052
Crop protection 2,367 1,190 203 151 142 4,054 Farm management 1,966 1,171 339 292 282 4,050 Improved produce quality 2,652 954 149 154 138 4,047 On-farm storage (post-harvest) 1,910 1,133 346 374 283 4,046 Improved individual and group marketing 1,964 1,123 320 336 304 4,048
Disease control 2,342 986 192 291 233 4,044 6.7.3 Willingness to pay for Information Respondents were asked whether they were willing to pay for information regarding
various technologies. Out of the 4.2 million Ag HHs, 1.8 million constituting 43.9 per
cent were willing to pay for information on Improved Produce Quality/Varieties; the
response on Soil Fertility Management was similar as shown in Table 6.21. Ag HHs
were least willing to pay for On-Farm Storage (30.9%).
Table 6.21: Number of Ag HHs according to willingness to pay for information
by type of technology (‘000).
Yes No Total
Soil fertility management 1,775 2,279 4,054
Crop protection 1,604 2,451 4,055
Farm 1,328 2,722 4,051
management
Improved produce quality 1,813 2,234 4,046
On-farm storage (post-harvest) 1,251 2,795 4,046
Improved individual and group marketing 1,270 2,778 4,049
Disease control 1,657 2,388 4,045
6.7.4 Access to information The majority of Ag HHs had no access to information as shown in Figure 6.15
Improved Individual and Group Marketing, On Farm Storage (Post Harvest
Management) and Farm Management were the technologies reported by the highest
number of Ag HHs, each of them with more than 2.8 million (68.3%) out of about 4.1
million, with No Access to information.
43.9% of the Ag HHs were willing to pay for information on improved varieties
Majority of Ag HHs had no access to information
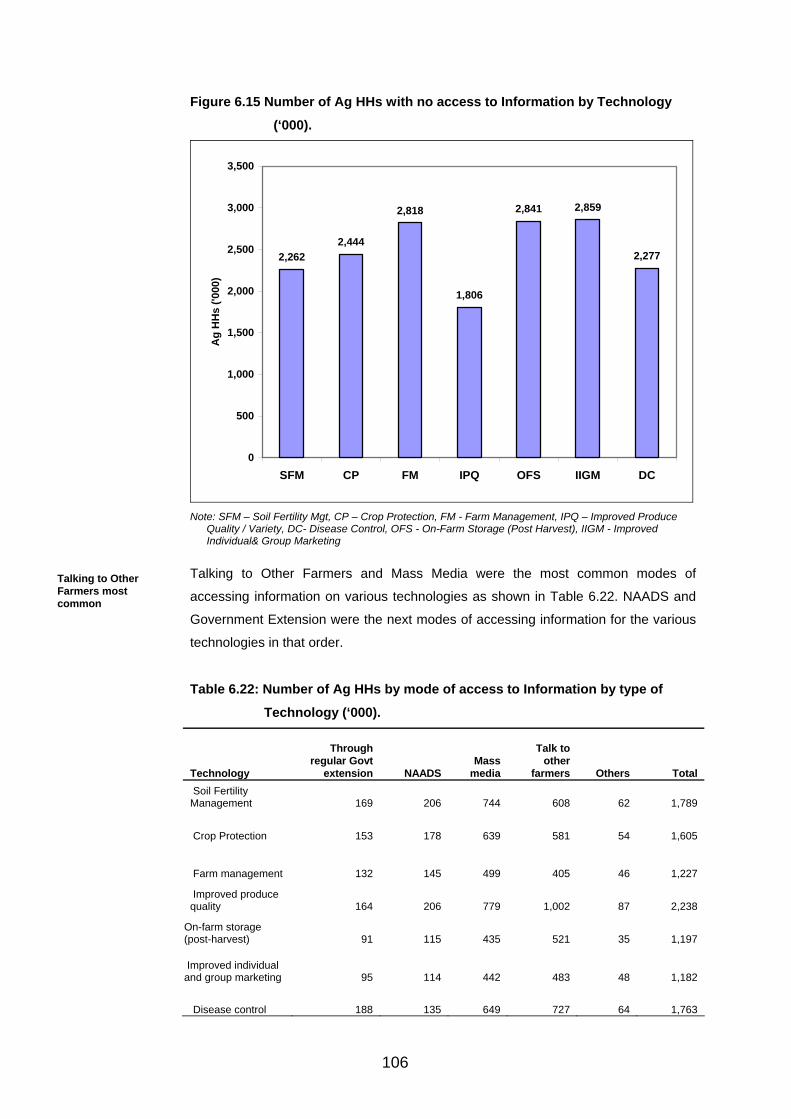
106
Figure 6.15 Number of Ag HHs with no access to Information by Technology
(‘000).
2,2622,444
2,818
1,806
2,841 2,859
2,277
0
500
1,000
1,500
2,000
2,500
3,000
3,500
SFM CP FM IPQ OFS IIGM DC
Ag
HH
s ('0
00)
Note: SFM – Soil Fertility Mgt, CP – Crop Protection, FM - Farm Management, IPQ – Improved Produce
Quality / Variety, DC- Disease Control, OFS - On-Farm Storage (Post Harvest), IIGM - Improved Individual& Group Marketing
Talking to Other Farmers and Mass Media were the most common modes of
accessing information on various technologies as shown in Table 6.22. NAADS and
Government Extension were the next modes of accessing information for the various
technologies in that order.
Table 6.22: Number of Ag HHs by mode of access to Information by type of
Technology (‘000).
Technology
Through regular Govt
extension NAADS Mass
media
Talk to other
farmers Others Total Soil Fertility Management 169 206 744 608 62 1,789
Crop Protection 153 178 639 581 54 1,605
Farm management 132 145 499 405 46 1,227
Improved produce quality 164 206 779 1,002 87 2,238
On-farm storage (post-harvest) 91 115 435 521 35 1,197
Improved individual and group marketing 95 114 442 483 48 1,182
Disease control 188 135 649 727 64 1,763
Talking to Other Farmers most common
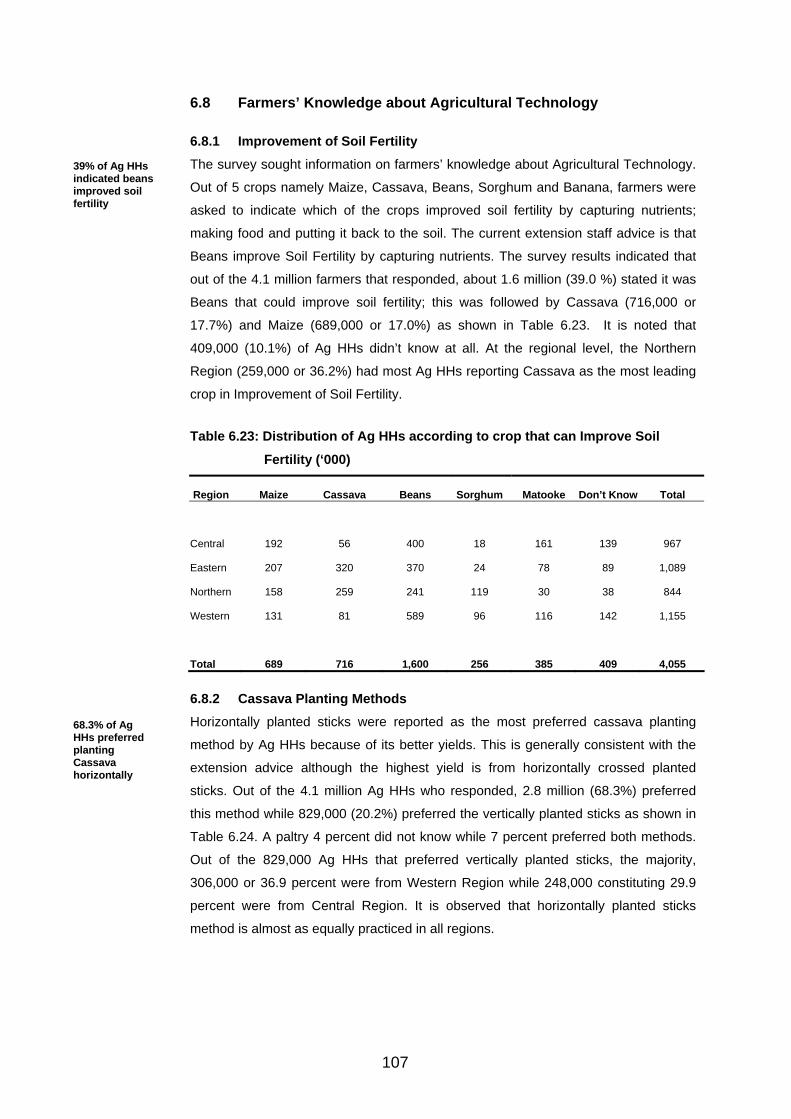
107
6.8 Farmers’ Knowledge about Agricultural Technology
6.8.1 Improvement of Soil Fertility The survey sought information on farmers’ knowledge about Agricultural Technology.
Out of 5 crops namely Maize, Cassava, Beans, Sorghum and Banana, farmers were
asked to indicate which of the crops improved soil fertility by capturing nutrients;
making food and putting it back to the soil. The current extension staff advice is that
Beans improve Soil Fertility by capturing nutrients. The survey results indicated that
out of the 4.1 million farmers that responded, about 1.6 million (39.0 %) stated it was
Beans that could improve soil fertility; this was followed by Cassava (716,000 or
17.7%) and Maize (689,000 or 17.0%) as shown in Table 6.23. It is noted that
409,000 (10.1%) of Ag HHs didn’t know at all. At the regional level, the Northern
Region (259,000 or 36.2%) had most Ag HHs reporting Cassava as the most leading
crop in Improvement of Soil Fertility.
Table 6.23: Distribution of Ag HHs according to crop that can Improve Soil
Fertility (‘000)
Region Maize Cassava Beans Sorghum Matooke Don’t Know Total
Central 192 56 400 18 161 139 967
Eastern 207 320 370 24 78 89 1,089
Northern 158 259 241 119 30 38 844
Western 131 81 589 96 116 142 1,155
Total 689 716 1,600 256 385 409 4,055
6.8.2 Cassava Planting Methods Horizontally planted sticks were reported as the most preferred cassava planting
method by Ag HHs because of its better yields. This is generally consistent with the
extension advice although the highest yield is from horizontally crossed planted
sticks. Out of the 4.1 million Ag HHs who responded, 2.8 million (68.3%) preferred
this method while 829,000 (20.2%) preferred the vertically planted sticks as shown in
Table 6.24. A paltry 4 percent did not know while 7 percent preferred both methods.
Out of the 829,000 Ag HHs that preferred vertically planted sticks, the majority,
306,000 or 36.9 percent were from Western Region while 248,000 constituting 29.9
percent were from Central Region. It is observed that horizontally planted sticks
method is almost as equally practiced in all regions.
39% of Ag HHs indicated beans improved soil fertility
68.3% of Ag HHs preferred planting Cassava horizontally
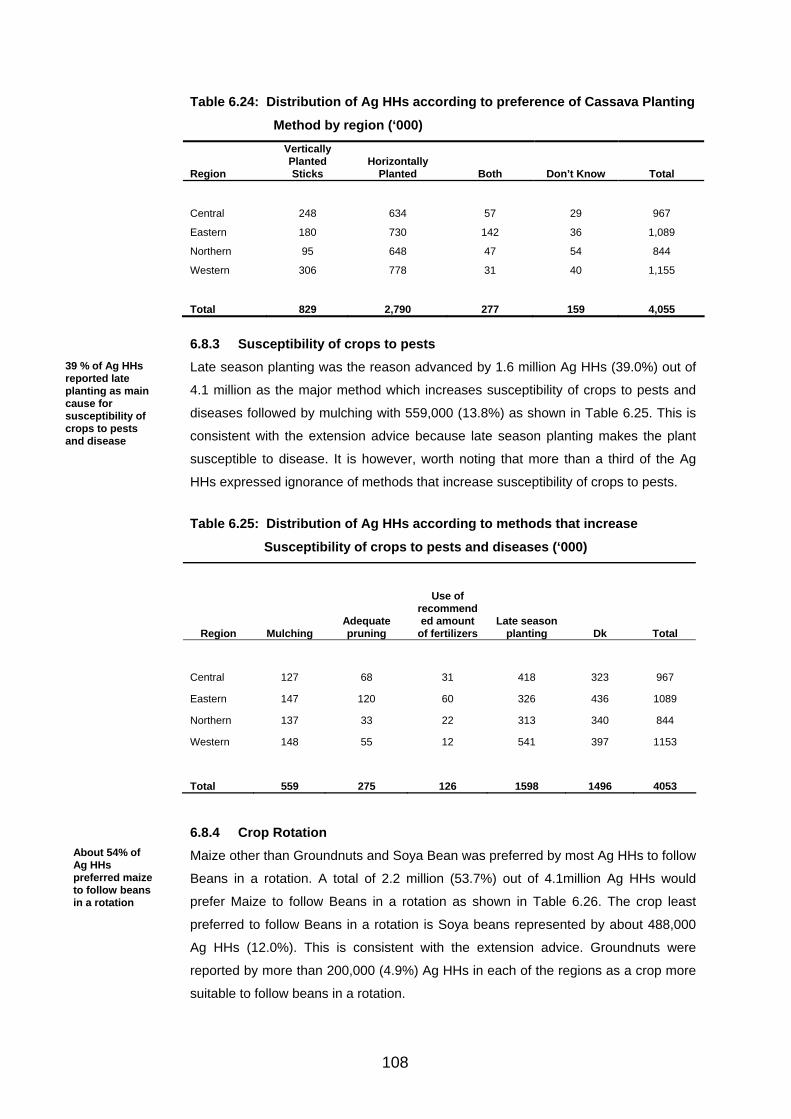
108
Table 6.24: Distribution of Ag HHs according to preference of Cassava Planting
Method by region (‘000)
Region
Vertically Planted Sticks
Horizontally Planted Both Don’t Know Total
Central 248 634 57 29 967
Eastern 180 730 142 36 1,089
Northern 95 648 47 54 844
Western 306 778 31 40 1,155
Total 829 2,790 277 159 4,055
6.8.3 Susceptibility of crops to pests Late season planting was the reason advanced by 1.6 million Ag HHs (39.0%) out of
4.1 million as the major method which increases susceptibility of crops to pests and
diseases followed by mulching with 559,000 (13.8%) as shown in Table 6.25. This is
consistent with the extension advice because late season planting makes the plant
susceptible to disease. It is however, worth noting that more than a third of the Ag
HHs expressed ignorance of methods that increase susceptibility of crops to pests. Table 6.25: Distribution of Ag HHs according to methods that increase
Susceptibility of crops to pests and diseases (‘000)
Region Mulching Adequate pruning
Use of recommended amount
of fertilizers Late season
planting Dk Total
Central 127 68 31 418 323 967
Eastern 147 120 60 326 436 1089
Northern 137 33 22 313 340 844
Western 148 55 12 541 397 1153
Total 559 275 126 1598 1496 4053 6.8.4 Crop Rotation Maize other than Groundnuts and Soya Bean was preferred by most Ag HHs to follow
Beans in a rotation. A total of 2.2 million (53.7%) out of 4.1million Ag HHs would
prefer Maize to follow Beans in a rotation as shown in Table 6.26. The crop least
preferred to follow Beans in a rotation is Soya beans represented by about 488,000
Ag HHs (12.0%). This is consistent with the extension advice. Groundnuts were
reported by more than 200,000 (4.9%) Ag HHs in each of the regions as a crop more
suitable to follow beans in a rotation.
39 % of Ag HHs reported late planting as main cause for susceptibility of crops to pests and disease
About 54% of Ag HHs preferred maize to follow beans in a rotation

109
Table 6.26: Distribution of Ag HHs according to crop to follow Beans in rotation
(‘000)
Region G-nuts Soya beans Maize Don’t Know Total
Central 231 76 506 153 966
Eastern 219 162 629 78 1,089
Northern 233 112 447 51 843
Western 289 138 633 93 1,153
Total 973 488 2,216 375 4,051
6.8.5 Best Results for Bananas About two thirds (2.7 million) of the 4.1 million Ag HHs interviewed reported that
bananas should be left with a total of three (3) plants in each stool (stand) in order to
achieve best results and this is clearly in line with the extension advice. About
475,000 or 11.6 percent out of 4.1 million Ag HHs thought of one plant per stand
while 634,000 or 15.5 percent did not know as shown in Table 6.27. The Northern
Region was responsible for the high percentage (44.2%) of those that did not know.
This is clearly because the crop is not common in the region.
Table 6.27: Distribution of Ag HHs according to the number of plants per stool
of Bananas (‘000)
Region 1 3 10 15 Don’t know Total
Central 109 716 47 2 93 966
Eastern 61 788 80 8 152 1088
Northern 156 327 68 14 280 844
Western 150 835 54 5 109 1153
Total 475 2666 248 29 634 4051
6.8.6 Most common pest on Bananas The survey sought information on the most common pest on Bananas. Banana
Weevil was correctly reported as the most common pest on bananas by 2.4 million Ag
HHs (58.5%) out of 4.1 million, followed by Fruit Bores with 346,000 constituting 8.5
percent as shown in Table 6.28. Banana Weevil was most cited in the Central and
Western Regions while Fruit Bores were most reported in the Eastern and Northern
Region.
Approx. 66% wanted 3 plants per stool
58.5% of Ag HHs reported Banana weevil as most common pest on Bananas

110
Table 6.28: Distribution of Ag HHs according to most common pest on Bananas
(‘000)
Banana Weevils Fruit Bores Leaf Miners Don’t Know Total
Central 681 55 33 199 967
Eastern 518 141 80 348 1,088
Northern 265 106 31 442 843
Western 909 44 27 175 1,155
Total 2,372 346 171 1,163 4,053
6.8.7 Application of Di Ammonium Phosphate (DAP) Respondents were asked about the recommended quantity for DAP that has to be
applied per hill/hole when planting maize. Out of the 4.1 million Ag HHs, 3.3 million
(80.4%) did not know while 661,000 Ag HHs or 16.3 percent suggested one bottle top
which is the recommended application. Western Region had the highest number of
Ag HHs of about 1.0 million (25.7%) that did not know, followed by Eastern Region
with 790,000 farmers (19.3%) as shown in Table 6.29.
Table 6.29: Distribution of Ag HHs according to recommended quantity of DAP
to apply when planting maize (‘000)
One Bottle Top One Kg One Gram Don’t Know Total
Central 191 6 11 757 965
Eastern 267 6 23 790 1087
Northern 128 16 32 669 844
Western 75 18 13 1045 1152
Total 661 47 79 3261 4047
6.9 Farmers’ Knowledge about Improved varieties
6.9.1 Knowledge about the variety High yielding (7000kg/ha) and high quality protein maize variety known by 2.2 million
(53.7%) Ag HHs out 4.1, is the most well known of all improved varieties under study
in the survey, followed by high yielding and resistant Mosaic, Cassava, then disease
resistant and high yielding, beans. High yielding (800-1000 kg/ha) Simsim was the
least known by Ag HHs that participated in the study. See table 6.30 and Figure 6.16
80% of the Ag HHs did not know the recommended rate of DAP application
About 54 % of the Ag HHs stated maize as most well known of all improved varieties
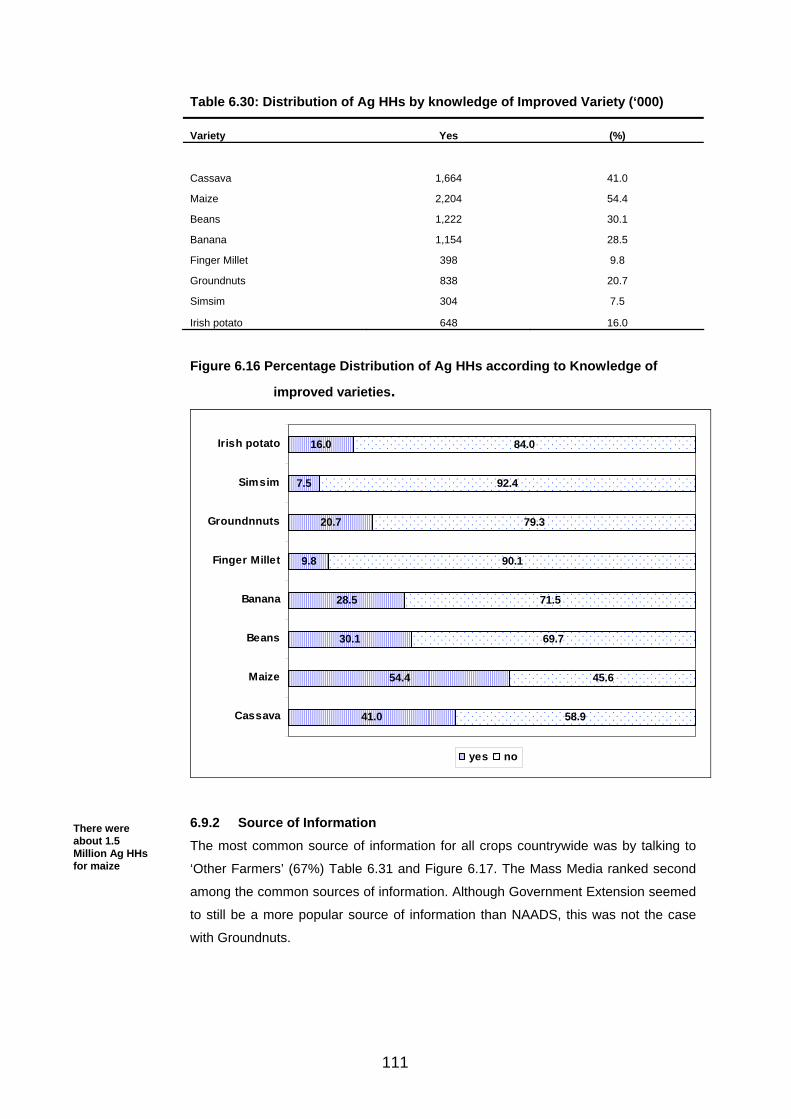
111
Table 6.30: Distribution of Ag HHs by knowledge of Improved Variety (‘000)
Variety Yes (%)
Cassava 1,664 41.0
Maize 2,204 54.4
Beans 1,222 30.1
Banana 1,154 28.5
Finger Millet 398 9.8
Groundnuts 838 20.7
Simsim 304 7.5
Irish potato 648 16.0
Figure 6.16 Percentage Distribution of Ag HHs according to Knowledge of
improved varieties.
41.0
54.4
30.1
28.5
9.8
20.7
7.5
16.0
58.9
45.6
69.7
71.5
90.1
79.3
92.4
84.0
Cassava
Maize
Beans
Banana
Finger Millet
Groundnnuts
Simsim
Irish potato
yes no
6.9.2 Source of Information The most common source of information for all crops countrywide was by talking to
‘Other Farmers’ (67%) Table 6.31 and Figure 6.17. The Mass Media ranked second
among the common sources of information. Although Government Extension seemed
to still be a more popular source of information than NAADS, this was not the case
with Groundnuts.
There were about 1.5 Million Ag HHs for maize
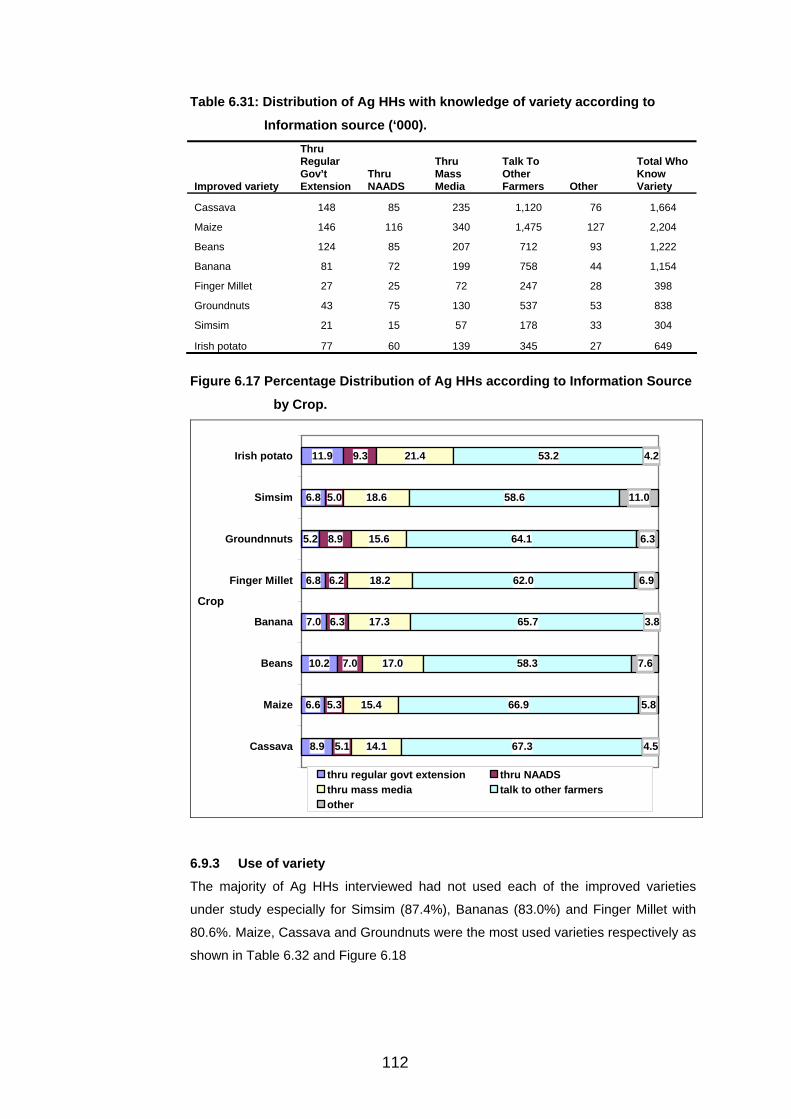
112
Table 6.31: Distribution of Ag HHs with knowledge of variety according to
Information source (‘000).
Improved variety
Thru Regular Gov’t Extension
Thru NAADS
Thru Mass Media
Talk To Other Farmers Other
Total Who Know Variety
Cassava 148 85 235 1,120 76 1,664
Maize 146 116 340 1,475 127 2,204
Beans 124 85 207 712 93 1,222
Banana 81 72 199 758 44 1,154
Finger Millet 27 25 72 247 28 398
Groundnuts 43 75 130 537 53 838
Simsim 21 15 57 178 33 304
Irish potato 77 60 139 345 27 649
Figure 6.17 Percentage Distribution of Ag HHs according to Information Source
by Crop.
8.9
6.6
10.2
7.0
6.8
5.2
6.8
11.9
5.1
5.3
7.0
6.3
6.2
8.9
5.0
9.3
14.1
15.4
17.0
17.3
18.2
15.6
18.6
21.4
67.3
66.9
58.3
65.7
62.0
64.1
58.6
53.2
4.5
7.6
3.8
6.9
6.3
11.0
4.2
5.8
Cassava
Maize
Beans
Banana
Finger Millet
Groundnnuts
Simsim
Irish potato
Crop
thru regular govt extension thru NAADS thru mass media talk to other farmers other
6.9.3 Use of variety The majority of Ag HHs interviewed had not used each of the improved varieties
under study especially for Simsim (87.4%), Bananas (83.0%) and Finger Millet with
80.6%. Maize, Cassava and Groundnuts were the most used varieties respectively as
shown in Table 6.32 and Figure 6.18

113
Table 6.32: Percentage Distribution of Ag HHs that had ever used variety
Improved variety yes, during the last 12 months
yes, used it in the past no Total
Cassava 21.6 14.6 63.8 100
Maize 26.6 19.1 54.4 100 Beans 12.6 19.8 67.6 100 Banana 9.6 7.4 83.0 100 Finger Millet 8.2 11.3 80.6 100 Groundnuts 13.8 10.0 76.2 100 Simsim 7.3 5.3 87.4 100 Irish potato 13.1 13.9 73.0 100
Figure 6.18 Percentage Distribution of Ag HHs according to use of variety
21.6
26.6
12.6
9.6
8.2
13.8
7.3
13.1
14.6
19.1
19.8
7.4
11.3
10.0
5.3
13.9
63.8
54.4
67.6
83.0
80.6
76.2
87.4
73.0
Cassava
Maize
Beans
Banana
Finger Millet
Groundnnuts
Simsim
Irish potato
Crop
yes, during the last 12 months yes, used it in the past no
6.10 Summary of Findings
At the national level, the use of non-labour inputs is still very low with improved seeds
being used by 6.8 percent of the entire parcels; Manure 6.8 percent; Chemical
Fertilizers 1.0 percent and Pesticides, Herbicides and Fungicides by 3.4 percent.
The number of Labour Days for both seasons totaled 1,263 million and Hired Labour
constituted 116 million (9.2%) with Western Region supplying the highest Labour
Days (47 million).

114
Rain Shortage was reported as the main cause of crop damage affecting 4.7 million
crop plots (19.4%) out of the estimated 24.2 million crop plots.
There were generally small increments between 2000 and 2005 for practice of 3 soil
conservation measures namely bunds, terracing and mulching.
Only 300,000 (7.3%) of the 4.1 million Ag HHs reported having been visited by an
extension worker with the Northern Region reporting the least.
About 10 per cent of the Ag HHs reported having a household member that
participated in a training programme organized by NAADS. In addition about 5.4% of
the Ag HHs had at least a member in Farmer groups under NAADS.
Few heads of households (15.3%) reported being knowledgeable on the changes in
the Land Tenure System brought about by 1998 Land Act.
About 44 per cent of Ag HHs were willing to pay for information on improved varieties
while 68 percent of Ag HHs had no access to information on farm management.
Finally, the most common source of information reported by 60 percent of the farmers
is by talking to other farmers.
115
List of References
UBOS, The Uganda National Household Survey 2005/2006, Report on the Socio-economic Survey,
UBOS, Population and Housing Census, Agricultural Module 2002
UBOS, Pilot Census of Agriculture (PCA) 2003
UBOS, Permanent Agricultural Statistics System (PASS) Reports
UBOS, Informal Cross Border Trade Reports
Statistics Department, MFPED; The Integrated Household Survey (IHS) 1992/93
Statistics Department, MFPED; The First Monitoring Survey (FMS) 1993/94
Statistics Department, MFPED; The Second Monitoring Survey (SMS) 1994/95
Statistics Department, MFPED; The Third Monitoring Survey (TMS) 1995/96
Statistics Department, MFPED; The Uganda Household Survey (UNHS) 1999/2000
Ministry of Agriculture, Animal Industry and Fisheries; Uganda National Census of Agriculture and
Livestock (UNCAL) 1990/91
Ministry of Agriculture; Census of Agriculture, 1963/65
116
ANNEXES Annex 1: Appendix Tables Annex 2: Standard Errors Annex 3: Glossary of Agricultural Module Terms Annex 4: Questionnaires
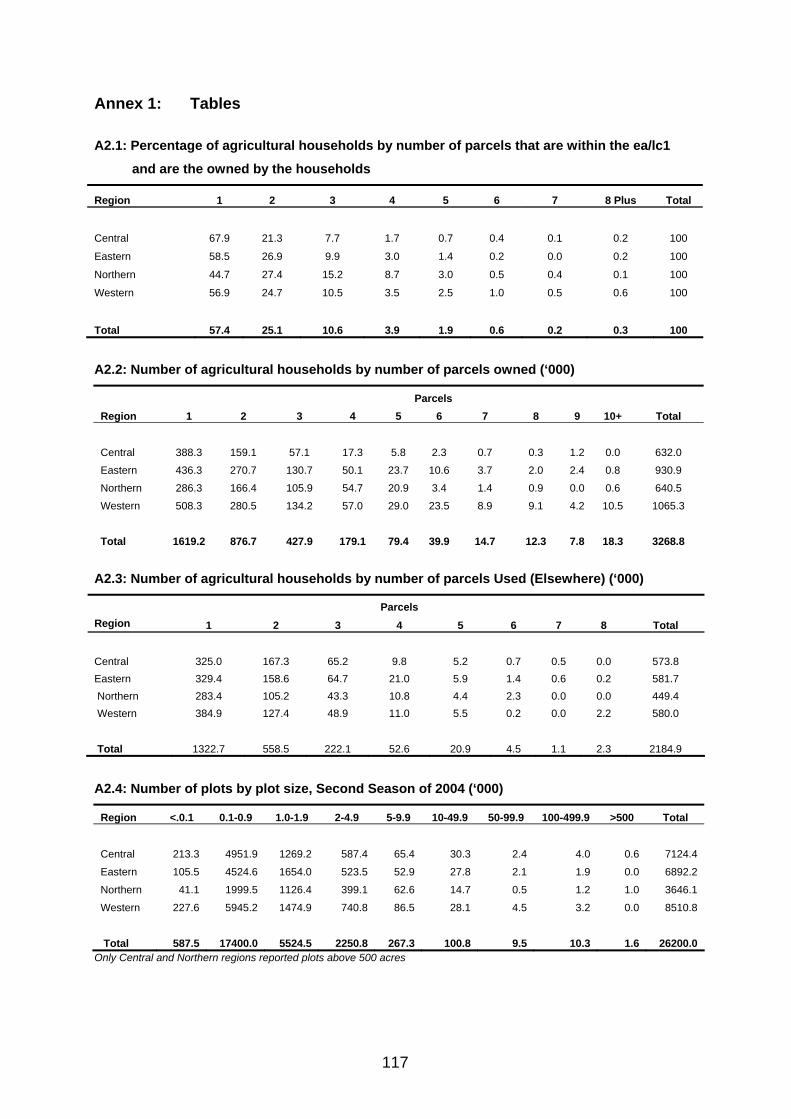
117
Annex 1: Tables
A2.1: Percentage of agricultural households by number of parcels that are within the ea/lc1
and are the owned by the households
Region 1 2 3 4 5 6 7 8 Plus Total
Central 67.9 21.3 7.7 1.7 0.7 0.4 0.1 0.2 100
Eastern 58.5 26.9 9.9 3.0 1.4 0.2 0.0 0.2 100
Northern 44.7 27.4 15.2 8.7 3.0 0.5 0.4 0.1 100
Western 56.9 24.7 10.5 3.5 2.5 1.0 0.5 0.6 100
Total 57.4 25.1 10.6 3.9 1.9 0.6 0.2 0.3 100
A2.2: Number of agricultural households by number of parcels owned (‘000)
Parcels Region 1 2 3 4 5 6 7 8 9 10+ Total
Central 388.3 159.1 57.1 17.3 5.8 2.3 0.7 0.3 1.2 0.0 632.0
Eastern 436.3 270.7 130.7 50.1 23.7 10.6 3.7 2.0 2.4 0.8 930.9
Northern 286.3 166.4 105.9 54.7 20.9 3.4 1.4 0.9 0.0 0.6 640.5
Western 508.3 280.5 134.2 57.0 29.0 23.5 8.9 9.1 4.2 10.5 1065.3
Total 1619.2 876.7 427.9 179.1 79.4 39.9 14.7 12.3 7.8 18.3 3268.8
A2.3: Number of agricultural households by number of parcels Used (Elsewhere) (‘000)
Parcels Region 1 2 3 4 5 6 7 8 Total
Central 325.0 167.3 65.2 9.8 5.2 0.7 0.5 0.0 573.8 Eastern 329.4 158.6 64.7 21.0 5.9 1.4 0.6 0.2 581.7 Northern 283.4 105.2 43.3 10.8 4.4 2.3 0.0 0.0 449.4 Western 384.9 127.4 48.9 11.0 5.5 0.2 0.0 2.2 580.0
Total 1322.7 558.5 222.1 52.6 20.9 4.5 1.1 2.3 2184.9
A2.4: Number of plots by plot size, Second Season of 2004 (‘000)
Region <.0.1 0.1-0.9 1.0-1.9 2-4.9 5-9.9 10-49.9 50-99.9 100-499.9 >500 Total
Central 213.3 4951.9 1269.2 587.4 65.4 30.3 2.4 4.0 0.6 7124.4
Eastern 105.5 4524.6 1654.0 523.5 52.9 27.8 2.1 1.9 0.0 6892.2
Northern 41.1 1999.5 1126.4 399.1 62.6 14.7 0.5 1.2 1.0 3646.1
Western 227.6 5945.2 1474.9 740.8 86.5 28.1 4.5 3.2 0.0 8510.8
Total 587.5 17400.0 5524.5 2250.8 267.3 100.8 9.5 10.3 1.6 26200.0 Only Central and Northern regions reported plots above 500 acres

118
A2.5: Number of plots by plot size, First Season of 2005 (‘000)
Plot Area (Acres) ('000)
Region <.0.1 0.1-0.9 1.0-1.9 2-4.9 5-9.9 10-49.9 50-99.9 100-499.9 >500 Total
Central 313.7 5713.8 1298.3 614.5 65.7 25.0 2.4 6.9 480.1 8520.4 Eastern 167.4 6476.0 1918.3 591.8 50.8 23.9 3.1 1.4 240.1 9472.8 Northern 65.7 2765.6 1324.2 403.6 56.9 14.4 1.8 1.8 203.5 4837.5 Western 301.0 6410.6 1469.5 714.3 87.4 28.8 3.4 2.7 299.3 9317.0
Total 847.8 21400.0 6010.3 2324.3 260.8 92.0 10.8 12.9 1223.0 32100.0
A2.6: Number of plots by plot size, Second Season of 2004of 2004 excluding fallow and
grazing land and woodlots (‘000)
Region <.0.1 0.1-0.9 1.0-1.9 2-4.9 5-9.9 10-49.9 50-99.9 100-499.9 >500 Total Central 109.4 2915.0 823.2 372.3 36.2 19.4 1.8 1.4 11.4 4289.9
Eastern 89.5 3451.1 1242.8 386.0 32.2 18.7 1.3 0.8 36.6 5259.1
Northern 25.9 1270.8 695.6 239.4 38.5 9.8 0.5 0.6 14.2 2295.3
Western 173.2 4591.0 1232.0 604.7 67.5 16.5 2.6 2.4 59.8 6749.6
Total 397.9 12200.00 3993.5 1602.5 174.4 64.4 6.2 5.2 122.0 18600.0
A2.7: Agricultural Households by total size (f.ext) - holding size (land owned with in ea)
excluding parcels rented out Second Season of 2004 land use
Parcels
Region <0.1 0.1-0.9
1.0-1.9 2-4.9 5-9.9 10-49.9 50-99.9 100-499.9 >500 Missing Total
Central 2.6 117.3 123.1 169.2 83.0 38.5 4.5 3.8 2.5 1.2 545.7 Eastern 0.6 214.3 220.5 285.3 99.6 32.7 3.2 0.8 0.8 1.7 859.6 Northern 0.1 71.8 91.3 196.3 86.2 32.6 2.6 0.0 1.0 0.6 482.4 Western 8.0 235.8 246.4 336.7 108.0 68.0 3.3 4.2 0.0 0.9 1011.3 Total 11.3 639.2 681.2 987.5 376.8 171.8 13.6 8.8 4.3 4.4 2899.0
A2.8: Households by geographical location of the parcels (Number and percentages) ('000)
Region
Parcels only inside ea/lc1
Parcel within the parish
Parcel outside parish
With in district
Other districts Total
Total Agricultural hhs
Total Number of households
Central
546
107
25
15
14
707
1,014 1,666
Eastern
860
175
52
37
12
1,136
1,103 1,216
Northern
482
109
71
60
11
734
866 1,033
Western
1,011
210
49
30
9
1,309
1,169 1,317
Total
2,899
601
197
143
46
3,886
4,151 5,233
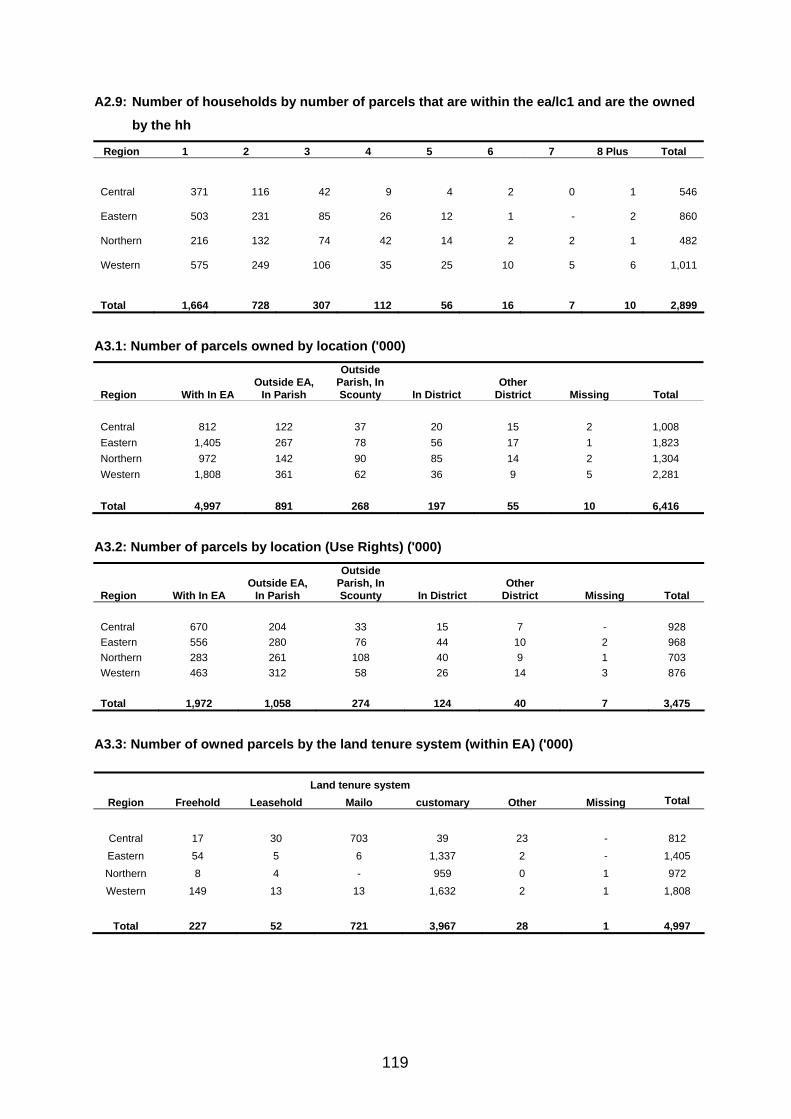
119
A2.9: Number of households by number of parcels that are within the ea/lc1 and are the owned
by the hh
Region 1 2 3 4 5 6 7 8 Plus Total
Central
371
116
42
9
4
2
0
1
546
Eastern
503
231
85
26
12
1
-
2
860
Northern
216
132
74
42
14
2
2
1
482
Western
575
249
106
35
25
10
5
6
1,011
Total
1,664
728
307
112
56
16
7
10
2,899
A3.1: Number of parcels owned by location ('000)
Region With In EA Outside EA,
In Parish
Outside Parish, In Scounty In District
Other District Missing Total
Central 812 122 37 20 15 2 1,008 Eastern 1,405 267 78 56 17 1 1,823 Northern 972 142 90 85 14 2 1,304 Western 1,808 361 62 36 9 5 2,281 Total 4,997 891 268 197 55 10 6,416
A3.2: Number of parcels by location (Use Rights) ('000)
Region With In EA Outside EA,
In Parish
Outside Parish, In Scounty In District
Other District Missing Total
Central 670 204 33 15 7 - 928 Eastern 556 280 76 44 10 2 968 Northern 283 261 108 40 9 1 703 Western 463 312 58 26 14 3 876 Total 1,972 1,058 274 124 40 7 3,475
A3.3: Number of owned parcels by the land tenure system (within EA) ('000)
Land tenure system Region Freehold Leasehold Mailo customary Other Missing Total
Central 17 30 703 39 23 - 812 Eastern 54 5 6 1,337 2 - 1,405 Northern 8 4 - 959 0 1 972 Western 149 13 13 1,632 2 1 1,808
Total 227 52 721 3,967 28 1 4,997
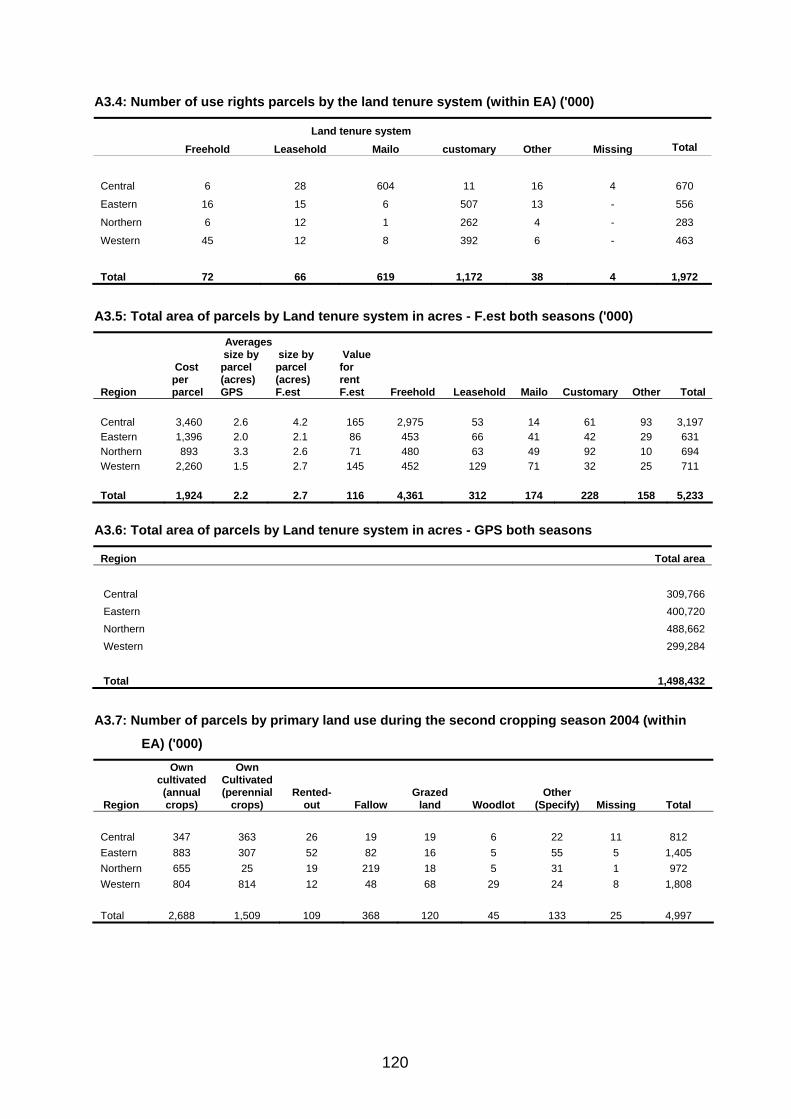
120
A3.4: Number of use rights parcels by the land tenure system (within EA) ('000)
Land tenure system Freehold Leasehold Mailo customary Other Missing Total
Central 6 28 604 11 16 4 670
Eastern 16 15 6 507 13 - 556
Northern 6 12 1 262 4 - 283
Western 45 12 8 392 6 - 463
Total 72 66 619 1,172 38 4 1,972
A3.5: Total area of parcels by Land tenure system in acres - F.est both seasons ('000)
Averages
Region
Cost per parcel
size by parcel (acres) GPS
size by parcel (acres) F.est
Value for rent F.est Freehold Leasehold Mailo Customary Other Total
Central 3,460 2.6 4.2 165 2,975 53 14 61 93 3,197 Eastern 1,396 2.0 2.1 86 453 66 41 42 29 631 Northern 893 3.3 2.6 71 480 63 49 92 10 694 Western 2,260 1.5 2.7 145 452 129 71 32 25 711 Total 1,924 2.2 2.7 116 4,361 312 174 228 158 5,233
A3.6: Total area of parcels by Land tenure system in acres - GPS both seasons
Region Total area Central 309,766 Eastern 400,720 Northern 488,662 Western 299,284 Total 1,498,432
A3.7: Number of parcels by primary land use during the second cropping season 2004 (within
EA) ('000)
Region
Own cultivated (annual crops)
Own Cultivated (perennial
crops) Rented-
out Fallow Grazed
land Woodlot Other
(Specify) Missing Total Central 347 363 26 19 19 6 22 11 812 Eastern 883 307 52 82 16 5 55 5 1,405 Northern 655 25 19 219 18 5 31 1 972 Western 804 814 12 48 68 29 24 8 1,808 Total 2,688 1,509 109 368 120 45 133 25 4,997
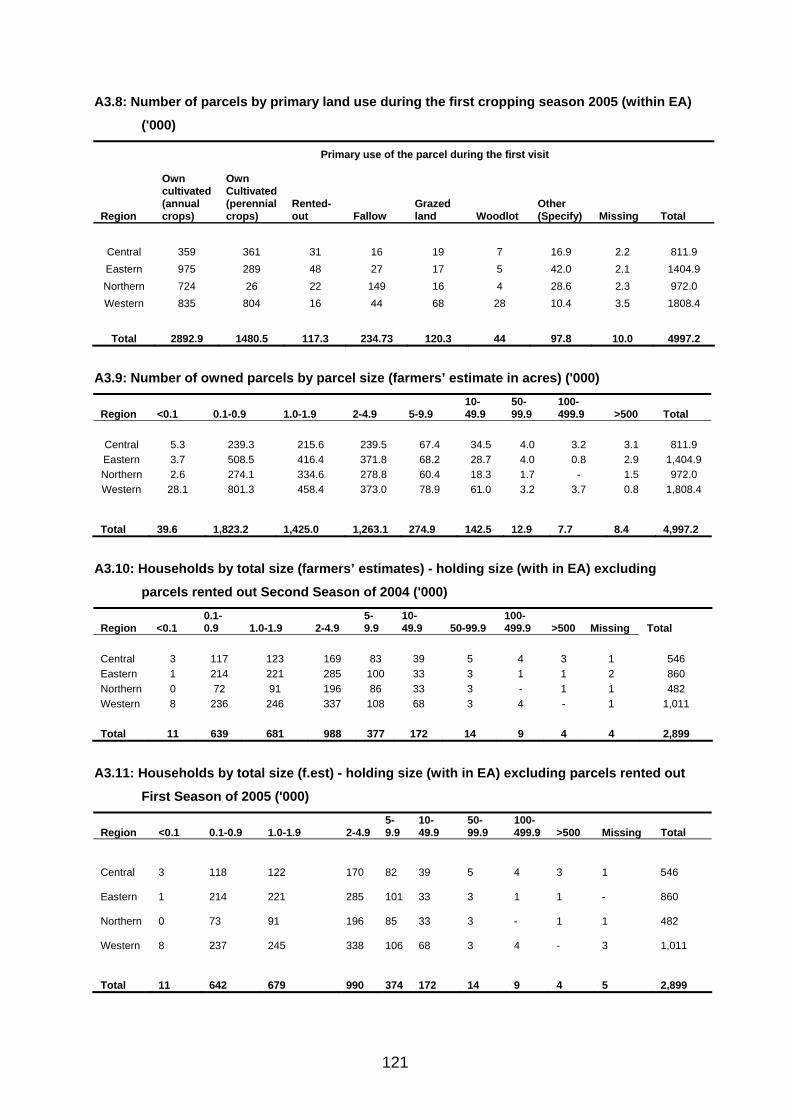
121
A3.8: Number of parcels by primary land use during the first cropping season 2005 (within EA)
('000)
Primary use of the parcel during the first visit
Region
Own cultivated (annual crops)
Own Cultivated (perennial crops)
Rented-out Fallow
Grazed land Woodlot
Other (Specify) Missing Total
Central 359 361 31 16 19 7 16.9 2.2 811.9 Eastern 975 289 48 27 17 5 42.0 2.1 1404.9 Northern 724 26 22 149 16 4 28.6 2.3 972.0 Western 835 804 16 44 68 28 10.4 3.5 1808.4
Total 2892.9 1480.5 117.3 234.73 120.3 44 97.8 10.0 4997.2
A3.9: Number of owned parcels by parcel size (farmers’ estimate in acres) ('000)
Region <0.1 0.1-0.9 1.0-1.9 2-4.9 5-9.9 10-49.9
50-99.9
100-499.9 >500 Total
Central 5.3 239.3 215.6 239.5 67.4 34.5 4.0 3.2 3.1 811.9 Eastern 3.7 508.5 416.4 371.8 68.2 28.7 4.0 0.8 2.9 1,404.9 Northern 2.6 274.1 334.6 278.8 60.4 18.3 1.7 - 1.5 972.0 Western 28.1 801.3 458.4 373.0 78.9 61.0 3.2 3.7 0.8 1,808.4
Total 39.6
1,823.2
1,425.0
1,263.1
274.9
142.5
12.9
7.7
8.4
4,997.2
A3.10: Households by total size (farmers’ estimates) - holding size (with in EA) excluding
parcels rented out Second Season of 2004 ('000)
Region <0.1 0.1-0.9 1.0-1.9 2-4.9
5-9.9
10-49.9 50-99.9
100-499.9 >500 Missing Total
Central 3 117 123 169 83 39 5 4 3 1 546 Eastern 1 214 221 285 100 33 3 1 1 2 860 Northern 0 72 91 196 86 33 3 - 1 1 482 Western 8 236 246 337 108 68 3 4 - 1 1,011 Total 11 639 681 988 377 172 14 9 4 4 2,899
A3.11: Households by total size (f.est) - holding size (with in EA) excluding parcels rented out
First Season of 2005 ('000)
Region <0.1 0.1-0.9 1.0-1.9 2-4.9 5-9.9
10-49.9
50-99.9
100-499.9 >500 Missing Total
Central 3
118
122
170
82
39
5
4
3
1
546
Eastern 1
214
221
285
101
33
3
1
1
-
860
Northern 0
73
91
196
85
33
3
-
1
1
482
Western 8
237
245
338
106
68
3
4
-
3
1,011
Total 11
642
679
990
374
172
14
9
4
5
2,899

122
A3.12: Households by total size (f.est) - holding size (with in ea) excluding parcels rented out
First Season of 2005
Region <0.1 0.1-0.9 1.0-1.9 2-4.9 5-9.9 10-49.9 50-99.9 100-499.9 >500 Missing Total
Central 0.48 21.60 22.44 31.18 15.03 7.06 0.83 0.70 0.46 0.22 100 Eastern 0.08 24.93 25.75 33.19 11.70 3.81 0.37 0.09 0.10 0.00 100 Northern 0.01 15.16 18.82 40.70 17.70 6.75 0.53 0.00 0.20 0.12 100 Western 0.79 23.41 24.19 33.40 10.46 6.72 0.32 0.41 0.00 0.29 100 Total 0.39 22.15 23.43 34.13 12.89 5.93 0.47 0.30 0.15 0.16 100
A3.13: Number of parcels by average selling price per acre ('000)
<500 500-999
1000-1999
2000-2999
3000-3999 4000-9999 10000+ missing total
Central 318 223 220 103 27 72 37 8 1,008 Eastern 535 501 478 160 46 69 27 5 1,823 Northern 861 195 124 51 22 30 16 4 1,304 Western 585 436 587 288 115 182 79 9 2,281
Total 2,299 1,355 1,409 602 211 354 159 27 6,416
A3.14: Number of owned parcels by land tenure ('000)
Land tenure system Region Freehold Leasehold Mailo customary Other Missing Total Central 18 35 876 50 26 2 1,008 Eastern 71 5 7 1,737 2 1 1,823 Northern 12 5 - 1,284 0 2 1,304 Western 192 20 15 2,045 3 5 2,281 Total 293 65 898 5,117 32 10 6,416
A3.15: Average land value (owned parcels) per acre in shs by tenure system (Selling) ('000)
Region Freehold Leasehold Mailo Customary Other Total Central 4,901 6,971 4,426 1,930 3,191 4,366 Eastern 3,890 16,900 2,587 2,160 225 2,269 Northern 2,522 31,400 - 1,450 2,000 1,573 Western 7,778 8,086 43,200 2,687 800 3,422 Total 6,434 9,923 5,052 2,191 2,763 2,866
A3.16: Average land value (owned parcels) per acre in shs by tenure system (Renting) ('000)
Freehold Leasehold Mailo customary Other Total
Central 285 2,034 324 207 144 372 Eastern 602 848 74 132 15 152 Northern 141 3,554 - 140 100 152 Western 516 918 5,046 141 200 211
Total 507 1,709 400 138 139 208

123
A3.17: Average land value (use rights parcels) per acre in shs by tenure system (Willing to Pay)
('000)
Region Freehold Leasehold Mailo Customary Other Total Central 609 9,863 1,148 205 2,762 1,422 Eastern 1,118 553 743 573 1,959 627 Northern 1,019 1,511 250 541 194 586 Western 658 696 1,801 643 466 660
Total 809 3,407 1,153 594 1,839 871
A3.18: Average land value (use rights parcels) per acre in shs by tenure system sale of use
rights
Region Freehold Leasehold Mailo Customary Other Total Central 168 567 786 193 196 750
Eastern 75 70 2 182 307 174
Northern 243 306 - 134 152 142
Western 659 282 607 89 1,155 208
Total 473 345 774 144 334 437
A3.19: Number of Parcels by soil/land quality ('000)
Region Good Fair Poor Total
Central 654 895 365 1,914
Eastern 1,057 1,457 267 2,780
Northern 1,107 752 129 1,988
Western 1,405 1,425 295 3,126
Total 4,223 4,529 1,056 9,808
A3.20: Main water source ('000)
Region Irrigated Rain fall Swamp/wetland Total
Central 38 1,830 47 1,914
Eastern 12 2,652 114 2,777
Northern 3 1,931 55 1,989
Western 33 3,017 73 3,123
Total 85 9,430 289 9,803
A3.21: Topology of the parcel ('000)
Region Hilly Flat Gentle slope Steep Slope Valley Others Total
Central 255 550 985 43 77 1,911 Eastern 142 1,670 853 67 47 1 2,780 Northern 45 1,419 461 31 26 1 1,983 Western 633 958 1,154 197 179 3 3,125 Total 1,075 4,597 3,454 338 330 5 9,798
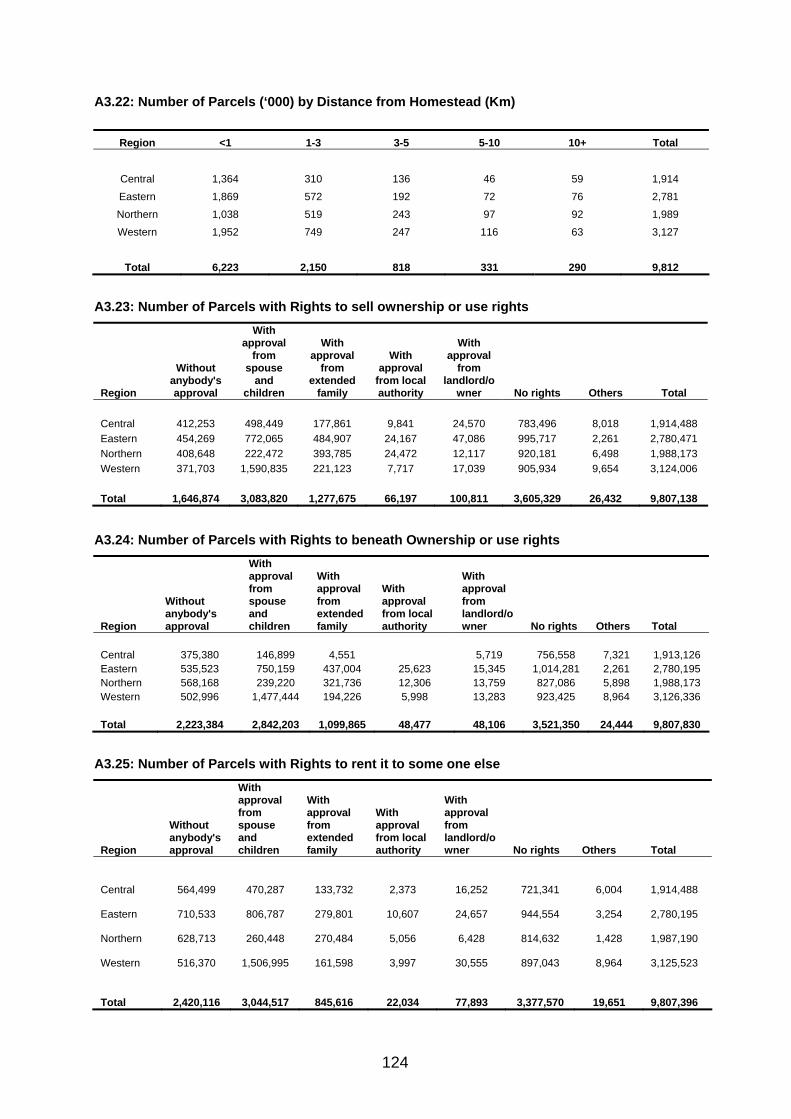
124
A3.22: Number of Parcels (‘000) by Distance from Homestead (Km)
Region <1 1-3 3-5 5-10 10+ Total
Central 1,364 310 136 46 59 1,914
Eastern 1,869 572 192 72 76 2,781
Northern 1,038 519 243 97 92 1,989
Western 1,952 749 247 116 63 3,127
Total 6,223 2,150 818 331 290 9,812
A3.23: Number of Parcels with Rights to sell ownership or use rights
Region
Without anybody's approval
With approval
from spouse
and children
With approval
from extended
family
With approval
from local authority
With approval
from landlord/o
wner No rights Others Total Central 412,253 498,449 177,861 9,841 24,570 783,496 8,018 1,914,488 Eastern 454,269 772,065 484,907 24,167 47,086 995,717 2,261 2,780,471 Northern 408,648 222,472 393,785 24,472 12,117 920,181 6,498 1,988,173 Western 371,703 1,590,835 221,123 7,717 17,039 905,934 9,654 3,124,006 Total 1,646,874 3,083,820 1,277,675 66,197 100,811 3,605,329 26,432 9,807,138
A3.24: Number of Parcels with Rights to beneath Ownership or use rights
Region
Without anybody's approval
With approval from spouse and children
With approval from extended family
With approval from local authority
With approval from landlord/owner No rights Others Total
Central 375,380 146,899 4,551 5,719 756,558 7,321 1,913,126 Eastern 535,523 750,159 437,004 25,623 15,345 1,014,281 2,261 2,780,195 Northern 568,168 239,220 321,736 12,306 13,759 827,086 5,898 1,988,173 Western 502,996 1,477,444 194,226 5,998 13,283 923,425 8,964 3,126,336 Total 2,223,384 2,842,203 1,099,865 48,477 48,106 3,521,350 24,444 9,807,830
A3.25: Number of Parcels with Rights to rent it to some one else
Region
Without anybody's approval
With approval from spouse and children
With approval from extended family
With approval from local authority
With approval from landlord/owner No rights Others Total
Central 564,499 470,287 133,732 2,373 16,252 721,341 6,004 1,914,488
Eastern 710,533 806,787 279,801 10,607 24,657 944,554 3,254 2,780,195
Northern 628,713 260,448 270,484 5,056 6,428 814,632 1,428 1,987,190
Western 516,370 1,506,995 161,598 3,997 30,555 897,043 8,964 3,125,523
Total 2,420,116 3,044,517 845,616 22,034 77,893 3,377,570 19,651 9,807,396
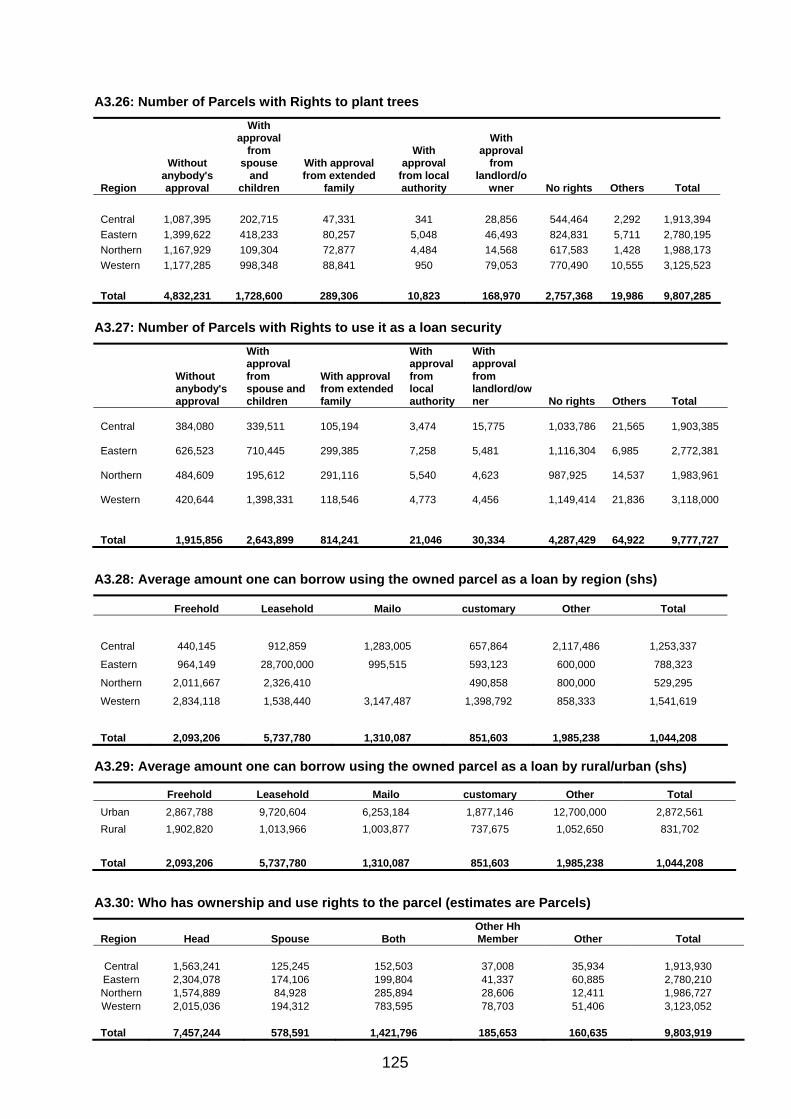
125
A3.26: Number of Parcels with Rights to plant trees
Region
Without anybody's approval
With approval
from spouse
and children
With approval from extended
family
With approval
from local authority
With approval
from landlord/o
wner No rights Others Total Central 1,087,395 202,715 47,331 341 28,856 544,464 2,292 1,913,394 Eastern 1,399,622 418,233 80,257 5,048 46,493 824,831 5,711 2,780,195 Northern 1,167,929 109,304 72,877 4,484 14,568 617,583 1,428 1,988,173 Western 1,177,285 998,348 88,841 950 79,053 770,490 10,555 3,125,523 Total 4,832,231 1,728,600 289,306 10,823 168,970 2,757,368 19,986 9,807,285
A3.27: Number of Parcels with Rights to use it as a loan security
Without anybody's approval
With approval from spouse and children
With approval from extended family
With approval from local authority
With approval from landlord/owner No rights Others Total
Central 384,080
339,511
105,194
3,474
15,775
1,033,786
21,565
1,903,385
Eastern 626,523
710,445
299,385
7,258
5,481
1,116,304
6,985
2,772,381
Northern 484,609
195,612
291,116
5,540
4,623
987,925
14,537
1,983,961
Western 420,644
1,398,331
118,546
4,773
4,456
1,149,414
21,836
3,118,000
Total 1,915,856
2,643,899
814,241
21,046
30,334
4,287,429
64,922
9,777,727
A3.28: Average amount one can borrow using the owned parcel as a loan by region (shs)
Freehold Leasehold Mailo customary Other Total
Central 440,145 912,859 1,283,005 657,864 2,117,486 1,253,337
Eastern 964,149 28,700,000 995,515 593,123 600,000 788,323
Northern 2,011,667 2,326,410 490,858 800,000 529,295
Western 2,834,118 1,538,440 3,147,487 1,398,792 858,333 1,541,619
Total 2,093,206 5,737,780 1,310,087 851,603 1,985,238 1,044,208
A3.29: Average amount one can borrow using the owned parcel as a loan by rural/urban (shs)
Freehold Leasehold Mailo customary Other Total Urban 2,867,788 9,720,604 6,253,184 1,877,146 12,700,000 2,872,561 Rural 1,902,820 1,013,966 1,003,877 737,675 1,052,650 831,702 Total 2,093,206 5,737,780 1,310,087 851,603 1,985,238 1,044,208
A3.30: Who has ownership and use rights to the parcel (estimates are Parcels)
Region Head Spouse Both Other Hh Member Other Total
Central 1,563,241 125,245 152,503 37,008 35,934 1,913,930 Eastern 2,304,078 174,106 199,804 41,337 60,885 2,780,210 Northern 1,574,889 84,928 285,894 28,606 12,411 1,986,727 Western 2,015,036 194,312 783,595 78,703 51,406 3,123,052
Total 7,457,244 578,591 1,421,796 185,653 160,635 9,803,919
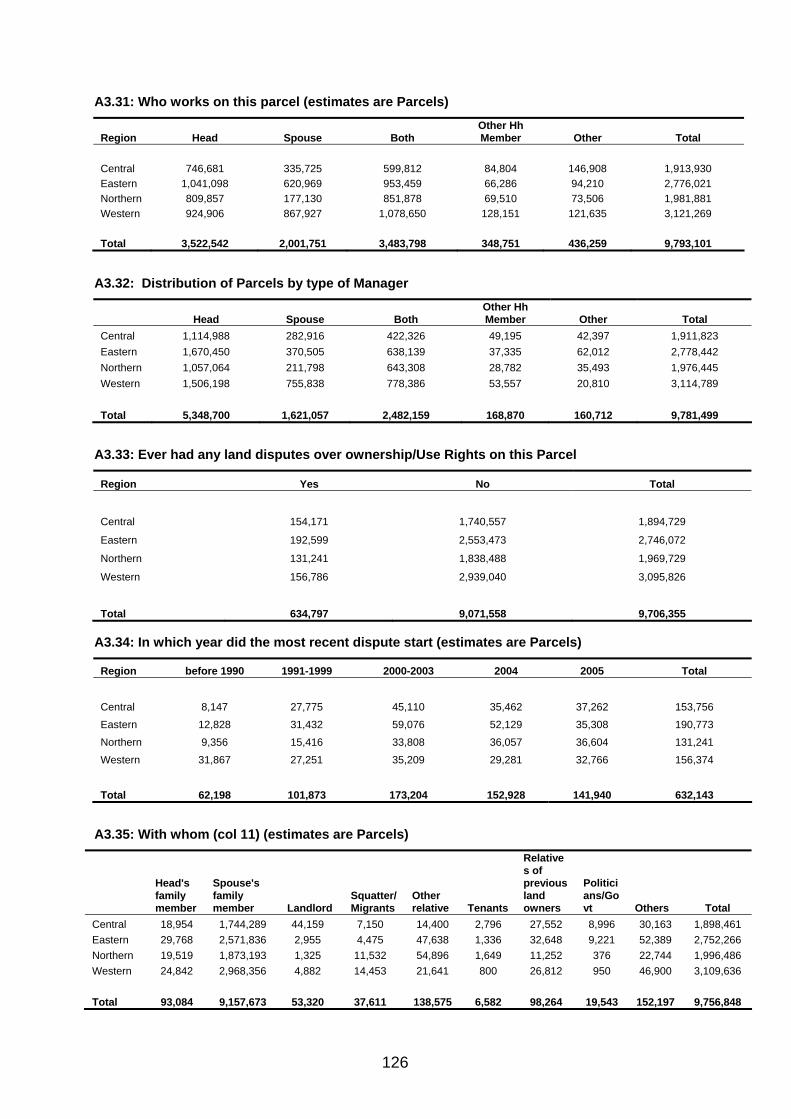
126
A3.31: Who works on this parcel (estimates are Parcels)
Region Head Spouse Both Other Hh Member Other Total
Central 746,681 335,725 599,812 84,804 146,908 1,913,930 Eastern 1,041,098 620,969 953,459 66,286 94,210 2,776,021 Northern 809,857 177,130 851,878 69,510 73,506 1,981,881 Western 924,906 867,927 1,078,650 128,151 121,635 3,121,269 Total 3,522,542 2,001,751 3,483,798 348,751 436,259 9,793,101
A3.32: Distribution of Parcels by type of Manager
Head Spouse Both Other Hh Member Other Total
Central 1,114,988 282,916 422,326 49,195 42,397 1,911,823 Eastern 1,670,450 370,505 638,139 37,335 62,012 2,778,442 Northern 1,057,064 211,798 643,308 28,782 35,493 1,976,445 Western 1,506,198 755,838 778,386 53,557 20,810 3,114,789 Total 5,348,700 1,621,057 2,482,159 168,870 160,712 9,781,499
A3.33: Ever had any land disputes over ownership/Use Rights on this Parcel
Region Yes No Total
Central 154,171 1,740,557 1,894,729
Eastern 192,599 2,553,473 2,746,072
Northern 131,241 1,838,488 1,969,729
Western 156,786 2,939,040 3,095,826
Total 634,797 9,071,558 9,706,355
A3.34: In which year did the most recent dispute start (estimates are Parcels)
Region before 1990 1991-1999 2000-2003 2004 2005 Total Central 8,147 27,775 45,110 35,462 37,262 153,756 Eastern 12,828 31,432 59,076 52,129 35,308 190,773 Northern 9,356 15,416 33,808 36,057 36,604 131,241 Western 31,867 27,251 35,209 29,281 32,766 156,374 Total 62,198 101,873 173,204 152,928 141,940 632,143
A3.35: With whom (col 11) (estimates are Parcels)
Head's family member
Spouse's family member Landlord
Squatter/Migrants
Other relative Tenants
Relatives of previous land owners
Politicians/Govt Others Total
Central 18,954 1,744,289 44,159 7,150 14,400 2,796 27,552 8,996 30,163 1,898,461 Eastern 29,768 2,571,836 2,955 4,475 47,638 1,336 32,648 9,221 52,389 2,752,266 Northern 19,519 1,873,193 1,325 11,532 54,896 1,649 11,252 376 22,744 1,996,486 Western 24,842 2,968,356 4,882 14,453 21,641 800 26,812 950 46,900 3,109,636 Total 93,084 9,157,673 53,320 37,611 138,575 6,582 98,264 19,543 152,197 9,756,848
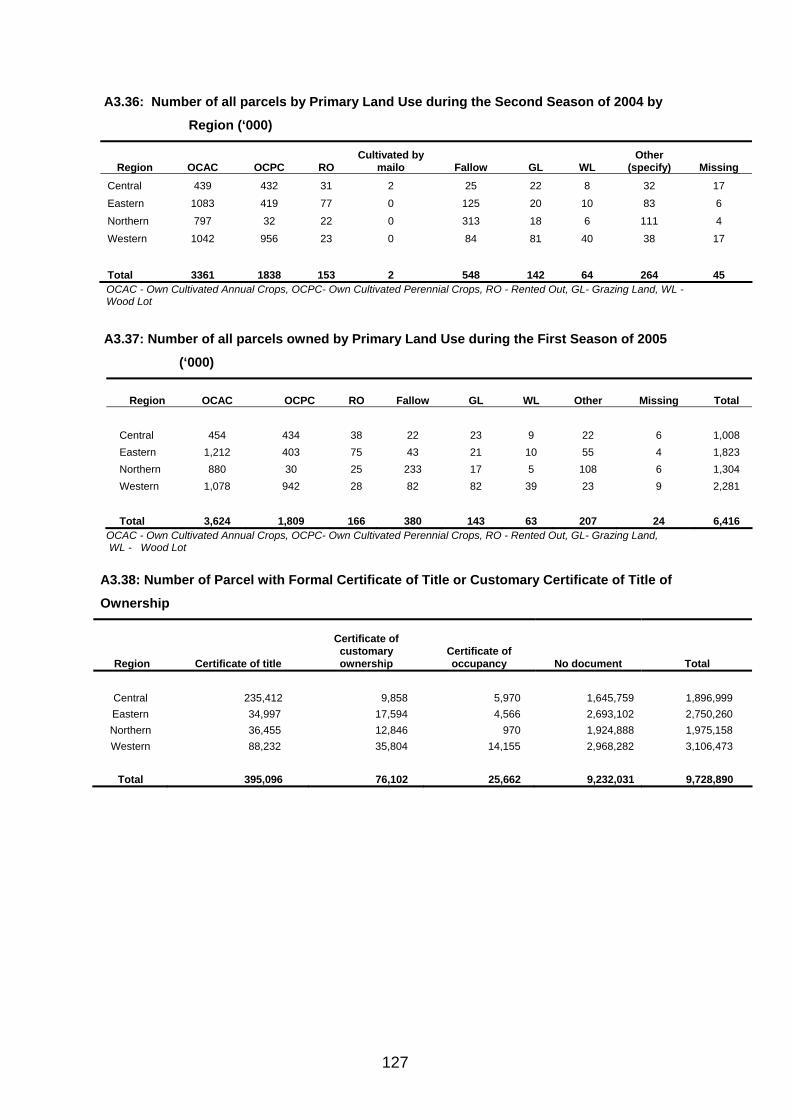
127
A3.36: Number of all parcels by Primary Land Use during the Second Season of 2004 by
Region (‘000)
Region OCAC OCPC RO Cultivated by
mailo Fallow GL WL Other
(specify) Missing Central 439 432 31 2 25 22 8 32 17 Eastern 1083 419 77 0 125 20 10 83 6 Northern 797 32 22 0 313 18 6 111 4 Western 1042 956 23 0 84 81 40 38 17
Total 3361 1838 153 2 548 142 64 264 45 OCAC - Own Cultivated Annual Crops, OCPC- Own Cultivated Perennial Crops, RO - Rented Out, GL- Grazing Land, WL - Wood Lot
A3.37: Number of all parcels owned by Primary Land Use during the First Season of 2005
(‘000)
Region OCAC OCPC RO Fallow GL WL Other Missing Total Central 454 434 38 22 23 9 22 6 1,008 Eastern 1,212 403 75 43 21 10 55 4 1,823 Northern 880 30 25 233 17 5 108 6 1,304 Western 1,078 942 28 82 82 39 23 9 2,281
Total 3,624 1,809 166 380 143 63 207 24 6,416 OCAC - Own Cultivated Annual Crops, OCPC- Own Cultivated Perennial Crops, RO - Rented Out, GL- Grazing Land, WL - Wood Lot
A3.38: Number of Parcel with Formal Certificate of Title or Customary Certificate of Title of
Ownership
Region Certificate of title
Certificate of customary ownership
Certificate of occupancy No document Total
Central 235,412 9,858 5,970 1,645,759 1,896,999 Eastern 34,997 17,594 4,566 2,693,102 2,750,260 Northern 36,455 12,846 970 1,924,888 1,975,158 Western 88,232 35,804 14,155 2,968,282 3,106,473
Total 395,096 76,102 25,662 9,232,031 9,728,890

128
A4.1: Crop area (Ha) by stand for the Second Season of 2004 (CENTRAL) - Within District
Crop Stand
Crop Pure Mixed Total
Maize 104,972 72,926 177,898
Finger millet 3,205 2,788 5,993
Sorghum 1,614 2,044 3,658
Beans 24,126 79,963 104,089
Groundnuts 7,194 10,004 17,198
Simsim 132 27 159
Soya beans 530 312 842
Cassava 36,103 58,262 94,365
Sweet potatoes 70,664 17,050 87,714
Irish potatoes 3,066 2,679 5,745
Banana (Food Type) 81,935 101,992 183,927
Banana (Beer Type) 45,492 24,023 69,515
Banana (Sweet Type) 3,053 7,056 10,109
Coffee (All) 32,698 74,650 107,348
Rice 2,054 - 2,054 A4.2: Crop area (Ha) by stand for the Second Season of 2004 (EASTERN) - Within District
Crop Stand
Crop Pure Mixed Total
Maize 166,058 116,049 282,107
Finger millet 9,123 8,026 17,149
Sorghum 26,386 4,924 31,310
Beans 34,407 61,430 95,837
Groundnuts 18,575 15,170 33,745
Simsim 4,910 1,755 6,665
Soya beans 2,727 5,242 7,970
Cassava 119,426 50,967 170,393
Sweet potatoes 98,486 20,527 119,013
Banana 25,908 61,649 87,557
Banana beer 3,362 9,144 12,506
Banana sweet 721 6,343 7,064
Coffee all 18,370 56,725 75,095
Rice 25,284 - 25,284

129
A4.3: Crop area (Ha) by stand for the Second Season of 2004 (NORTHERN) – Within District
A4.4: Crop area (Ha) by stand for the Second Season of 2004 (WESTERN) – Within District
Crop Stand
Crop Pure Mixed Total
Maize 72,031 69,842 141,873
Finger millet 59,778 24,405 84,183
Sorghum 29,420 7,839 37,259
Beans 52,212 120,747 172,959
Groundnuts 22,835 14,372 37,207
Cassava 36,802 46,617 83,419
Sweet potatoes 81,263 6,245 87,508
Irish potatoes 11,780 5,719 17,499
Banana 105,720 177,064 282,784
Banana beer 32,219 33,952 66,171
Banana sweet 1,298 12,301 13,599
Coffee all 30,960 34,966 65,926
Rice 12,688 - 12,688
Total
Crop Stand
Crop Pure Mixed Total
Maize 47,655 33,780 81,435
Finger millet 16,037 11,377 27,414
Sorghum 38,835 21,771 60,606
Beans 26,791 44,646 71,437
Groundnuts 17,057 14,305 31,362
Simsim 57,766 15,944 73,710
Cassava 90,256 31,520 121,776
Sweet potatoes 22,334 384 22,718
Banana 1,542 1,185 2,727
Coffee all 1,971 1,879 3,850
Rice 3,697 - 3,697
Total
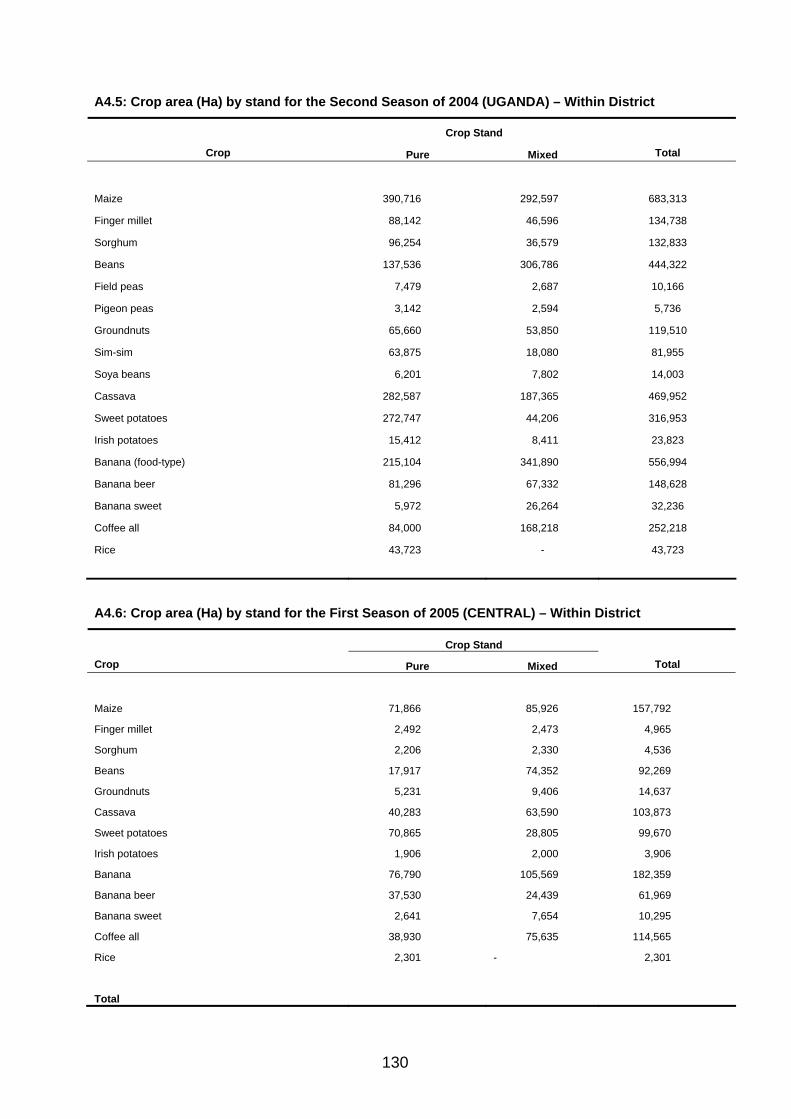
130
A4.5: Crop area (Ha) by stand for the Second Season of 2004 (UGANDA) – Within District
Crop Stand
Crop Pure Mixed Total
Maize 390,716 292,597 683,313
Finger millet 88,142 46,596 134,738
Sorghum 96,254 36,579 132,833
Beans 137,536 306,786 444,322
Field peas 7,479 2,687 10,166
Pigeon peas 3,142 2,594 5,736
Groundnuts 65,660 53,850 119,510
Sim-sim 63,875 18,080 81,955
Soya beans 6,201 7,802 14,003
Cassava 282,587 187,365 469,952
Sweet potatoes 272,747 44,206 316,953
Irish potatoes 15,412 8,411 23,823
Banana (food-type) 215,104 341,890 556,994
Banana beer 81,296 67,332 148,628
Banana sweet 5,972 26,264 32,236
Coffee all 84,000 168,218 252,218
Rice 43,723 - 43,723
A4.6: Crop area (Ha) by stand for the First Season of 2005 (CENTRAL) – Within District
Crop Stand
Crop Pure Mixed Total
Maize 71,866 85,926 157,792
Finger millet 2,492 2,473 4,965
Sorghum 2,206 2,330 4,536
Beans 17,917 74,352 92,269
Groundnuts 5,231 9,406 14,637
Cassava 40,283 63,590 103,873
Sweet potatoes 70,865 28,805 99,670
Irish potatoes 1,906 2,000 3,906
Banana 76,790 105,569 182,359
Banana beer 37,530 24,439 61,969
Banana sweet 2,641 7,654 10,295
Coffee all 38,930 75,635 114,565
Rice 2,301 - 2,301
Total

131
A4.7: Crop area (Ha) by stand for the First Season 2005 (EASTERN) – Within District
Crop Stand
Crop Pure Mixed Total
Maize 213,652 188,702 402,354
Finger millet 34,203 48,073 82,276
Sorghum 32,356 18,327 50,683
Beans 6,688 78,370 85,058
Groundnuts 32,442 32,998 65,440
Sim-sim 2,046 2,786 4,832
Soya beans 1,830 4,128 5,958
Cassava 119,581 73,849 193,430
Sweet potatoes 117,648 13,525 131,173
Banana 20,700 66,230 86,930
Banana beer 3,018 12,160 15,178
Banana sweet 550 6,340 6,890
Coffee all 15,168 70,748 85,916
Rice 49,373 - 49,373
A4.8: Crop area (Ha) by stand for the First Season 2005 (NORTHERN) - Within District
Crop Stand
Crop Pure Mixed Total
Maize 65,707 65,959 131,666
Finger millet 7,746 21,208 28,954
Sorghum 46,472 30,702 77,174
Beans 34,316 48,965 83,281
Pigeon peas 4,488 10,108 14,596
Groundnuts 15,543 26,743 42,286
Sim-sim 11,863 9,278 21,141
Soya beans 1,464 5,070 6,534
Cassava 134,455 55,207 189,662
Sweet potatoes 29,988 832 30,820
Banana (Food-Type) 1,366 1,250 2,616
Banana beer 274 167 441
Coffee all 1,764 2,292 4,056
Rice 6,887 - 6,887
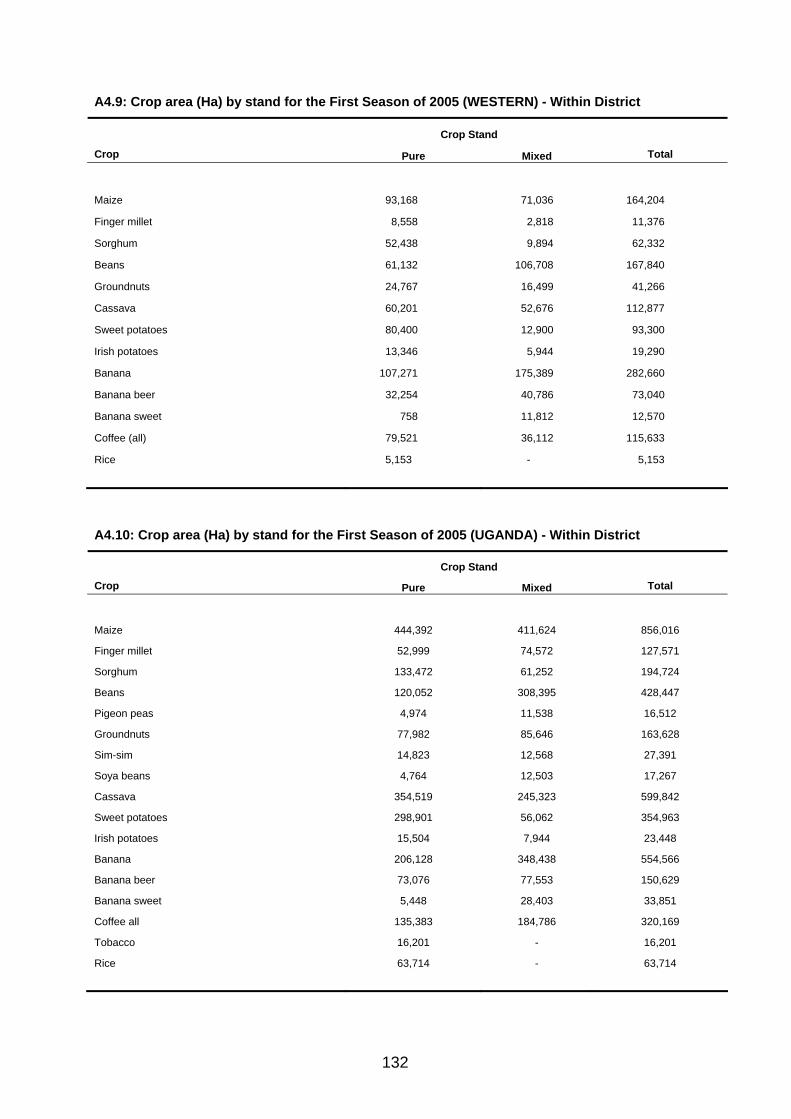
132
A4.9: Crop area (Ha) by stand for the First Season of 2005 (WESTERN) - Within District
Crop Stand
Crop Pure Mixed Total
Maize 93,168 71,036 164,204
Finger millet 8,558 2,818 11,376
Sorghum 52,438 9,894 62,332
Beans 61,132 106,708 167,840
Groundnuts 24,767 16,499 41,266
Cassava 60,201 52,676 112,877
Sweet potatoes 80,400 12,900 93,300
Irish potatoes 13,346 5,944 19,290
Banana 107,271 175,389 282,660
Banana beer 32,254 40,786 73,040
Banana sweet 758 11,812 12,570
Coffee (all) 79,521 36,112 115,633
Rice 5,153 - 5,153
A4.10: Crop area (Ha) by stand for the First Season of 2005 (UGANDA) - Within District
Crop Stand
Crop Pure Mixed Total
Maize 444,392 411,624 856,016
Finger millet 52,999 74,572 127,571
Sorghum 133,472 61,252 194,724
Beans 120,052 308,395 428,447
Pigeon peas 4,974 11,538 16,512
Groundnuts 77,982 85,646 163,628
Sim-sim 14,823 12,568 27,391
Soya beans 4,764 12,503 17,267
Cassava 354,519 245,323 599,842
Sweet potatoes 298,901 56,062 354,963
Irish potatoes 15,504 7,944 23,448
Banana 206,128 348,438 554,566
Banana beer 73,076 77,553 150,629
Banana sweet 5,448 28,403 33,851
Coffee all 135,383 184,786 320,169
Tobacco 16,201 - 16,201
Rice 63,714 - 63,714
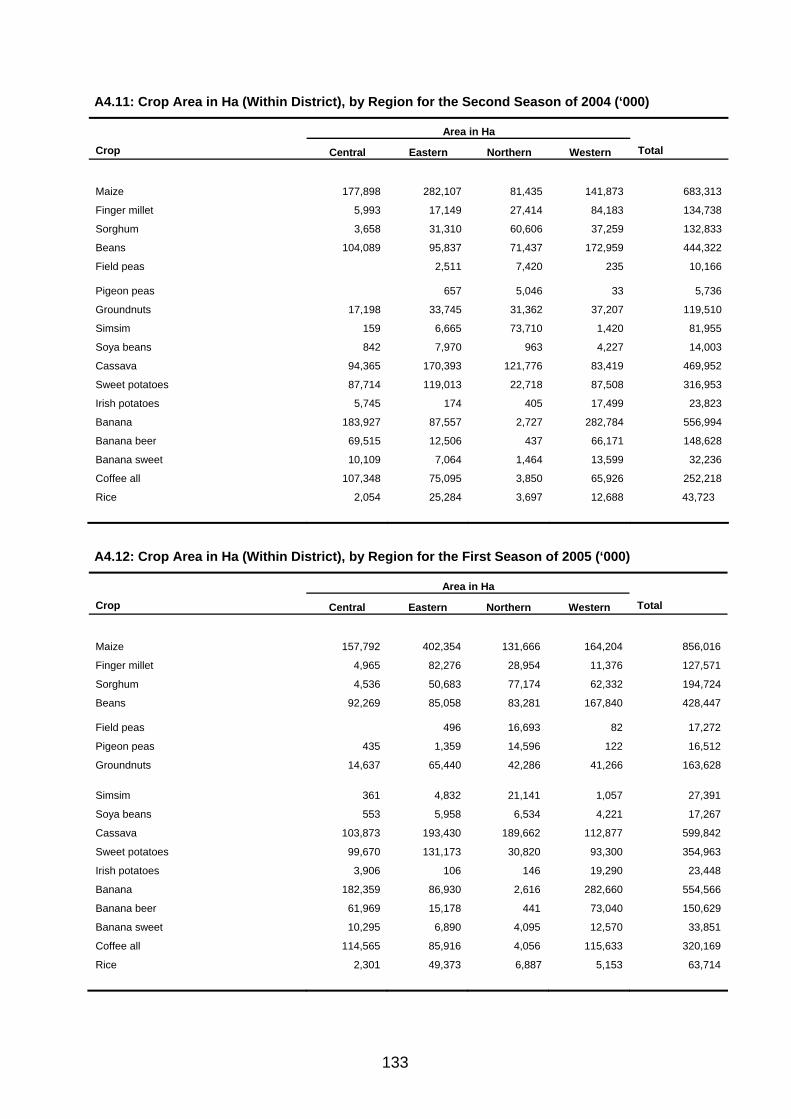
133
A4.11: Crop Area in Ha (Within District), by Region for the Second Season of 2004 (‘000)
Area in Ha
Crop Central Eastern Northern Western Total
Maize 177,898 282,107 81,435 141,873 683,313
Finger millet 5,993 17,149 27,414 84,183 134,738
Sorghum 3,658 31,310 60,606 37,259 132,833
Beans 104,089 95,837 71,437 172,959 444,322
Field peas 2,511 7,420 235 10,166
Pigeon peas 657 5,046
33 5,736
Groundnuts 17,198 33,745 31,362 37,207 119,510
Simsim 159 6,665 73,710 1,420 81,955
Soya beans 842 7,970 963 4,227 14,003
Cassava 94,365 170,393 121,776 83,419 469,952
Sweet potatoes 87,714 119,013 22,718 87,508 316,953
Irish potatoes 5,745 174 405 17,499 23,823
Banana 183,927 87,557 2,727 282,784 556,994
Banana beer 69,515 12,506 437 66,171 148,628
Banana sweet 10,109 7,064 1,464 13,599 32,236
Coffee all 107,348 75,095 3,850 65,926 252,218
Rice 2,054 25,284 3,697 12,688 43,723
A4.12: Crop Area in Ha (Within District), by Region for the First Season of 2005 (‘000)
Area in Ha
Crop Central Eastern Northern Western Total
Maize 157,792 402,354 131,666 164,204 856,016
Finger millet 4,965 82,276 28,954 11,376 127,571
Sorghum 4,536 50,683 77,174 62,332 194,724
Beans 92,269 85,058 83,281 167,840 428,447
Field peas 496 16,693
82 17,272
Pigeon peas 435 1,359 14,596 122 16,512
Groundnuts 14,637 65,440 42,286 41,266 163,628
Simsim 361 4,832 21,141 1,057 27,391
Soya beans 553 5,958 6,534 4,221 17,267
Cassava 103,873 193,430 189,662 112,877 599,842
Sweet potatoes 99,670 131,173 30,820 93,300 354,963
Irish potatoes 3,906 106 146 19,290 23,448
Banana 182,359 86,930 2,616 282,660 554,566
Banana beer 61,969 15,178 441 73,040 150,629
Banana sweet 10,295 6,890 4,095 12,570 33,851
Coffee all 114,565 85,916 4,056 115,633 320,169
Rice 2,301 49,373 6,887 5,153 63,714

134
A4.13: Crop Area in Ha (Within District), by Region for the Second Season of 2004 + First
Season of 2005 - UGANDA) (‘000)
Area in Ha
Central Eastern Northern Western Total
Maize 335,690 684,461 213,101 306,077 1,539,329
Finger millet 10,958 99,425 56,368 95,559 262,309
Sorghum 8,194 81,993 137,780 99,591 327,557
Beans 196,358 180,895 154,718 340,799 872,769
Field peas 0 3,007 24,113 317 27,438
Pigeon peas 435 2,016 19,642 155 22,248
Groundnuts 31,835 99,185 73,648 78,473 283,138
Simsim 520 11,497 94,851 2,477 109,346
Soya beans 1,395 13,928 7,497 8,448 31,270
Cassava 198,238 363,823 311,438 196,296 1,069,794
Sweet potatoes 187,384 250,186 53,538 180,808 671,916
Irish potatoes 9,651 280 551 36,789 47,271
Banana 366,286 174,487 5,343 565,444 1,111,560
Banana beer 131,484 27,684 878 139,211 299,257
Banana sweet 20,404 13,954 5,559 26,169 66,087
Coffee all 221,913 161,011 7,906 181,559 572,387
Rice 4,355 74,657 10,584 17,841 107,437
A4.14: Number of Crop Plots by stand (Within District) in the Second Season of 2004
(CENTRAL) Crop Stand Crop
Pure Mixed
Total
Maize 209,398 724,652 934,049
Finger Millet 18,557 14,851 33,408
Sorghum 13,821 10,507 24,328
Beans 126,059 730,626 856,684
Groundnuts 45,595 107,425 153,021
Soya Beans 3,920 5,677 9,597
Cassava 206,100 746,316 952,416
Sweet Potatoes 451,649 182,455 634,104
Irish Potatoes 24,968 24,194 49,162
Banana (Food Type) 267,749 742,881 1,010,630
Banana (Beer) 108,942 183,332 292,274
Banana (Sweet) 9,717 131,606 141,323
Coffee (All) 115,114 581,913 697,027
Rice 7,990 - 7,990
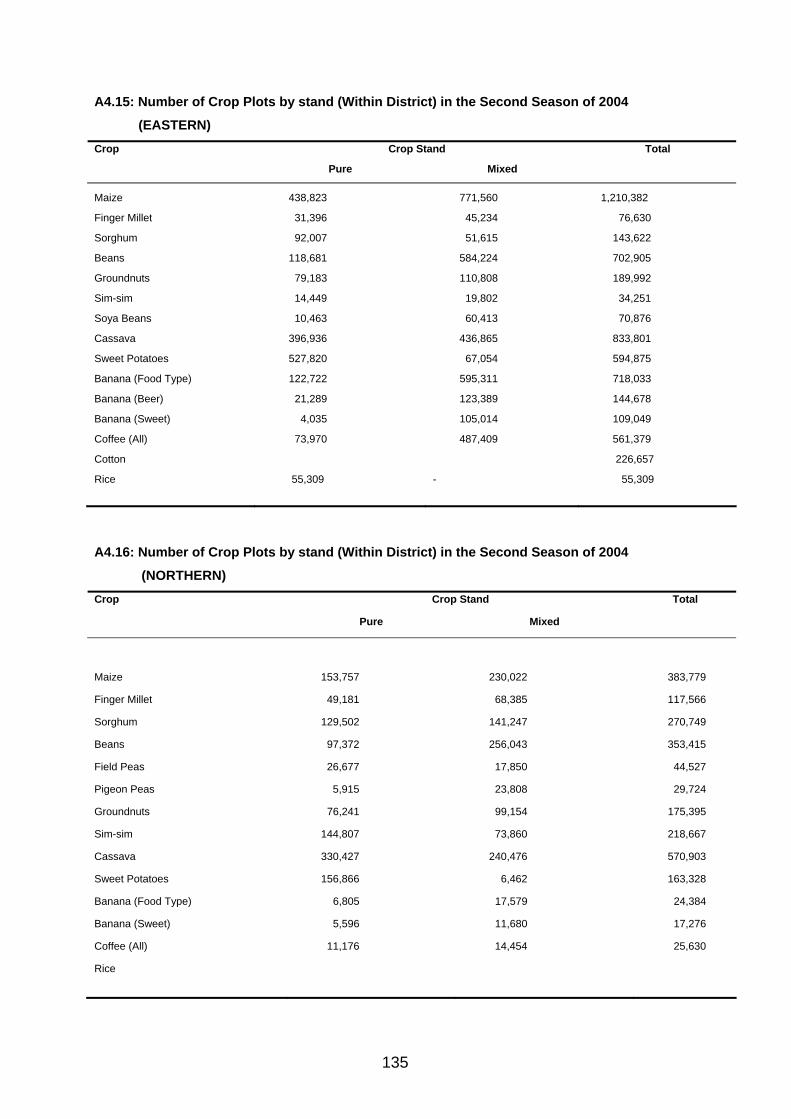
135
A4.15: Number of Crop Plots by stand (Within District) in the Second Season of 2004
(EASTERN) Crop Stand Crop
Pure Mixed
Total
Maize 438,823 771,560 1,210,382
Finger Millet 31,396 45,234 76,630
Sorghum 92,007 51,615 143,622
Beans 118,681 584,224 702,905
Groundnuts 79,183 110,808 189,992
Sim-sim 14,449 19,802 34,251
Soya Beans 10,463 60,413 70,876
Cassava 396,936 436,865 833,801
Sweet Potatoes 527,820 67,054 594,875
Banana (Food Type) 122,722 595,311 718,033
Banana (Beer) 21,289 123,389 144,678
Banana (Sweet) 4,035 105,014 109,049
Coffee (All) 73,970 487,409 561,379
Cotton 226,657
Rice 55,309 - 55,309
A4.16: Number of Crop Plots by stand (Within District) in the Second Season of 2004
(NORTHERN) Crop Stand Crop
Pure Mixed
Total
Maize 153,757 230,022 383,779
Finger Millet 49,181 68,385 117,566
Sorghum 129,502 141,247 270,749
Beans 97,372 256,043 353,415
Field Peas 26,677 17,850 44,527
Pigeon Peas 5,915 23,808 29,724
Groundnuts 76,241 99,154 175,395
Sim-sim 144,807 73,860 218,667
Cassava 330,427 240,476 570,903
Sweet Potatoes 156,866 6,462 163,328
Banana (Food Type) 6,805 17,579 24,384
Banana (Sweet) 5,596 11,680 17,276
Coffee (All) 11,176 14,454 25,630
Rice
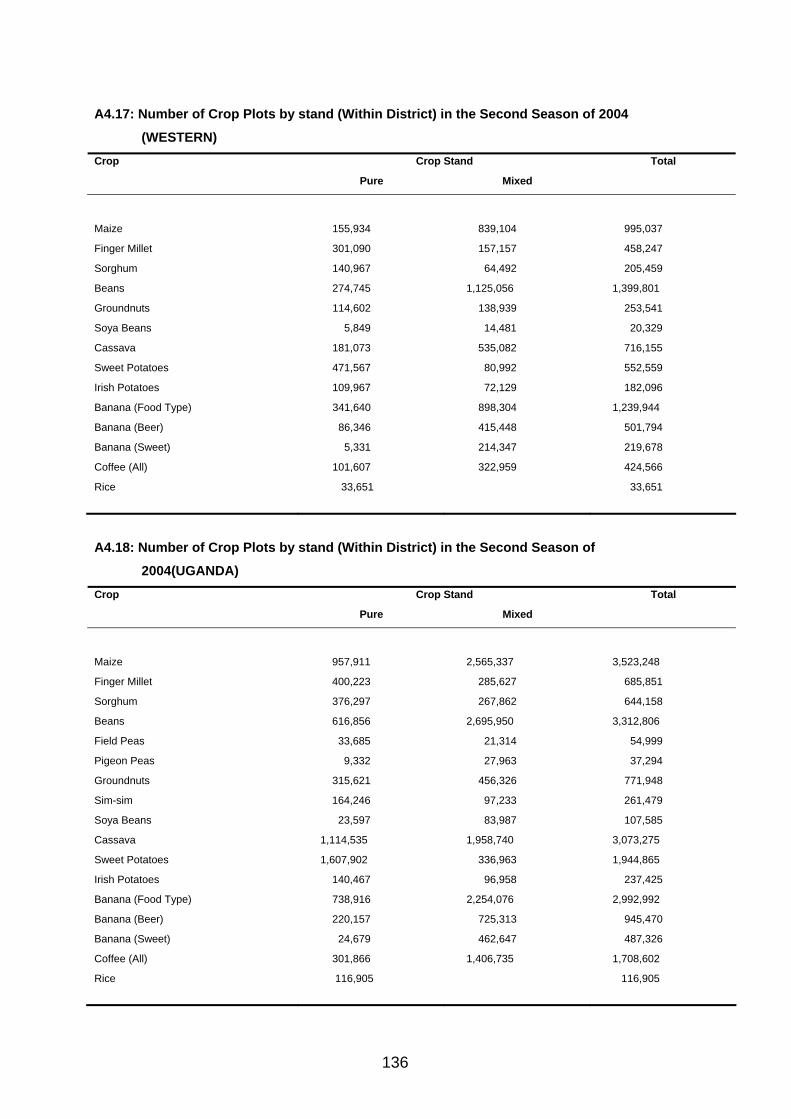
136
A4.17: Number of Crop Plots by stand (Within District) in the Second Season of 2004
(WESTERN) Crop Stand Crop
Pure Mixed
Total
Maize 155,934 839,104 995,037
Finger Millet 301,090 157,157 458,247
Sorghum 140,967 64,492 205,459
Beans 274,745 1,125,056 1,399,801
Groundnuts 114,602 138,939 253,541
Soya Beans 5,849 14,481 20,329
Cassava 181,073 535,082 716,155
Sweet Potatoes 471,567 80,992 552,559
Irish Potatoes 109,967 72,129 182,096
Banana (Food Type) 341,640 898,304 1,239,944
Banana (Beer) 86,346 415,448 501,794
Banana (Sweet) 5,331 214,347 219,678
Coffee (All) 101,607 322,959 424,566
Rice 33,651 33,651
A4.18: Number of Crop Plots by stand (Within District) in the Second Season of
2004(UGANDA) Crop Stand Crop
Pure Mixed
Total
Maize 957,911 2,565,337 3,523,248
Finger Millet 400,223 285,627 685,851
Sorghum 376,297 267,862 644,158
Beans 616,856 2,695,950 3,312,806
Field Peas 33,685 21,314 54,999
Pigeon Peas 9,332 27,963 37,294
Groundnuts 315,621 456,326 771,948
Sim-sim 164,246 97,233 261,479
Soya Beans 23,597 83,987 107,585
Cassava 1,114,535 1,958,740 3,073,275
Sweet Potatoes 1,607,902 336,963 1,944,865
Irish Potatoes 140,467 96,958 237,425
Banana (Food Type) 738,916 2,254,076 2,992,992
Banana (Beer) 220,157 725,313 945,470
Banana (Sweet) 24,679 462,647 487,326
Coffee (All) 301,866 1,406,735 1,708,602
Rice 116,905 116,905
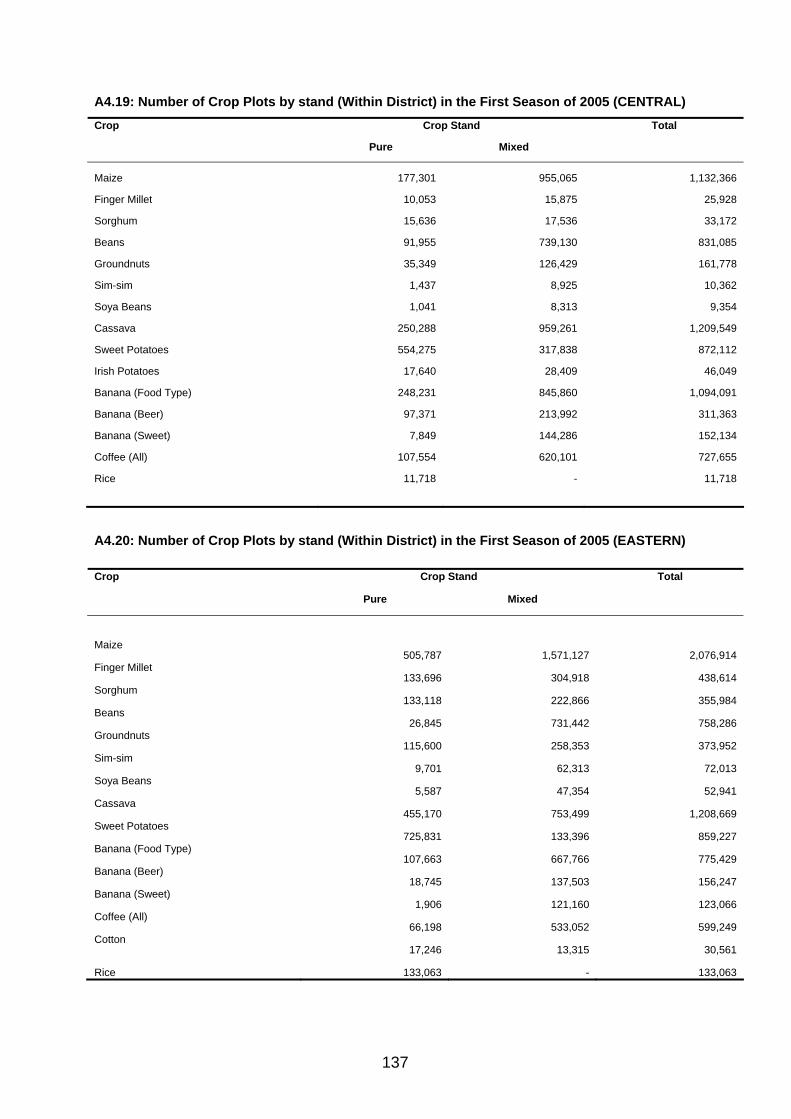
137
A4.19: Number of Crop Plots by stand (Within District) in the First Season of 2005 (CENTRAL) Crop Stand Crop
Pure Mixed
Total
Maize 177,301 955,065 1,132,366
Finger Millet 10,053 15,875 25,928
Sorghum 15,636 17,536 33,172
Beans 91,955 739,130 831,085
Groundnuts 35,349 126,429 161,778
Sim-sim 1,437 8,925 10,362
Soya Beans 1,041 8,313 9,354
Cassava 250,288 959,261 1,209,549
Sweet Potatoes 554,275 317,838 872,112
Irish Potatoes 17,640 28,409 46,049
Banana (Food Type) 248,231 845,860 1,094,091
Banana (Beer) 97,371 213,992 311,363
Banana (Sweet) 7,849 144,286 152,134
Coffee (All) 107,554 620,101 727,655
Rice 11,718 - 11,718
A4.20: Number of Crop Plots by stand (Within District) in the First Season of 2005 (EASTERN)
Crop Stand Crop
Pure Mixed
Total
Maize
505,787 1,571,127 2,076,914 Finger Millet
133,696 304,918 438,614 Sorghum
133,118 222,866 355,984 Beans
26,845 731,442 758,286 Groundnuts
115,600 258,353 373,952 Sim-sim
9,701 62,313 72,013 Soya Beans
5,587 47,354 52,941 Cassava
455,170 753,499 1,208,669 Sweet Potatoes
725,831 133,396 859,227 Banana (Food Type)
107,663 667,766 775,429 Banana (Beer)
18,745 137,503 156,247 Banana (Sweet)
1,906 121,160 123,066 Coffee (All)
66,198 533,052 599,249 Cotton
17,246 13,315 30,561
Rice 133,063 - 133,063
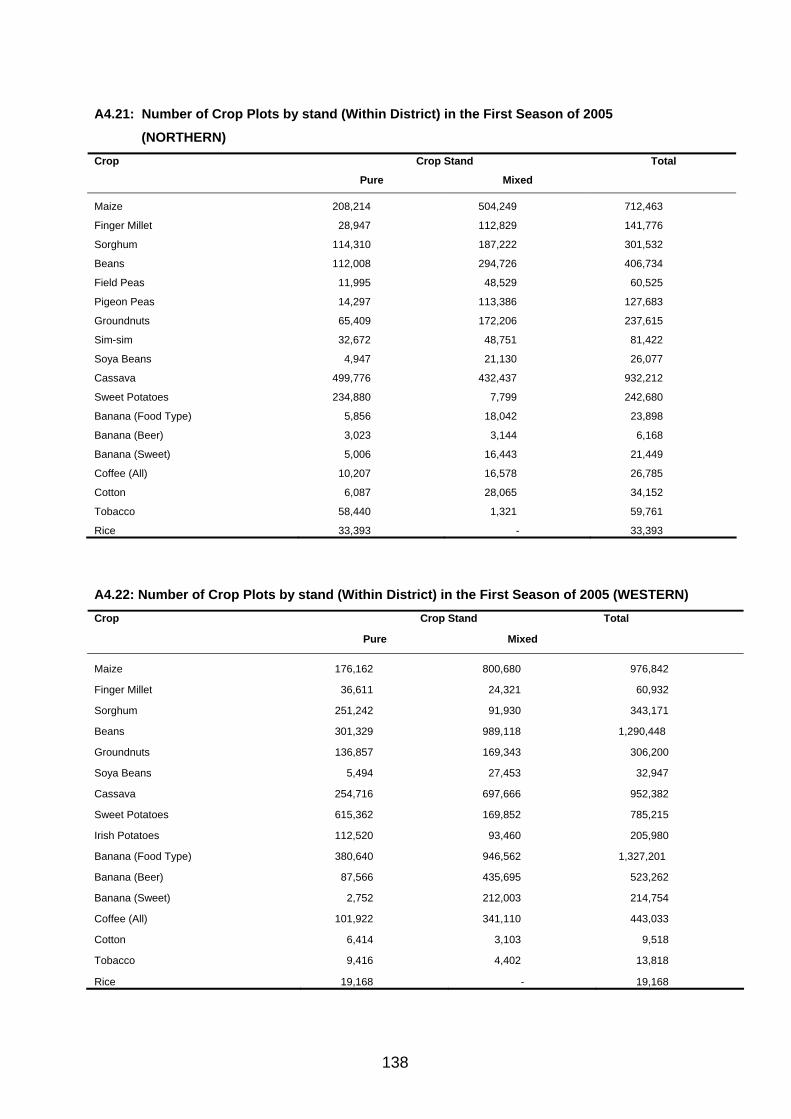
138
A4.21: Number of Crop Plots by stand (Within District) in the First Season of 2005
(NORTHERN) Crop Stand Crop
Pure Mixed
Total
Maize 208,214 504,249 712,463
Finger Millet 28,947 112,829 141,776
Sorghum 114,310 187,222 301,532
Beans 112,008 294,726 406,734
Field Peas 11,995 48,529 60,525
Pigeon Peas 14,297 113,386 127,683
Groundnuts 65,409 172,206 237,615
Sim-sim 32,672 48,751 81,422
Soya Beans 4,947 21,130 26,077
Cassava 499,776 432,437 932,212
Sweet Potatoes 234,880 7,799 242,680
Banana (Food Type) 5,856 18,042 23,898
Banana (Beer) 3,023 3,144 6,168
Banana (Sweet) 5,006 16,443 21,449
Coffee (All) 10,207 16,578 26,785
Cotton 6,087 28,065 34,152
Tobacco 58,440 1,321 59,761
Rice 33,393 - 33,393
A4.22: Number of Crop Plots by stand (Within District) in the First Season of 2005 (WESTERN) Crop Stand Crop
Pure Mixed
Total
Maize 176,162 800,680 976,842
Finger Millet 36,611 24,321 60,932
Sorghum 251,242 91,930 343,171
Beans 301,329 989,118 1,290,448
Groundnuts 136,857 169,343 306,200
Soya Beans 5,494 27,453 32,947
Cassava 254,716 697,666 952,382
Sweet Potatoes 615,362 169,852 785,215
Irish Potatoes 112,520 93,460 205,980
Banana (Food Type) 380,640 946,562 1,327,201
Banana (Beer) 87,566 435,695 523,262
Banana (Sweet) 2,752 212,003 214,754
Coffee (All) 101,922 341,110 443,033
Cotton 6,414 3,103 9,518
Tobacco 9,416 4,402 13,818
Rice 19,168 - 19,168
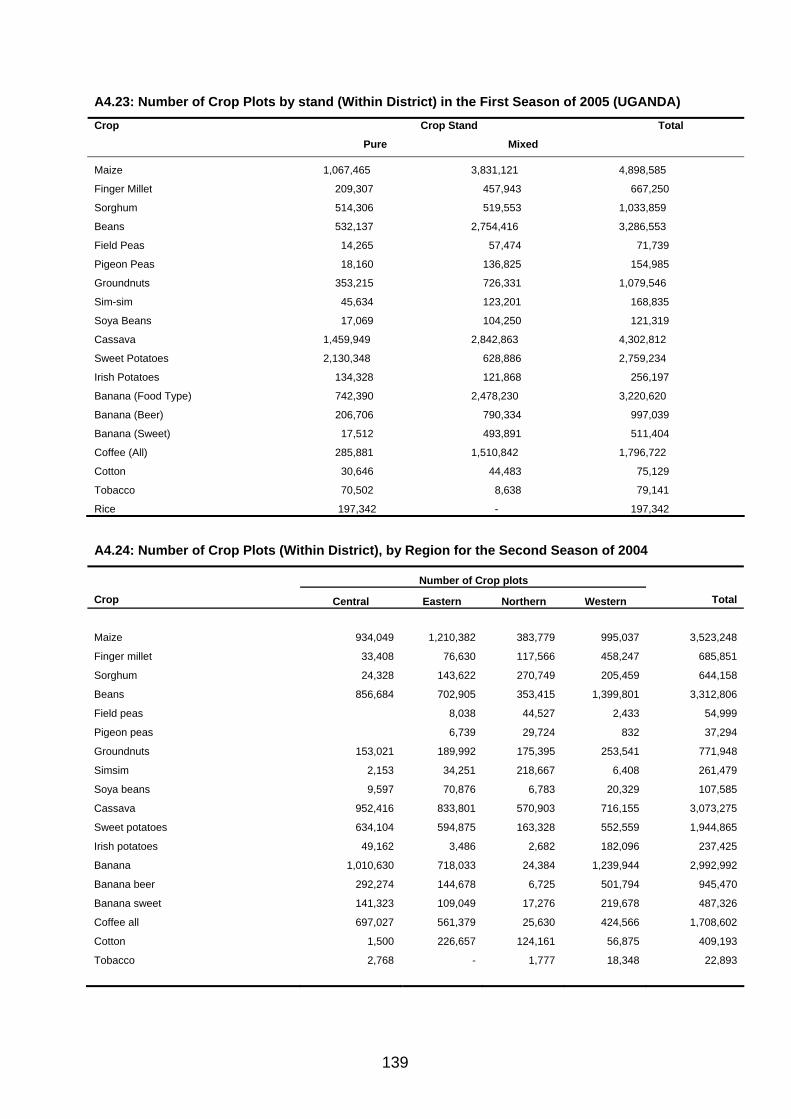
139
A4.23: Number of Crop Plots by stand (Within District) in the First Season of 2005 (UGANDA) Crop Stand Crop
Pure Mixed
Total
Maize 1,067,465 3,831,121 4,898,585
Finger Millet 209,307 457,943 667,250
Sorghum 514,306 519,553 1,033,859
Beans 532,137 2,754,416 3,286,553
Field Peas 14,265 57,474 71,739
Pigeon Peas 18,160 136,825 154,985
Groundnuts 353,215 726,331 1,079,546
Sim-sim 45,634 123,201 168,835
Soya Beans 17,069 104,250 121,319
Cassava 1,459,949 2,842,863 4,302,812
Sweet Potatoes 2,130,348 628,886 2,759,234
Irish Potatoes 134,328 121,868 256,197
Banana (Food Type) 742,390 2,478,230 3,220,620
Banana (Beer) 206,706 790,334 997,039
Banana (Sweet) 17,512 493,891 511,404
Coffee (All) 285,881 1,510,842 1,796,722
Cotton 30,646 44,483 75,129
Tobacco 70,502 8,638 79,141
Rice 197,342 - 197,342 A4.24: Number of Crop Plots (Within District), by Region for the Second Season of 2004
Number of Crop plots
Crop Central Eastern Northern Western Total
Maize 934,049 1,210,382 383,779 995,037 3,523,248
Finger millet 33,408 76,630 117,566 458,247 685,851
Sorghum 24,328 143,622 270,749 205,459 644,158
Beans 856,684 702,905 353,415 1,399,801 3,312,806
Field peas 8,038 44,527 2,433 54,999
Pigeon peas 6,739 29,724 832 37,294
Groundnuts 153,021 189,992 175,395 253,541 771,948
Simsim 2,153 34,251 218,667 6,408 261,479
Soya beans 9,597 70,876 6,783 20,329 107,585
Cassava 952,416 833,801 570,903 716,155 3,073,275
Sweet potatoes 634,104 594,875 163,328 552,559 1,944,865
Irish potatoes 49,162 3,486 2,682 182,096 237,425
Banana 1,010,630 718,033 24,384 1,239,944 2,992,992
Banana beer 292,274 144,678 6,725 501,794 945,470
Banana sweet 141,323 109,049 17,276 219,678 487,326
Coffee all 697,027 561,379 25,630 424,566 1,708,602
Cotton 1,500 226,657 124,161 56,875 409,193
Tobacco 2,768 - 1,777 18,348 22,893

140
A4.25: Number of Crop Plots (Within District), by Region for the First Season of 2005
Number of Crop plots
Crop Central Eastern Northern Western Total
Maize 1,132,366 2,076,914 712,463 976,842 4,898,585
Finger millet 25,928 438,614 141,776 60,932 667,250
Sorghum 33,172 355,984 301,532 343,171 1,033,859
Beans 831,085 758,286 406,734 1,290,448 3,286,553
Field peas 7,928 60,525 3,286 71,739
Pigeon peas 6,157 14,843 127,683 6,302 154,985
Groundnuts 161,778 373,952 237,615 306,200 1,079,546
Simsim 10,362 72,013 81,422 5,037 168,835
Soya beans 9,354 52,941 26,077 32,947 121,319
Cassava 1,209,549 1,208,669 932,212 952,382 4,302,812
Sweet potatoes 872,112 859,227 242,680 785,215 2,759,234
Irish potatoes 46,049 3,273 895 205,980 256,197
Banana 1,094,091 775,429 23,898 1,327,201 3,220,620
Banana beer 311,363 156,247 6,168 523,262 997,039
Banana sweet 152,134 123,066 21,449 214,754 511,404
Coffee all 727,655 599,249 26,785 443,033 1,796,722
Tea 593 13,681 14,273
Cocoa 4,872 3,315 65,143 73,330
Cotton 899 30,561 34,152 9,518 75,129
Tobacco 3,451 2,110 59,761 13,818 79,141 A4.26: Number of Crop Plots (‘000) (Within District), by Region for the Second Season of 2004
+ First Season of 2005, for Uganda)
Number of Crop plots Crop Central Eastern Northern Western Total
Maize 2,066,415 3,287,296 1,096,242 1,971,879 8,421,833 Finger millet 59,336 515,244 259,342 519,179 1,353,101 Sorghum 57,500 499,606 572,281 548,630 1,678,017 Beans 1,687,769 1,461,191 760,149 2,690,249 6,599,359 Field peas 0 15,966 105,052 5,719 126,738 Pigeon peas 6,157 21,582 157,407 7,134 192,279 Groundnuts 314,799 563,944 413,010 559,741 1,851,494 Simsim 12,515 106,264 300,089 11,445 430,314 Soya beans 18,951 123,817 32,860 53,276 228,904 Cassava 2,161,965 2,042,470 1,503,115 1,668,537 7,376,087 Sweet potatoes 1,506,216 1,454,102 406,008 1,337,774 4,704,099 Irish potatoes 95,211 6,759 3,577 388,076 493,622 Banana 2,104,721 1,493,462 48,282 2,567,145 6,213,612 Banana beer 603,637 300,925 12,893 1,025,056 1,942,509 Banana sweet 293,457 232,115 38,725 434,432 998,730 Coffee all 1,424,682 1,160,628 52,415 867,599 3,505,324 Tea 1,186 26,069 27,253 Cocoa 10,950 5,360 117,251 133,561 Cotton 2,399 257,218 158,313 66,393 484,322 Tobacco 6,219 61,538 32,166 102,034
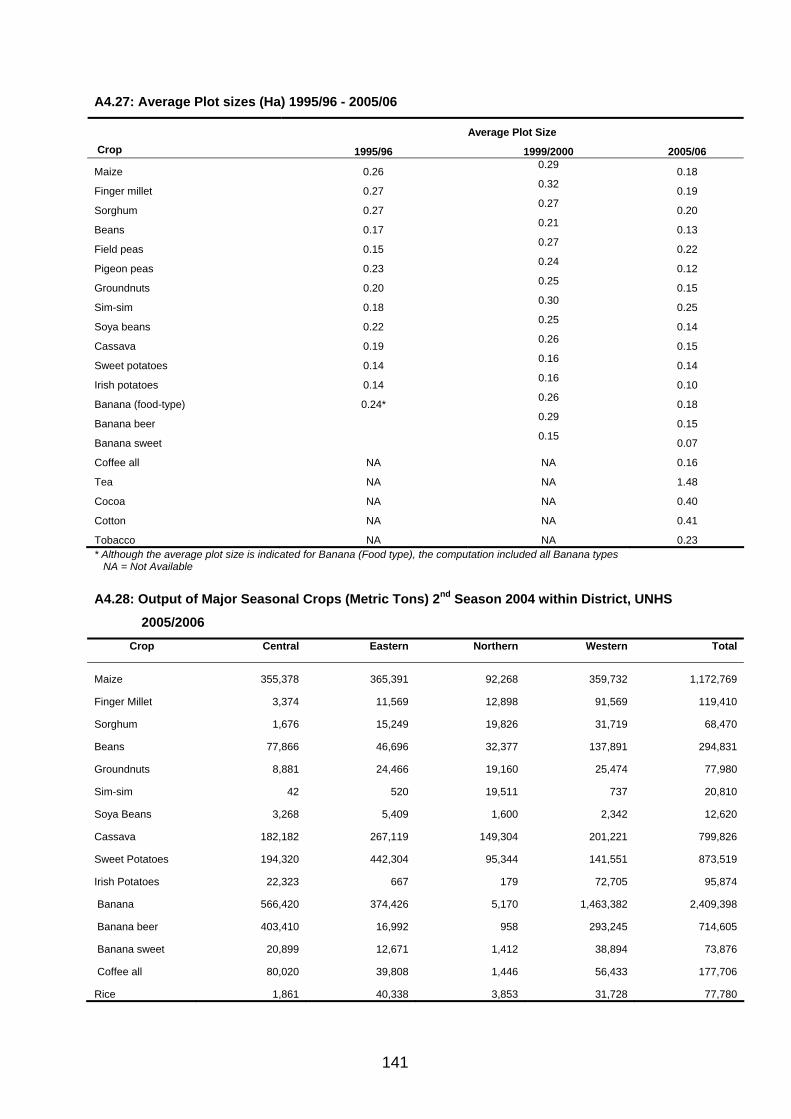
141
A4.27: Average Plot sizes (Ha) 1995/96 - 2005/06
Average Plot Size Crop 1995/96 1999/2000 2005/06
Maize 0.26 0.29
0.18
Finger millet 0.27 0.32
0.19
Sorghum 0.27 0.27
0.20
Beans 0.17 0.21
0.13
Field peas 0.15 0.27
0.22
Pigeon peas 0.23 0.24
0.12
Groundnuts 0.20 0.25
0.15
Sim-sim 0.18 0.30
0.25
Soya beans 0.22 0.25
0.14
Cassava 0.19 0.26
0.15
Sweet potatoes 0.14 0.16
0.14
Irish potatoes 0.14 0.16
0.10
Banana (food-type) 0.24* 0.26
0.18
Banana beer 0.29
0.15
Banana sweet 0.15
0.07
Coffee all NA NA 0.16
Tea NA NA 1.48
Cocoa NA NA 0.40
Cotton NA NA 0.41
Tobacco NA NA 0.23 * Although the average plot size is indicated for Banana (Food type), the computation included all Banana types NA = Not Available
A4.28: Output of Major Seasonal Crops (Metric Tons) 2nd Season 2004 within District, UNHS
2005/2006 Crop Central Eastern Northern Western Total
Maize 355,378 365,391 92,268 359,732 1,172,769
Finger Millet 3,374 11,569 12,898 91,569 119,410
Sorghum 1,676 15,249 19,826 31,719 68,470
Beans 77,866 46,696 32,377 137,891 294,831
Groundnuts 8,881 24,466 19,160 25,474 77,980
Sim-sim 42 520 19,511 737 20,810
Soya Beans 3,268 5,409 1,600 2,342 12,620
Cassava 182,182 267,119 149,304 201,221 799,826
Sweet Potatoes 194,320 442,304 95,344 141,551 873,519
Irish Potatoes 22,323 667 179 72,705 95,874
Banana 566,420 374,426 5,170 1,463,382 2,409,398
Banana beer 403,410 16,992 958 293,245 714,605
Banana sweet 20,899 12,671 1,412 38,894 73,876
Coffee all 80,020 39,808 1,446 56,433 177,706
Rice 1,861 40,338 3,853 31,728 77,780
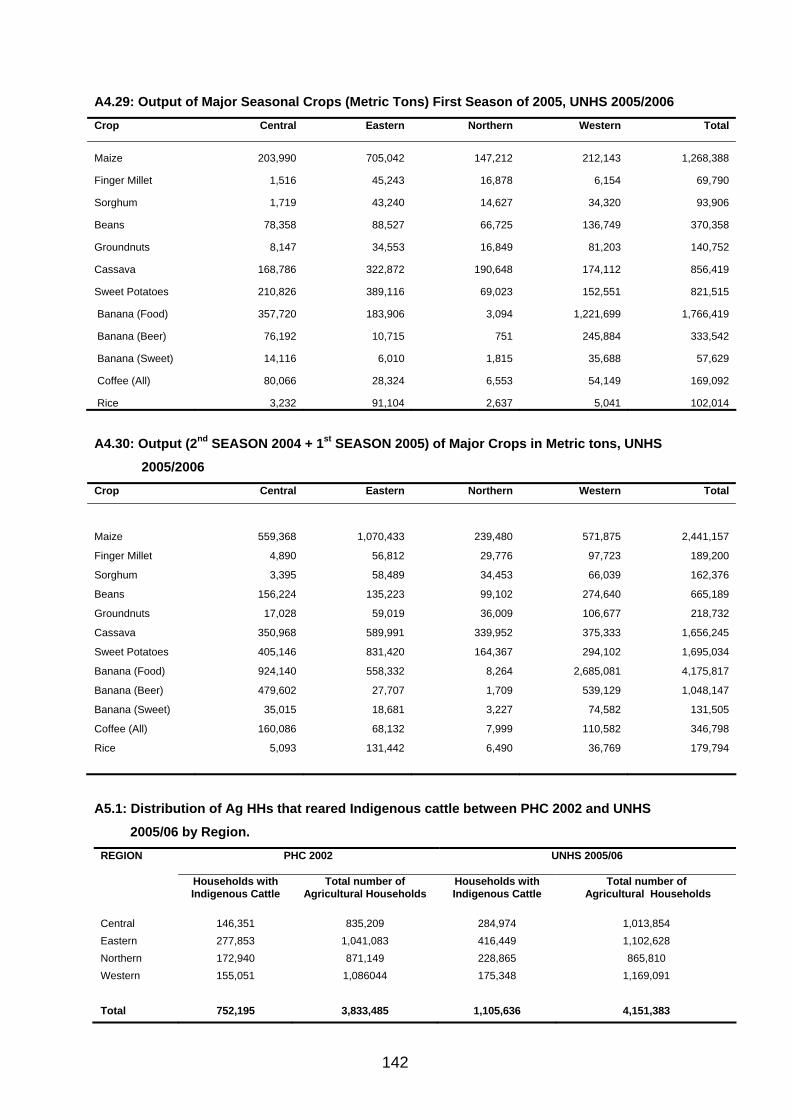
142
A4.29: Output of Major Seasonal Crops (Metric Tons) First Season of 2005, UNHS 2005/2006 Crop Central Eastern Northern Western Total
Maize 203,990 705,042 147,212 212,143 1,268,388
Finger Millet 1,516 45,243 16,878 6,154 69,790
Sorghum 1,719 43,240 14,627 34,320 93,906
Beans 78,358 88,527 66,725 136,749 370,358
Groundnuts 8,147 34,553 16,849 81,203 140,752
Cassava 168,786 322,872 190,648 174,112 856,419
Sweet Potatoes 210,826 389,116 69,023 152,551 821,515
Banana (Food) 357,720 183,906 3,094 1,221,699 1,766,419
Banana (Beer) 76,192 10,715 751 245,884 333,542
Banana (Sweet) 14,116 6,010 1,815 35,688 57,629
Coffee (All) 80,066 28,324 6,553 54,149 169,092
Rice 3,232 91,104 2,637 5,041 102,014 A4.30: Output (2nd SEASON 2004 + 1st SEASON 2005) of Major Crops in Metric tons, UNHS
2005/2006 Crop Central Eastern Northern Western Total
Maize 559,368 1,070,433 239,480 571,875 2,441,157
Finger Millet 4,890 56,812 29,776 97,723 189,200
Sorghum 3,395 58,489 34,453 66,039 162,376
Beans 156,224 135,223 99,102 274,640 665,189
Groundnuts 17,028 59,019 36,009 106,677 218,732
Cassava 350,968 589,991 339,952 375,333 1,656,245
Sweet Potatoes 405,146 831,420 164,367 294,102 1,695,034
Banana (Food) 924,140 558,332 8,264 2,685,081 4,175,817
Banana (Beer) 479,602 27,707 1,709 539,129 1,048,147
Banana (Sweet) 35,015 18,681 3,227 74,582 131,505
Coffee (All) 160,086 68,132 7,999 110,582 346,798
Rice 5,093 131,442 6,490 36,769 179,794
A5.1: Distribution of Ag HHs that reared Indigenous cattle between PHC 2002 and UNHS
2005/06 by Region. PHC 2002 UNHS 2005/06
REGION
Households with Indigenous Cattle
Total number of Agricultural Households
Households with Indigenous Cattle
Total number of Agricultural Households
Central 146,351 835,209 284,974 1,013,854 Eastern 277,853 1,041,083 416,449 1,102,628 Northern 172,940 871,149 228,865 865,810 Western 155,051 1,086044 175,348 1,169,091
Total 752,195 3,833,485 1,105,636 4,151,383

143
A5.2: Distribution of Ag HHs that reared Exotic cattle between PHC 2002 and UNHS 2005/06 by
Region. PHC 2002 UNHS 2005/06 REGION
Households with Exotic Cattle
Total number of Agricultural Households
Households with Exotic Cattle
Total number of Agricultural Households
Central 22,075 835,209 55,157 1,013,854 Eastern 21,408 1,041,083 53,981 1,102,628 Northern 5,909 871,149 5,109 865,810 Western 27,617 1,086044 91,185 1,169,091 Total 77,009 3,833,485 205,432 4,151,383
A5.3: Cattle numbers (’000), 1991 – 2005/06 Year 1991 1997 2001 PHC 2002 UNHS 2005/06 Number 3,357 5,460 6,144 6,283 7,531
A5.4: A comparison of the Number of Agricultural Households with goats, between PHC 2002
and UNHS 2005/06 PHC 2002 UNHS 2005/06 REGION
Households with goats
Total number of Agricultural Households
Households with goats
Total number of Agricultural Households
Central 145,736 835,209 335,310 1,013,854 Eastern 324,747 1,041,083 531,111 1,102,628 Northern 347,573 871,149 390,135 865,810 Western 347,833 1,086044 575,750 1,169,091 Total 1,165,889 3,833,485 1,832,305 4,151,383
A5.5: Goats numbers (’000), 1991 – 2005/06 Year 1991 1997 2001 PHC 2002 UNHS 2005/06 Number 3880 5825 6620 5168 8,078
A5.6: A comparison of the Number of Agricultural Households with Sheep, between PHC 2002
and UNHS 2005/06 PHC 2002 UNHS 2005/06 REGION
Households with sheep
Total number of Agricultural Households
Households with sheep
Total number of Agricultural Households
Central 24,059 835,209 52,979 1,013,854 Eastern 44,866 1,041,083 50,037 1,102,628 Northern 96,993 871,149 94,136 865,810 Western 67,832 1,086044 129,163 1,169,091 Total 233,750 3,833,485 326,315 4,151,383

144
A5.7: Sheep numbers (’000), 1991 – 2005/06
Year 1991 1997 2001 PHC 2002 UNHS 2005/06 Number 744 980 1108 1555 1,217
A5.8: A comparison of the Number of Agricultural Households with Pigs, between PHC 2002
and UNHS 2005/06 PHC 2002 UNHS 2005/06 REGION
Households with pigs
Total number of Agricultural Households
Households with pigs
Total number of Agricultural Households
Central 143,888 835,209 328,939 1,013,854 Eastern 78,815 1,041,083 184,654 1,102,628 Northern 38,781 871,149 60,774 865,810 Western 109,421 1,086044 187,055 1,169,091 Total 370,905 3,833,485 761,421 4,151,383
A5.9: Pig numbers (’000), 1991 – 2005/06 Year 1991 1997 2001 PHC 2002 UNHS 2005/06 Number 672 1425 1644 773 2,356
A5.10: A comparison of the Number of Agricultural Households with local Chicken, between
PHC 2002 and UNHS 2005/06 PHC 2002 UNHS 2005/06 Region
Households with local chicken
Total number of Agricultural Households
Households with local chicken
Total number of Agricultural Households
Central 323,225 835,209 535,956 1,013,854 Eastern 571,554 1,041,083 745,330 1,102,628 Northern 418,151 871,149 461,742 865,810 Western 465,913 1,086044 548,220 1,169,091 Total 1,778,843 3,833,485 2,291,248 4,151,383
A5.11: A comparison of the Number of Agricultural Households with exotic/cross Chicken,
between PHC 2002 and UNHS 2005/06 PHC 2002 UNHS 2005/06 REGION
Households with exotic/cross
chicken
Total number of Agricultural Households
Households with exotic/cross
chicken
Total number of Agricultural Households
Central 12,528 835,209 23,287 1,013,854 Eastern 5,205 1,041,083 7,732 1,102,628 Northern 4,355 871,149 4,950 865,810 Western 5,430 1,086044 7,845 1,169,091 Total 27,518 3,833,485 43,813 4,151,383
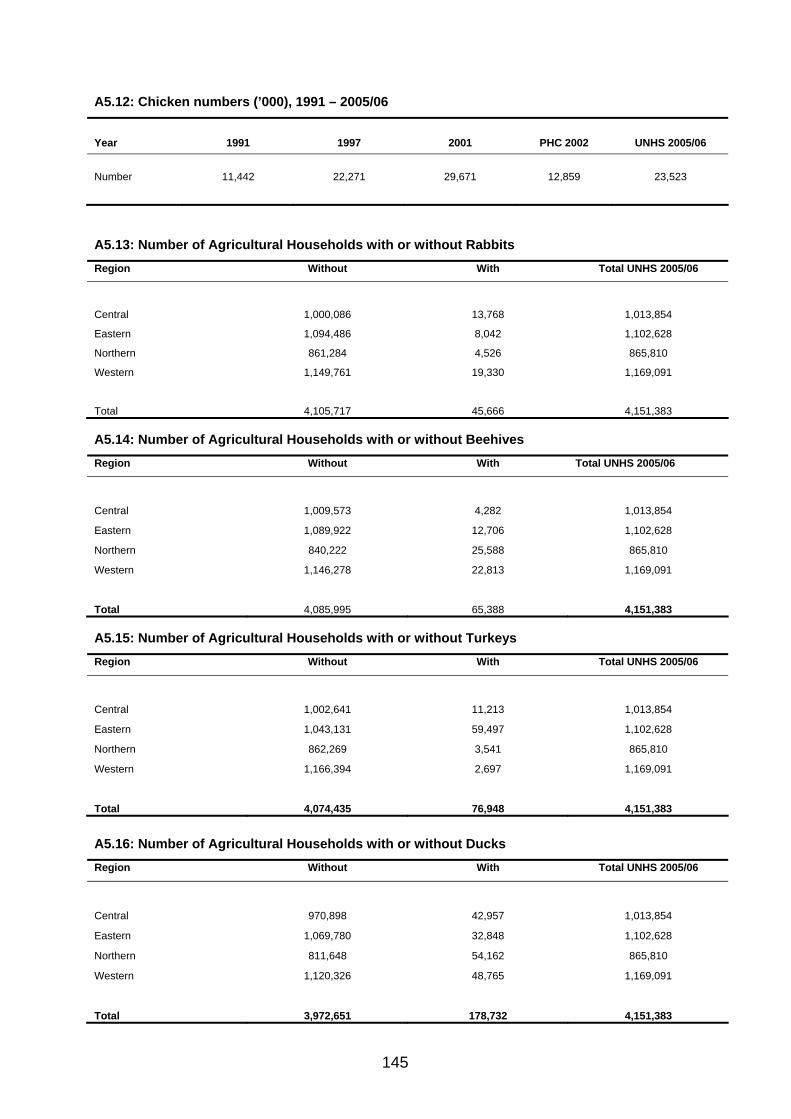
145
A5.12: Chicken numbers (’000), 1991 – 2005/06 Year 1991 1997 2001 PHC 2002 UNHS 2005/06 Number 11,442 22,271 29,671 12,859 23,523
A5.13: Number of Agricultural Households with or without Rabbits Region Without With Total UNHS 2005/06
Central 1,000,086 13,768 1,013,854
Eastern 1,094,486 8,042 1,102,628
Northern 861,284 4,526 865,810
Western 1,149,761 19,330 1,169,091
Total 4,105,717 45,666 4,151,383 A5.14: Number of Agricultural Households with or without Beehives Region Without With Total UNHS 2005/06
Central 1,009,573 4,282 1,013,854
Eastern 1,089,922 12,706 1,102,628
Northern 840,222 25,588 865,810
Western 1,146,278 22,813 1,169,091
Total 4,085,995 65,388 4,151,383 A5.15: Number of Agricultural Households with or without Turkeys Region Without With Total UNHS 2005/06
Central 1,002,641 11,213 1,013,854
Eastern 1,043,131 59,497 1,102,628
Northern 862,269 3,541 865,810
Western 1,166,394 2,697 1,169,091
Total 4,074,435 76,948 4,151,383
A5.16: Number of Agricultural Households with or without Ducks Region Without With Total UNHS 2005/06
Central 970,898 42,957 1,013,854
Eastern 1,069,780 32,848 1,102,628
Northern 811,648 54,162 865,810
Western 1,120,326 48,765 1,169,091
Total 3,972,651 178,732 4,151,383
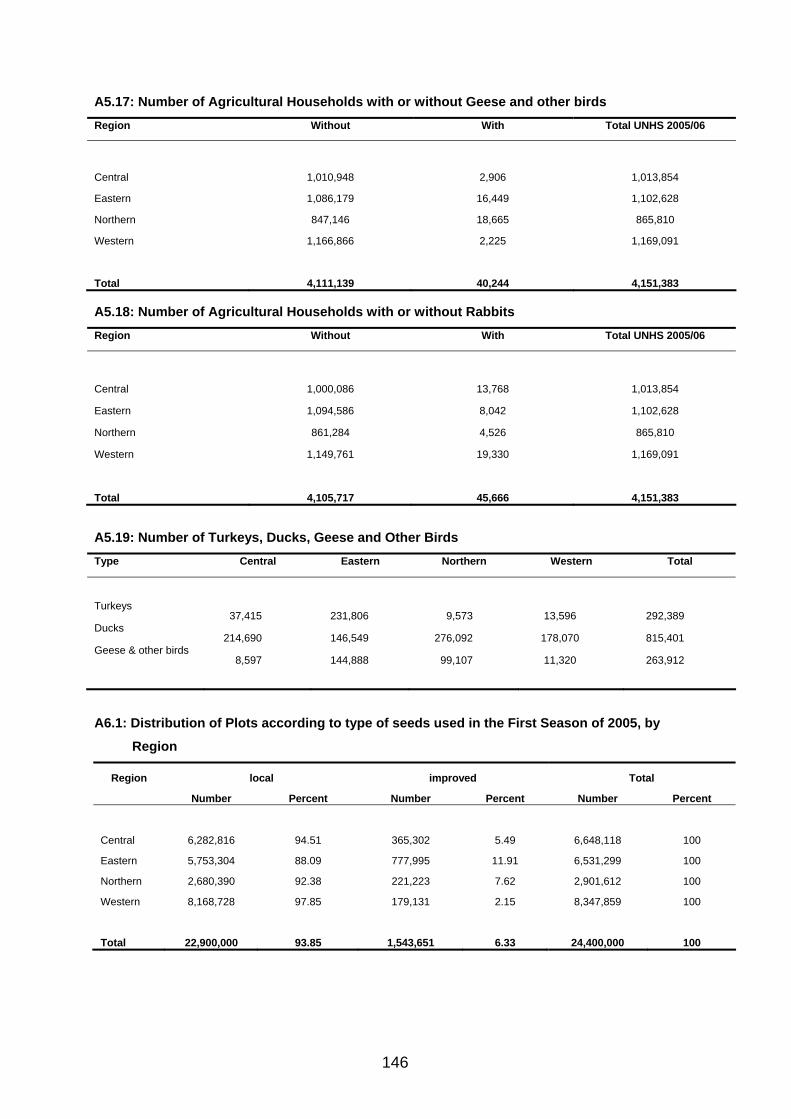
146
A5.17: Number of Agricultural Households with or without Geese and other birds Region Without With Total UNHS 2005/06
Central 1,010,948 2,906 1,013,854
Eastern 1,086,179 16,449 1,102,628
Northern 847,146 18,665 865,810
Western 1,166,866 2,225 1,169,091
Total 4,111,139 40,244 4,151,383 A5.18: Number of Agricultural Households with or without Rabbits Region Without With Total UNHS 2005/06
Central 1,000,086 13,768 1,013,854
Eastern 1,094,586 8,042 1,102,628
Northern 861,284 4,526 865,810
Western 1,149,761 19,330 1,169,091
Total 4,105,717 45,666 4,151,383
A5.19: Number of Turkeys, Ducks, Geese and Other Birds Type Central Eastern Northern Western Total
Turkeys 37,415 231,806 9,573 13,596 292,389
Ducks 214,690 146,549 276,092 178,070 815,401
Geese & other birds 8,597 144,888 99,107 11,320 263,912
A6.1: Distribution of Plots according to type of seeds used in the First Season of 2005, by
Region
Region local improved Total
Number Percent Number Percent Number Percent
Central 6,282,816 94.51 365,302 5.49 6,648,118 100
Eastern 5,753,304 88.09 777,995 11.91 6,531,299 100
Northern 2,680,390 92.38 221,223 7.62 2,901,612 100
Western 8,168,728 97.85 179,131 2.15 8,347,859 100
Total 22,900,000 93.85 1,543,651 6.33 24,400,000 100
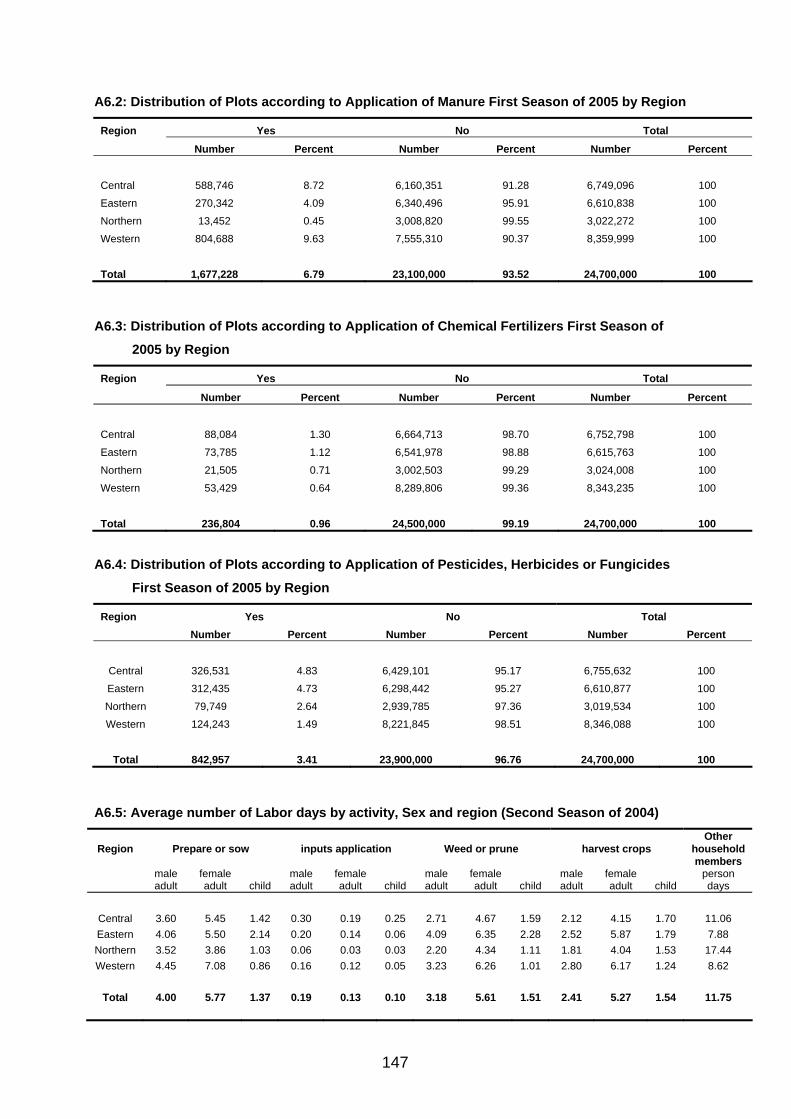
147
A6.2: Distribution of Plots according to Application of Manure First Season of 2005 by Region
Region Yes No Total Number Percent Number Percent Number Percent
Central 588,746 8.72 6,160,351 91.28 6,749,096 100
Eastern 270,342 4.09 6,340,496 95.91 6,610,838 100
Northern 13,452 0.45 3,008,820 99.55 3,022,272 100
Western 804,688 9.63 7,555,310 90.37 8,359,999 100
Total 1,677,228 6.79 23,100,000 93.52 24,700,000 100
A6.3: Distribution of Plots according to Application of Chemical Fertilizers First Season of
2005 by Region
Region Yes No Total
Number Percent Number Percent Number Percent
Central 88,084 1.30 6,664,713 98.70 6,752,798 100
Eastern 73,785 1.12 6,541,978 98.88 6,615,763 100
Northern 21,505 0.71 3,002,503 99.29 3,024,008 100
Western 53,429 0.64 8,289,806 99.36 8,343,235 100
Total 236,804 0.96 24,500,000 99.19 24,700,000 100 A6.4: Distribution of Plots according to Application of Pesticides, Herbicides or Fungicides
First Season of 2005 by Region
Region Yes No Total Number Percent Number Percent Number Percent
Central 326,531 4.83 6,429,101 95.17 6,755,632 100
Eastern 312,435 4.73 6,298,442 95.27 6,610,877 100
Northern 79,749 2.64 2,939,785 97.36 3,019,534 100
Western 124,243 1.49 8,221,845 98.51 8,346,088 100
Total 842,957 3.41 23,900,000 96.76 24,700,000 100 A6.5: Average number of Labor days by activity, Sex and region (Second Season of 2004)
Region Prepare or sow inputs application Weed or prune harvest crops Other
household members
male adult
female adult child
male adult
female adult child
male adult
female adult child
male adult
female adult child
person days
Central 3.60 5.45 1.42 0.30 0.19 0.25 2.71 4.67 1.59 2.12 4.15 1.70 11.06 Eastern 4.06 5.50 2.14 0.20 0.14 0.06 4.09 6.35 2.28 2.52 5.87 1.79 7.88 Northern 3.52 3.86 1.03 0.06 0.03 0.03 2.20 4.34 1.11 1.81 4.04 1.53 17.44 Western 4.45 7.08 0.86 0.16 0.12 0.05 3.23 6.26 1.01 2.80 6.17 1.24 8.62
Total 4.00 5.77 1.37 0.19 0.13 0.10 3.18 5.61 1.51 2.41 5.27 1.54 11.75
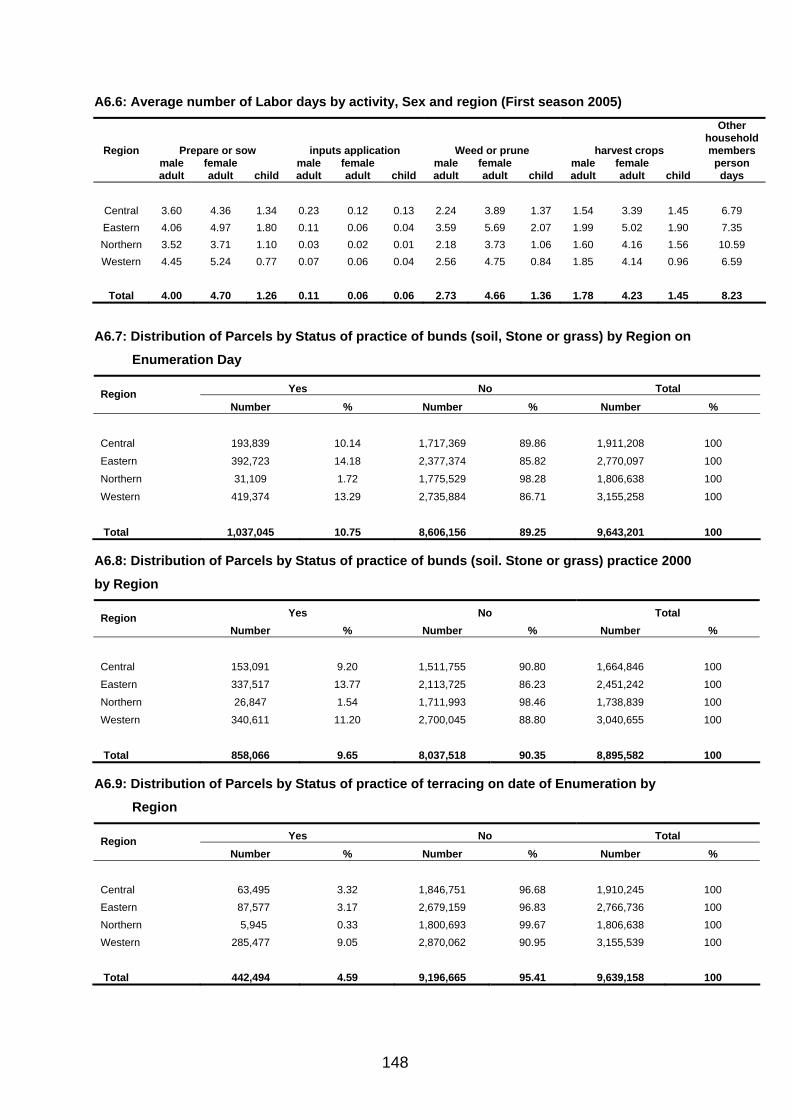
148
A6.6: Average number of Labor days by activity, Sex and region (First season 2005)
Region Prepare or sow inputs application Weed or prune harvest crops
Other household members
male adult
female adult child
male adult
female adult child
male adult
female adult child
male adult
female adult child
person days
Central 3.60 4.36 1.34 0.23 0.12 0.13 2.24 3.89 1.37 1.54 3.39 1.45 6.79 Eastern 4.06 4.97 1.80 0.11 0.06 0.04 3.59 5.69 2.07 1.99 5.02 1.90 7.35 Northern 3.52 3.71 1.10 0.03 0.02 0.01 2.18 3.73 1.06 1.60 4.16 1.56 10.59 Western 4.45 5.24 0.77 0.07 0.06 0.04 2.56 4.75 0.84 1.85 4.14 0.96 6.59
Total 4.00 4.70 1.26 0.11 0.06 0.06 2.73 4.66 1.36 1.78 4.23 1.45 8.23
A6.7: Distribution of Parcels by Status of practice of bunds (soil, Stone or grass) by Region on
Enumeration Day
Yes No Total Region Number % Number % Number %
Central 193,839 10.14 1,717,369 89.86 1,911,208 100
Eastern 392,723 14.18 2,377,374 85.82 2,770,097 100
Northern 31,109 1.72 1,775,529 98.28 1,806,638 100
Western 419,374 13.29 2,735,884 86.71 3,155,258 100
Total 1,037,045 10.75 8,606,156 89.25 9,643,201 100 A6.8: Distribution of Parcels by Status of practice of bunds (soil. Stone or grass) practice 2000
by Region
Yes No Total Region Number % Number % Number %
Central 153,091 9.20 1,511,755 90.80 1,664,846 100
Eastern 337,517 13.77 2,113,725 86.23 2,451,242 100
Northern 26,847 1.54 1,711,993 98.46 1,738,839 100
Western 340,611 11.20 2,700,045 88.80 3,040,655 100
Total 858,066 9.65 8,037,518 90.35 8,895,582 100
A6.9: Distribution of Parcels by Status of practice of terracing on date of Enumeration by
Region
Yes No Total Region Number % Number % Number %
Central 63,495 3.32 1,846,751 96.68 1,910,245 100 Eastern 87,577 3.17 2,679,159 96.83 2,766,736 100 Northern 5,945 0.33 1,800,693 99.67 1,806,638 100 Western 285,477 9.05 2,870,062 90.95 3,155,539 100 Total 442,494 4.59 9,196,665 95.41 9,639,158 100
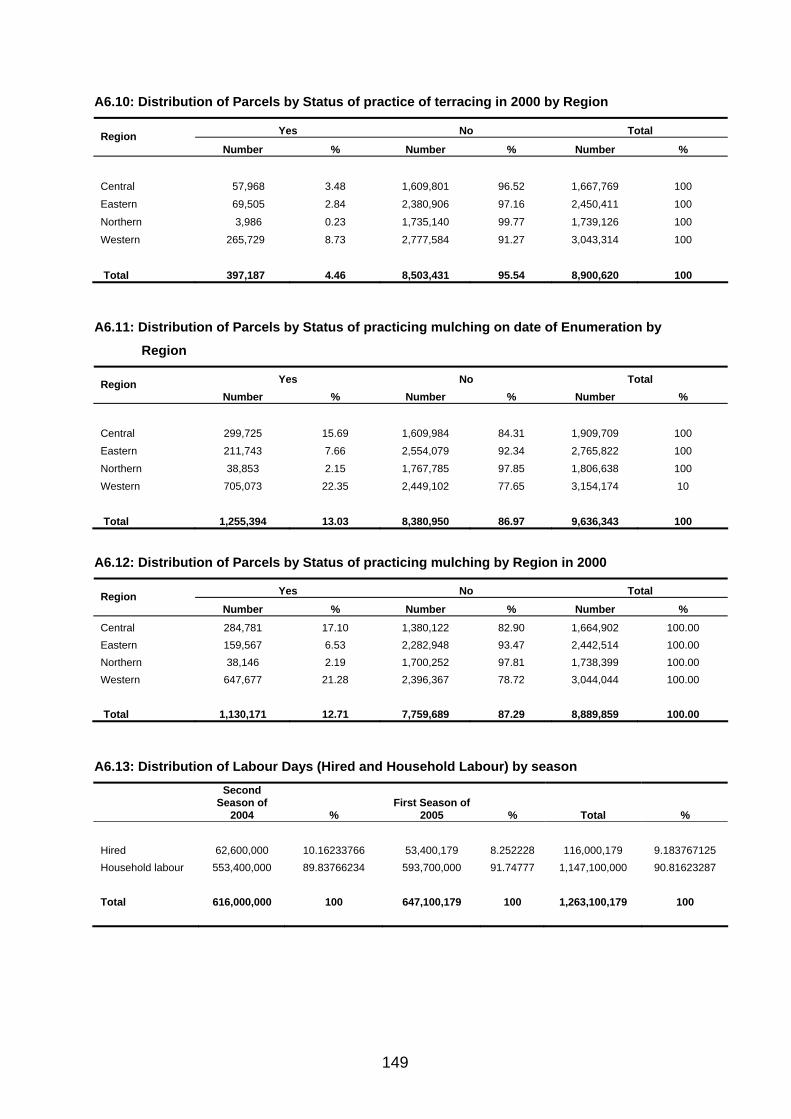
149
A6.10: Distribution of Parcels by Status of practice of terracing in 2000 by Region
Yes No Total Region Number % Number % Number %
Central 57,968 3.48 1,609,801 96.52 1,667,769 100
Eastern 69,505 2.84 2,380,906 97.16 2,450,411 100
Northern 3,986 0.23 1,735,140 99.77 1,739,126 100
Western 265,729 8.73 2,777,584 91.27 3,043,314 100
Total 397,187 4.46 8,503,431 95.54 8,900,620 100
A6.11: Distribution of Parcels by Status of practicing mulching on date of Enumeration by
Region
Yes No Total Region Number % Number % Number %
Central 299,725 15.69 1,609,984 84.31 1,909,709 100 Eastern 211,743 7.66 2,554,079 92.34 2,765,822 100 Northern 38,853 2.15 1,767,785 97.85 1,806,638 100 Western 705,073 22.35 2,449,102 77.65 3,154,174 10 Total 1,255,394 13.03 8,380,950 86.97 9,636,343 100
A6.12: Distribution of Parcels by Status of practicing mulching by Region in 2000
Yes No Total Region Number % Number % Number %
Central 284,781 17.10 1,380,122 82.90 1,664,902 100.00 Eastern 159,567 6.53 2,282,948 93.47 2,442,514 100.00 Northern 38,146 2.19 1,700,252 97.81 1,738,399 100.00 Western 647,677 21.28 2,396,367 78.72 3,044,044 100.00 Total 1,130,171 12.71 7,759,689 87.29 8,889,859 100.00
A6.13: Distribution of Labour Days (Hired and Household Labour) by season
Second Season of
2004 % First Season of
2005 % Total % Hired 62,600,000 10.16233766 53,400,179 8.252228 116,000,179 9.183767125 Household labour 553,400,000 89.83766234 593,700,000 91.74777 1,147,100,000 90.81623287 Total 616,000,000 100 647,100,179 100 1,263,100,179 100
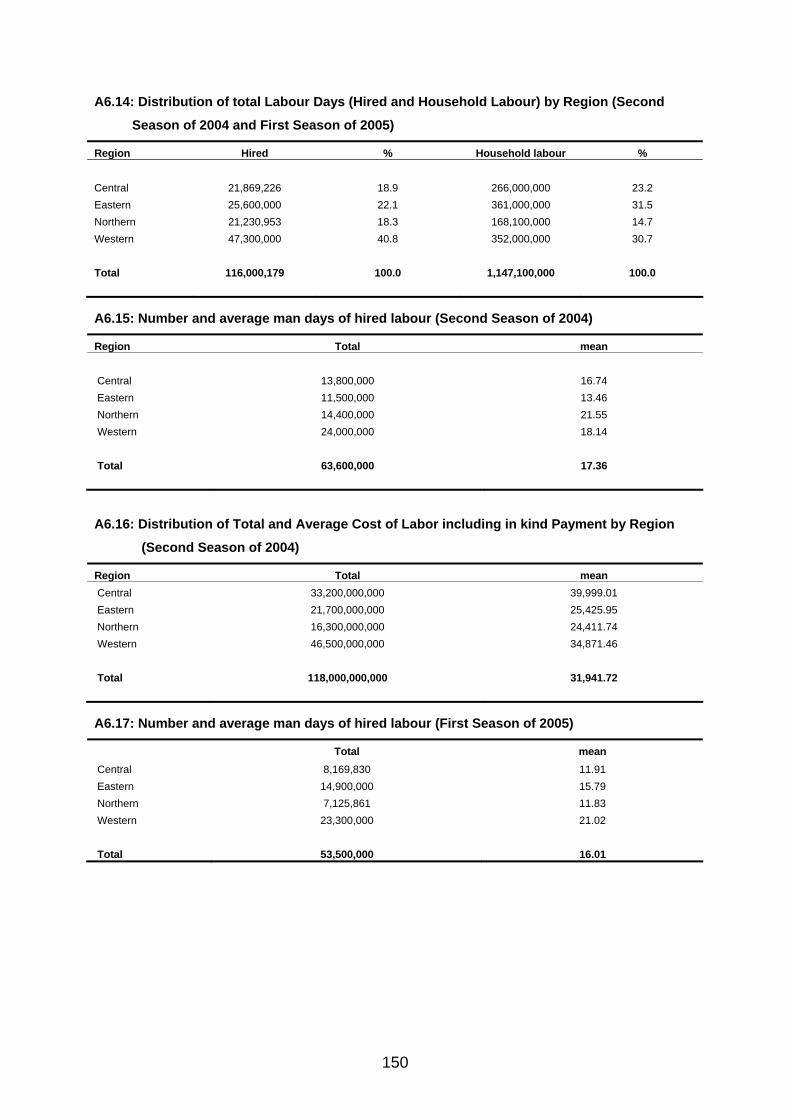
150
A6.14: Distribution of total Labour Days (Hired and Household Labour) by Region (Second
Season of 2004 and First Season of 2005)
Region Hired % Household labour % Central 21,869,226 18.9 266,000,000 23.2 Eastern 25,600,000 22.1 361,000,000 31.5 Northern 21,230,953 18.3 168,100,000 14.7 Western 47,300,000 40.8 352,000,000 30.7 Total 116,000,179 100.0 1,147,100,000 100.0 A6.15: Number and average man days of hired labour (Second Season of 2004)
Region Total mean Central 13,800,000 16.74 Eastern 11,500,000 13.46 Northern 14,400,000 21.55 Western 24,000,000 18.14 Total 63,600,000 17.36 A6.16: Distribution of Total and Average Cost of Labor including in kind Payment by Region
(Second Season of 2004)
Region Total mean Central 33,200,000,000 39,999.01 Eastern 21,700,000,000 25,425.95 Northern 16,300,000,000 24,411.74 Western 46,500,000,000 34,871.46 Total 118,000,000,000 31,941.72 A6.17: Number and average man days of hired labour (First Season of 2005)
Total mean Central 8,169,830 11.91 Eastern 14,900,000 15.79 Northern 7,125,861 11.83 Western 23,300,000 21.02 Total 53,500,000 16.01
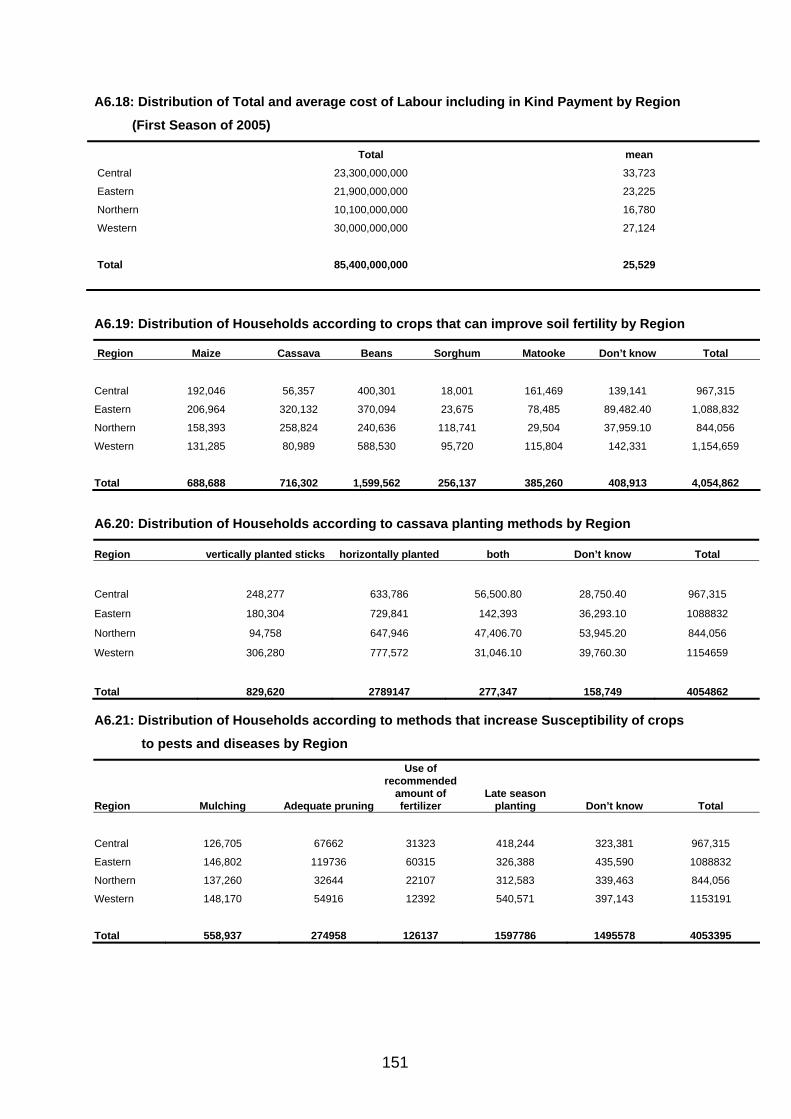
151
A6.18: Distribution of Total and average cost of Labour including in Kind Payment by Region
(First Season of 2005)
Total mean Central 23,300,000,000 33,723
Eastern 21,900,000,000 23,225
Northern 10,100,000,000 16,780
Western 30,000,000,000 27,124
Total 85,400,000,000 25,529 A6.19: Distribution of Households according to crops that can improve soil fertility by Region
Region Maize Cassava Beans Sorghum Matooke Don’t know Total
Central 192,046 56,357 400,301 18,001 161,469 139,141 967,315
Eastern 206,964 320,132 370,094 23,675 78,485 89,482.40 1,088,832
Northern 158,393 258,824 240,636 118,741 29,504 37,959.10 844,056
Western 131,285 80,989 588,530 95,720 115,804 142,331 1,154,659
Total 688,688 716,302 1,599,562 256,137 385,260 408,913 4,054,862 A6.20: Distribution of Households according to cassava planting methods by Region
Region vertically planted sticks horizontally planted both Don’t know Total
Central 248,277 633,786 56,500.80 28,750.40 967,315
Eastern 180,304 729,841 142,393 36,293.10 1088832
Northern 94,758 647,946 47,406.70 53,945.20 844,056
Western 306,280 777,572 31,046.10 39,760.30 1154659
Total 829,620 2789147 277,347 158,749 4054862 A6.21: Distribution of Households according to methods that increase Susceptibility of crops
to pests and diseases by Region
Region Mulching Adequate pruning
Use of recommended
amount of fertilizer
Late season planting Don’t know Total
Central 126,705 67662 31323 418,244 323,381 967,315
Eastern 146,802 119736 60315 326,388 435,590 1088832
Northern 137,260 32644 22107 312,583 339,463 844,056
Western 148,170 54916 12392 540,571 397,143 1153191
Total 558,937 274958 126137 1597786 1495578 4053395
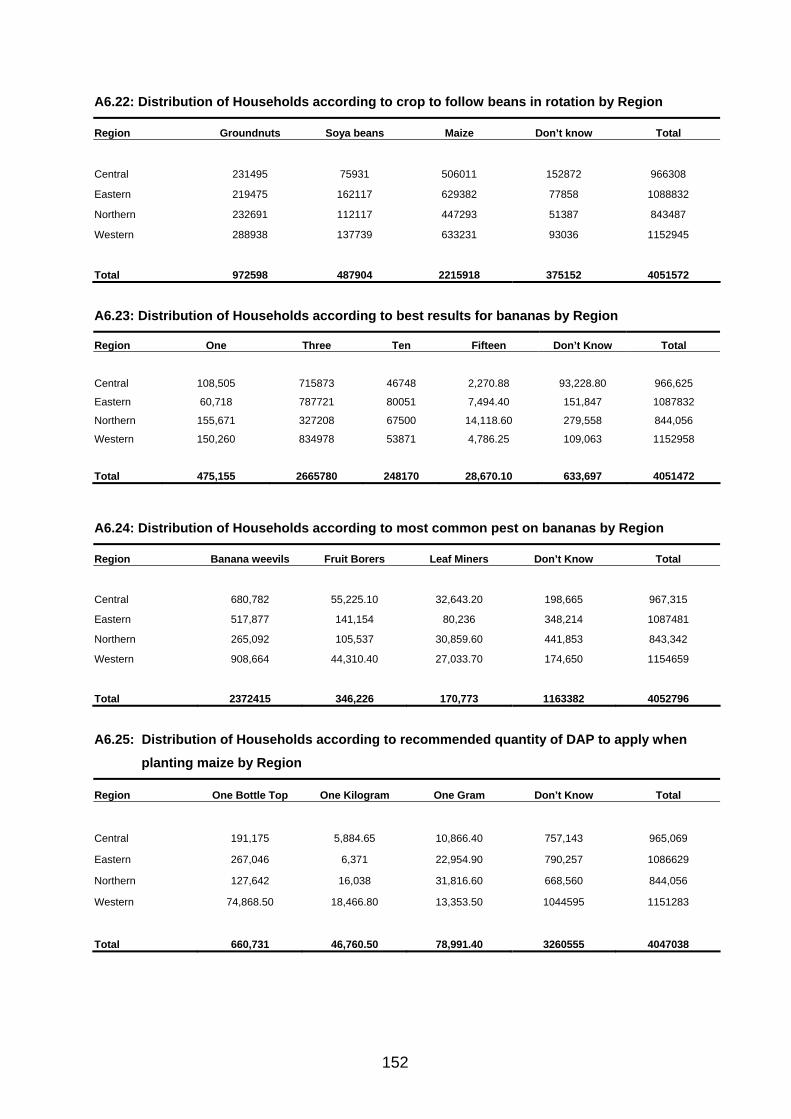
152
A6.22: Distribution of Households according to crop to follow beans in rotation by Region
Region Groundnuts Soya beans Maize Don’t know Total
Central 231495 75931 506011 152872 966308
Eastern 219475 162117 629382 77858 1088832
Northern 232691 112117 447293 51387 843487
Western 288938 137739 633231 93036 1152945
Total 972598 487904 2215918 375152 4051572 A6.23: Distribution of Households according to best results for bananas by Region
Region One Three Ten Fifteen Don’t Know Total
Central 108,505 715873 46748 2,270.88 93,228.80 966,625
Eastern 60,718 787721 80051 7,494.40 151,847 1087832
Northern 155,671 327208 67500 14,118.60 279,558 844,056
Western 150,260 834978 53871 4,786.25 109,063 1152958
Total 475,155 2665780 248170 28,670.10 633,697 4051472
A6.24: Distribution of Households according to most common pest on bananas by Region
Region Banana weevils Fruit Borers Leaf Miners Don’t Know Total
Central 680,782 55,225.10 32,643.20 198,665 967,315
Eastern 517,877 141,154 80,236 348,214 1087481
Northern 265,092 105,537 30,859.60 441,853 843,342
Western 908,664 44,310.40 27,033.70 174,650 1154659
Total 2372415 346,226 170,773 1163382 4052796 A6.25: Distribution of Households according to recommended quantity of DAP to apply when
planting maize by Region
Region One Bottle Top One Kilogram One Gram Don’t Know Total
Central 191,175 5,884.65 10,866.40 757,143 965,069
Eastern 267,046 6,371 22,954.90 790,257 1086629
Northern 127,642 16,038 31,816.60 668,560 844,056
Western 74,868.50 18,466.80 13,353.50 1044595 1151283
Total 660,731 46,760.50 78,991.40 3260555 4047038
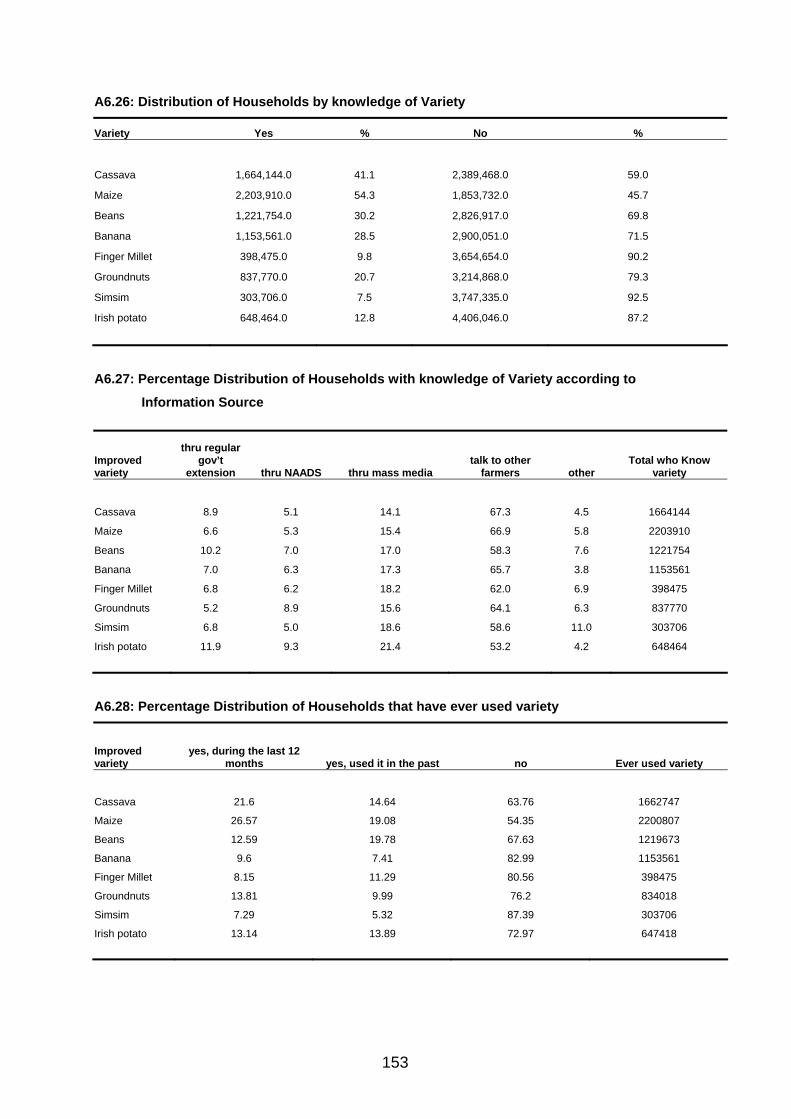
153
A6.26: Distribution of Households by knowledge of Variety
Variety Yes % No %
Cassava 1,664,144.0 41.1 2,389,468.0 59.0
Maize 2,203,910.0 54.3 1,853,732.0 45.7
Beans 1,221,754.0 30.2 2,826,917.0 69.8
Banana 1,153,561.0 28.5 2,900,051.0 71.5
Finger Millet 398,475.0 9.8 3,654,654.0 90.2
Groundnuts 837,770.0 20.7 3,214,868.0 79.3
Simsim 303,706.0 7.5 3,747,335.0 92.5
Irish potato 648,464.0 12.8 4,406,046.0 87.2
A6.27: Percentage Distribution of Households with knowledge of Variety according to
Information Source
Improved variety
thru regular gov’t
extension thru NAADS thru mass media talk to other
farmers other Total who Know
variety
Cassava 8.9 5.1 14.1 67.3 4.5 1664144
Maize 6.6 5.3 15.4 66.9 5.8 2203910
Beans 10.2 7.0 17.0 58.3 7.6 1221754
Banana 7.0 6.3 17.3 65.7 3.8 1153561
Finger Millet 6.8 6.2 18.2 62.0 6.9 398475
Groundnuts 5.2 8.9 15.6 64.1 6.3 837770
Simsim 6.8 5.0 18.6 58.6 11.0 303706
Irish potato 11.9 9.3 21.4 53.2 4.2 648464
A6.28: Percentage Distribution of Households that have ever used variety
Improved variety
yes, during the last 12 months yes, used it in the past no Ever used variety
Cassava 21.6 14.64 63.76 1662747
Maize 26.57 19.08 54.35 2200807
Beans 12.59 19.78 67.63 1219673
Banana 9.6 7.41 82.99 1153561
Finger Millet 8.15 11.29 80.56 398475
Groundnuts 13.81 9.99 76.2 834018
Simsim 7.29 5.32 87.39 303706
Irish potato 13.14 13.89 72.97 647418

154
Annex 2: Sampling Errors Household survey findings are usually estimates based on a sample of households selected using
appropriate sample designs. Estimates are affected by two types of errors; sampling and non
sampling errors.
Non Sampling errors result from wrong interpretation of results; mistakes in recording of responses,
definitional problems, improper recording of data, etc and are mainly committed during the
implementation of the survey.
Sampling errors, on the other hand, arise because observations are based on only one of the many
samples that could have been selected from the same population using the same design and
expected size. They are a measure of the variability between all possible samples. Sampling errors
are usually measured using Standard Errors (SE). SE is the square root of the variance and can be
used to calculate confidence intervals for the various estimates.
In addition, sometimes it is appropriate to measure the relative errors of some of the variables and the
Coefficient of Variation (CV) is one such measure. It is the quotient of the SE divided by the mean of
the variable of interest.
The SE and CVs were computed using STATA software. These take into account the multi-stage
nature of the survey design in computing SE. The results below indicate the SE and CVs computed
for the selected variables in the report. The SEs and CVs are presented for national regional and
rural-urban levels
Given below are the SEs and CVs for some of the major variables in the Agricultural Module 2004/5.
The results clearly show that for a number of the variables there are acceptable CVs. However, where
the number of observations were relatively small especially for relatively rare events, the CVs are very
high.
More specifically, the following conclusions can be made:
Ag HHs:
The CVs are acceptable for the numbers of Ag HHs, even at regional level;
Crop Plot numbers and Crop area:
The CVs for the plot numbers and crop area are acceptable for most crops except for field peas,
tea, cocoa and tobacco. These had very few observations which is explainable for tea where the
survey excluded institutional and large estates and tea is mostly grown on tea estates;
Crop Production: (excluding: Tea, Tobacco, Cocoa, Cotton and Coffee)
The CVs for crop production had generally higher CVs than both crop plots and area. Indeed
about half of the crops had CVs higher than 20% namely: field peas, pigeon peas, soya beans,
irish potatoes, banana (beer), tea, tobacco, cocoa, cotton, groundnuts and rice. It was the widely
grown crops that had acceptable CVs.

155
Tea, Tobacco, Cocoa, Cotton, and, Coffee Production It can therefore be concluded that for some crops it is still necessary to use other methods of
estimating production other than at the Ag HHs level. Such crops include tea, tobacco, cocoa,
cotton and to some extent coffee.
Cattle:
At the National level the CVs for the Exotic Calves, Exotic Bulls and Oxen, Exotic Heifers and
Calves, Indigenous Bulls and Oxen and Indigenous Heifers and Cows are acceptable, a
reflection of high reliability of estimates for them.
Similarly at regional level, Eastern Region had acceptable CVs for Indigenous Calves, Indigenous
Bulls and Oxen and Indigenous Heifers and Cows; for the Northern Region, it was Indigenous
Bulls and Oxen; for the Western Region, all categories of Cattle except Indigenous Heifers and
Cows had acceptable CVS.
Goats
At the national level Exotic Female Goats, Local Goats had acceptable CV; the same was true for
all regions.
Sheep
At the national level Local Sheep had acceptable CVs. Western Region had acceptable CVs for
Local Sheep.
Pigs At the national level, the numbers had acceptable CVs. All the regions had acceptable CVs except the
Western Region.
Poultry Backyard Chicken is the only chicken category that had acceptable CVs at the national and regional
levels.
To get proper estimates for exotic animals (cows, sheep, goats and) and chicken, requires either to:
Substantially increase the sample size to get adequate observations; or
Construct appropriate sampling frames for each category and therefore conduct specialized studies.
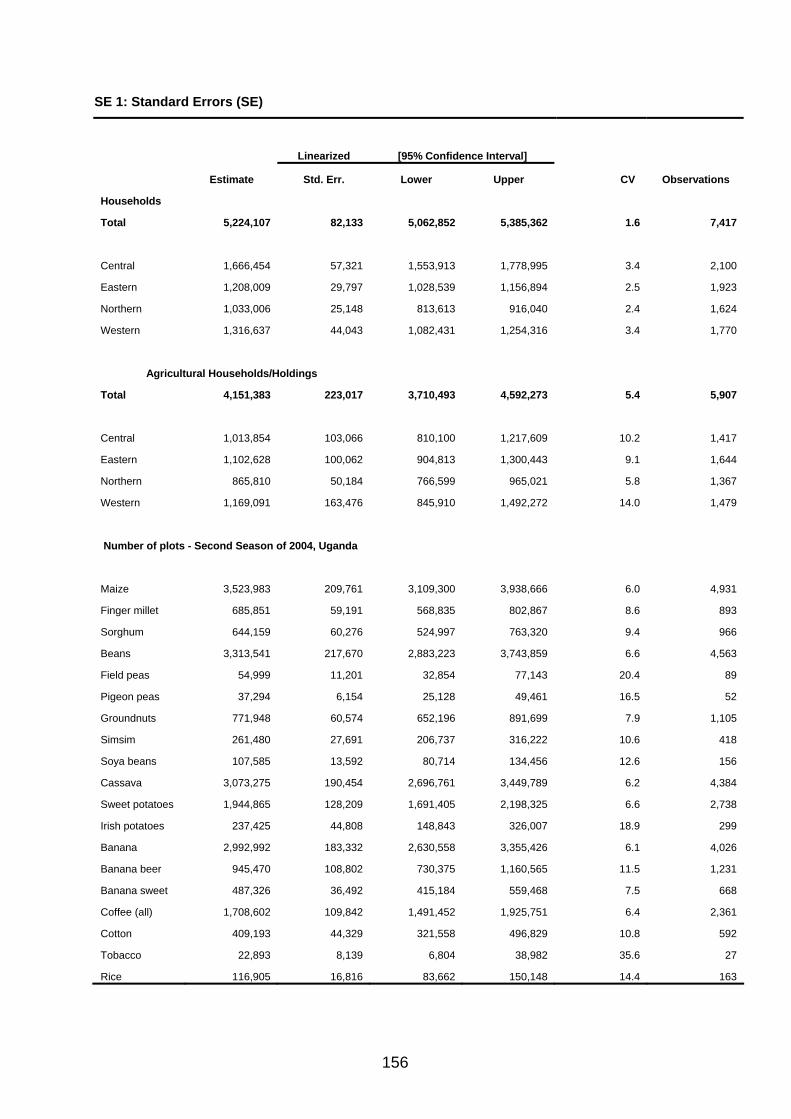
156
SE 1: Standard Errors (SE)
Linearized [95% Confidence Interval]
Estimate Std. Err. Lower Upper CV Observations
Households
Total 5,224,107 82,133 5,062,852 5,385,362 1.6 7,417
Central 1,666,454 57,321 1,553,913 1,778,995 3.4 2,100
Eastern 1,208,009 29,797 1,028,539 1,156,894 2.5 1,923
Northern 1,033,006 25,148 813,613 916,040 2.4 1,624
Western 1,316,637 44,043 1,082,431 1,254,316 3.4 1,770
Agricultural Households/Holdings
Total 4,151,383 223,017 3,710,493 4,592,273 5.4 5,907
Central 1,013,854 103,066 810,100 1,217,609 10.2 1,417
Eastern 1,102,628 100,062 904,813 1,300,443 9.1 1,644
Northern 865,810 50,184 766,599 965,021 5.8 1,367
Western 1,169,091 163,476 845,910 1,492,272 14.0 1,479
Number of plots - Second Season of 2004, Uganda
Maize 3,523,983 209,761 3,109,300 3,938,666 6.0 4,931
Finger millet 685,851 59,191 568,835 802,867 8.6 893
Sorghum 644,159 60,276 524,997 763,320 9.4 966
Beans 3,313,541 217,670 2,883,223 3,743,859 6.6 4,563
Field peas 54,999 11,201 32,854 77,143 20.4 89
Pigeon peas 37,294 6,154 25,128 49,461 16.5 52
Groundnuts 771,948 60,574 652,196 891,699 7.9 1,105
Simsim 261,480 27,691 206,737 316,222 10.6 418
Soya beans 107,585 13,592 80,714 134,456 12.6 156
Cassava 3,073,275 190,454 2,696,761 3,449,789 6.2 4,384
Sweet potatoes 1,944,865 128,209 1,691,405 2,198,325 6.6 2,738
Irish potatoes 237,425 44,808 148,843 326,007 18.9 299
Banana 2,992,992 183,332 2,630,558 3,355,426 6.1 4,026
Banana beer 945,470 108,802 730,375 1,160,565 11.5 1,231
Banana sweet 487,326 36,492 415,184 559,468 7.5 668
Coffee (all) 1,708,602 109,842 1,491,452 1,925,751 6.4 2,361
Cotton 409,193 44,329 321,558 496,829 10.8 592
Tobacco 22,893 8,139 6,804 38,982 35.6 27
Rice 116,905 16,816 83,662 150,148 14.4 163
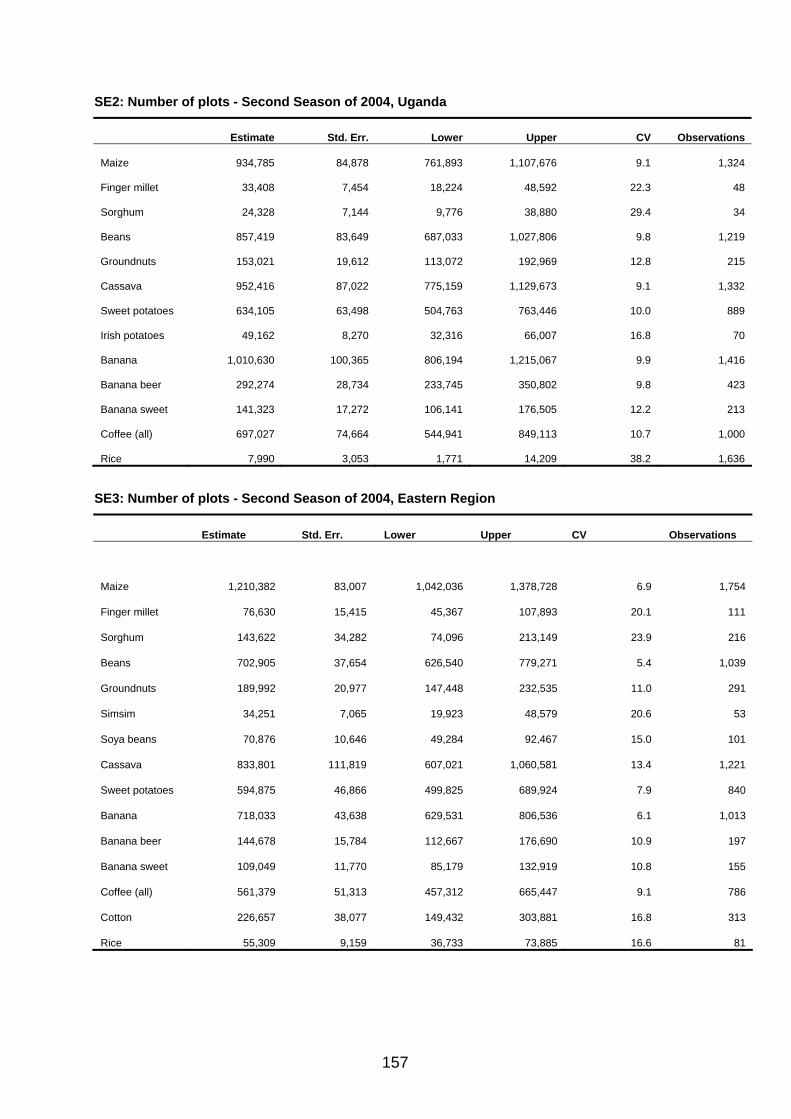
157
SE2: Number of plots - Second Season of 2004, Uganda
Estimate Std. Err. Lower Upper CV Observations
Maize 934,785 84,878 761,893 1,107,676 9.1 1,324
Finger millet 33,408 7,454 18,224 48,592 22.3 48
Sorghum 24,328 7,144 9,776 38,880 29.4 34
Beans 857,419 83,649 687,033 1,027,806 9.8 1,219
Groundnuts 153,021 19,612 113,072 192,969 12.8 215
Cassava 952,416 87,022 775,159 1,129,673 9.1 1,332
Sweet potatoes 634,105 63,498 504,763 763,446 10.0 889
Irish potatoes 49,162 8,270 32,316 66,007 16.8 70
Banana 1,010,630 100,365 806,194 1,215,067 9.9 1,416
Banana beer 292,274 28,734 233,745 350,802 9.8 423
Banana sweet 141,323 17,272 106,141 176,505 12.2 213
Coffee (all) 697,027 74,664 544,941 849,113 10.7 1,000
Rice 7,990 3,053 1,771 14,209 38.2 1,636
SE3: Number of plots - Second Season of 2004, Eastern Region
Estimate Std. Err. Lower Upper CV Observations
Maize 1,210,382 83,007 1,042,036 1,378,728 6.9 1,754
Finger millet 76,630 15,415 45,367 107,893 20.1 111
Sorghum 143,622 34,282 74,096 213,149 23.9 216
Beans 702,905 37,654 626,540 779,271 5.4 1,039
Groundnuts 189,992 20,977 147,448 232,535 11.0 291
Simsim 34,251 7,065 19,923 48,579 20.6 53
Soya beans 70,876 10,646 49,284 92,467 15.0 101
Cassava 833,801 111,819 607,021 1,060,581 13.4 1,221
Sweet potatoes 594,875 46,866 499,825 689,924 7.9 840
Banana 718,033 43,638 629,531 806,536 6.1 1,013
Banana beer 144,678 15,784 112,667 176,690 10.9 197
Banana sweet 109,049 11,770 85,179 132,919 10.8 155
Coffee (all) 561,379 51,313 457,312 665,447 9.1 786
Cotton 226,657 38,077 149,432 303,881 16.8 313
Rice 55,309 9,159 36,733 73,885 16.6 81

158
SE4: Number of plots - Second Season of 2004, Northern Region
Estimate Std. Err. Lower Upper CV Observations Maize 383,779 30,715 321,425 446,134 8.00 611 Finger millet 117,566 22,226 72,446 162,686 18.90 170 Sorghum 270,749 31,886 206,018 335,481 11.78 470 Beans 353,415 27,336 297,920 408,910 7.73 543 Field peas 44,527 10,440 23,333 65,722 23.45 73 Pigeon peas 29,724 5,602 18,352 41,096 18.85 42 Groundnuts 175,395 17,614 139,637 211,152 10.04 278 Simsim 218,667 26,442 164,987 272,347 12.09 355 Soya beans 6,783 2,685 1,333 12,233 39.58 13 Cassava 570,903 42,845 483,923 657,883 7.50 943 Sweet potatoes 163,328 18,908 124,944 201,712 11.58 295 Banana 24,384 7,366 9,430 39,338 30.21 38 Banana sweet 17,276 3,695 9,775 24,777 21.39 30 Coffee (all) 25,630 7,713 9,972 41,288 30.09 47 Rice 117,566 22,226 72,446 162,686 18.90 170
SE5: Number of plots - Second Season of 2004, Western Region
Crop Estimate Std. Err. Lower Upper CV Observations
Maize 995,037 162,882 665,300 1,324,774 16.4 1,242
Finger millet 458,247 49,672 357,690 558,804 10.8 564
Sorghum 205,459 36,251 132,072 278,846 17.6 246
Beans 1,399,801 185,990 1,023,285 1,776,318 13.3 1,762
Groundnuts 253,541 48,030 156,309 350,772 18.9 321
Soya beans 20,329 7,450 5,247 35,412 36.7 26
Cassava 716,155 116,827 479,651 952,658 16.3 888
Sweet potatoes 552,559 94,969 360,304 744,814 17.2 714
Irish potatoes 182,096 41,781 97,514 266,677 22.9 219
Banana 1,239,944 140,061 956,406 1,523,483 11.3 1,559
Banana beer 501,794 98,651 302,085 701,503 19.7 600
Banana sweet 219,678 28,324 162,339 277,016 12.9 270
Coffee all 424,566 59,858 303,390 545,742 14.1 528
Cotton 56,875 16,045 24,394 89,356 28.2 80
Rice 33,651 12,334 8,683 58,620 36.7 40

159
SE6: Number of plots – First Season of 2005, Uganda
Crop Estimate Std. Err. Lower Upper CV Observations
Maize 4,902,499 261,270 4,385,987 5,419,012 5.3 7,040
Finger millet 667,807 79,283 511,070 824,545 11.9 977
Sorghum 1,035,442 113,097 811,857 1,259,027 10.9 1,490
Beans 3,290,202 198,027 2,898,718 3,681,687 6.0 4,521
Field peas 72,222 11,951 48,595 95,848 16.6 110
Pigeon peas 154,985 16,544 122,279 187,691 10.7 214
Groundnuts 1,080,343 85,240 911,829 1,248,857 7.9 1,554
Simsim 168,835 18,676 131,915 205,755 11.1 247
Soya beans 121,319 13,778 94,081 148,557 11.4 165
Cassava 4,309,458 259,050 3,797,335 4,821,582 6.0 6,206
Sweet potatoes 2,768,175 162,405 2,447,112 3,089,238 5.9 3,867
Irish potatoes 256,916 49,926 158,216 355,615 19.4 318
Banana 3,222,385 189,157 2,848,435 3,596,335 5.9 4,328
Banana beer 997,039 114,189 771,295 1,222,783 11.5 1,310
Banana sweet 511,404 35,737 440,755 582,053 7.0 706
Coffee (all) 1,797,520 112,345 1,575,422 2,019,617 6.3 2,489
Cotton 75,129 12,620 50,181 100,078 16.8 105
Tobacco 79,141 12,694 54,046 104,235 16.0 114
Rice 197,342 19,886 158,028 236,656 10.1 281
SE7: Number of plots – First Season of 2005, Central Region
Crop Estimate Std. Err. Lower Upper CV Observations
Maize 1,132,366 84,352 960,546 1,304,186 7.5 1,650
Finger millet 25,928 7,440 10,774 41,082 28.7 35
Sorghum 33,172 6,936 19,043 47,301 20.9 49
Beans 833,779 64,851 701,682 965,876 7.8 1,209
Groundnuts 161,778 19,382 122,298 201,259 12.0 235
Cassava 1,210,147 91,707 1,023,346 1,396,947 7.6 1,740
Sweet potatoes 873,300 62,808 745,364 1,001,235 7.2 1,256
Irish potatoes 46,049 8,331 29,079 63,019 18.1 69
Banana 1,095,055 96,558 898,374 1,291,737 8.8 1,548
Banana beer 311,363 30,853 248,517 374,208 9.9 461
Banana sweet 152,134 17,960 115,550 188,718 11.8 231
Coffee (all) 727,655 73,590 577,757 877,553 10.1 1,054
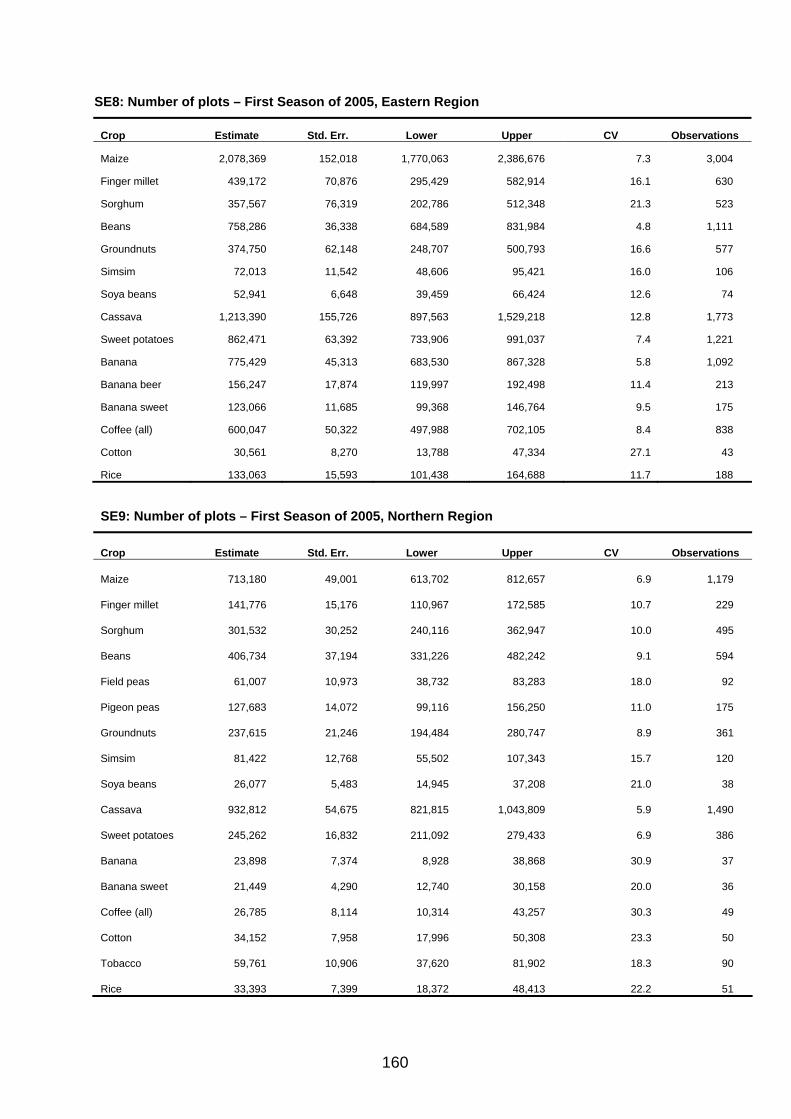
160
SE8: Number of plots – First Season of 2005, Eastern Region
Crop Estimate Std. Err. Lower Upper CV Observations
Maize 2,078,369 152,018 1,770,063 2,386,676 7.3 3,004
Finger millet 439,172 70,876 295,429 582,914 16.1 630
Sorghum 357,567 76,319 202,786 512,348 21.3 523
Beans 758,286 36,338 684,589 831,984 4.8 1,111
Groundnuts 374,750 62,148 248,707 500,793 16.6 577
Simsim 72,013 11,542 48,606 95,421 16.0 106
Soya beans 52,941 6,648 39,459 66,424 12.6 74
Cassava 1,213,390 155,726 897,563 1,529,218 12.8 1,773
Sweet potatoes 862,471 63,392 733,906 991,037 7.4 1,221
Banana 775,429 45,313 683,530 867,328 5.8 1,092
Banana beer 156,247 17,874 119,997 192,498 11.4 213
Banana sweet 123,066 11,685 99,368 146,764 9.5 175
Coffee (all) 600,047 50,322 497,988 702,105 8.4 838
Cotton 30,561 8,270 13,788 47,334 27.1 43
Rice 133,063 15,593 101,438 164,688 11.7 188
SE9: Number of plots – First Season of 2005, Northern Region
Crop Estimate Std. Err. Lower Upper CV Observations
Maize 713,180 49,001 613,702 812,657 6.9 1,179
Finger millet 141,776 15,176 110,967 172,585 10.7 229
Sorghum 301,532 30,252 240,116 362,947 10.0 495
Beans 406,734 37,194 331,226 482,242 9.1 594
Field peas 61,007 10,973 38,732 83,283 18.0 92
Pigeon peas 127,683 14,072 99,116 156,250 11.0 175
Groundnuts 237,615 21,246 194,484 280,747 8.9 361
Simsim 81,422 12,768 55,502 107,343 15.7 120
Soya beans 26,077 5,483 14,945 37,208 21.0 38
Cassava 932,812 54,675 821,815 1,043,809 5.9 1,490
Sweet potatoes 245,262 16,832 211,092 279,433 6.9 386
Banana 23,898 7,374 8,928 38,868 30.9 37
Banana sweet 21,449 4,290 12,740 30,158 20.0 36
Coffee (all) 26,785 8,114 10,314 43,257 30.3 49
Cotton 34,152 7,958 17,996 50,308 23.3 50
Tobacco 59,761 10,906 37,620 81,902 18.3 90
Rice 33,393 7,399 18,372 48,413 22.2 51
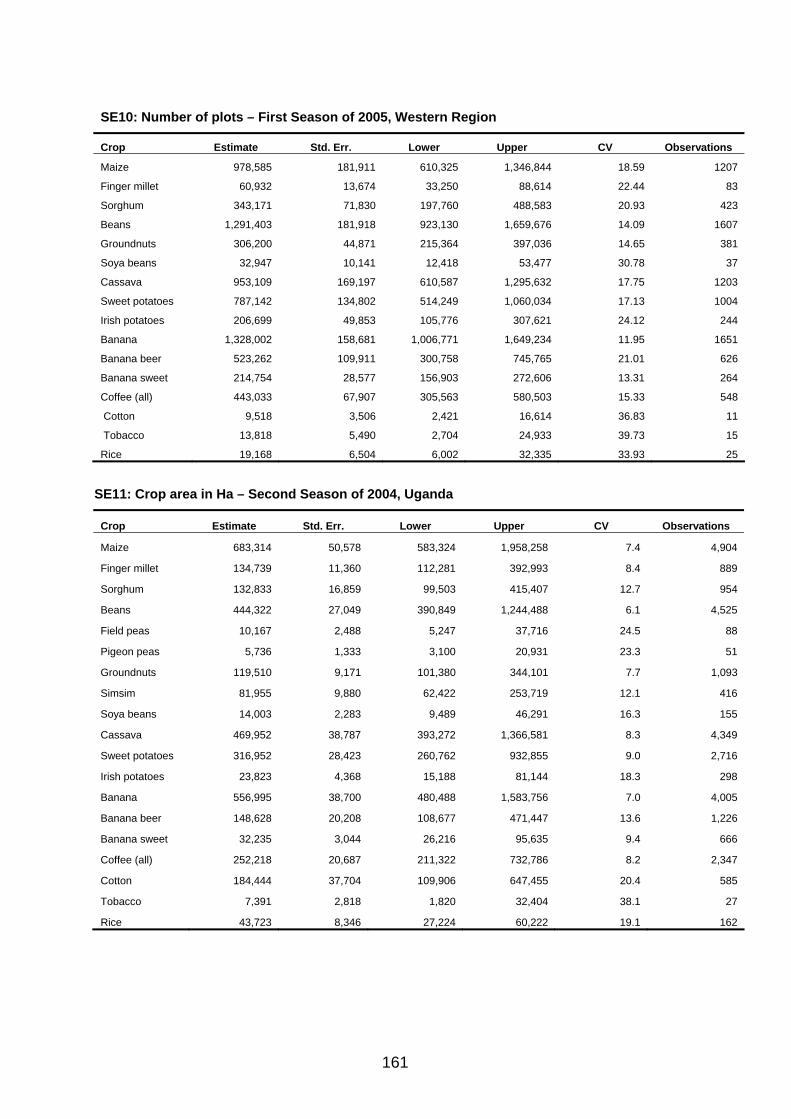
161
SE10: Number of plots – First Season of 2005, Western Region
Crop Estimate Std. Err. Lower Upper CV Observations
Maize 978,585 181,911 610,325 1,346,844 18.59 1207
Finger millet 60,932 13,674 33,250 88,614 22.44 83
Sorghum 343,171 71,830 197,760 488,583 20.93 423
Beans 1,291,403 181,918 923,130 1,659,676 14.09 1607
Groundnuts 306,200 44,871 215,364 397,036 14.65 381
Soya beans 32,947 10,141 12,418 53,477 30.78 37
Cassava 953,109 169,197 610,587 1,295,632 17.75 1203
Sweet potatoes 787,142 134,802 514,249 1,060,034 17.13 1004
Irish potatoes 206,699 49,853 105,776 307,621 24.12 244
Banana 1,328,002 158,681 1,006,771 1,649,234 11.95 1651
Banana beer 523,262 109,911 300,758 745,765 21.01 626
Banana sweet 214,754 28,577 156,903 272,606 13.31 264
Coffee (all) 443,033 67,907 305,563 580,503 15.33 548
Cotton 9,518 3,506 2,421 16,614 36.83 11
Tobacco 13,818 5,490 2,704 24,933 39.73 15
Rice 19,168 6,504 6,002 32,335 33.93 25
SE11: Crop area in Ha – Second Season of 2004, Uganda
Crop Estimate Std. Err. Lower Upper CV Observations
Maize 683,314 50,578 583,324 1,958,258 7.4 4,904
Finger millet 134,739 11,360 112,281 392,993 8.4 889
Sorghum 132,833 16,859 99,503 415,407 12.7 954
Beans 444,322 27,049 390,849 1,244,488 6.1 4,525
Field peas 10,167 2,488 5,247 37,716 24.5 88
Pigeon peas 5,736 1,333 3,100 20,931 23.3 51
Groundnuts 119,510 9,171 101,380 344,101 7.7 1,093
Simsim 81,955 9,880 62,422 253,719 12.1 416
Soya beans 14,003 2,283 9,489 46,291 16.3 155
Cassava 469,952 38,787 393,272 1,366,581 8.3 4,349
Sweet potatoes 316,952 28,423 260,762 932,855 9.0 2,716
Irish potatoes 23,823 4,368 15,188 81,144 18.3 298
Banana 556,995 38,700 480,488 1,583,756 7.0 4,005
Banana beer 148,628 20,208 108,677 471,447 13.6 1,226
Banana sweet 32,235 3,044 26,216 95,635 9.4 666
Coffee (all) 252,218 20,687 211,322 732,786 8.2 2,347
Cotton 184,444 37,704 109,906 647,455 20.4 585
Tobacco 7,391 2,818 1,820 32,404 38.1 27
Rice 43,723 8,346 27,224 60,222 19.1 162
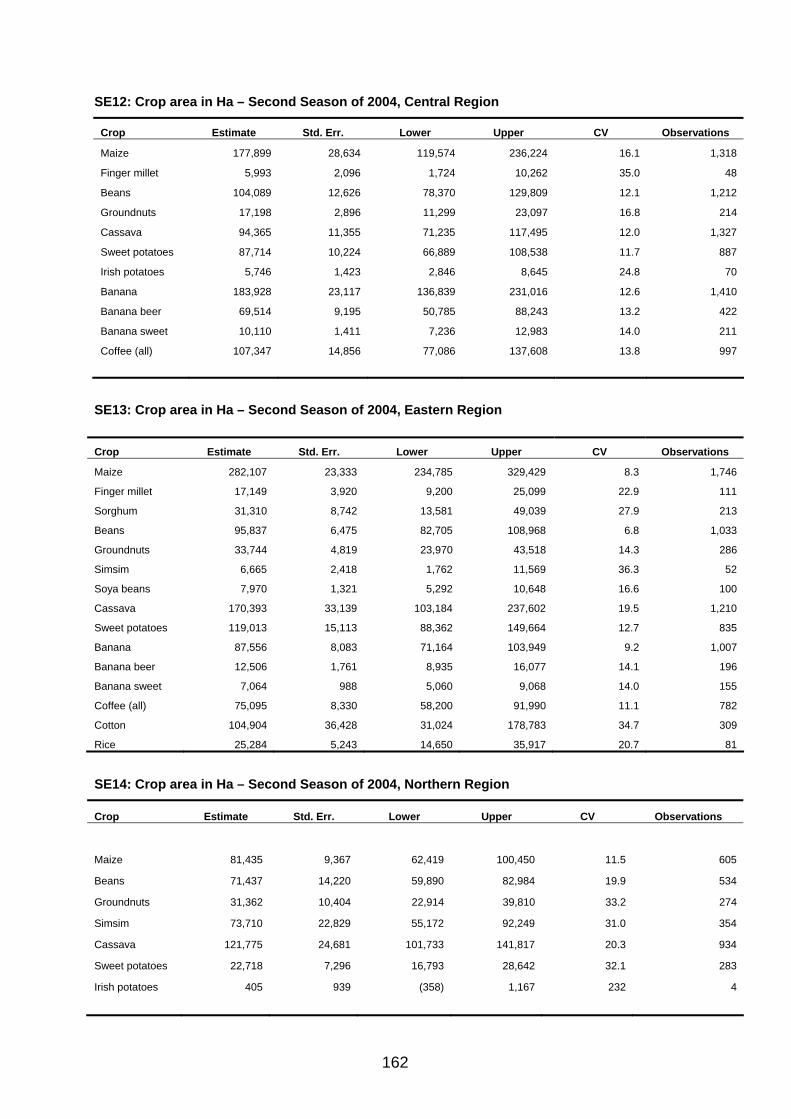
162
SE12: Crop area in Ha – Second Season of 2004, Central Region
Crop Estimate Std. Err. Lower Upper CV Observations
Maize 177,899 28,634 119,574 236,224 16.1 1,318
Finger millet 5,993 2,096 1,724 10,262 35.0 48
Beans 104,089 12,626 78,370 129,809 12.1 1,212
Groundnuts 17,198 2,896 11,299 23,097 16.8 214
Cassava 94,365 11,355 71,235 117,495 12.0 1,327
Sweet potatoes 87,714 10,224 66,889 108,538 11.7 887
Irish potatoes 5,746 1,423 2,846 8,645 24.8 70
Banana 183,928 23,117 136,839 231,016 12.6 1,410
Banana beer 69,514 9,195 50,785 88,243 13.2 422
Banana sweet 10,110 1,411 7,236 12,983 14.0 211
Coffee (all) 107,347 14,856 77,086 137,608 13.8 997
SE13: Crop area in Ha – Second Season of 2004, Eastern Region
Crop Estimate Std. Err. Lower Upper CV Observations
Maize 282,107 23,333 234,785 329,429 8.3 1,746
Finger millet 17,149 3,920 9,200 25,099 22.9 111
Sorghum 31,310 8,742 13,581 49,039 27.9 213
Beans 95,837 6,475 82,705 108,968 6.8 1,033
Groundnuts 33,744 4,819 23,970 43,518 14.3 286
Simsim 6,665 2,418 1,762 11,569 36.3 52
Soya beans 7,970 1,321 5,292 10,648 16.6 100
Cassava 170,393 33,139 103,184 237,602 19.5 1,210
Sweet potatoes 119,013 15,113 88,362 149,664 12.7 835
Banana 87,556 8,083 71,164 103,949 9.2 1,007
Banana beer 12,506 1,761 8,935 16,077 14.1 196
Banana sweet 7,064 988 5,060 9,068 14.0 155
Coffee (all) 75,095 8,330 58,200 91,990 11.1 782
Cotton 104,904 36,428 31,024 178,783 34.7 309
Rice 25,284 5,243 14,650 35,917 20.7 81
SE14: Crop area in Ha – Second Season of 2004, Northern Region
Crop Estimate Std. Err. Lower Upper CV Observations
Maize 81,435 9,367 62,419 100,450 11.5 605
Beans 71,437 14,220 59,890 82,984 19.9 534
Groundnuts 31,362 10,404 22,914 39,810 33.2 274
Simsim 73,710 22,829 55,172 92,249 31.0 354
Cassava 121,775 24,681 101,733 141,817 20.3 934
Sweet potatoes 22,718 7,296 16,793 28,642 32.1 283
Irish potatoes 405 939 (358) 1,167 232 4
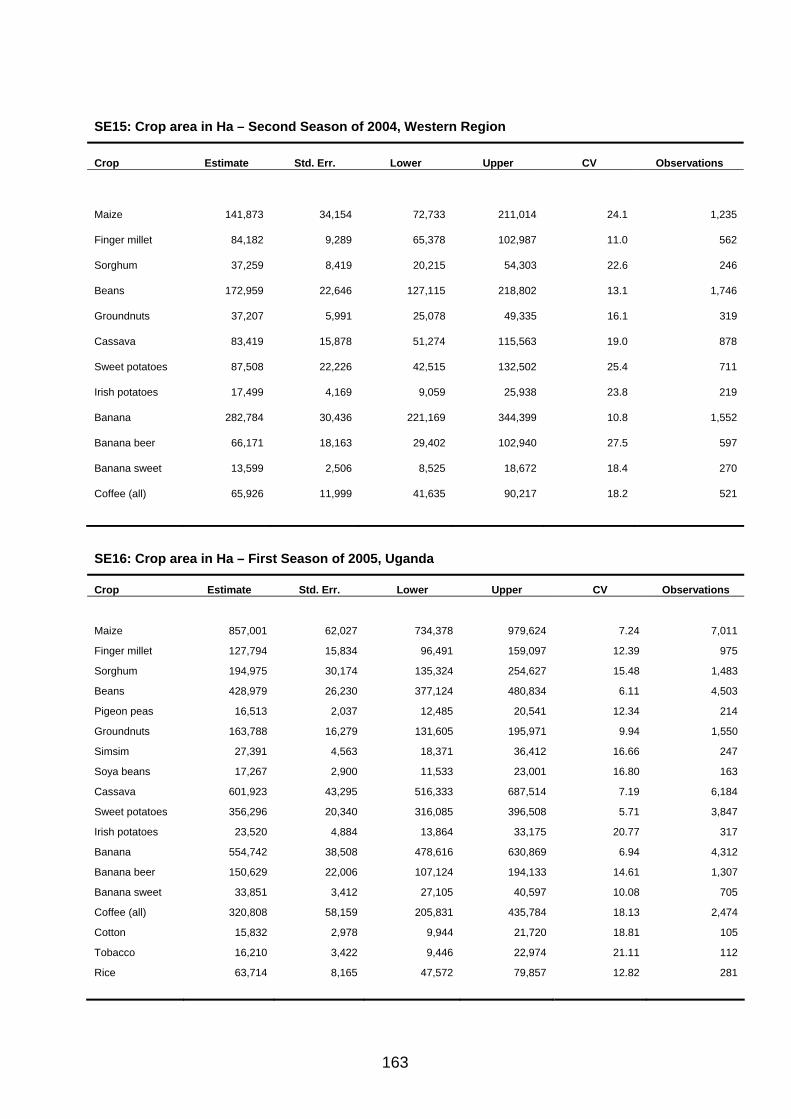
163
SE15: Crop area in Ha – Second Season of 2004, Western Region
Crop Estimate Std. Err. Lower Upper CV Observations
Maize 141,873 34,154 72,733 211,014 24.1 1,235
Finger millet 84,182 9,289 65,378 102,987 11.0 562
Sorghum 37,259 8,419 20,215 54,303 22.6 246
Beans 172,959 22,646 127,115 218,802 13.1 1,746
Groundnuts 37,207 5,991 25,078 49,335 16.1 319
Cassava 83,419 15,878 51,274 115,563 19.0 878
Sweet potatoes 87,508 22,226 42,515 132,502 25.4 711
Irish potatoes 17,499 4,169 9,059 25,938 23.8 219
Banana 282,784 30,436 221,169 344,399 10.8 1,552
Banana beer 66,171 18,163 29,402 102,940 27.5 597
Banana sweet 13,599 2,506 8,525 18,672 18.4 270
Coffee (all) 65,926 11,999 41,635 90,217 18.2 521
SE16: Crop area in Ha – First Season of 2005, Uganda
Crop Estimate Std. Err. Lower Upper CV Observations
Maize 857,001 62,027 734,378 979,624 7.24 7,011
Finger millet 127,794 15,834 96,491 159,097 12.39 975
Sorghum 194,975 30,174 135,324 254,627 15.48 1,483
Beans 428,979 26,230 377,124 480,834 6.11 4,503
Pigeon peas 16,513 2,037 12,485 20,541 12.34 214
Groundnuts 163,788 16,279 131,605 195,971 9.94 1,550
Simsim 27,391 4,563 18,371 36,412 16.66 247
Soya beans 17,267 2,900 11,533 23,001 16.80 163
Cassava 601,923 43,295 516,333 687,514 7.19 6,184
Sweet potatoes 356,296 20,340 316,085 396,508 5.71 3,847
Irish potatoes 23,520 4,884 13,864 33,175 20.77 317
Banana 554,742 38,508 478,616 630,869 6.94 4,312
Banana beer 150,629 22,006 107,124 194,133 14.61 1,307
Banana sweet 33,851 3,412 27,105 40,597 10.08 705
Coffee (all) 320,808 58,159 205,831 435,784 18.13 2,474
Cotton 15,832 2,978 9,944 21,720 18.81 105
Tobacco 16,210 3,422 9,446 22,974 21.11 112
Rice 63,714 8,165 47,572 79,857 12.82 281
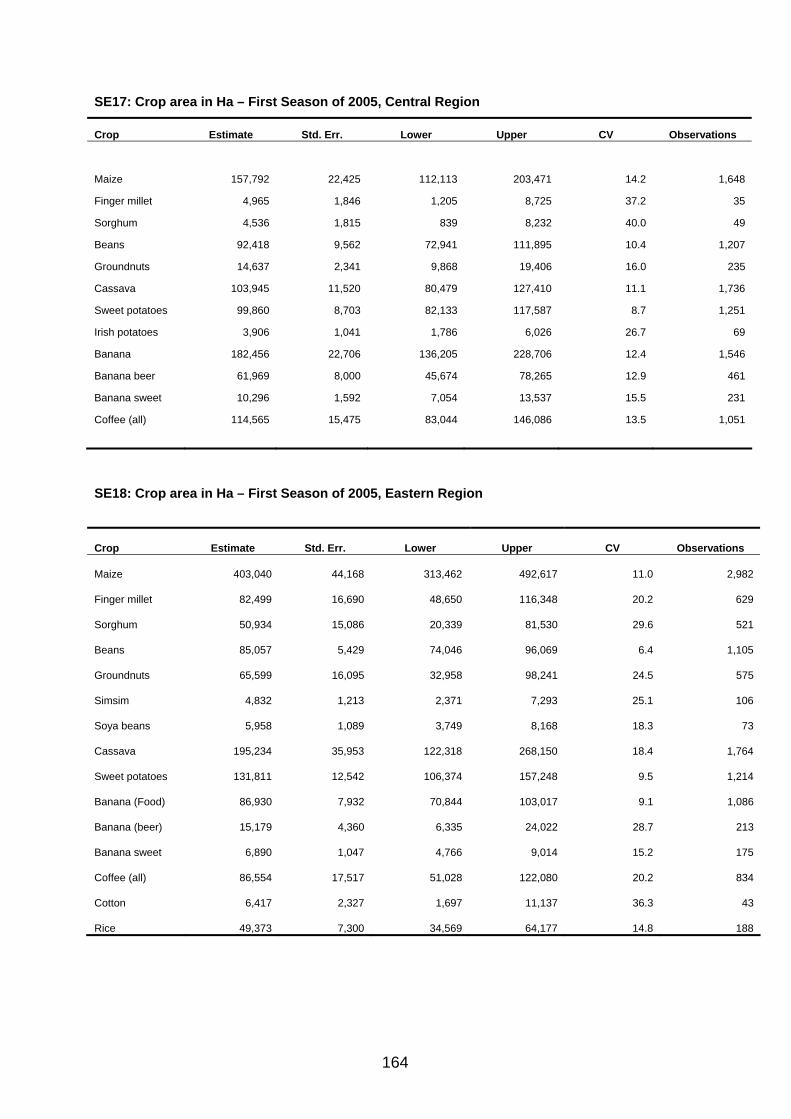
164
SE17: Crop area in Ha – First Season of 2005, Central Region
Crop Estimate Std. Err. Lower Upper CV Observations
Maize 157,792 22,425 112,113 203,471 14.2 1,648
Finger millet 4,965 1,846 1,205 8,725 37.2 35
Sorghum 4,536 1,815 839 8,232 40.0 49
Beans 92,418 9,562 72,941 111,895 10.4 1,207
Groundnuts 14,637 2,341 9,868 19,406 16.0 235
Cassava 103,945 11,520 80,479 127,410 11.1 1,736
Sweet potatoes 99,860 8,703 82,133 117,587 8.7 1,251
Irish potatoes 3,906 1,041 1,786 6,026 26.7 69
Banana 182,456 22,706 136,205 228,706 12.4 1,546
Banana beer 61,969 8,000 45,674 78,265 12.9 461
Banana sweet 10,296 1,592 7,054 13,537 15.5 231
Coffee (all) 114,565 15,475 83,044 146,086 13.5 1,051
SE18: Crop area in Ha – First Season of 2005, Eastern Region
Crop Estimate Std. Err. Lower Upper CV Observations
Maize 403,040 44,168 313,462 492,617 11.0 2,982
Finger millet 82,499 16,690 48,650 116,348 20.2 629
Sorghum 50,934 15,086 20,339 81,530 29.6 521
Beans 85,057 5,429 74,046 96,069 6.4 1,105
Groundnuts 65,599 16,095 32,958 98,241 24.5 575
Simsim 4,832 1,213 2,371 7,293 25.1 106
Soya beans 5,958 1,089 3,749 8,168 18.3 73
Cassava 195,234 35,953 122,318 268,150 18.4 1,764
Sweet potatoes 131,811 12,542 106,374 157,248 9.5 1,214
Banana (Food) 86,930 7,932 70,844 103,017 9.1 1,086
Banana (beer) 15,179 4,360 6,335 24,022 28.7 213
Banana sweet 6,890 1,047 4,766 9,014 15.2 175
Coffee (all) 86,554 17,517 51,028 122,080 20.2 834
Cotton 6,417 2,327 1,697 11,137 36.3 43
Rice 49,373 7,300 34,569 64,177 14.8 188
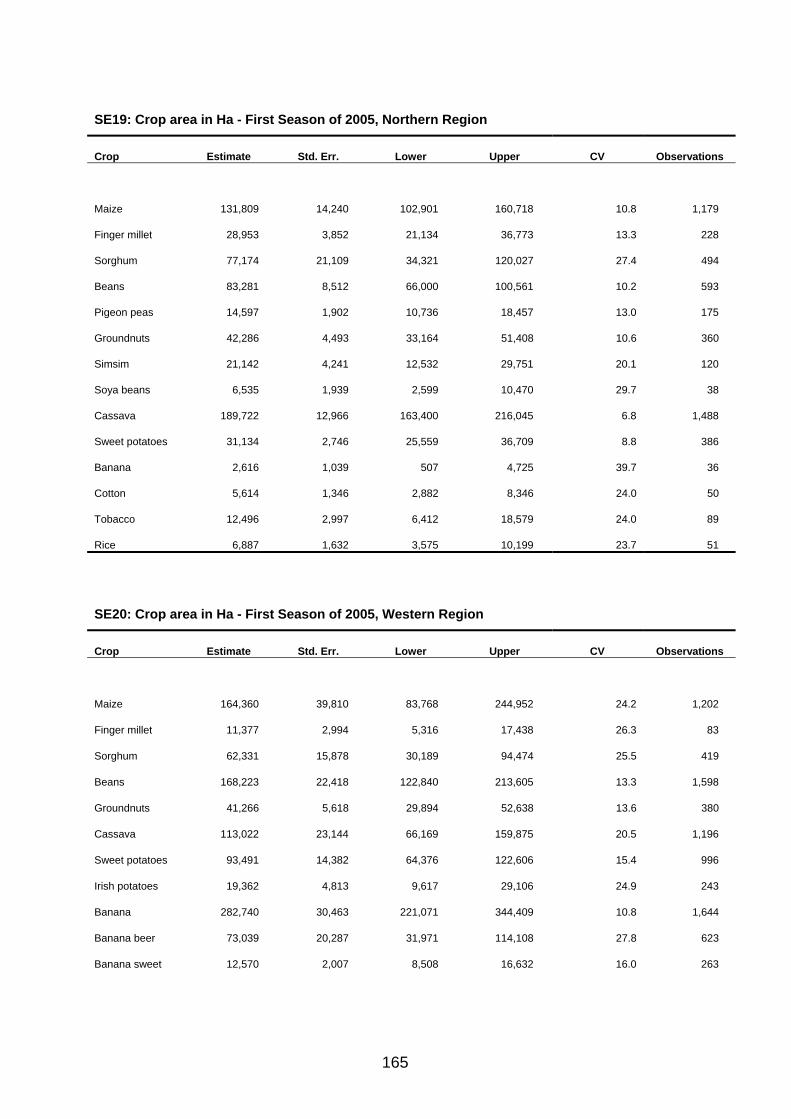
165
SE19: Crop area in Ha - First Season of 2005, Northern Region
Crop Estimate Std. Err. Lower Upper CV Observations
Maize 131,809 14,240 102,901 160,718 10.8 1,179
Finger millet 28,953 3,852 21,134 36,773 13.3 228
Sorghum 77,174 21,109 34,321 120,027 27.4 494
Beans 83,281 8,512 66,000 100,561 10.2 593
Pigeon peas 14,597 1,902 10,736 18,457 13.0 175
Groundnuts 42,286 4,493 33,164 51,408 10.6 360
Simsim 21,142 4,241 12,532 29,751 20.1 120
Soya beans 6,535 1,939 2,599 10,470 29.7 38
Cassava 189,722 12,966 163,400 216,045 6.8 1,488
Sweet potatoes 31,134 2,746 25,559 36,709 8.8 386
Banana 2,616 1,039 507 4,725 39.7 36
Cotton 5,614 1,346 2,882 8,346 24.0 50
Tobacco 12,496 2,997 6,412 18,579 24.0 89
Rice 6,887 1,632 3,575 10,199 23.7 51
SE20: Crop area in Ha - First Season of 2005, Western Region
Crop Estimate Std. Err. Lower Upper CV Observations
Maize 164,360 39,810 83,768 244,952 24.2 1,202
Finger millet 11,377 2,994 5,316 17,438 26.3 83
Sorghum 62,331 15,878 30,189 94,474 25.5 419
Beans 168,223 22,418 122,840 213,605 13.3 1,598
Groundnuts 41,266 5,618 29,894 52,638 13.6 380
Cassava 113,022 23,144 66,169 159,875 20.5 1,196
Sweet potatoes 93,491 14,382 64,376 122,606 15.4 996
Irish potatoes 19,362 4,813 9,617 29,106 24.9 243
Banana 282,740 30,463 221,071 344,409 10.8 1,644
Banana beer 73,039 20,287 31,971 114,108 27.8 623
Banana sweet 12,570 2,007 8,508 16,632 16.0 263
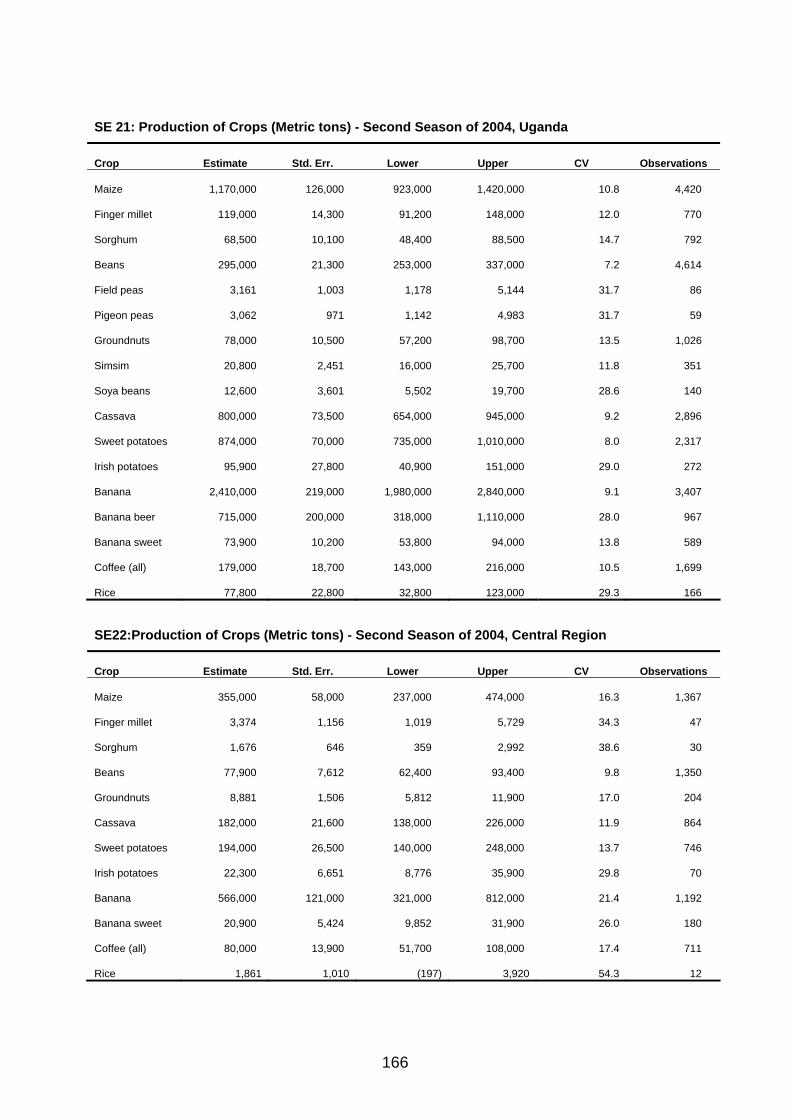
166
SE 21: Production of Crops (Metric tons) - Second Season of 2004, Uganda
Crop Estimate Std. Err. Lower Upper CV Observations
Maize 1,170,000 126,000 923,000 1,420,000 10.8 4,420
Finger millet 119,000 14,300 91,200 148,000 12.0 770
Sorghum 68,500 10,100 48,400 88,500 14.7 792
Beans 295,000 21,300 253,000 337,000 7.2 4,614
Field peas 3,161 1,003 1,178 5,144 31.7 86
Pigeon peas 3,062 971 1,142 4,983 31.7 59
Groundnuts 78,000 10,500 57,200 98,700 13.5 1,026
Simsim 20,800 2,451 16,000 25,700 11.8 351
Soya beans 12,600 3,601 5,502 19,700 28.6 140
Cassava 800,000 73,500 654,000 945,000 9.2 2,896
Sweet potatoes 874,000 70,000 735,000 1,010,000 8.0 2,317
Irish potatoes 95,900 27,800 40,900 151,000 29.0 272
Banana 2,410,000 219,000 1,980,000 2,840,000 9.1 3,407
Banana beer 715,000 200,000 318,000 1,110,000 28.0 967
Banana sweet 73,900 10,200 53,800 94,000 13.8 589
Coffee (all) 179,000 18,700 143,000 216,000 10.5 1,699
Rice 77,800 22,800 32,800 123,000 29.3 166 SE22:Production of Crops (Metric tons) - Second Season of 2004, Central Region
Crop Estimate Std. Err. Lower Upper CV Observations
Maize 355,000 58,000 237,000 474,000 16.3 1,367
Finger millet 3,374 1,156 1,019 5,729 34.3 47
Sorghum 1,676 646 359 2,992 38.6 30
Beans 77,900 7,612 62,400 93,400 9.8 1,350
Groundnuts 8,881 1,506 5,812 11,900 17.0 204
Cassava 182,000 21,600 138,000 226,000 11.9 864
Sweet potatoes 194,000 26,500 140,000 248,000 13.7 746
Irish potatoes 22,300 6,651 8,776 35,900 29.8 70
Banana 566,000 121,000 321,000 812,000 21.4 1,192
Banana sweet 20,900 5,424 9,852 31,900 26.0 180
Coffee (all) 80,000 13,900 51,700 108,000 17.4 711
Rice 1,861 1,010 (197) 3,920 54.3 12
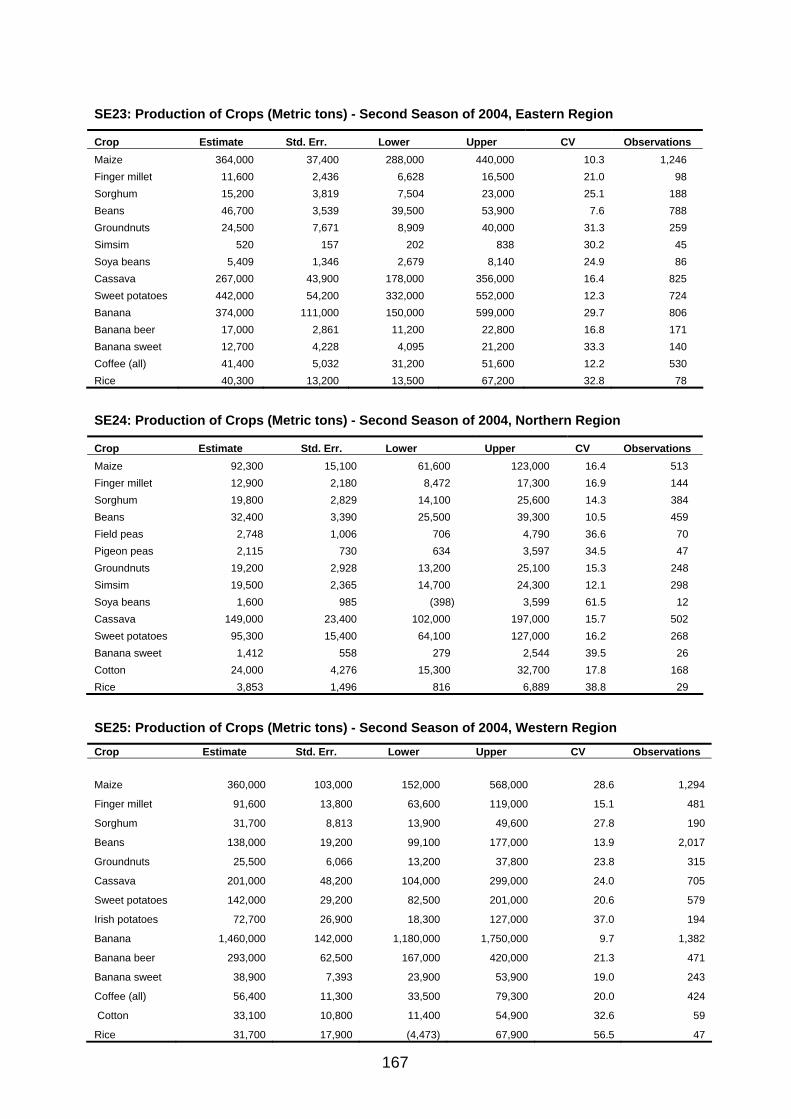
167
SE23: Production of Crops (Metric tons) - Second Season of 2004, Eastern Region
Crop Estimate Std. Err. Lower Upper CV Observations Maize 364,000 37,400 288,000 440,000 10.3 1,246 Finger millet 11,600 2,436 6,628 16,500 21.0 98 Sorghum 15,200 3,819 7,504 23,000 25.1 188 Beans 46,700 3,539 39,500 53,900 7.6 788 Groundnuts 24,500 7,671 8,909 40,000 31.3 259 Simsim 520 157 202 838 30.2 45 Soya beans 5,409 1,346 2,679 8,140 24.9 86 Cassava 267,000 43,900 178,000 356,000 16.4 825 Sweet potatoes 442,000 54,200 332,000 552,000 12.3 724 Banana 374,000 111,000 150,000 599,000 29.7 806 Banana beer 17,000 2,861 11,200 22,800 16.8 171 Banana sweet 12,700 4,228 4,095 21,200 33.3 140 Coffee (all) 41,400 5,032 31,200 51,600 12.2 530 Rice 40,300 13,200 13,500 67,200 32.8 78
SE24: Production of Crops (Metric tons) - Second Season of 2004, Northern Region
Crop Estimate Std. Err. Lower Upper CV Observations Maize 92,300 15,100 61,600 123,000 16.4 513 Finger millet 12,900 2,180 8,472 17,300 16.9 144 Sorghum 19,800 2,829 14,100 25,600 14.3 384 Beans 32,400 3,390 25,500 39,300 10.5 459 Field peas 2,748 1,006 706 4,790 36.6 70 Pigeon peas 2,115 730 634 3,597 34.5 47 Groundnuts 19,200 2,928 13,200 25,100 15.3 248 Simsim 19,500 2,365 14,700 24,300 12.1 298 Soya beans 1,600 985 (398) 3,599 61.5 12 Cassava 149,000 23,400 102,000 197,000 15.7 502 Sweet potatoes 95,300 15,400 64,100 127,000 16.2 268 Banana sweet 1,412 558 279 2,544 39.5 26 Cotton 24,000 4,276 15,300 32,700 17.8 168 Rice 3,853 1,496 816 6,889 38.8 29 SE25: Production of Crops (Metric tons) - Second Season of 2004, Western Region
Crop Estimate Std. Err. Lower Upper CV Observations
Maize 360,000 103,000 152,000 568,000 28.6 1,294
Finger millet 91,600 13,800 63,600 119,000 15.1 481
Sorghum 31,700 8,813 13,900 49,600 27.8 190
Beans 138,000 19,200 99,100 177,000 13.9 2,017
Groundnuts 25,500 6,066 13,200 37,800 23.8 315
Cassava 201,000 48,200 104,000 299,000 24.0 705
Sweet potatoes 142,000 29,200 82,500 201,000 20.6 579
Irish potatoes 72,700 26,900 18,300 127,000 37.0 194
Banana 1,460,000 142,000 1,180,000 1,750,000 9.7 1,382
Banana beer 293,000 62,500 167,000 420,000 21.3 471
Banana sweet 38,900 7,393 23,900 53,900 19.0 243
Coffee (all) 56,400 11,300 33,500 79,300 20.0 424
Cotton 33,100 10,800 11,400 54,900 32.6 59
Rice 31,700 17,900 (4,473) 67,900 56.5 47

168
SE 26: Production of Crops (Metric tons) - First Season of 2005, Uganda
Crop Estimate Std. Err. Lower Upper CV Observations
Maize 1,270,000 183,000 906,000 1,630,000 14.4 4,975
Finger millet 69,800 9,876 50,300 89,300 14.2 714
Sorghum 93,900 17,800 58,700 129,000 19.0 949
Beans 370,000 59,800 252,000 489,000 16.2 4,268
Field peas 1,434 481 484 2,384 33.5 57
Pigeon peas 5,925 922 4,102 7,749 15.6 173
Groundnuts 141,000 54,600 32,700 249,000 38.7 1,268
Simsim 5,905 1,139 3,653 8,157 19.3 165
Soya beans 7,275 1,468 4,372 10,200 20.2 133
Cassava 856,000 114,000 632,000 1,080,000 13.3 2,919
Sweet potatoes 822,000 52,000 719,000 924,000 6.3 2,675
Irish potatoes 58,700 17,000 25,200 92,200 29.0 251
Banana 1,770,000 128,000 1,510,000 2,020,000 7.2 3,550
Banana beer 334,000 52,100 231,000 436,000 15.6 929
Banana sweet 57,600 6,638 44,500 70,800 11.5 563
Coffee (all) 169,000 39,300 91,400 247,000 23.3 1,480
Rice 102,000 31,900 39,000 165,000 31.3 218
SE27: Production of Crops (Metric tons) - First Season of 2005, Central Region
Crop Estimate Std. Err. Lower Upper CV Observations Maize 204,000 30,400 142,000 266,000 14.9 1,257 Sorghum 1,719 447 809 2,629 26.0 42 Beans 78,400 17,200 43,300 113,000 21.9 1,168 Groundnuts 8,147 1,453 5,186 11,100 17.8 204 Cassava 169,000 15,800 137,000 201,000 9.4 802 Sweet potatoes 211,000 26,100 158,000 264,000 12.4 773 Irish potatoes 11,600 3,433 4,658 18,600 29.6 64 Banana 358,000 70,500 214,000 501,000 19.7 1,142 Banana beer 76,200 13,900 47,800 105,000 18.2 279 Banana sweet 14,100 2,637 8,745 19,500 18.7 181 Coffee (all) 80,100 37,400 3,832 156,000 46.7 568 Rice 3,232 2,291 (1,436) 7,899 70.9 16
SE28: Production of Crops (Metric tons) - First Season of 2005, Eastern Region
Crop Estimate Std. Err. Lower Upper CV Observations Maize 705,000 164,000 373,000 1,040,000 23.3 1,656 Finger millet 45,200 9,306 26,400 64,100 20.6 421 Sorghum 43,200 15,400 12,000 74,500 35.7 340 Groundnuts 34,600 8,590 17,100 52,000 24.8 425 Simsim 831 194 438 1,225 23.3 71 Soya beans 2,946 821 1,281 4,612 27.9 58 Cassava 323,000 104,000 113,000 533,000 32.2 816 Sweet potatoes 389,000 35,900 316,000 462,000 9.2 856 Banana 184,000 24,500 134,000 234,000 13.3 738 Banana beer 10,700 2,361 5,926 15,500 22.1 136 Banana sweet 6,010 1,190 3,596 8,424 19.8 100 Coffee (all) 28,300 4,042 20,100 36,500 14.3 474 Rice 91,100 30,700 28,900 153,000 33.7 136
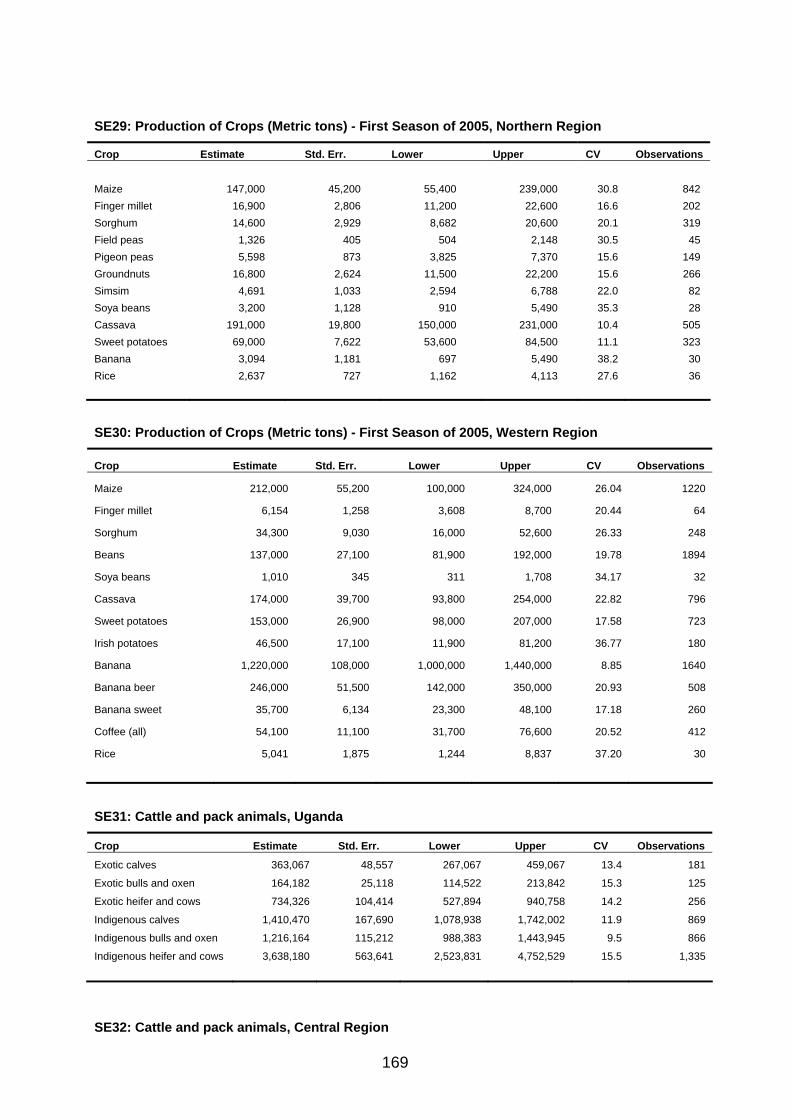
169
SE29: Production of Crops (Metric tons) - First Season of 2005, Northern Region
Crop Estimate Std. Err. Lower Upper CV Observations Maize 147,000 45,200 55,400 239,000 30.8 842 Finger millet 16,900 2,806 11,200 22,600 16.6 202 Sorghum 14,600 2,929 8,682 20,600 20.1 319 Field peas 1,326 405 504 2,148 30.5 45 Pigeon peas 5,598 873 3,825 7,370 15.6 149 Groundnuts 16,800 2,624 11,500 22,200 15.6 266 Simsim 4,691 1,033 2,594 6,788 22.0 82 Soya beans 3,200 1,128 910 5,490 35.3 28 Cassava 191,000 19,800 150,000 231,000 10.4 505 Sweet potatoes 69,000 7,622 53,600 84,500 11.1 323 Banana 3,094 1,181 697 5,490 38.2 30 Rice 2,637 727 1,162 4,113 27.6 36
SE30: Production of Crops (Metric tons) - First Season of 2005, Western Region
Crop Estimate Std. Err. Lower Upper CV Observations
Maize 212,000 55,200 100,000 324,000 26.04 1220
Finger millet 6,154 1,258 3,608 8,700 20.44 64
Sorghum 34,300 9,030 16,000 52,600 26.33 248
Beans 137,000 27,100 81,900 192,000 19.78 1894
Soya beans 1,010 345 311 1,708 34.17 32
Cassava 174,000 39,700 93,800 254,000 22.82 796
Sweet potatoes 153,000 26,900 98,000 207,000 17.58 723
Irish potatoes 46,500 17,100 11,900 81,200 36.77 180
Banana 1,220,000 108,000 1,000,000 1,440,000 8.85 1640
Banana beer 246,000 51,500 142,000 350,000 20.93 508
Banana sweet 35,700 6,134 23,300 48,100 17.18 260
Coffee (all) 54,100 11,100 31,700 76,600 20.52 412
Rice 5,041 1,875 1,244 8,837 37.20 30
SE31: Cattle and pack animals, Uganda
Crop Estimate Std. Err. Lower Upper CV Observations
Exotic calves 363,067 48,557 267,067 459,067 13.4 181
Exotic bulls and oxen 164,182 25,118 114,522 213,842 15.3 125
Exotic heifer and cows 734,326 104,414 527,894 940,758 14.2 256
Indigenous calves 1,410,470 167,690 1,078,938 1,742,002 11.9 869
Indigenous bulls and oxen 1,216,164 115,212 988,383 1,443,945 9.5 866
Indigenous heifer and cows 3,638,180 563,641 2,523,831 4,752,529 15.5 1,335
SE32: Cattle and pack animals, Central Region
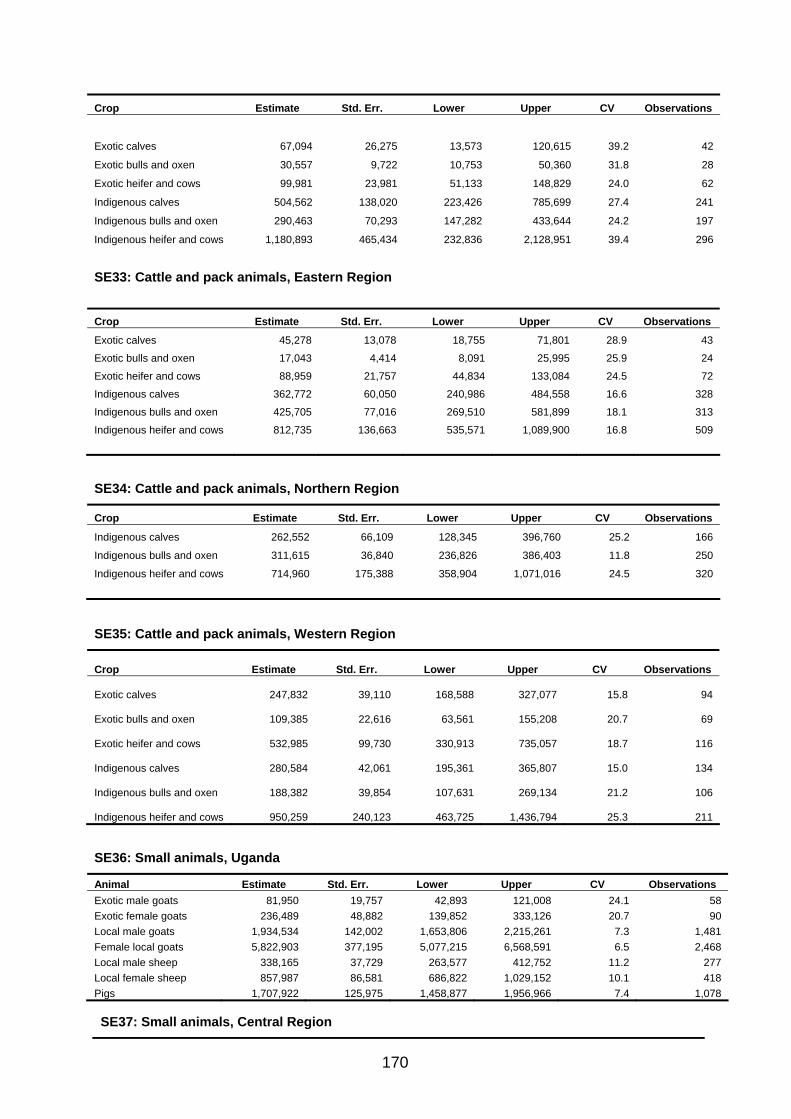
170
Crop Estimate Std. Err. Lower Upper CV Observations
Exotic calves 67,094 26,275 13,573 120,615 39.2 42
Exotic bulls and oxen 30,557 9,722 10,753 50,360 31.8 28
Exotic heifer and cows 99,981 23,981 51,133 148,829 24.0 62
Indigenous calves 504,562 138,020 223,426 785,699 27.4 241
Indigenous bulls and oxen 290,463 70,293 147,282 433,644 24.2 197
Indigenous heifer and cows 1,180,893 465,434 232,836 2,128,951 39.4 296
SE33: Cattle and pack animals, Eastern Region
Crop Estimate Std. Err. Lower Upper CV Observations
Exotic calves 45,278 13,078 18,755 71,801 28.9 43
Exotic bulls and oxen 17,043 4,414 8,091 25,995 25.9 24
Exotic heifer and cows 88,959 21,757 44,834 133,084 24.5 72
Indigenous calves 362,772 60,050 240,986 484,558 16.6 328
Indigenous bulls and oxen 425,705 77,016 269,510 581,899 18.1 313
Indigenous heifer and cows 812,735 136,663 535,571 1,089,900 16.8 509
SE34: Cattle and pack animals, Northern Region
Crop Estimate Std. Err. Lower Upper CV Observations
Indigenous calves 262,552 66,109 128,345 396,760 25.2 166
Indigenous bulls and oxen 311,615 36,840 236,826 386,403 11.8 250
Indigenous heifer and cows 714,960 175,388 358,904 1,071,016 24.5 320
SE35: Cattle and pack animals, Western Region
Crop Estimate Std. Err. Lower Upper CV Observations
Exotic calves 247,832 39,110 168,588 327,077 15.8 94
Exotic bulls and oxen 109,385 22,616 63,561 155,208 20.7 69
Exotic heifer and cows 532,985 99,730 330,913 735,057 18.7 116
Indigenous calves 280,584 42,061 195,361 365,807 15.0 134
Indigenous bulls and oxen 188,382 39,854 107,631 269,134 21.2 106
Indigenous heifer and cows 950,259 240,123 463,725 1,436,794 25.3 211
SE36: Small animals, Uganda
Animal Estimate Std. Err. Lower Upper CV Observations Exotic male goats 81,950 19,757 42,893 121,008 24.1 58 Exotic female goats 236,489 48,882 139,852 333,126 20.7 90 Local male goats 1,934,534 142,002 1,653,806 2,215,261 7.3 1,481 Female local goats 5,822,903 377,195 5,077,215 6,568,591 6.5 2,468 Local male sheep 338,165 37,729 263,577 412,752 11.2 277 Local female sheep 857,987 86,581 686,822 1,029,152 10.1 418 Pigs 1,707,922 125,975 1,458,877 1,956,966 7.4 1,078 SE37: Small animals, Central Region

171
Animal Estimate Std. Err. Lower Upper CV Observations
Exotic male goats
13,607
4,665
4,105
23,109 34.3 18
Exotic female goats
28,251
9,097
9,721
46,780 32.2 17
Local male goats
336,246
55,856
222,470
450,022 16.6 262
Female local goats
883,558
129,301
620,182
1,146,934 14.6 439
Local male sheep
41,333
11,222
18,474
64,192 27.2 43
Local female sheep
119,569
30,353
57,742
181,396 25.4 66
Pigs
835,296
75,927
680,638
989,954 9.1 475
SE38: Small animals, Eastern Region
Animal Estimate Std. Err. Lower Upper CV Observations Exotic male goats 13,154 4,634 3,755 22,552 35.2 15 Exotic female goats 41,965 9,578 22,539 61,390 22.8 27 Local male goats 426,823 56,616 312,001 541,646 13.3 415 Female local goats 1,220,530 154,256 907,685 1,533,376 12.6 724 Local male sheep 39,258 11,100 16,747 61,769 28.3 43 Local female sheep 105,478 31,664 41,259 169,696 30.0 67 Pigs 386,705 56,806 271,497 501,913 14.7 267
SE39: Small animals, Northern Region
Animal Estimate Std. Err. Lower Upper CV Observations Local male goats 584,582 68,372 445,780 723,385 11.7 430 Female local goats 1,582,168 206,231 1,163,498 2,000,838 13.0 627 Local male sheep 148,533 35,684 76,089 220,976 24.0 113 Local female sheep 363,668 89,740 181,485 545,851 24.7 149 Pigs 138,423 20,780 96,237 180,609 15.0 101
SE40: Small animals, Western Region
Animal Estimate Std. Err. Lower Upper CV Observations Exotic male goats 52,985 18,404 15,728 90,242 34.7 22 Exotic female goats 155,061 46,614 60,695 249,427 30.1 40 Local male goats 586,882 109,342 365,532 808,232 18.6 374 Female local goats 2,136,646 289,728 1,550,124 2,723,169 13.6 678 Local male sheep 109,041 25,907 56,596 161,486 23.8 78 Local female sheep 269,272 49,548 168,967 369,577 18.4 136 Pigs 347,498 77,364 190,884 504,113 22.3 235 SE41: Poultry and Others, Uganda
Poultry Estimate Std. Err. Lower Upper CV Observations
Rabbits 221,524 42,297 137,906 305,142 19.1 63
Backyard chicken 19,800,000 1,160,133 17,500,000 22,100,000 5.9 3,270
Layers 2,725,178 969,250 809,039 4,641,318 35.6 23
Turkeys 292,389 55,657 182,359 402,419 19.0 118
Ducks 815,401 105,590 606,658 1,024,144 13.0 266
Gees and other birds 259,848 48,782 163,409 356,288 18.8 64
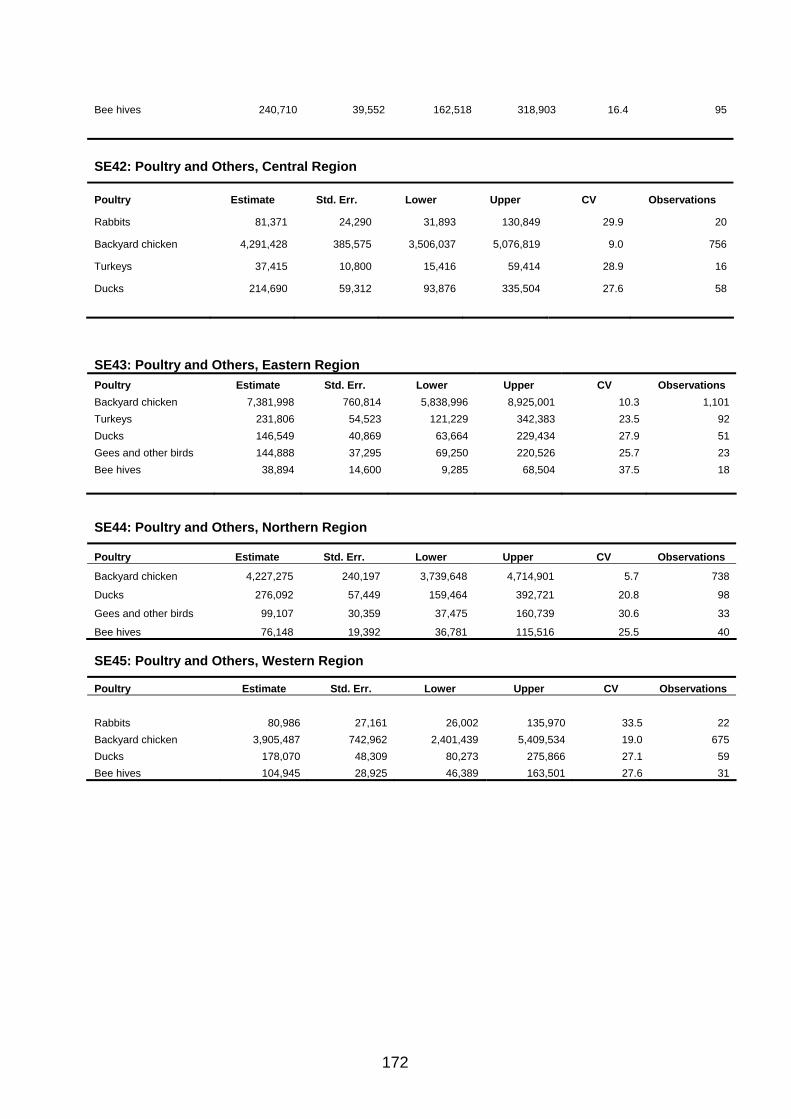
172
Bee hives 240,710 39,552 162,518 318,903 16.4 95
SE42: Poultry and Others, Central Region
Poultry Estimate Std. Err. Lower Upper CV Observations
Rabbits 81,371 24,290 31,893 130,849 29.9 20
Backyard chicken 4,291,428 385,575 3,506,037 5,076,819 9.0 756
Turkeys 37,415 10,800 15,416 59,414 28.9 16
Ducks 214,690 59,312 93,876 335,504 27.6 58
SE43: Poultry and Others, Eastern Region
Poultry Estimate Std. Err. Lower Upper CV Observations Backyard chicken 7,381,998 760,814 5,838,996 8,925,001 10.3 1,101 Turkeys 231,806 54,523 121,229 342,383 23.5 92 Ducks 146,549 40,869 63,664 229,434 27.9 51 Gees and other birds 144,888 37,295 69,250 220,526 25.7 23 Bee hives 38,894 14,600 9,285 68,504 37.5 18
SE44: Poultry and Others, Northern Region
Poultry Estimate Std. Err. Lower Upper CV Observations
Backyard chicken 4,227,275 240,197 3,739,648 4,714,901 5.7 738
Ducks 276,092 57,449 159,464 392,721 20.8 98
Gees and other birds 99,107 30,359 37,475 160,739 30.6 33
Bee hives 76,148 19,392 36,781 115,516 25.5 40 SE45: Poultry and Others, Western Region
Poultry Estimate Std. Err. Lower Upper CV Observations Rabbits 80,986 27,161 26,002 135,970 33.5 22 Backyard chicken 3,905,487 742,962 2,401,439 5,409,534 19.0 675 Ducks 178,070 48,309 80,273 275,866 27.1 59 Bee hives 104,945 28,925 46,389 163,501 27.6 31

173
Annex 3: Glossary of Agricultural Module Terms
Agricultural holding: This is an economic unit of agriculture production under single management
comprising of all livestock kept and all land used wholly or partly for agriculture purposes without
regard to title, legal form or size. There exists a one-to-one relationship between the Ag HHs and the
Agricultural Holdings.
Certificate: It refers to a written or a printed and signed document that specifies the registered
interests or claims against the right to own, use or occupy land or parcel. The document should be
issued by and registered with government authorities e.g. the commissioner for registration, the land
board or the recorder (the office registering land and giving certificates).
Certificate of customary ownership: Is given to any person or group of persons who own land
under a customary system to recognize and guarantee his/her interest in the land board. It states that
the customary rights on the land it refers to the person or the persons named on it. This certificate
gives the owner the rights to:
Rent the land or part of it for a limited period of time (leasing)
Allow a person to use the land or rent it for a limited period of time.
Give the land or part of it as security or guarantee for a debt or money borrowed.
Divide the land or part of it.
Sell the land or a portion of it if the certificate of customary ownership allows.
Give away the land by will.
Certificate of occupancy: Is a document issued to a tenant on land on which he/she is not the owner
or lessens. It clearly states the interests or claims of the tenant/occupant, a tenant with a certificate of
occupancy can:
Give away, sublet, give as security or create rights to another person to use the land and do
anything on the land.
Pass it on to other people such as spouse, children, relative or friend after his/her death but,
Before dealing with the land in any way, the tenant by occupancy will apply to the owner in a
standard asking for permission to be allowed to deal with the land.
Customary tenure: Is a traditional method of owning land .Each community has traditionally
developed a system of owning land. It may be owned either by the community, clan families or
individuals. Individuals can have ownership rights to land either of the above mentioned tenure
systems. Person who owns land under these systems, except customary tenure, is entitled to possess
a certificate of title. But a certificate of customary ownership is given is given to a person or a group of
persons who owned land under customary system. A detailed discussion and definitions of the
different forms of certificates is provided in the section that deals with land rights, certificates and
disputes. Land owned under these arrangements should be recorded in part A.

174
Certificate of title: refers to the written or a printed and signed document that is an official record of
an agreement concerning the ownership of land or parcel. It registers the right to own the land
.Interests that can be entered in the register of titles are free hold, lease and mailo ownership.
Customary ownership and occupancy of land belonging to someone else are not considered in the
registration of titles. The title gives the owner the right of using and developing the land for any
purpose, entering into any dealings(selling, renting and giving it out as security)allowing other people
to use it and giving away the land by will.
Disease control: refers to the eradication and control of livestock, poultry and other domesticated
animal
Exotic: Refers to livestock introduced in the country from abroad e.g. Holstein Friesian, jersey and
Guernsey.
Extension workers: These are individuals employed by the government or non-governmental
organizations who work as an agricultural development agents for contacting and demonstrating
improved farming methods to farmers. They are responsible for organising, disseminating, guiding
and introducing technical methods in agricultural production directly to farmers and for facilitating
farmers coming into contact with cultivation methods to promote agricultural production.
Farm management: refers to the operation and organization of the farm thus what farmers do to
manipulate resources and situation to achieve their goals, e.g. in Uganda, it may refer to the mixture
of crop diversification, rotation and introduction (where adequate water and soils are available) of
small vegetable gardens, fruit orchard sand forage production for livestock.
Free hold tenure: Is ownership of land for an unlimited period. It means that this person can pass on
this land to another person after one’s death. The owner of a freehold title has full powers to use and
do anything with the land as long as it’s not against the law.
Hired labour: Is labour input supplied by other persons other than the holding household members
and who are paid for their work either in cash or kind or both. The persons are hired for doing
agricultural work on the holding; they can be permanent or temporary.
Household: Group of people who had been eating their meals together for at least 6 months of the 12
months, preceding the interview, other categories of household members even though they had lived
less than 6 months in the past twelve months included:
Infants who were born less than 6 months old.
Newly married who had been living together for less than 6 months.
Students and seasonal workers who had been living in or as part of another household.
Other persons living together for less than 6 months but who were expected to live in the house
hold permanently (or for longer duration).
175
Another group considered was of farm workers and other such individuals who lived and took
meals with the household were to be identified as household members even though they
might not have been blood relatives with the household head.
The last consideration was that of persons who had lived in the household for more than 6 months
of the 12 months but had permanently left the household (divorced or dead) neither were nor
considered as members of the household. A household could be constituted of:
A man and his wife/wives and children, father/mother, nephew and other relatives or non
relatives
Single persons.
A couple or several couples with or without children.
Improved/cross: refers to livestock which are crosses of exotic and indigenous breed.
Improved individual and group marketing: refers to improvement in marketing systems and
opportunities for both farm produce and input. Support services can include the provision of market,
infrastructure, supply of market information and other advisory services on marketing at an individual
or group level.
Improved produce quality: refers to the practices that improve the quality of out put and hence
leading to increased sales and income for example the use of high quality or improved seeds.
Indigenous cattle: refers to livestock of local types e.g. the Ankole long horned cattle, Zebu, Nganda
type of cattle.
Land dispute: Is a disagreement over land rights, boundaries or users, a land dispute occurs where
the specific individuals or collective interests relating to land are in conflict.
Land owned: This is land area possessed by the household for which the household has title or
certificate of ownership. It also includes land, which the household can reasonably expect to
eventually possess title or certificate of ownership, and land, which has been operated for many years
by the same household without any other claims being made.
Leasehold tenure: Is a way of owning interest in land based on the agreement with the owner of the
land allowing another person to take possession and use the land to the exclusion of any one else for
a specified or limited period of time usually five, forty nine, ninety nine years.
Mailo tenure: This was created by the 1900 agreement. It is ownership of land formerly given to the
baganda chiefs mainly. It is similar to free hold system except that tenants on mailo land have security
of tenure.
Mixed stand: This describes different crops simultaneously grown on the same plot.
176
On-farm storage (post-harvest): refers to storage facilities between the maturity period and time of
final consumption so that the quality doesn’t deteriorate during the storage period and it is secure
against pests, disease and physical loss.
Pack Animal: A pack animal is a beast of burden used by humans as means of transporting
materials by attaching them so their weight bears on the animal's back e.g. mules, horses, camels,
elephants. The term may be applied to either an individual animal or a species so employed.
Parcel: It is a contagious piece of land with identical tenure and physical characteristics. It is entirely
surrounded by land with other tenure or physical characteristics or infrastructure examples include
roads, water, forest etc not forming part of the holding.
Plot: This is defined as a contagious piece of land within a parcel on which a specific crop or a crop
mixture is grown. A parcel may be made up of two or more plots.
Primary Land Use (PLU): describes the most important use to which the land (parcel) was put e.g. if
a parcel had both annual crops and perennial crops occupying 30% and 70% respectively during the
period under reference, then the PLU was perennial crops.
Pure stand: This is a crop cultivated in a crop plot. A pure stand can either be permanent or
temporary.
Reference period: you need to be careful with the reference period. The reference periods cover the
second cropping season of 2004(july-december2004) and first cropping of 2005(January-june2005).
Segment: There are three concepts that have been found useful in associating agriculture activity with area
frames.
(i) Open-segment
(ii) Closed-segment
(iii) Open-closed (or weighted) segment.
A segment: is a piece of land or area bonded by recognizable cadastral (natural) or man-made
features; e.g. roads, rivers, forests.
In the open-segment the farms headquarters located inside the segment boundaries are considered
a sampling unit. All agriculture activities are associated with headquarters regardless of whether the
activity is inside the segment boundaries.

177
The Closed-segment associates agriculture activity with the segment itself. It includes all that lies
inside the segment and excludes all that which does not.
The Weighted segment is a combination of the two in that agriculture activities associated with the
farms, any part of which lies within the segment is attributed to the segment according to the fraction
of farm areas that is inside the segment. The headquarters are inside the segment.
Closed segment is often used when data on characteristics of land is required, e.g. land areas, crop
area, yield, livestock and poultry numbers, number of trees etc. Generally the open segment is used
when collecting economic data e.g. income, prices, farm labour and wages etc., since these
characteristics mainly relate to the farm headquarters.
Soil fertility management: Refers to agricultural practices to improve and restore the productivity of
the soil. It includes practices such as crop rotation, application of crop residue, manuring,
incorporation of weeds, terraces etc.
Use rights: This refers to the case where the person has the right to use and benefit to the land
belonging to someone else as long as the land is not damaged in any way. Use rights mainly involve
arrangements between the tenant occupying or using the land and the owner of the land. The most
common types of tenants in Uganda are lawful and bonafide occupants on free hold, lease hold or
mailo land. The former refers to a person staying on land with the permission of the owner and
making some payments to the owner in return. The latter refers to the person who has stayed on and
used the land or improved the land for a minimum of 12 months without being challenged or asked to
leave by the owner before the date of 8th October 1995, these tenants are entitled to apply for
certificate of occupancy.
Individuals can also be given a license to occupy or use the land on short-term basis, say, for one
season by the owner of the land. For the purposes of this survey squatters are assumed to only have
one use right on the land they are occupying without the consent of the owner.
Therefore, information on land occupied under any of these arrangements should be collected in part
B.
The following table provides the link between different tenure regimes, ownership and use rights and
formal certificates.
Registerable interest Type of certificate Type of right
1 Mailo / Free hold /Lease hold Certificate of title Ownership right
2 customary Certificate of customary ownership Ownership right
3 Lawful/Bona fide occupant Certificate of occupancy Use/occupancy right
4 Short term rental/license None Use/occupancy right
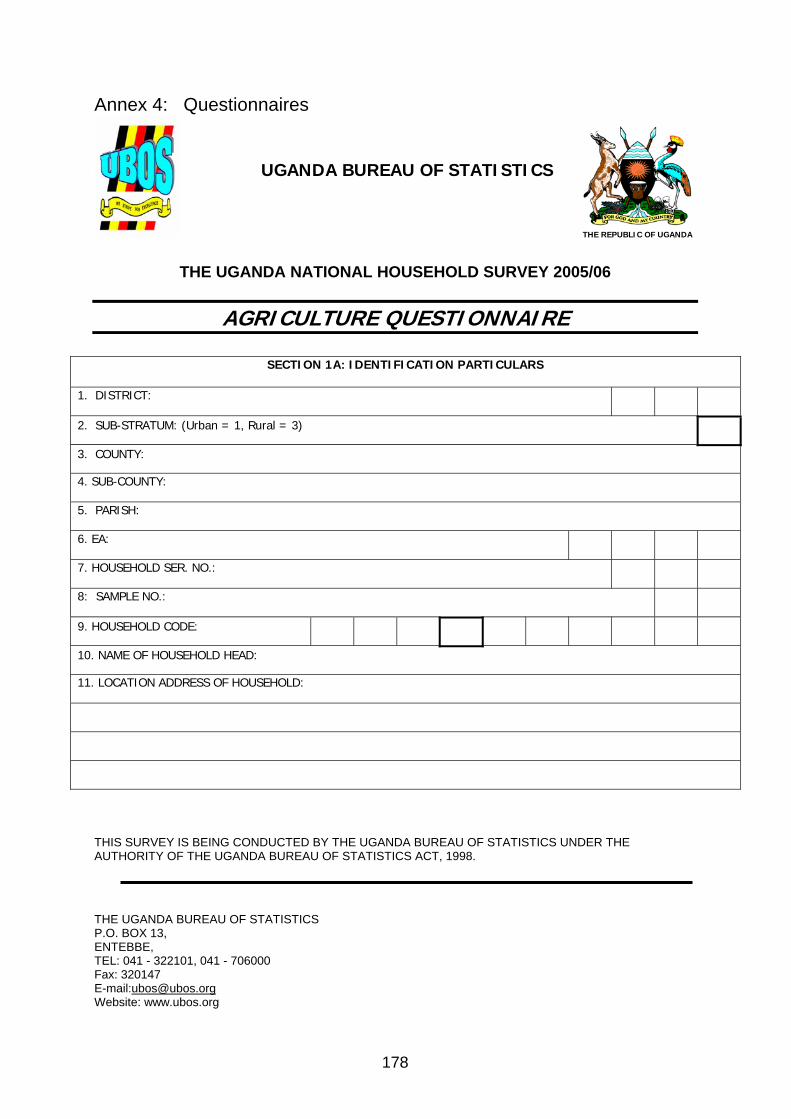
178
Annex 4: Questionnaires
UGANDA BUREAU OF STATISTICS
THE REPUBLIC OF UGANDA
THE UGANDA NATIONAL HOUSEHOLD SURVEY 2005/06
AGRICULTURE QUESTIONNAIRE
SECTION 1A: IDENTIFICATION PARTICULARS
1. DISTRICT:
2. SUB-STRATUM: (Urban = 1, Rural = 3)
3. COUNTY:
4. SUB-COUNTY:
5. PARISH:
6. EA:
7. HOUSEHOLD SER. NO.:
8: SAMPLE NO.:
9. HOUSEHOLD CODE:
10. NAME OF HOUSEHOLD HEAD:
11. LOCATION ADDRESS OF HOUSEHOLD:
THIS SURVEY IS BEING CONDUCTED BY THE UGANDA BUREAU OF STATISTICS UNDER THE AUTHORITY OF THE UGANDA BUREAU OF STATISTICS ACT, 1998.
THE UGANDA BUREAU OF STATISTICS P.O. BOX 13, ENTEBBE, TEL: 041 - 322101, 041 - 706000 Fax: 320147 E-mail:[email protected] Website: www.ubos.org
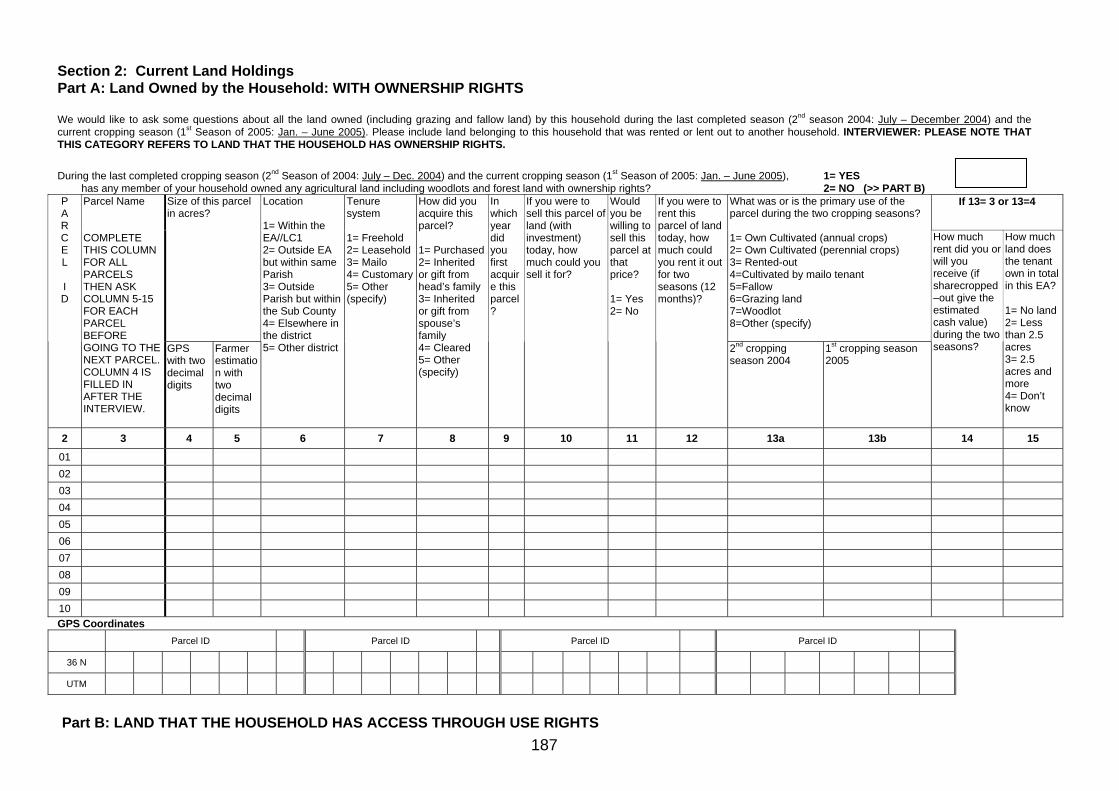
187
Section 2: Current Land Holdings Part A: Land Owned by the Household: WITH OWNERSHIP RIGHTS We would like to ask some questions about all the land owned (including grazing and fallow land) by this household during the last completed season (2nd season 2004: July – December 2004) and the current cropping season (1st Season of 2005: Jan. – June 2005). Please include land belonging to this household that was rented or lent out to another household. INTERVIEWER: PLEASE NOTE THAT THIS CATEGORY REFERS TO LAND THAT THE HOUSEHOLD HAS OWNERSHIP RIGHTS. During the last completed cropping season (2nd Season of 2004: July – Dec. 2004) and the current cropping season (1st Season of 2005: Jan. – June 2005), 1= YES
has any member of your household owned any agricultural land including woodlots and forest land with ownership rights? 2= NO (>> PART B) If 13= 3 or 13=4 Size of this parcel
in acres? What was or is the primary use of the parcel during the two cropping seasons?
1= Own Cultivated (annual crops) 2= Own Cultivated (perennial crops) 3= Rented-out 4=Cultivated by mailo tenant 5=Fallow 6=Grazing land 7=Woodlot 8=Other (specify)
P A R C E L I D
Parcel Name COMPLETE THIS COLUMN FOR ALL PARCELS THEN ASK COLUMN 5-15 FOR EACH PARCEL BEFORE GOING TO THE NEXT PARCEL. COLUMN 4 IS FILLED IN AFTER THE INTERVIEW.
GPS with two decimal digits
Farmer estimation with two decimal digits
Location 1= Within the EA//LC1 2= Outside EA but within same Parish 3= Outside Parish but within the Sub County 4= Elsewhere in the district 5= Other district
Tenure system
1= Freehold 2= Leasehold3= Mailo 4= Customary5= Other (specify)
How did you acquire this parcel?
1= Purchased2= Inherited or gift from head’s family 3= Inherited or gift from spouse’s family 4= Cleared 5= Other (specify)
In which year did you first acquire this parcel?
If you were to sell this parcel of land (with investment) today, how much could you sell it for?
Would you be willing to sell this parcel at that price? 1= Yes 2= No
If you were to rent this parcel of land today, how much could you rent it out for two seasons (12 months)?
2nd cropping season 2004
1st cropping season 2005
How much rent did you or will you receive (if sharecropped –out give the estimated cash value) during the two seasons?
How much land does the tenant own in total in this EA?
1= No land 2= Less than 2.5 acres 3= 2.5 acres and more 4= Don’t know
2 3 4 5 6 7 8 9 10 11 12 13a 13b 14 15
01
02
03
04
05
06
07
08
09
10 GPS Coordinates
Parcel ID Parcel ID Parcel ID Parcel ID
36 N
UTM
Part B: LAND THAT THE HOUSEHOLD HAS ACCESS THROUGH USE RIGHTS
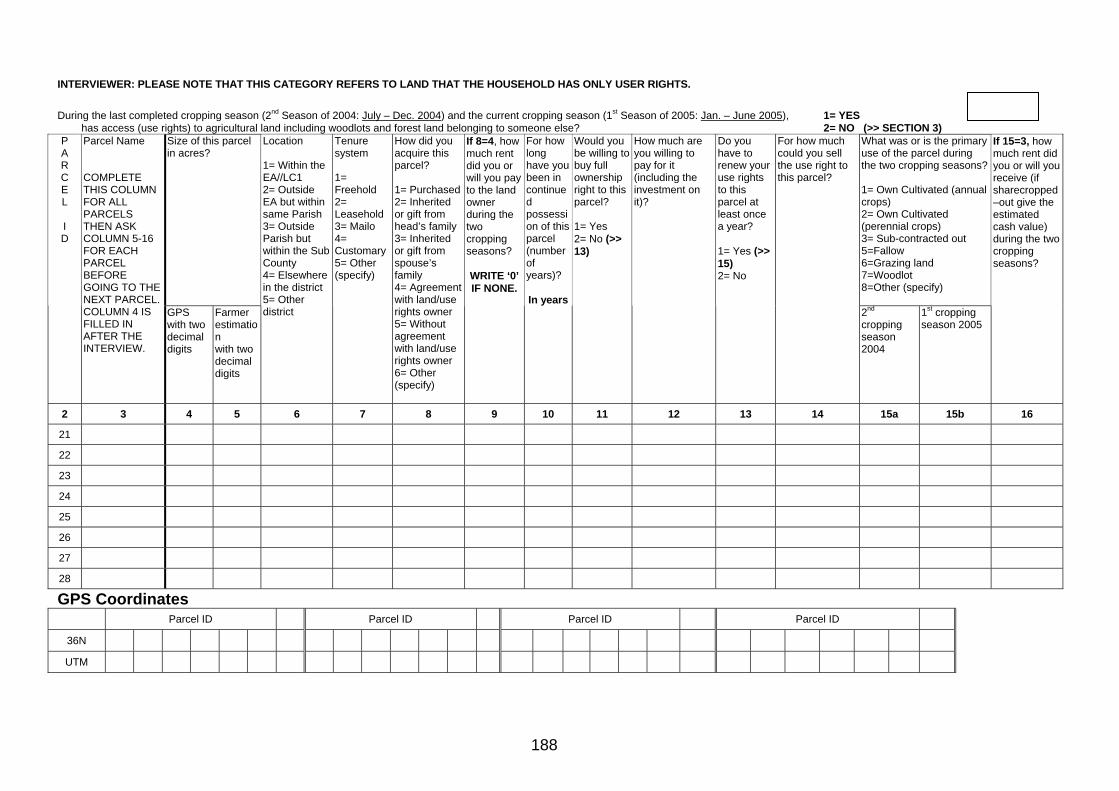
188
INTERVIEWER: PLEASE NOTE THAT THIS CATEGORY REFERS TO LAND THAT THE HOUSEHOLD HAS ONLY USER RIGHTS. During the last completed cropping season (2nd Season of 2004: July – Dec. 2004) and the current cropping season (1st Season of 2005: Jan. – June 2005), 1= YES
has access (use rights) to agricultural land including woodlots and forest land belonging to someone else? 2= NO (>> SECTION 3) Size of this parcel in acres?
What was or is the primary use of the parcel during the two cropping seasons?
1= Own Cultivated (annual crops) 2= Own Cultivated (perennial crops) 3= Sub-contracted out 5=Fallow 6=Grazing land 7=Woodlot 8=Other (specify)
P A R C E L I D
Parcel Name COMPLETE THIS COLUMN FOR ALL PARCELS THEN ASK COLUMN 5-16 FOR EACH PARCEL BEFORE GOING TO THE NEXT PARCEL. COLUMN 4 IS FILLED IN AFTER THE INTERVIEW.
GPS with two decimal digits
Farmer estimation with two decimal digits
Location 1= Within the EA//LC1 2= Outside EA but within same Parish 3= Outside Parish but within the Sub County 4= Elsewhere in the district 5= Other district
Tenure system 1= Freehold 2= Leasehold 3= Mailo 4= Customary 5= Other (specify)
How did you acquire this parcel?
1= Purchased2= Inherited or gift from head’s family 3= Inherited or gift from spouse’s family 4= Agreement with land/use rights owner 5= Without agreement with land/use rights owner 6= Other (specify)
If 8=4, how much rent did you or will you pay to the land owner during the two cropping seasons? WRITE ‘0’ IF NONE.
For how long have you been in continued possession of this parcel (number of years)? In years
Would you be willing to buy full ownership right to this parcel? 1= Yes 2= No (>> 13)
How much are you willing to pay for it (including the investment on it)?
Do you have to renew your use rights to this parcel at least once a year? 1= Yes (>> 15) 2= No
For how much could you sell the use right to this parcel?
2nd cropping season 2004
1st cropping season 2005
If 15=3, how much rent did you or will you receive (if sharecropped –out give the estimated cash value) during the two cropping seasons?
2 3 4 5 6 7 8 9 10 11 12 13 14 15a 15b 16
21
22
23
24
25
26
27
28
GPS Coordinates Parcel ID Parcel ID Parcel ID Parcel ID
36N
UTM

189
Section 3: Investments on Land
Ask the following questions on every single parcel that the respondent household has access to (owned and/or operated). All the parcels in Section 2 Part A and B.
Do/did you practice […] soil and water conservation on this parcel now and 5 years ago (ending March 2001)?
What kind of tree crops does this parcel have? Give details up to three (main trees).
TREE CODE 1= Trees for fruit or timber 2= Trees to improve soil fertility 3= Trees for boundary demarcation 4= Robusta coffee (indigenous) 5= Arabica coffee (indigenous) 6= Clonal coffee 7= Other (specify)
Bunds (soil, stone or grass)
Terracing Mulching Tree 1 Tree 2 Tree 3
P A R C E L I D
Now 1=Yes 2=No
5 yrs ago 1=Yes 2=No
Now 1=Yes2=No
5 yrs ago 1=Yes 2=No
Now 1=Yes 2=No
5 Yrs Ago 1=Yes 2=No
Have you ever left part of this parcel fallow during the past 5 years? 1= Yes 2= No (>> 10)
How long this parcel has been fallow during the past 5 years? (Cumulated
Months)
Does this parcel have a fence around it? 1= Yes 2= No
Does this parcel have any trees or perennials? 1= Yes 2= No (>> NEXT PARCEL)
Code How many did you plant since March 2001?
No. of trees now
Code How many did you plant since March 2001?
No. of trees now
Code How many did you plant since March 2001?
No. of trees now
1 2 3 4 5 6 7 8 9 10 11 12 13 14 15 16 17 18 19 20
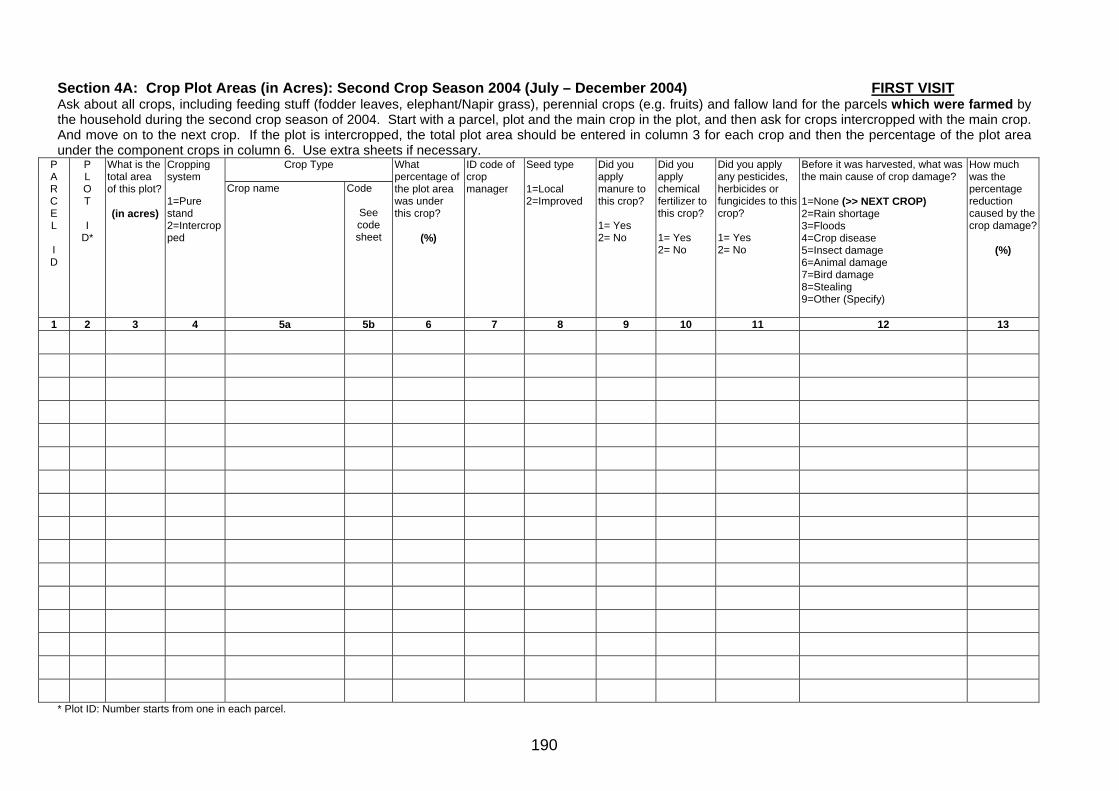
190
Section 4A: Crop Plot Areas (in Acres): Second Crop Season 2004 (July – December 2004) FIRST VISIT Ask about all crops, including feeding stuff (fodder leaves, elephant/Napir grass), perennial crops (e.g. fruits) and fallow land for the parcels which were farmed by the household during the second crop season of 2004. Start with a parcel, plot and the main crop in the plot, and then ask for crops intercropped with the main crop. And move on to the next crop. If the plot is intercropped, the total plot area should be entered in column 3 for each crop and then the percentage of the plot area under the component crops in column 6. Use extra sheets if necessary.
Crop Type P A R C E L I D
P L O T I
D*
What is the total area of this plot? (in acres)
Cropping system 1=Pure stand 2=Intercropped
Crop name Code
See code sheet
What percentage of the plot area was under this crop?
(%)
ID code of crop manager
Seed type 1=Local 2=Improved
Did you apply manure to this crop? 1= Yes 2= No
Did you apply chemical fertilizer to this crop? 1= Yes 2= No
Did you apply any pesticides, herbicides or fungicides to this crop? 1= Yes 2= No
Before it was harvested, what was the main cause of crop damage? 1=None (>> NEXT CROP) 2=Rain shortage 3=Floods 4=Crop disease 5=Insect damage 6=Animal damage 7=Bird damage 8=Stealing 9=Other (Specify)
How much was the percentage reduction caused by the crop damage?
(%)
1 2 3 4 5a 5b 6 7 8 9 10 11 12 13
* Plot ID: Number starts from one in each parcel.
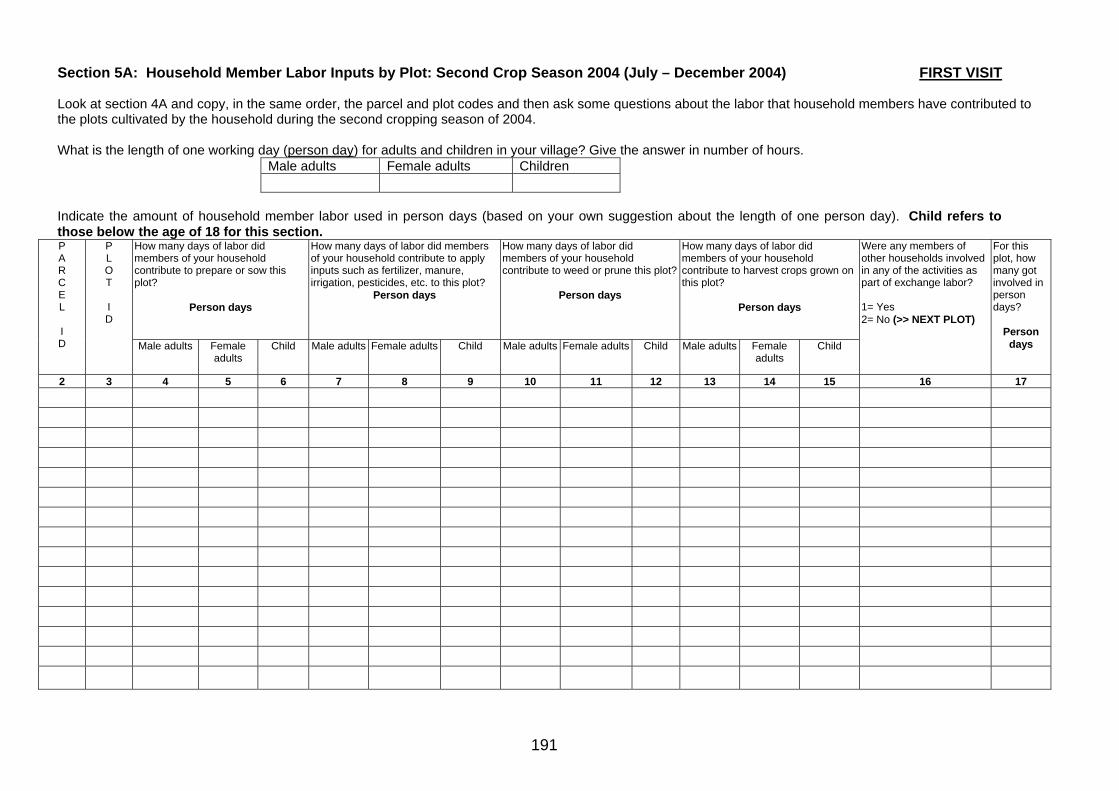
191
Section 5A: Household Member Labor Inputs by Plot: Second Crop Season 2004 (July – December 2004) FIRST VISIT Look at section 4A and copy, in the same order, the parcel and plot codes and then ask some questions about the labor that household members have contributed to the plots cultivated by the household during the second cropping season of 2004. What is the length of one working day (person day) for adults and children in your village? Give the answer in number of hours.
Male adults Female adults Children
Indicate the amount of household member labor used in person days (based on your own suggestion about the length of one person day). Child refers to those below the age of 18 for this section.
How many days of labor did members of your household contribute to prepare or sow this plot?
Person days
How many days of labor did members of your household contribute to apply inputs such as fertilizer, manure, irrigation, pesticides, etc. to this plot?
Person days
How many days of labor did members of your household contribute to weed or prune this plot?
Person days
How many days of labor did members of your household contribute to harvest crops grown on this plot?
Person days
P A R C E L I D
P L O T I D
Male adults Female adults
Child Male adults Female adults Child Male adults Female adults Child Male adults Female adults
Child
Were any members of other households involved in any of the activities as part of exchange labor? 1= Yes 2= No (>> NEXT PLOT)
For this plot, how many got involved in person days?
Person days
2 3 4 5 6 7 8 9 10 11 12 13 14 15 16 17
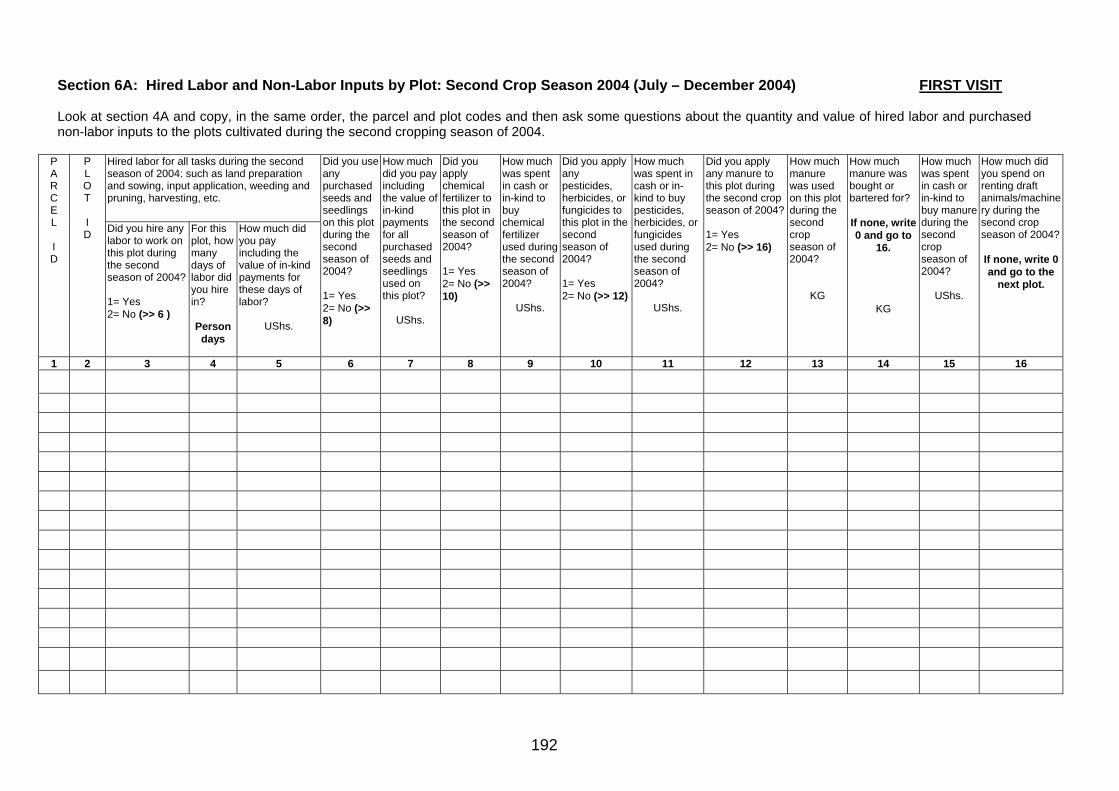
192
Section 6A: Hired Labor and Non-Labor Inputs by Plot: Second Crop Season 2004 (July – December 2004) FIRST VISIT Look at section 4A and copy, in the same order, the parcel and plot codes and then ask some questions about the quantity and value of hired labor and purchased non-labor inputs to the plots cultivated during the second cropping season of 2004.
Hired labor for all tasks during the second season of 2004: such as land preparation and sowing, input application, weeding and pruning, harvesting, etc.
P A R C E L I D
P L O T I D Did you hire any
labor to work on this plot during the second season of 2004? 1= Yes 2= No (>> 6 )
For this plot, how many days of labor did you hire in? Person
days
How much did you pay including the value of in-kind payments for these days of labor?
UShs.
Did you use any purchased seeds and seedlings on this plot during the second season of 2004? 1= Yes 2= No (>> 8)
How much did you pay including the value of in-kind payments for all purchased seeds and seedlings used on this plot?
UShs.
Did you apply chemical fertilizer to this plot in the second season of 2004? 1= Yes 2= No (>> 10)
How much was spent in cash or in-kind to buy chemical fertilizer used during the second season of 2004?
UShs.
Did you apply any pesticides, herbicides, or fungicides to this plot in the second season of 2004? 1= Yes 2= No (>> 12)
How much was spent in cash or in-kind to buy pesticides, herbicides, or fungicides used during the second season of 2004?
UShs.
Did you apply any manure to this plot during the second crop season of 2004? 1= Yes 2= No (>> 16)
How much manure was used on this plot during the second crop season of 2004?
KG
How much manure was bought or bartered for? If none, write 0 and go to
16.
KG
How much was spent in cash or in-kind to buy manure during the second crop season of 2004?
UShs.
How much did you spend on renting draft animals/machinery during the second crop season of 2004? If none, write 0 and go to the
next plot.
1 2 3 4 5 6 7 8 9 10 11 12 13 14 15 16
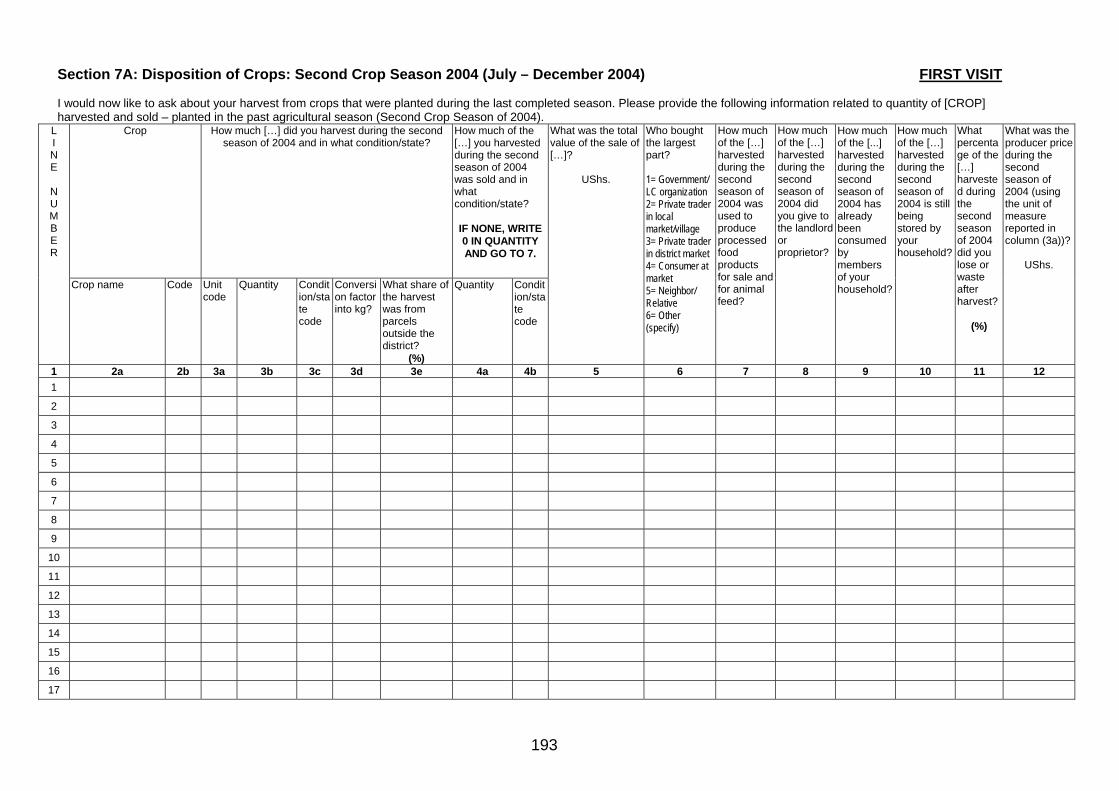
193
Section 7A: Disposition of Crops: Second Crop Season 2004 (July – December 2004) FIRST VISIT I would now like to ask about your harvest from crops that were planted during the last completed season. Please provide the following information related to quantity of [CROP] harvested and sold – planted in the past agricultural season (Second Crop Season of 2004).
Crop How much […] did you harvest during the second season of 2004 and in what condition/state?
How much of the […] you harvested during the second season of 2004 was sold and in what condition/state? IF NONE, WRITE 0 IN QUANTITY AND GO TO 7.
L I N E
N U M B E R
Crop name Code
Unit code
Quantity
Condition/state code
Conversion factor into kg?
What share of the harvest was from parcels outside the district?
(%)
Quantity Condition/state code
What was the total value of the sale of […]?
UShs.
Who bought the largest part? 1= Government/ LC organization 2= Private trader in local market/village 3= Private trader in district market 4= Consumer at market 5= Neighbor/ Relative 6= Other (specify)
How much of the […] harvested during the second season of 2004 was used to produce processed food products for sale and for animal feed?
How much of the […] harvested during the second season of 2004 did you give to the landlord or proprietor?
How much of the [...] harvested during the second season of 2004 has already been consumed by members of your household?
How much of the […] harvested during the second season of 2004 is still being stored by your household?
What percentage of the […] harvested during the second season of 2004 did you lose or waste after harvest?
(%)
What was the producer price during the second season of 2004 (using the unit of measure reported in column (3a))?
UShs.
1 2a 2b 3a 3b 3c 3d 3e 4a 4b 5 6 7 8 9 10 11 12 1
2
3
4
5
6
7
8
9
10
11
12
13
14
15
16
17
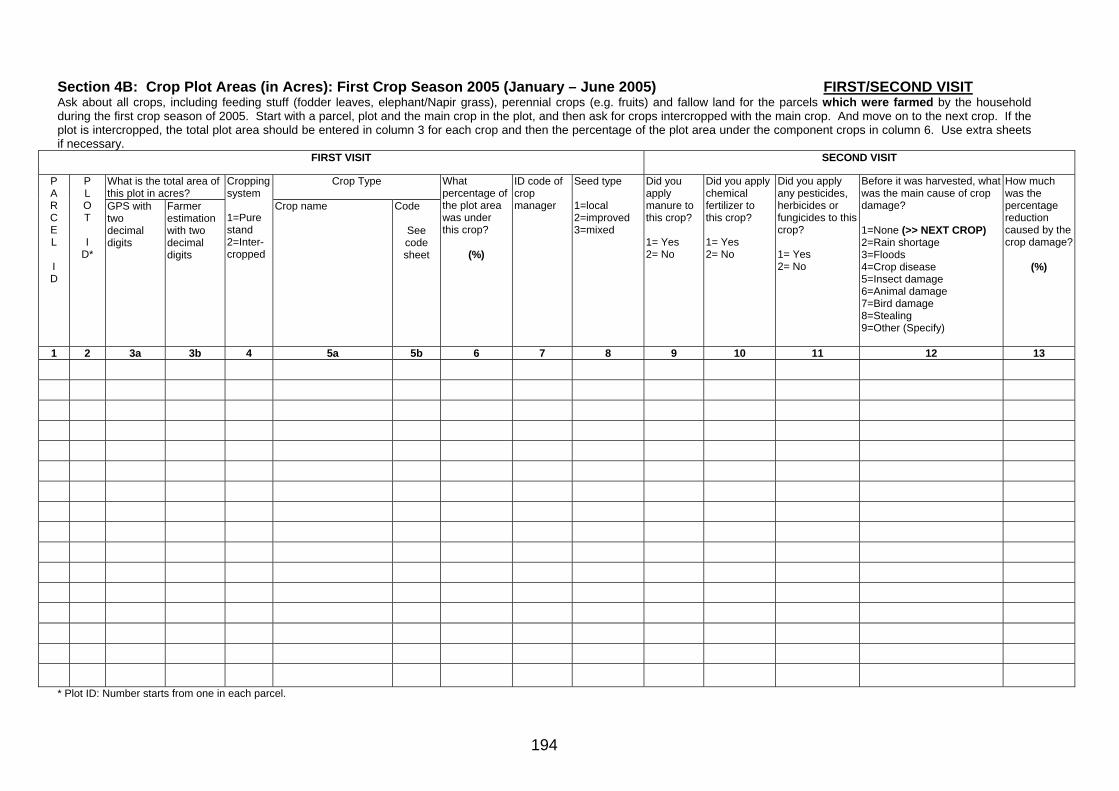
194
Section 4B: Crop Plot Areas (in Acres): First Crop Season 2005 (January – June 2005) FIRST/SECOND VISIT Ask about all crops, including feeding stuff (fodder leaves, elephant/Napir grass), perennial crops (e.g. fruits) and fallow land for the parcels which were farmed by the household during the first crop season of 2005. Start with a parcel, plot and the main crop in the plot, and then ask for crops intercropped with the main crop. And move on to the next crop. If the plot is intercropped, the total plot area should be entered in column 3 for each crop and then the percentage of the plot area under the component crops in column 6. Use extra sheets if necessary.
FIRST VISIT SECOND VISIT
What is the total area of this plot in acres?
Crop Type P A R C E L I D
P L O T I
D*
GPS with two decimal digits
Farmer estimation with two decimal digits
Cropping system 1=Pure stand 2=Inter-cropped
Crop name Code
See code sheet
What percentage of the plot area was under this crop?
(%)
ID code of crop manager
Seed type 1=local 2=improved 3=mixed
Did you apply manure to this crop? 1= Yes 2= No
Did you apply chemical fertilizer to this crop? 1= Yes 2= No
Did you apply any pesticides, herbicides or fungicides to this crop? 1= Yes 2= No
Before it was harvested, what was the main cause of crop damage? 1=None (>> NEXT CROP) 2=Rain shortage 3=Floods 4=Crop disease 5=Insect damage 6=Animal damage 7=Bird damage 8=Stealing 9=Other (Specify)
How much was the percentage reduction caused by the crop damage?
(%)
1 2 3a 3b 4 5a 5b 6 7 8 9 10 11 12 13
* Plot ID: Number starts from one in each parcel.
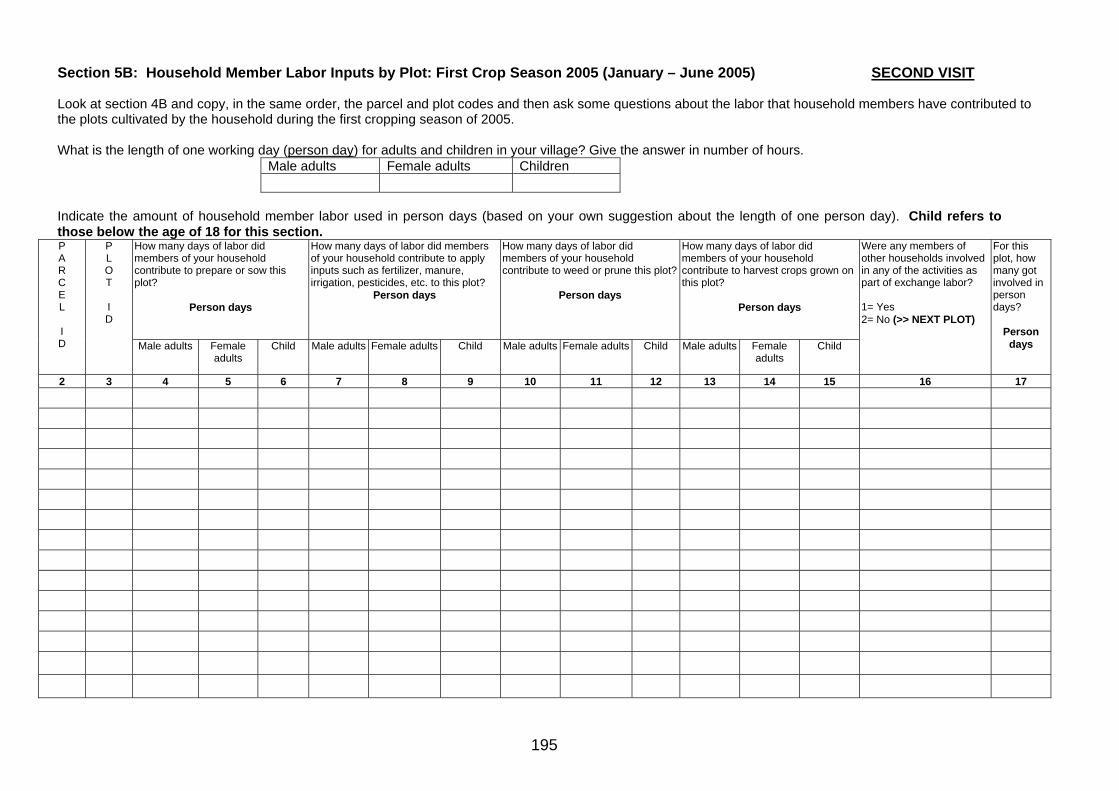
195
Section 5B: Household Member Labor Inputs by Plot: First Crop Season 2005 (January – June 2005) SECOND VISIT Look at section 4B and copy, in the same order, the parcel and plot codes and then ask some questions about the labor that household members have contributed to the plots cultivated by the household during the first cropping season of 2005. What is the length of one working day (person day) for adults and children in your village? Give the answer in number of hours.
Male adults Female adults Children
Indicate the amount of household member labor used in person days (based on your own suggestion about the length of one person day). Child refers to those below the age of 18 for this section.
How many days of labor did members of your household contribute to prepare or sow this plot?
Person days
How many days of labor did members of your household contribute to apply inputs such as fertilizer, manure, irrigation, pesticides, etc. to this plot?
Person days
How many days of labor did members of your household contribute to weed or prune this plot?
Person days
How many days of labor did members of your household contribute to harvest crops grown on this plot?
Person days
P A R C E L I D
P L O T I D
Male adults Female adults
Child Male adults Female adults Child Male adults Female adults Child Male adults Female adults
Child
Were any members of other households involved in any of the activities as part of exchange labor? 1= Yes 2= No (>> NEXT PLOT)
For this plot, how many got involved in person days?
Person days
2 3 4 5 6 7 8 9 10 11 12 13 14 15 16 17

196
Section 6B: Hired Labor and Non-Labor Inputs by Plot: First Crop Season 2005 (January – June 2005) SECOND VISIT Look at section 4B and copy, in the same order, the parcel and plot codes and then ask some questions about the quantity and value of hired labor and purchased non-labor inputs to the plots cultivated during the first cropping season of 2005.
Hired labor for all tasks during the first season of 2005: such as land preparation and sowing, input application, weeding and pruning, harvesting, etc.
P A R C E L I D
P L O T I D Did you hire any
labor to work on this plot during the first season of 2005? 1= Yes 2= No (>> 6 )
For this plot, how many days of labor did you hire in? Person
days
How much did you pay including the value of in-kind payments for these days of labor?
UShs.
Did you use any purchased seeds and seedlings on this plot during the first season of 2005? 1= Yes 2= No (>> 8)
How much did you pay including the value of in-kind payments for all purchased seeds and seedlings used on this plot?
UShs.
Did you apply chemical fertilizer to this plot in the first season of 2005? 1= Yes 2= No (>> 10)
How much was spent in cash or in-kind to buy chemical fertilizer used during the first season of 2005?
UShs.
Did you apply any pesticides, herbicides, or fungicides to this plot in the first season of 2005? 1= Yes 2= No (>> 12)
How much was spent in cash or in-kind to buy pesticides, herbicides, or fungicides used during the first season of 2005?
UShs.
Did you apply any manure to this plot during the first crop season of 2005? 1= Yes 2= No (>> 16)
How much manure was used on this plot during the first crop season of 2005?
KG
How much manure was bought or bartered for? If none, write 0 and go to
16.
KG
How much was spent in cash or in-kind to buy manure during the first crop season of 2005?
UShs.
How much did you spend on renting draft animals/machinery during the first crop season of 2005? If none, write 0 and go to the
next plot.
1 2 3 4 5 6 7 8 9 10 11 12 13 14 15 16

197
Section 7B: Disposition of Crops: First Crop Season 2005 (January – June 2005) SECOND VISIT I would now like to ask about your harvest from crops planted during the last completed season. Please provide the following information related to quantity of [CROP] harvested and sold – planted in the past agricultural season (First Crop Season of 2005).
Crop How much […] did you harvest during the first season of 2005 and in what condition/state?
How much of the […] you harvested during the first season of 2005 was sold and in what condition/state? IF NONE, WRITE 0 IN QUANTITY AND GO TO 7.
L I N E
N U M B E R
Crop name Code
Unit code
Quantity
Condition/state code
Conversion factor into kg?
What share of the harvest was from parcels outside the district?
(%)
Quantity Condition/state code
What was the total value of the sale of […]?
UShs.
Who bought the largest part? 1= Government/ LC organization 2= Private trader in local market/village 3= Private trader in district market 4= Consumer at market 5= Neighbor/ Relative 6= Other (specify)
How much of the […] harvested during the first season of 2005 was used to produce processed food products for sale and for animal feed?
How much of the […] harvested during the first season of 2005 did you give to the landlord or proprietor?
How much of the [...] harvested during the first season of 2005 has already been consumed by members of your household?
How much of the […] harvested during the first season of 2005 is still being stored by your household?
What percentage of the […] harvested during the first season of 2005 did you lose or waste after harvest?
(%)
What was the producer price during the first season of 2005 (using the unit of measure reported in column (3a))?
UShs.
1 2a 2b 3a 3b 3c 3d 3e 4a 4b 5 6 7 8 9 10 11 12 1
2
3
4
5
6
7
8
9
10
11
12
13
14
15
16
17
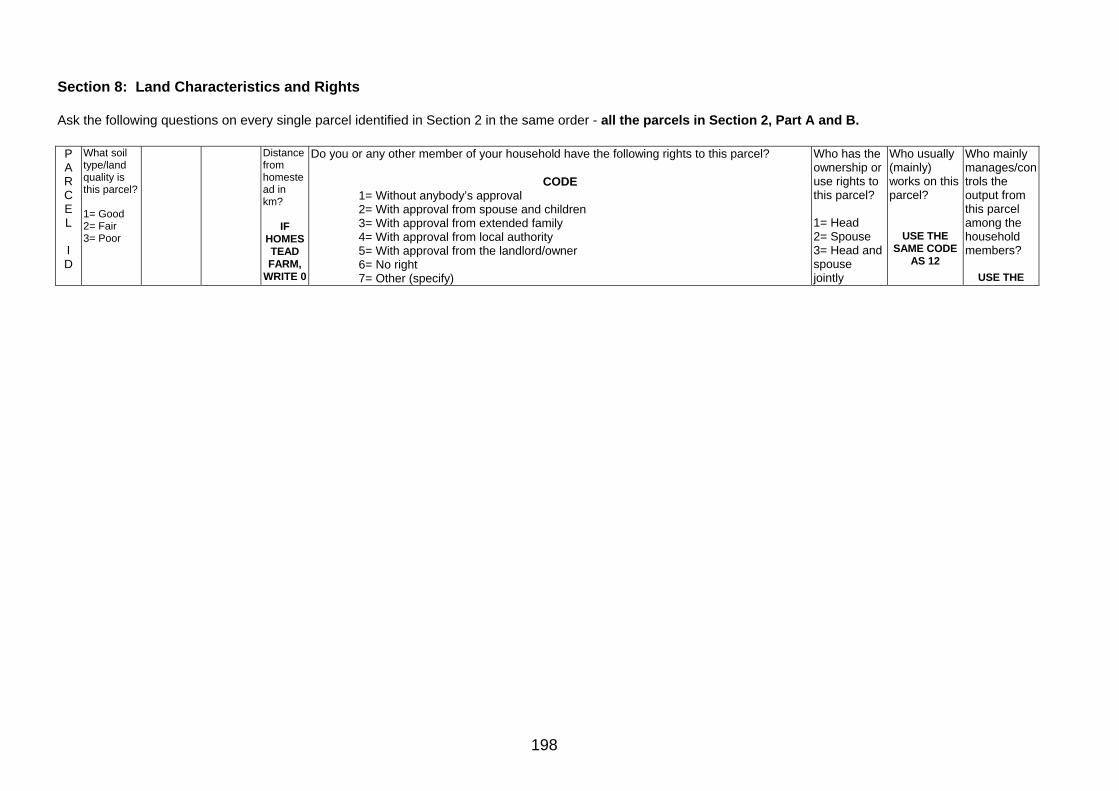
198
Section 8: Land Characteristics and Rights Ask the following questions on every single parcel identified in Section 2 in the same order - all the parcels in Section 2, Part A and B.
P A R C E L I D
What soil type/land quality is this parcel?
1= Good 2= Fair 3= Poor
Distance from homestead in km?
IF HOMESTEAD FARM,
WRITE 0
Do you or any other member of your household have the following rights to this parcel?
CODE 1= Without anybody’s approval 2= With approval from spouse and children 3= With approval from extended family 4= With approval from local authority 5= With approval from the landlord/owner 6= No right 7= Other (specify)
Who has the ownership or use rights to this parcel? 1= Head 2= Spouse 3= Head and spouse jointly
Who usually (mainly) works on this parcel?
USE THE SAME CODE
AS 12
Who mainly manages/controls the output from this parcel among the household members?
USE THE

199
To sell ownership or use rights?
To bequeath ownership or use rights?
To rent it to someone else?
To plant tree crops?
To use it as a loan security?
If code 6, skip go to
12
How much money (in U. Shs.) can you borrow using this parcel as a loan security?
4= Other household members 5= Other
SAME CODE AS 12

200
1 4 5 6 7 8 9 10 11 12 13 14
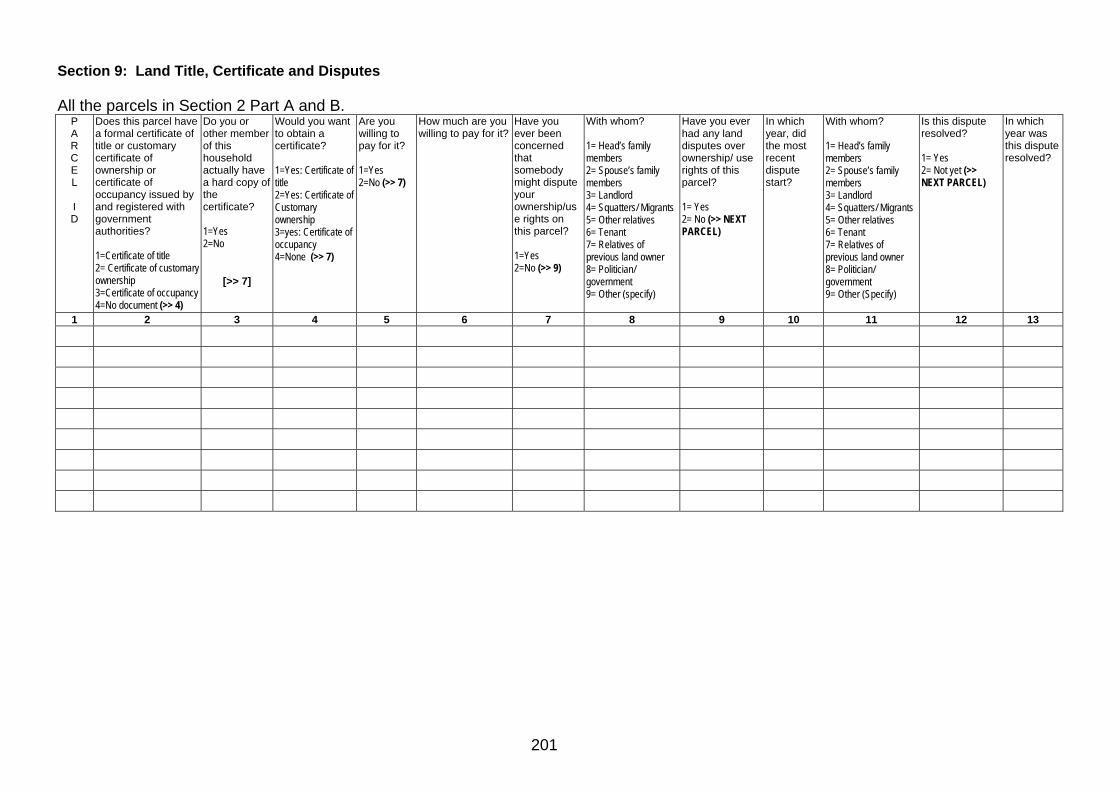
201
Section 9: Land Title, Certificate and Disputes All the parcels in Section 2 Part A and B.
P A R C E L I D
Does this parcel have a formal certificate of title or customary certificate of ownership or certificate of occupancy issued by and registered with government authorities? 1=Certificate of title 2= Certificate of customary ownership 3=Certificate of occupancy 4=No document (>> 4)
Do you or other member of this household actually have a hard copy of the certificate? 1=Yes 2=No
[>> 7]
Would you want to obtain a certificate? 1=Yes: Certificate of title 2=Yes: Certificate of Customary ownership 3=yes: Certificate of occupancy 4=None (>> 7)
Are you willing to pay for it? 1=Yes 2=No (>> 7)
How much are you willing to pay for it?
Have you ever been concerned that somebody might dispute your ownership/use rights on this parcel? 1=Yes 2=No (>> 9)
With whom? 1= Head’s family members 2= Spouse’s family members 3= Landlord 4= Squatters/ Migrants 5= Other relatives 6= Tenant 7= Relatives of previous land owner 8= Politician/ government 9= Other (specify)
Have you ever had any land disputes over ownership/ use rights of this parcel? 1= Yes 2= No (>> NEXT PARCEL)
In which year, did the most recent dispute start?
With whom? 1= Head’s family members 2= Spouse’s family members 3= Landlord 4= Squatters/ Migrants 5= Other relatives 6= Tenant 7= Relatives of previous land owner 8= Politician/ government 9= Other (Specify)
Is this dispute resolved? 1= Yes 2= Not yet (>> NEXT PARCEL)
In which year was this dispute resolved?
1 2 3 4 5 6 7 8 9 10 11 12 13
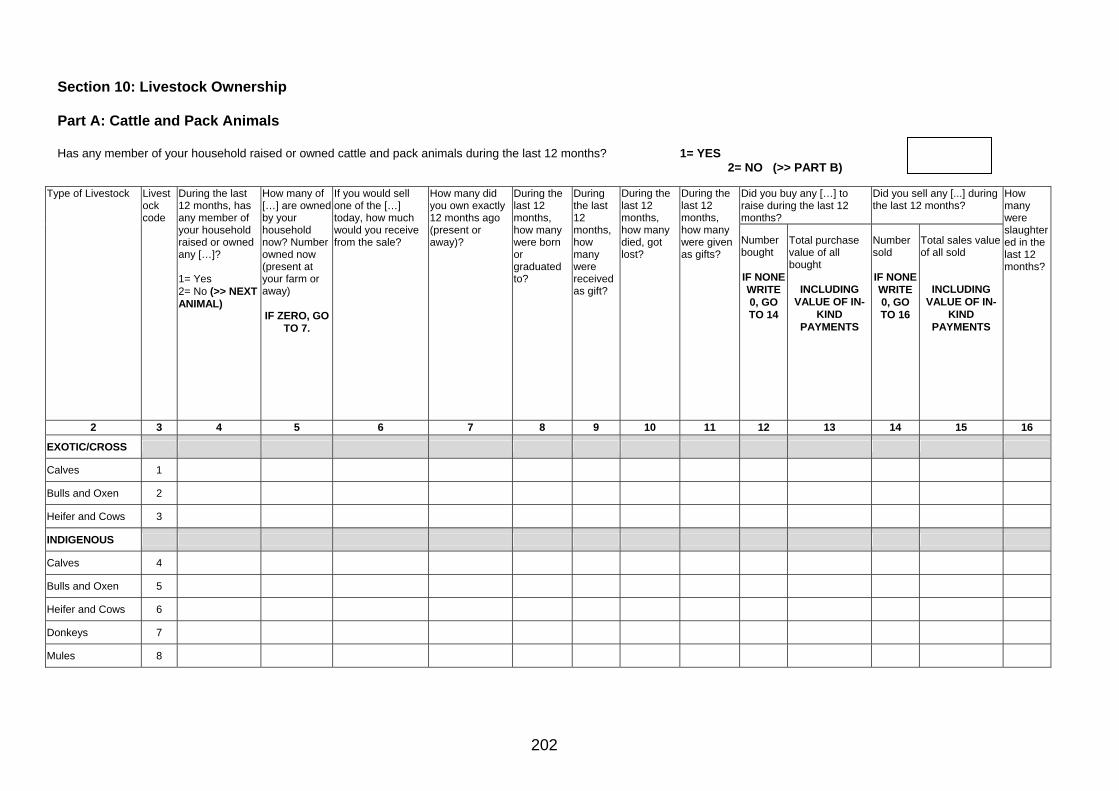
202
Section 10: Livestock Ownership Part A: Cattle and Pack Animals Has any member of your household raised or owned cattle and pack animals during the last 12 months? 1= YES
2= NO (>> PART B)
Did you buy any […] to raise during the last 12 months?
Did you sell any [...] during the last 12 months?
Type of Livestock Livestock code
During the last 12 months, has any member of your household raised or owned any […]? 1= Yes 2= No (>> NEXT ANIMAL)
How many of […] are owned by your household now? Number owned now (present at your farm or away) IF ZERO, GO
TO 7.
If you would sell one of the […] today, how much would you receive from the sale?
How many did you own exactly 12 months ago (present or away)?
During the last 12 months, how many were born or graduated to?
During the last 12 months, how many were received as gift?
During the last 12 months, how many died, got lost?
During the last 12 months, how many were given as gifts?
Number bought IF NONE WRITE 0, GO TO 14
Total purchase value of all bought
INCLUDING VALUE OF IN-
KIND PAYMENTS
Number sold IF NONE WRITE 0, GO TO 16
Total sales value of all sold
INCLUDING VALUE OF IN-
KIND PAYMENTS
How many were slaughtered in the last 12 months?
2 3 4 5 6 7 8 9 10 11 12 13 14 15 16
EXOTIC/CROSS
Calves 1
Bulls and Oxen 2
Heifer and Cows 3
INDIGENOUS
Calves 4
Bulls and Oxen 5
Heifer and Cows 6
Donkeys 7
Mules 8
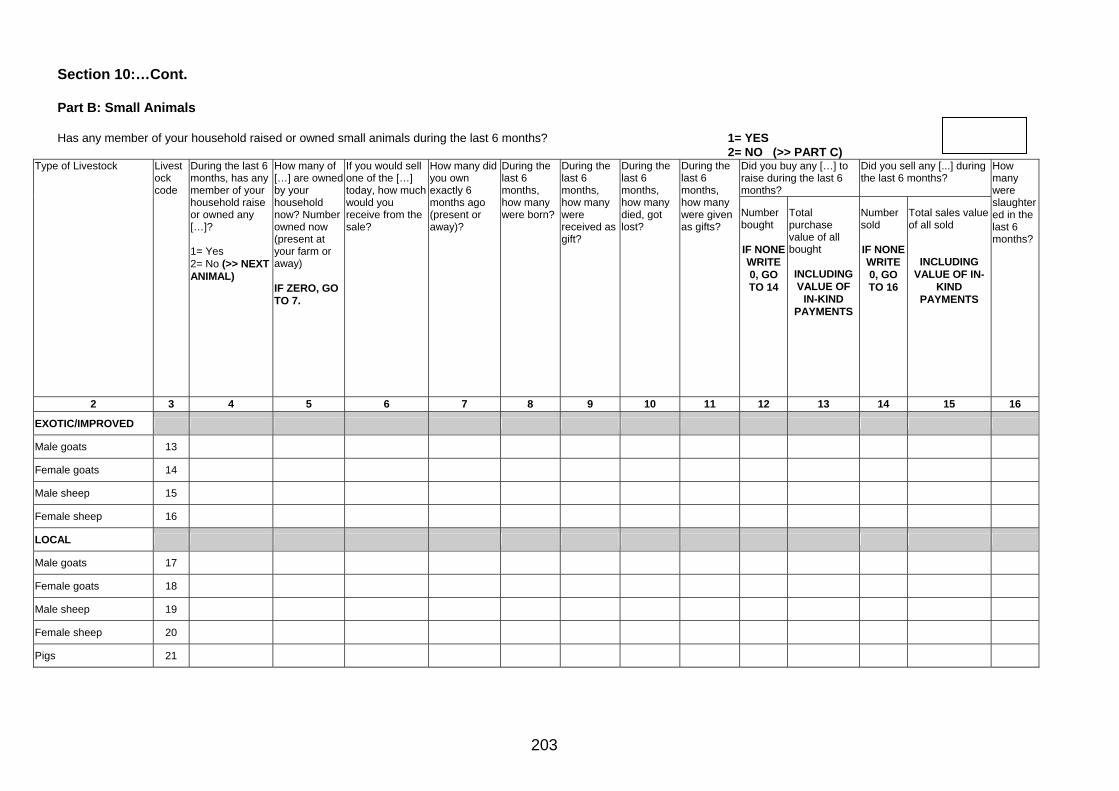
203
Section 10:…Cont. Part B: Small Animals Has any member of your household raised or owned small animals during the last 6 months? 1= YES
2= NO (>> PART C) Did you buy any […] to raise during the last 6 months?
Did you sell any [...] during the last 6 months?
Type of Livestock Livestock code
During the last 6 months, has any member of your household raise or owned any […]? 1= Yes 2= No (>> NEXT ANIMAL)
How many of […] are owned by your household now? Number owned now (present at your farm or away) IF ZERO, GO TO 7.
If you would sell one of the […] today, how much would you receive from the sale?
How many did you own exactly 6 months ago (present or away)?
During the last 6 months, how many were born?
During the last 6 months, how many were received as gift?
During the last 6 months, how many died, got lost?
During the last 6 months, how many were given as gifts?
Number bought IF NONE WRITE 0, GO TO 14
Total purchase value of all bought INCLUDING VALUE OF
IN-KIND PAYMENTS
Number sold IF NONE WRITE 0, GO TO 16
Total sales value of all sold
INCLUDING VALUE OF IN-
KIND PAYMENTS
How many were slaughtered in the last 6 months?
2 3 4 5 6 7 8 9 10 11 12 13 14 15 16
EXOTIC/IMPROVED
Male goats 13
Female goats 14
Male sheep 15
Female sheep 16
LOCAL
Male goats 17
Female goats 18
Male sheep 19
Female sheep 20
Pigs 21

204
Section 10:…Cont. Part C: Poultry and Others Has any member of your household raised or owned poultry, bees or other domesticated birds during the last 3 months? 1= YES
2= NO (>> SECTION 11)
Did you buy any […] to raise during the last 3 months?
Did you sell any [...] during the last 3 months?
Type of Livestock Livestock code
During the last 3 months, has any member of your household raise or owned any […]? 1= Yes 2= No (>> NEXT ANIMAL)
How many of […] are owned by your household now? Number owned now (present at your farm or away) IF ZERO, GO TO 7.
If you would sell one of the […] today, how much would you receive from the sale?
How many did you own exactly 3 months ago (present or away)?
During the last 3 months, how many were born?
During the last 3 months, how many were received as gift?
During the last 3 months, how many died, got lost?
During the last 3 months, how many were given as gifts?
Number bought IF NONE WRITE 0, GO TO 14
Total purchase value of all bought INCLUDING VALUE OF
IN-KIND PAYMENTS
Number sold IF NONE WRITE 0, GO TO 16
Total sales value of all sold
INCLUDING VALUE OF IN-
KIND PAYMENTS
How many were slaughtered in the last 3 months?
2 3 4 5 6 7 8 9 10 11 12 13 14 15 16
Rabbits 31
Backyard chicken 32
Parent stock for broilers 33
Parent stock for layers 34
Layers 35
Pullet chicks 36
Growers 37
Broilers 38
Turkeys 39
Ducks 40
Geese and other birds 41
Beehives 42
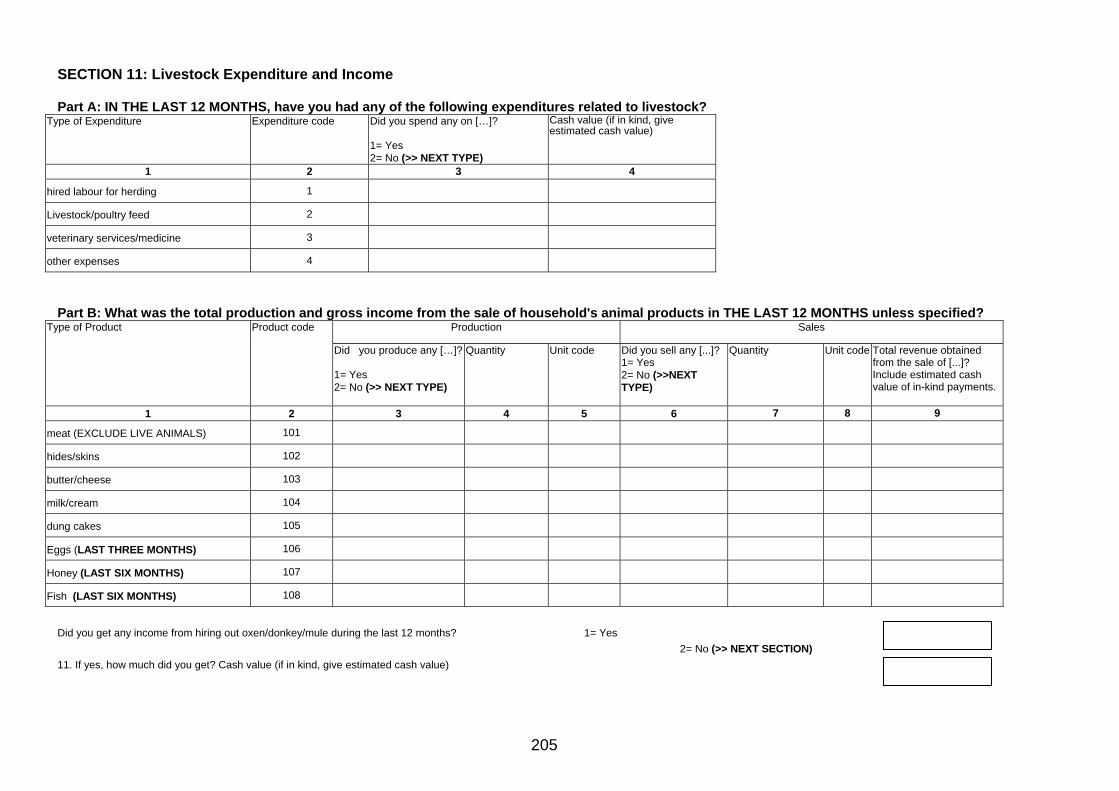
205
SECTION 11: Livestock Expenditure and Income Part A: IN THE LAST 12 MONTHS, have you had any of the following expenditures related to livestock?
Type of Expenditure Expenditure code Did you spend any on […]? 1= Yes 2= No (>> NEXT TYPE)
Cash value (if in kind, give estimated cash value)
1 2 3 4
hired labour for herding 1
Livestock/poultry feed 2
veterinary services/medicine 3
other expenses 4
Part B: What was the total production and gross income from the sale of household's animal products in THE LAST 12 MONTHS unless specified?
Production Sales Type of Product Product code
Did you produce any […]? 1= Yes 2= No (>> NEXT TYPE)
Quantity Unit code Did you sell any [...]? 1= Yes 2= No (>>NEXT TYPE)
Quantity Unit code Total revenue obtained from the sale of [...]? Include estimated cash value of in-kind payments.
1 2 3 4 5 6 7 8 9
meat (EXCLUDE LIVE ANIMALS) 101
hides/skins 102
butter/cheese 103
milk/cream 104
dung cakes 105
Eggs (LAST THREE MONTHS) 106
Honey (LAST SIX MONTHS) 107
Fish (LAST SIX MONTHS) 108
Did you get any income from hiring out oxen/donkey/mule during the last 12 months? 1= Yes
2= No (>> NEXT SECTION) 11. If yes, how much did you get? Cash value (if in kind, give estimated cash value)
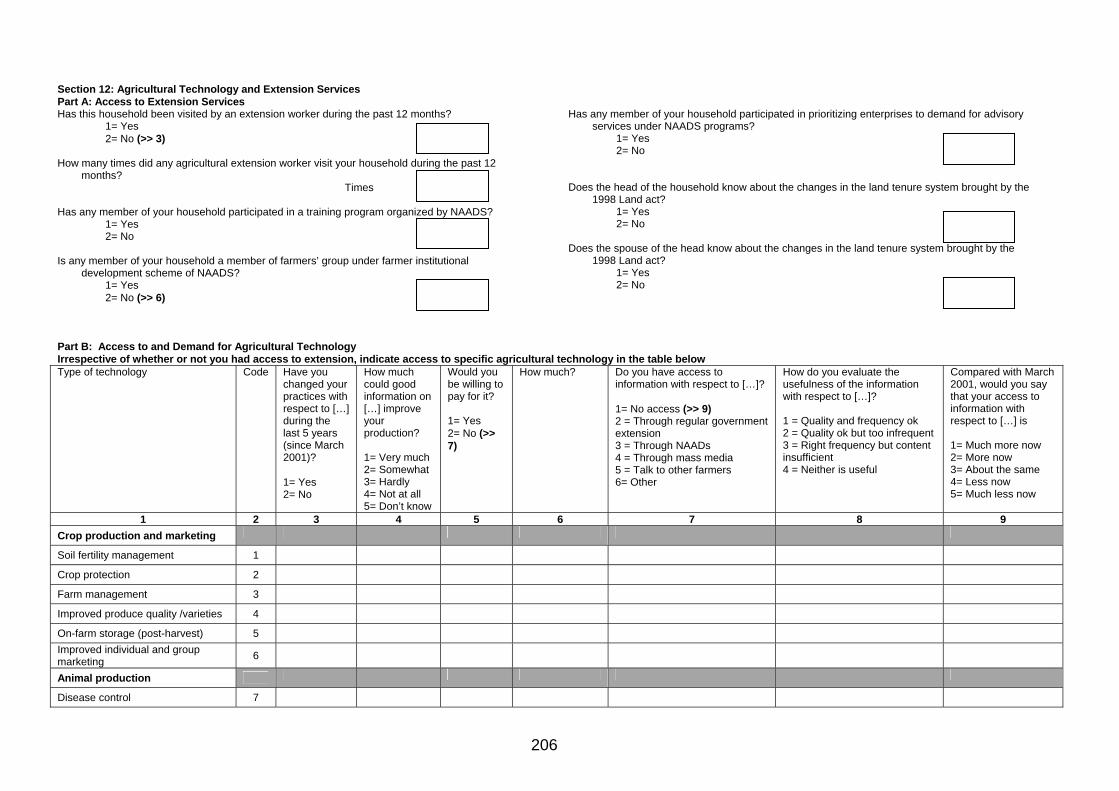
206
Section 12: Agricultural Technology and Extension Services Part A: Access to Extension Services Has this household been visited by an extension worker during the past 12 months?
1= Yes 2= No (>> 3)
How many times did any agricultural extension worker visit your household during the past 12 months?
Times Has any member of your household participated in a training program organized by NAADS?
1= Yes 2= No
Is any member of your household a member of farmers’ group under farmer institutional
development scheme of NAADS? 1= Yes 2= No (>> 6)
Has any member of your household participated in prioritizing enterprises to demand for advisory services under NAADS programs?
1= Yes 2= No
Does the head of the household know about the changes in the land tenure system brought by the
1998 Land act? 1= Yes 2= No
Does the spouse of the head know about the changes in the land tenure system brought by the
1998 Land act? 1= Yes 2= No
Part B: Access to and Demand for Agricultural Technology Irrespective of whether or not you had access to extension, indicate access to specific agricultural technology in the table below Type of technology Code Have you
changed your practices with respect to […] during the last 5 years (since March 2001)? 1= Yes 2= No
How much could good information on […] improve your production? 1= Very much 2= Somewhat 3= Hardly 4= Not at all 5= Don’t know
Would you be willing to pay for it? 1= Yes 2= No (>> 7)
How much? Do you have access to information with respect to […]? 1= No access (>> 9) 2 = Through regular government extension 3 = Through NAADs 4 = Through mass media 5 = Talk to other farmers 6= Other
How do you evaluate the usefulness of the information with respect to […]? 1 = Quality and frequency ok 2 = Quality ok but too infrequent 3 = Right frequency but content insufficient 4 = Neither is useful
Compared with March 2001, would you say that your access to information with respect to […] is 1= Much more now 2= More now 3= About the same 4= Less now 5= Much less now
1 2 3 4 5 6 7 8 9 Crop production and marketing
Soil fertility management 1
Crop protection 2
Farm management 3
Improved produce quality /varieties 4
On-farm storage (post-harvest) 5
Improved individual and group marketing 6
Animal production
Disease control 7
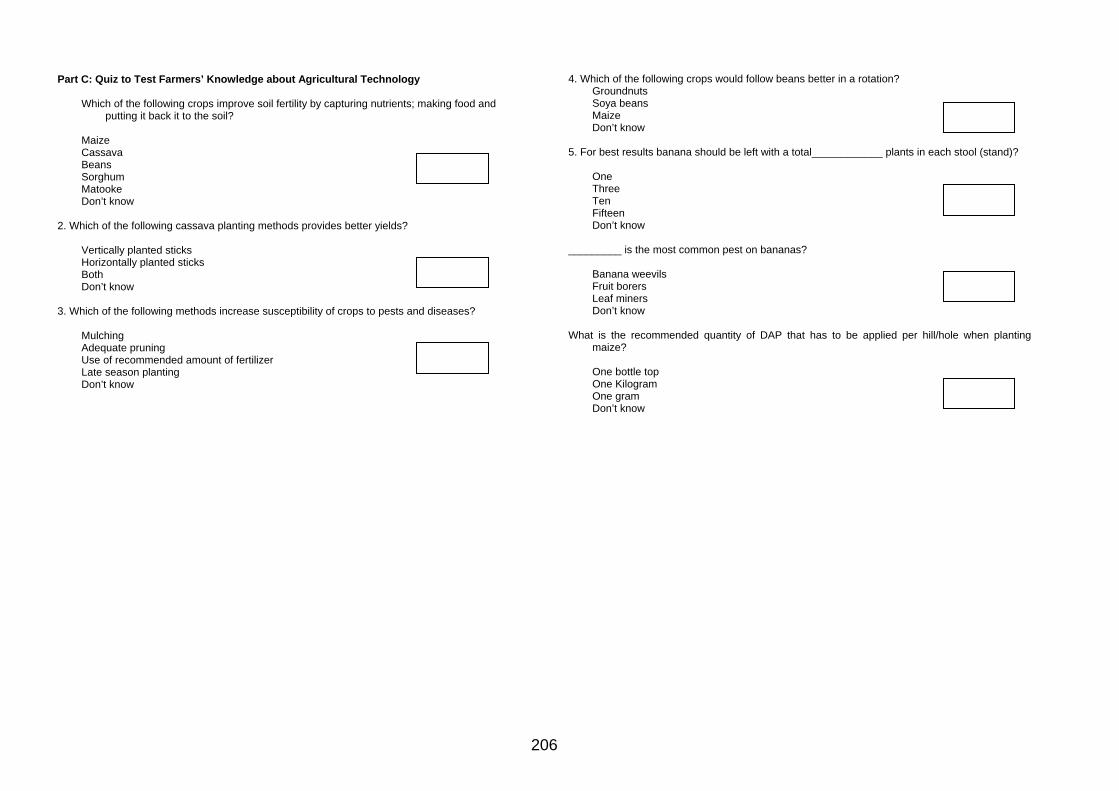
206
Part C: Quiz to Test Farmers’ Knowledge about Agricultural Technology
Which of the following crops improve soil fertility by capturing nutrients; making food and putting it back it to the soil?
Maize Cassava Beans Sorghum Matooke Don’t know
2. Which of the following cassava planting methods provides better yields?
Vertically planted sticks Horizontally planted sticks Both Don’t know
3. Which of the following methods increase susceptibility of crops to pests and diseases?
Mulching Adequate pruning Use of recommended amount of fertilizer Late season planting Don’t know
4. Which of the following crops would follow beans better in a rotation? Groundnuts Soya beans Maize Don’t know
5. For best results banana should be left with a total____________ plants in each stool (stand)?
One Three Ten Fifteen Don’t know
_________ is the most common pest on bananas? Banana weevils Fruit borers Leaf miners Don’t know
What is the recommended quantity of DAP that has to be applied per hill/hole when planting maize?
One bottle top One Kilogram One gram Don’t know
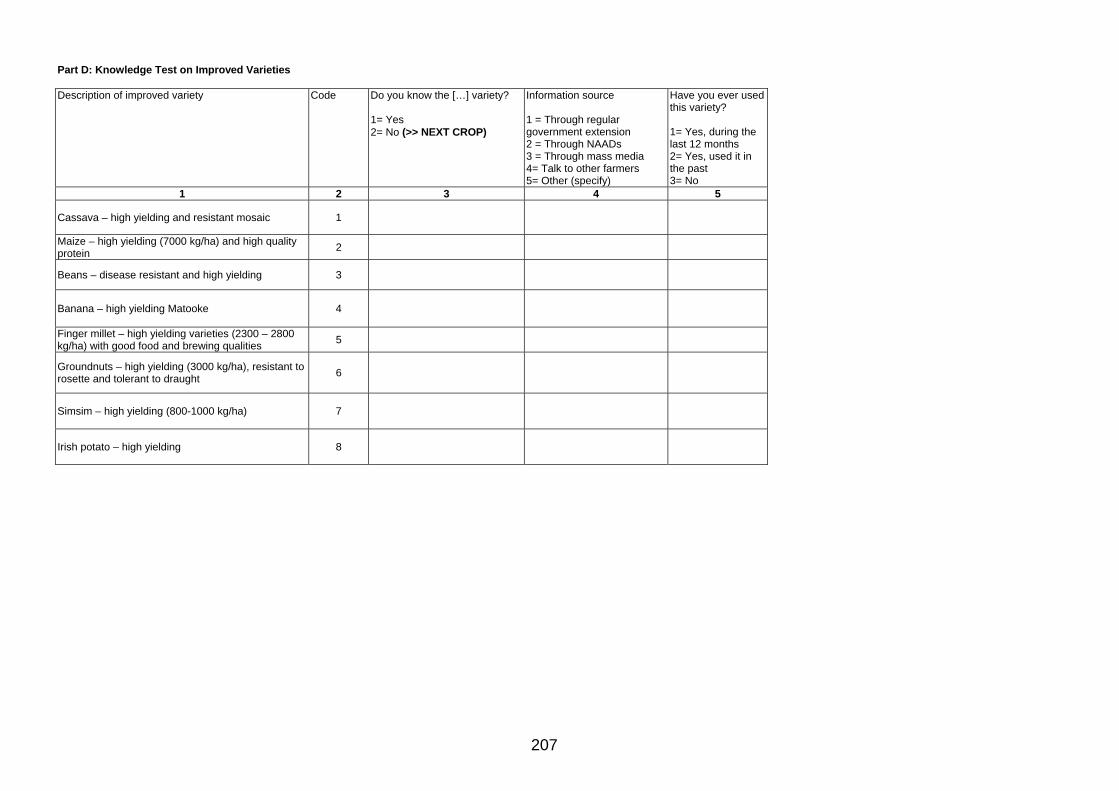
207
Part D: Knowledge Test on Improved Varieties Description of improved variety Code Do you know the […] variety?
1= Yes 2= No (>> NEXT CROP)
Information source 1 = Through regular government extension 2 = Through NAADs 3 = Through mass media 4= Talk to other farmers 5= Other (specify)
Have you ever used this variety? 1= Yes, during the last 12 months 2= Yes, used it in the past 3= No
1 2 3 4 5
Cassava – high yielding and resistant mosaic 1
Maize – high yielding (7000 kg/ha) and high quality protein 2
Beans – disease resistant and high yielding 3
Banana – high yielding Matooke 4
Finger millet – high yielding varieties (2300 – 2800 kg/ha) with good food and brewing qualities 5
Groundnuts – high yielding (3000 kg/ha), resistant to rosette and tolerant to draught 6
Simsim – high yielding (800-1000 kg/ha) 7
Irish potato – high yielding 8