UGANDA: AGRICULTURE SECTOR PUBLIC EXPENDITURE REVIEW...
91
UGANDA: AGRICULTURE SECTOR PUBLIC EXPENDITURE REVIEW PHASES 1 and 2 FINAL REPORT July 2007
Transcript of UGANDA: AGRICULTURE SECTOR PUBLIC EXPENDITURE REVIEW...

UGANDA: AGRICULTURE SECTOR PUBLIC EXPENDITURE REVIEW
PHASES 1 and 2
FINAL REPORT
July 2007
Uganda Agriculture Sector Public Expenditure Review Phases 1 and 2
Oxford Policy Management i
Table of Contents
List of Boxes ......................................................................................................................... ii
List of Charts ......................................................................................................................... ii
List of Tables ......................................................................................................................... ii
Abbreviations ....................................................................................................................... iv
Acknowledgements and disclaimer ....................................................................................... vi
Executive summary ................................................................................................ vii
1. Purpose of the review ......................................................................................... 1
2. Recent expenditure trends in COFOG-defined agriculture .............................. 3
2.1 Introduction ...................................................................................................... 3 2.2 Expenditure trends .......................................................................................... 5 2.3 Off-budget expenditure .................................................................................... 7
3. MAAIF expenditure trends and resource allocation ......................................... 9
3.1 Aggregate long term expenditure allocation ..................................................... 9 3.2 Disaggregated expenditure allocations .......................................................... 10
3.2.1 MAAIF‟s recurrent budget ................................................................ 10 3.2.2 MAAIF‟s development budget .......................................................... 17 3.2.3 Recurrent and development budgets ............................................... 20
3.3 Planned versus actual agricultural sector expenditure ................................... 21 3.4 Allocations between central and local government ........................................ 23 3.5 Budget allocations to different sub-sectors and alignment with the PEAP ...... 25
4. Budget processes ............................................................................................. 27
4.1 Budget preparation ........................................................................................ 27 4.1.1 MTEF and budget ceilings ............................................................... 27 4.1.2 The SBFP and the Agriculture Sector Working Group ..................... 29 4.1.3 MAAIF‟s Development Strategy and Investment Plan (DSIP) .......... 35 4.1.4 Local Government agricultural budget preparation .......................... 35 4.1.5 Transparency .................................................................................. 36
4.2 Budget execution and control ........................................................................ 37 4.2.1 Budget releases and disbursements ................................................ 37 4.2.2 Performance monitoring .................................................................. 38 4.2.3 Donor budget releases and expenditure .......................................... 39
4.3 Budget accounting, reporting and audit ......................................................... 39
5. Donor funding and funding modalities ............................................................ 41
5.1 GoU intentions on donor funding ................................................................... 41 5.2 Disbursement of donor funds. ........................................................................ 41 5.3 Funding modalities ........................................................................................ 44 5.4 Selecting a development portfolio .................................................................. 46
6. Summary of main findings and action plan ..................................................... 47
Annex 1: Terms of Reference .................................................................................. 51
Annex 2: Inception Report (main sections) .............................................................. 54
Annex 3: Persons met ............................................................................................. 64
Annex 4: Bibliography ............................................................................................. 67
Annex 5: Findings and lessons from District visits ................................................... 70

Uganda Agriculture Sector Public Expenditure Review Phases 1 and 2
Oxford Policy Management ii
List of Boxes
Box 4.1: The budget preparation process ................................................................ 27
Box 4.2: The Agriculture Sector Working Group ...................................................... 30
Box 6.1: Proposed MAAIF Action Plan .................................................................... 50
List of Charts
Chart 4.1: NAADS Districts budgeted and actual cash flows, 2005/06 .................... 37
List of Tables
Table 2.1: COFOG-relevant expenditure, 2001/02 to 2005/06 (nominal UShs bn)..... 6
Table 2.2: Disbursements to COFOG agriculture by two „off-budget‟ donors, 2000/01 to 2006/07 in UShs bn ....................................................................................... 7
Table 3.1: Agriculture‟sa share of GoU-funded budgetb allocations 1980/81 to 2009/10 ............................................................................................................. 9
Table 3.2: Agriculture‟sa share of total GoU and donor funded budgetb allocations 2000/01 to 2009/10 .......................................................................................... 10
Table 3.3: Agriculture‟s recurrent budget allocation in nominal and constant 2005/06 prices, 2001/02 to 2006/07 UShs bn ................................................................ 11
Table 3.4: MAAIF (Vote 010) recurrent budget allocation in nominal and constant 2005/06 prices, 2000/01 to 2006/07 ................................................................. 12
Table 3.5: Percentage distribution of MAAIF‟s (Vote 010) approved recurrent budget allocation to programmes, 2000/01-2007/08 .................................................... 13
Table 3.6: Allocation of „grants‟ in MAAIF‟s (Vote 010) approved recurrent budget to functions UShs bn 2001/02-2006/07 ................................................................ 14
Table 3.7: Allocation of „grants‟ in MAAIF‟s (Vote 010) approved recurrent budget to programmes UShs bn 2001/02-2006/07 .......................................................... 14
Table 3.8: Percentage allocation of employment costs in MAAIF‟s (Vote 010) approved recurrent budget to programmes 2001/02-2006/07 .......................... 15
Table 3.9: Percentage allocation of expenditure on goods and services to programmes in MAAIF‟s (Vote 010) approved recurrent budget 2001/02-2006/07 ........................................................................................................................ 16
Table 3.10: Employment costs as a percentage of total employment costs and use of goods and services in the approved recurrent budget allocation2001/02 to 2006/07. .......................................................................................................... 17
Table 3.11: Approved donor- and domestic-financed development budget allocations to MAAIF (Vote 010) 2000/01-2006/07, in actual and constant 2005 UShs bn . 18
Table 3.12: Allocation of donor- and GoU-financed development funds to MAAIF (Vote 010), 2001/02-2005/06 ........................................................................... 19
Table 3.13: Economic classification of COFOG agriculture development budget allocations, 2003/04 to 2006/07 ....................................................................... 20
Uganda Agriculture Sector Public Expenditure Review Phases 1 and 2
Oxford Policy Management iii
Table 3.14: Approved and revised recurrent budget allocations for MAAIF (Vote 010) and actual recurrent expenditure, 2000/01-2005/06, in UShs bn...................... 21
Table 3.15: Actual recurrent expenditure as a percentage of approved recurrent budget allocations for MAAIF programmes 2000/01-2005/06 .......................... 22
Table 3.16: Actual recurrent expenditure as a percentage of revised recurrent budget allocations for MAAIF programmes, 2000/01-2005/06 ..................................... 23
Table 3.17: Disbursement / release of MAAIF (Vote 010) of donor- and GoU-financed development funds as a percentage deviation from development budget allocations, 2001/02-2005/06, in UShs bn ........................................................ 23
Table 3.18: Sources and channels of agriculture funding at LGs levels ................... 24
Table 3.19: District Conditional Grant share in total COFOG agriculture releases, 2001/02 to 2005/06, UShs bn .......................................................................... 24
Table 4.1: Evolution of FY 2007/08 budget ceiling projections for the agriculture sector from March 2005 to March 2007 UShs bn ............................................. 28
Table 4.2: Evolution of FY 2006/07 budget ceiling projections for the agriculture sector by Vote, in UShs bn .............................................................................. 29
Table 4.3: Proposed MAAIF budget allocations in relation to DSIP proposals ......... 33
Table 5.1: MTEF 2006/07-2009/10, donor project funds, in UShs bn...................... 41
Table 5.2: Allocation and disbursement of donor development funds to the agriculture sector, 2001/02 to 2006/07 in UShs bn ............................................................ 42
Table 5.3: Allocation and disbursement of GoU development funds to the agriculture sector 2001/02 to 2005/06 UShs bn ................................................................. 45
Table 5.4: Average share of donor funds in the allocation and disbursement of development funds to the agriculture sector 2001/02 to 2005/06 UShs bn and percent ............................................................................................................ 45

Uganda Agriculture Sector Public Expenditure Review Phases 1 and 2
Oxford Policy Management iv
Abbreviations
APD MAAIF Agricultural Planning Department BCC Budget Call Circular BFP Budget Framework Paper CAADP Comprehensive Africa Agriculture Development Programme CDO Cotton Development Organisation CICS Competitiveness and Investment Climate Strategy Secretariat COCTU Coordinating Office for the Control of Trypanosomosis in Uganda COFOG UN Classification of Functions of Government COMESA Common Market of Eastern and Southern Africa DANIDA Danish International Development Agency DDA Dairy Development Authority DDP District Development Plan DFID UK‟s Department for International Development DSIP MAAIF‟s Development Strategy and Investment Plan EC European Commission EU European Union FAO Food and Agriculture Organisation FY Fiscal Year GDP Gross Domestic Product GoU Government of Uganda IFMS Integrated Financial Management System ILRI International Livestock Research Institute IMF International Monetary Fund IPF Indicative Planning Figure JAR Joint Annual Review JICA Japanese International Cooperation Agency LG Local Government LGDF Local Government Development Fund M&E Monitoring and Evaluation MAAIF Ministry of Agriculture, Animal Industries and Fisheries MDAs Ministries, departments and agencies MFPED Ministry of Finance, Planning and Economic Development MLHUD Ministry of Lands, Housing and Urban Development MoLG Ministry of Local Government MTEF Medium Term Expenditure Framework MWE Ministry of Water and Environment MWLE Ministry of Water, Lands and Environment NAADS National Agricultural Advisory Services NARO National Agricultural Research Organisation NEPAD New Partnership for Africa‟s Development NFA National Forestry Authority NGO Non-governmental Organisation NSCG Non-sectoral Conditional Grant NTR Non-tax Revenue OPM Oxford Policy Management PA Principal Accountant PAF Poverty Action Fund PEAP Poverty Eradication Action Plan PEFA Public Expenditure and Financial Accountability PER Public Expenditure Review PIP Public Investment Programme PMA Plan for the Modernisation of Agriculture

Uganda Agriculture Sector Public Expenditure Review Phases 1 and 2
Oxford Policy Management v
PS Permanent Secretary PSF Private Sector Foundation ReSAKKS Regional Strategic Analysis and Knowledge Support System ROM Results-oriented Management SBFP Sector Budget Framework Paper SIDA Swedish International Development Agency SFF Sub-county Farmers‟ Forum SWG Sector Working Group TC Technical Committee TORs Terms of Reference TPM MAAIF Top Policy Management group UCDA Uganda Coffee Development Authority UNDP United Nations Development Programme ULAA Uganda Local Authority Association USAID United States Agency for International Development UShs Ugandan shillings VODP Vegetable Oil Development Project WB World Bank
Uganda Agriculture Sector Public Expenditure Review Phases 1 and 2
Oxford Policy Management vi
Acknowledgements and disclaimer
This study was commissioned by DFID Uganda (Phase 1) and the joint DFID / World Bank programme “How Can Government Promote Pro-Poor Agricultural Growth”1 (Phase 2). The report is the responsibility of the consultants alone and any conclusions should not be attributed to DFID or the World Bank.
The study was conducted by Professor Lawrence Smith, Martin Fowler, Frederick Mugerwa and Milton Ogeda, with support from Stephen Akroyd.
The team gratefully acknowledge the assistance given by MAAIF officials and all of the people listed in Annex 2, who gave their time to take part in interviews.
1 The programme aims to understand and share international best practice on how governments can
better target public spending to maximize agriculture‟s contribution to wider economic growth and poverty reduction
Uganda Agriculture Sector Public Expenditure Review Phases 1 and 2
Oxford Policy Management vii
Executive summary
Purpose of the review
The main purpose of the agricultural PER is to assist MAAIF to be better equipped and strengthened in budget preparation. Additionally, Uganda, as a pilot country for implementing the CAADP Pillar of NEPAD, has committed itself to conducting an agricultural PER in the coming year. The review is being undertaken in three phases. This report is concerned with the first two phases: a comprehensive assessment of public financing in the COFOG-defined agricultural sector (crops, livestock, fish, forestry, water for production and agriculture land-related issues), and; an assessment of the formulation, execution and evaluation of the agricultural budget. A third phase, to be conducted later, will examine the efficiency and outcomes of the delivery of agricultural services.
Expenditure in the agricultural sector
COFOG-relevant aggregate expenditure (Section 2.2). Information collected on public expenditure on the COFOG-defined agricultural sector since 2001/02, at both the central- and local-government level by GoU and donors, shows the share of the GoU budget allocated to the sector falling from 8 percent in 2001/02 to 5.7 percent in 2005/06. The budget has decreased, in real terms, from approximately UShs 295bn at the start of the decade to UShs 210bn in 2005/06. MAAIF is responsible for over 80 percent of this budget. Decentralisation in sector financing is deepening with the share of the sector budget channelled through local government rising from 7 percent of the total at the start of the period to 19 percent by 2005/06. Off-budget expenditure (Section 2.3). By definition, off-budget expenditure is excluded from the definition of government expenditure. However, its contribution to expenditure on the agriculture sector by donors and NGOs is considerable. In some instances there is little liaison between these various agencies and MAAIF or District Production Departments. This creates problems in ensuring that a balanced approach is being taken to policy priorities and principles. MAAIF’s expenditure allocations (Section 3.1). Looking at MAAIF‟s share of COFOG agriculture (crops, livestock, fish), there was a steady decline in its share of the GoU-financed budget through the 1980s. While MAAIF received 4 percent or more of the GoU-financed budget in the early 1980s, since 1991/92, agriculture has not received more than 3 percent of the GoU-financed budget in any year, and in some years the share has been below 2 percent. However, MAAIF‟s share of the budget is projected to grow over the 2007/08 to 2009/10 MTEF period. Regular information on donor-financing of the MAAIF budget is only available since 2000/01. Combining the GOU-financed budget with donor-financing raises the agriculture sector‟s claim on total public expenditure substantially, but it has yet to exceed 5 percent in any year. It is of little consolation to note that the continuing low level of public investment in the agriculture sector is not out of line with many other countries in the region. Disaggregated expenditure allocations (Section 3.2). MAAIF‟s recurrent budget is
provided through a series of Votes. The review focussed on Vote 010, which the Study Team disaggregated into four components: employment costs; use of goods
Uganda Agriculture Sector Public Expenditure Review Phases 1 and 2
Oxford Policy Management viii
and services; grants, and; payment of domestic arrears. The latter two components typically accounted for one-half of the budget but were very variable in amount. The allocation of the recurrent allocation between components and programmes has been examined and the Study Team consider that certain aspects merit further investigation in Phase 3 of the study, namely:
The reasons for the high proportion of the recurrent budget and funds for the purchase of goods and services allocated to Headquarters;
The criteria used for allocating the non-wage component of the allocation between programmes;
Whether the operational effectiveness of the various programmes is affected by a high wage; non-wage ratio or whether this ratio is set in the knowledge that a proportion of development budget funds are used to finance recurrent costs.
MAAIF‟s Vote 010 development budget (Sections 3.2.2 and 3.2.3) averaged over UShs 100bn in 2000/01 to 2002/03 in constant 2005/06 prices, but fell to UShs 64bn in 2004/05 to 2006/07. This was associated with a fall in direct-donor financing of development projects with no evidence of any consistent increase in domestically-financed funds (including direct budget support) to compensate. However, this should be viewed in the context of the substantial increase in domestic-financed support for NAADS District operations under a separate Vote. Budget allocations for capital spending accounted for 32 percent of the COFOG agriculture development budget development over the period 2003/04 to 2006/07 (i.e. around two-thirds of the COFOG development budget has been for recurrent or „operational‟ expenditures). This current situation is far removed from the time when „capital expenditure‟ and „development expenditure‟ were virtually synonymous, and demonstrates that the separation of „recurrent‟ and „development‟ spending is not being properly applied in practice. Planned vs actual agriculture expenditure (Section 3.3). The relationship between planned (approved) budget allocations and actual expenditure is usually an important measure of the effectiveness of the budget in allowing departments to plan their activities and also of their performance in delivering public services. Using conventional measures, MAAIF would score poorly but much of the variation in planned and actual expenditure can be ascribed to frequent changes in budget allocations and releases by MFPED. Allocations between central and local government (Section 3.4). There has been
a marked shift in the allocation of COFOG-defined agriculture budget allocations. From 2001/02 the share of district grant expenditure used for agriculture more than doubled from 10 percent to 25 percent in 2005/06, mainly as a result of the roll-out of NAADS activities to a larger number of sub-counties and districts. Allocation against PEAP priorities (Section 3.5). Annual budget allocations are not consistent with the funding priorities identified in the MAAIF DSIP. This undermines the effectiveness of the DSIP and the realisation of PEAP‟s priorities and objectives.
Budget processes
Planning framework (Section 4.1.1). Budget ceilings for agriculture under the
MTEF fluctuate considerably. This makes sector planning difficult, especially in the

Uganda Agriculture Sector Public Expenditure Review Phases 1 and 2
Oxford Policy Management ix
medium term. In the shorter term there are frequent modifications to the budget allocations during budget preparation right up to the budget speech and beyond. Sector Budget Framework Paper (Section 4.1.2). In principle the Agriculture
Sector Working Group (SWG), with a broad-based membership, is responsible for the preparation of the Sector Budget Framework Paper (SBFP). In practice most drafting is done by a few members of the Agriculture Planning Department under very tight time constraints. However, to some extent these constraints are self-imposed as considerable preparatory work could be done earlier. MFPED should reconsider the guidelines and format for the SBFP as much of the required content and presentation does not seem relevant to making evidence-based claims for future resources. Currently, there are no overt incentives or sanctions related to the quality of the SBFP and, except for one year, MFPED provides no feedback on it. Development Strategy and Investment Programme (Section 4.1.3). MAAIF‟s
Development Strategy and Investment Programme only covers the period up to 2007/08. There is an urgent need to update this, in the process improving its credibility. Local Government budget preparation (Section 4.1.4). The process here is similar
to that at the central government level but the time constraints are more severe. There are problems in fully implementing „bottom up‟ planning; there is little flexibility in resource allocation, and; political pressures can lead to unrealistic budgeting. Transparency (Section 4.1.5). The real budget negotiations start after the
submission of the SBFPs. As there is no overt high-level Budget Committee with representatives from key ministries, and as the agriculture SWG rarely meets after submission of the BFP, subsequent adjustments are made in a closed and bureaucratic manner. Budget execution and control (Section 4.2.1). The operation of the cash budget
system can create problems in budget execution and the case is made for releasing funds to the NAADS District programme to match its seasonal cash flow requirements. On occasions counterpart funding and co-financing has created problems for the release of both donor and government funds. Performance monitoring (Section 4.2.2). MAAIF has a Monitoring and Evaluation
Division within APD but has limited funds to perform effectively. More importantly, the Study Team could find no evidence of use of its performance reports either inside or outside MAAIF. The SWG already has a remit in its TORs to monitor the performance of budget expenditures. Implementing this would give a year-round agenda for the SWG, which would help to increase its effectiveness and sense of purpose. However, establishing this system would only be effective if it is given strong Ministerial support and if it is seen to be implemented and supported by the PS and his senior colleagues. MFPED could strengthen the case for effective performance monitoring if it insisted on a more rigorous analysis and presentation of ministry/sector performance in the SBFPs and Quarterly Performance Reports. Budget accounting and monitoring (Section 4.3). The internal audit systems at both central and local level appear to be functioning effectively. The Auditor General only audits a sample of projects annually. It is recommended that this sample be extended to the largest size that is practicable.
Uganda Agriculture Sector Public Expenditure Review Phases 1 and 2
Oxford Policy Management x
Donor funding and modalities
Historically, the agricultural sector has relied heavily on donor funding. It is now constrained by MTEF ceilings and GoU‟s intention to reduce aid dependency (Section 5.1). Moreover, loans will be limited to specific uses and additional resources will not be allowed for sectors with unused donor funds. Although from the viewpoint of budget allocations the MTEF ceiling is tight, disbursements of donor funds are so low that actual development expenditure is always significantly below the MTEF ceiling. This implies that more could be spent if disbursement rates were raised. However, for a variety of reasons, low disbursement rates are a characteristic feature of large projects (Section 5.2), which no longer makes them the most suitable funding modality for the agricultural sector (Section 5.3). There is a need for MAAIF to design a portfolio of projects to implement the revised DSIP that could be funded mainly by GoU using domestic finance and donor budget support (Section 5.4). A revitalised SWG would play an important role by providing a forum for developing a value-for-money portfolio that helps MAAIF achieve its objectives.
Recommendations
This section presents the principal recommendations emerging from the Review.
The recurrent budget allocation both to and within MAAIF merits further investigation in Phase 3 of this study. Key areas for investigation are: (i) reasons for the high proportion of the recurrent budget allocated to Headquarters; (ii) criteria used for allocating the non-wage component of the allocation between programmes; and, (iii) whether operational effectiveness of some programme is affected by high wage / non-wage ratios.
The agriculture „development‟ budget includes a significant amount of recurrent expenditures. It is recommended that MAAIF and MFPD review this practice to assess whether a stronger distinction between these different types of expenditures can be made in the future.
There is a need for MAAIF to strengthen the linkages between sector policies, sector planning (i.e. prioritisation), and allocation of sector resources.
It is recommended that MAAIF implement an action plan to enhance the efficiency of public spending in agriculture. The plan entails:
- Ensuring that performance monitoring and results-oriented management are used systematically and effectively throughout MAAIF;
- Assessing the training and capacity building needs and resource requirements of the new system and providing in-service training where required;
- Revitalising the Sector Working Group; this already has a remit to monitor the performance of budget expenditures;
- Embarking on an immediate revision of the DSIP for 2008/09 onwards; and,
- Developing a portfolio of value-for-money projects to operationalise the revised DSIP, designed to ensure high disbursement rates and to be funded mainly through domestic development funds (including budget support).
MFPED should reconsider the guidelines for the SBFP to assess whether the information currently it requires is essential or presented in the most effective format for making informed decisions on budget allocations.

Uganda Agriculture Sector Public Expenditure Review Phases 1 and 2
Oxford Policy Management xi
MFPD should provide feedback to the SWG (or MAAIF) on the content and quality of the SBFP, together with suggestions for improvements. This should become a regular feature of the budget preparation process.
MAAIF needs to emphasise the importance of regulatory and supervisory activities when presenting its budget framework paper and in subsequent negotiations relating to the budget. They also need to ensure that those departments and programmes undertaking essential regulatory and supervisory activities receive sufficient funds from the budget allocation to undertake them effectively.
The number of agriculture projects subjected to regular external audit (by the Auditor General) should be extended to the largest size that is practicable.
Within the overall cash flow available, MFPED should cater for the relatively small but particular cash flow requirements of agencies such as NAADS in order to improve their operational effectiveness.
Large projects are no longer the most suitable funding modality for the agricultural sector. Instead, more reliance should be placed on a portfolio of projects designed by MAAIF to implement the revised DSIP that could be funded mainly by GoU using domestic finance and donor budget support, as well as direct-donor project support in specific circumstances.
Given the importance of donor funds in supporting public expenditure in Uganda in general and the agricultural sector in particular, it is very surprising that there is no systematic collection of donor releases and expenditure from project accounts by MFPED or by the Principal Accountant (PA) MAAIF in collaboration with other sector agencies. It is recommended that MFPED and MAAIF take urgent steps to remedy this deficiency.

Uganda Agriculture Sector Public Expenditure Review Phases 1 and 2
Oxford Policy Management 1
Uganda: Agriculture Sector Public Expenditure Review
1. Purpose of the review
Oxford Policy Management (OPM) has been contracted by the UK Department for International Development (DFID) and the World Bank to support the Ministry of Agriculture, Animal Industry and Fisheries (MAAIF) in undertaking an agriculture sector Public Expenditure Review (PER). The PER forms part of a global programme reviewing public expenditure in the sector, which will help identify types of expenditure best suited for pro-poor growth. The main recipients of the study are MAAIF, Ministry of Finance, Planning and Economic Development (MFPED) and the Plan for Modernisation of Agriculture (PMA) Development Partners Sub-Group. The PER is being undertaken in three phases that will review:
Phase 1: Patterns of expenditure allocation within the agriculture sector;
Phase 2: The process of formulation and execution of the agriculture budget;
Phase 3: Efficiency and outcomes in the delivery of agriculture services. It is intended that the findings of the PER analysis will, among other things, feed into and inform the preparation of the agriculture sector budget for 2008-09 and assist MAAIF to be better equipped and strengthened in budget preparation. An additional justification for an agricultural sector PER follows the call from the New Partnership for Africa‟s Development (NEPAD) to its member states to allocate 10 percent of their annual budgets to agriculture, an agreement signed by the African Heads of State. Under the Comprehensive Africa Agriculture Development Programme (CAADP) Pillar of NEPAD, one of the first tasks under the individual country programmes is to undertake a PER to document the extent, nature and quality of expenditures on agriculture. Uganda is one of the first five pilot countries for implementing the CAADP Pillar and has committed itself to conducting an agricultural PER in the coming year. OPM has been contracted to support Phases 1 and 2 of the work. Phase 3 of the work is expected to take place later in 2007 (and has not yet been contracted) and will lead to an evaluation of the adequacy of public expenditure in the agricultural sector. This Report covers only Phases 1 and 2 of the agriculture PER. Phase 1 consisted of two elements. The first involved a comprehensive assessment of public financing in the agriculture sector in recent years using the definition of the sector set out in the UN Classification of Functions of Government (COFOG). The second element looked at the current and historical patterns of the level and share of public expenditure in the agricultural sector, its functional allocation within the sector, the source of funding (government and development partners) and modes of financing (loans, grants, etc). As about 37 percent of the annual GoU budget currently goes directly to the districts (Annex 1), which under the decentralization process are responsible for providing most agriculture services, the analysis was conducted both at the central and local government levels. Phase 2 reviewed the formulation, execution and evaluation of the agriculture budget. It assessed the overall budgeting process and system, identified weaknesses, and has proposed an action plan to enable MAAIF to improve budget processes with a view to enhancing efficiency in public spending in agriculture.

Uganda Agriculture Sector Public Expenditure Review Phases 1 and 2
Oxford Policy Management 2
Agreed ToRs for the Phase 1 and Phase 2 work are provided in Annex 1. The methodology adopted by the Study Team in fulfilling the TORs is outlined in Annex 2. The remainder of this report covers these TORs and is presented in five Sections.
Section 2 examines recent trends in public expenditure in the agriculture sector using the COFOG definition. This is the definition adopted under the CAADP Pillars to ensure a uniform basis for measuring member states‟ budget contribution to the agricultural sector. Although the TORs indicated that this definition should be used to examine long-term trends in agriculture expenditure, in practice it could be used for recent years only. The reasons for this are explained in Section 2. The extent of off-budget expenditure to the COFOG-defined agriculture sector is also examined in Section 2.
Section 3 examines agriculture expenditure trends and resource allocations for MAAIF and the autonomous institutions under its control, and for local government. The relationships between planned (approved) budget allocations and actual allocations and with MAAIF‟s and the Poverty Eradication Action Plan‟s (PEAP) priorities and objectives are also considered.
The GoU budget process and its implications for the agriculture sector at central and local government level are examined in Section 4.
Section 5 considers trends in donor funding and funding modalities.
Finally, Section 6 presents a summary of main findings and actions by which MAAIF and MFPED can improve the budgeting process as it relates to the agriculture sector.
Uganda Agriculture Sector Public Expenditure Review Phases 1 and 2
Oxford Policy Management 3
2. Recent expenditure trends in COFOG-defined agriculture
2.1 Introduction
The TORs for the Review envisaged that „It will provide a comprehensive assessment of public financing in the Agriculture Sector using the definition of the Sector set out in COFOG‟. However, there are issues relating to the development of consistent sets of data on expenditure trends using the COFOG definition of the agricultural sector that require some explanation and which made it extremely difficult to use this definition for the whole of the Review. The COFOG definition of agriculture. The UN Classification of Functions of
Government (COFOG) defines agriculture to include: crops, livestock, fishing, forestry, water-for-production, and agriculture-land related issues (Annex 3). Three types of issues arise from this definition:
Forestry, the use of water for agricultural production and land-related issues were part of the Vote of the Ministry of Water, Lands and the Environment (MWLE). Recently, land issues have been transferred to the new Ministry of Lands, Housing and Urban Development (MLHUD), while forestry and water-for-production remain with the Ministry of Water and Environment (MWE). Identifying project expenditure on forestry and irrigation schemes is not problematic; the difficulty here is in deciding what proportion of the relevant Ministries‟ overheads should be apportioned to „agriculture‟. This was done by analysis of expenditures under the most appropriate departments or programmes, namely, land valuation and registration and water for production in MLHUD and MWE, respectively.
Some agriculture projects fall under the Vote of other Ministries such as the Office of the Prime Minister, the National Planning Authority, MFPED and the Ministry of Local Government (MoLG). Some of these projects are „multi-sectoral‟ in the sense that they have non-agricultural components (e.g. feeder roads) and are not classified under „agriculture‟ using COFOG conventions.
A considerable amount of agricultural activity is carried out at the District and sub-county level, sometimes through the part-use of conditional grants. This necessitated obtaining estimates of the proportions of various grants used for agricultural purposes.
Donor funding. The contribution of direct donor funding2 to agricultural expenditure
did not feature in MFPED budget allocations before 1999/2000. Donor funding through budget support is incorporated within GoU budget allocations. The amount recorded as „Donor Project‟ allocations is based on information supplied to MFPED by individual development partners. There is no direct recording of donor disbursements or actual expenditure by GoU or by MAAIF. MFPED records have tended to assume that donor allocations are disbursed, which does not reflect reality. However, since 2001/02 the Aid Liaison Department of MFPED has maintained a databank of disbursement information provided by the development partners and, although this may contain inaccuracies and is incomplete after 2005/06, the Study Team has used it as the main source of information for the disbursement of donor-financed development funds.
2 „Direct donor funding‟ relates to funding channelled through Central Government for specific projects.
Uganda Agriculture Sector Public Expenditure Review Phases 1 and 2
Oxford Policy Management 4
Technical assistance. In some projects the amount of donor funding provided as
technical assistance, such as supervision and professional advice, is in a separate budget usually handled from the donor country. This is rarely reported, thus this element of agriculture expenditure may be under-recorded. Off-budget expenditure. There is considerable off-budget expenditure on agricultural activities at both central and local levels by development partners, international and Ugandan NGOs and, in the past, some UN agencies. Only donor projects channelled through Central Government are captured in the budget. Donor support directed to parastatals, local government or the private sector is not captured in the budget or MTEF ceilings. Most development partners provide MFPED with information on the global sums they intend to spend but the Study Team found reluctance and/or inability by these sources to disaggregate amounts by function. Data inconsistencies The Study Team has not been immune to the problem of data
inconsistencies typical of this type of review, particularly arising from the frequent revisions to budget allocations during the budget preparation period and to allocations and releases during budget implementation. For the main data series on budget allocations the Study Team has relied on the Approved Budget Estimates (Recurrent and Development) that are published each year at the time of the Budget Speech and the Auditor General‟s Final Accounts. GDP deflator. The ability to present the most recent expenditure data in constant
prices has been constrained by the absence of a published GDP deflator for 2006/073. Terminology. There are two important issues that need to be clarified at the start of
this report. In general there appears to be much confusion in budget documents and people‟s understanding, of the terms ‟releases‟, ‟disbursements‟, „actual expenditure‟ and ‟out-turns„ In this report „releases‟ are a term used for GoU funds and refer to the quantity of funds released by MFPED to a Vote / project. „Actual expenditure‟ may vary from releases in circumstances where, for example, regular quarterly releases are made to a Vote and these may exceed actual expenditure in that fiscal year. The term „disbursements‟ is used for donor funds and refers to the quantity of funds transferred to a project account (as advances or reimbursements) or paid directly to a third party in a fiscal year. Information on actual expenditure of donor funds is rarely available except from the audited donor accounts of a project and many of these are unavailable. Following international practice4, „out-turn„ is used in this report to measure the amount released or disbursed as the percentage deviation from the budget allocation5. The second terminology issue relates to budget allocations. The „approved‟ budget estimates are those announced when the Budget is approved by Parliament. It is standard practice in public expenditure reviews to use these as the basis for measuring out-turns against budget allocations because they are expected to be the basis on which expenditure decisions are made. However, given the frequent subsequent revisions to the approved budget allocations that may have influenced
3 A provisional figure was subsequently provided by the World Bank.
4 World Bank (2006).
5 In some GoU and MAAIF reports „out-turn‟ is used to describe the amount of funds released and
„performance‟ is defined as the percentage of allocated funds actually released.
Uganda Agriculture Sector Public Expenditure Review Phases 1 and 2
Oxford Policy Management 5
expenditure decisions and out-turns, some analysis has also been conducted on the „revised‟ budget allocations.
2.2 Expenditure trends
Table 2.1 shows the ‟budgets‟ and „releases‟ of domestically- and donor-financed funds in respect of a number of ministries, departments and agencies which fall within the COFOG definition of „agriculture‟. These are MAAIF (here, including the NARO and NAADS votes), the Cotton Development Organisation (CDO), the Uganda Coffee Development Authority (UCDA), the Dairy Development Authority (DDA), parts of the Ministry of Water, Lands and Environment (MWLE), the National Forestry Authority (NFA), parts of the Ministry of Local Government and parts of local government expenditure. The table shows that, in nominal terms, the volume of approved budget funds to COFOG agriculture was very similar in 2005/06 to its level in 2001/02 after a decrease of around 10 percent in 2003/04 and 2004/05. This is similar to the trend shown in the approved budget for MAAIF6. „Releases‟ of funds to COFOG agriculture did increase slightly, with the exception of 2004/05 when MAAIF releases dipped dramatically. However, in real terms the budget has decreased since the beginning of the decade - from over UShs 295bn at the start to UShs 210bn in 2005/06 (Table 2.1). Real releases have followed a similar trend, falling from approximately UShs 175bn to UShs 150bn over the same period. With such stagnation in the funding of COFOG agriculture-related agencies and ministries, their proportion of government‟s total budget showed a continuous decline from 8.1 percent in 2001/02 to 5.7 percent in 2005/06. Releases as a proportion of the national total fell from 6.9 percent to 5.4 percent over the same period. The MTEF agriculture sector budget (MAAIF and its semi-autonomous agencies, NARO, NAADS, and District Agricultural Extension) accounted for 67 percent of the COFOG agriculture budget allocations in 2001/02 and 81 percent in 2005/06. The other major component consists mainly of forestry programmes (now, in part, taken over by NFA expenditure) and some agriculture projects under the control of other ministries and agencies. This component fell from 30 percent of the COFOG agriculture budget in 2001/02 to 16 percent in 2005/06. The final component, those parts of the Local Government Development Programme (LGDP) and the Non-Sectoral Conditional Grant (NSCG) allocated to agriculture, accounted for approximately 3 percent of the COFOG agriculture budget throughout the 5-year period. Table 2.1 shows that actual Central Government development expenditure fell over the period 2001/02 to 2005/06 from UShs 192bn to UShs 139bn. Section 5 contains an analysis of the relative contributions and trends in GoU-financed (including donor budget support) and direct donor funding of development projects. At least part of the decline in Central Government development expenditure has been offset by the increased financing of the NAADS (Districts) programme.
6 Including NARO, but excluding other semi-autonomous agencies and transfers to the Districts
(agricultural extension grants and the NAADS (Districts) allocation).

Uganda Agriculture Sector Public Expenditure Review Phases 1 and 2
Oxford Policy Management 6
Table 2.1: COFOG-relevant expenditure, 2001/02 to 2005/06 (nominal UShs bn)
2001/02 2002/03 2003/04 2004/05 2005/06
Budget Release Budget Release Budget Release Budget Release Budget Release
CENTRAL GOVT
MAAIF* recurrent 7.45 5.82 7.85 6.58 6.64 7.22 11.46 10.71 14.49 13.55
development 127.85 66.81 126.16 82.08 90.66 58.25 85.06 39.37 106.07 60.71
Other COFOG Lands, Forestry & Water-for-Prodn.
recurrent 1.51 1.12 1.84 1.10 1.38 1.12 0.19 0.16 0.24 0.21 development 63.71 39.58 56.92 31.29 66.46 57.34 48.59 20.83 33.30 19.90
Agencies
DDA 0.50 0.50 0.16 0.16 0.24 0.24 0.22 0.22 0.22 0.22 CDO 1.26 1.26 0.95 0.95 1.77 1.77 1.98 1.98 1.03 1.03 UCDA 2.12 1.85 1.89 1.76 2.78 2.25 2.61 2.69 2.76 3.12
NFA 0.00 0.00 0.00 0.00 1.03 1.03 10.76 10.76 13.25 13.25 LOCAL GOVT
Extension wage 2.47 2.16 3.06 2.83 3.06 3.19 3.06 3.89 3.08 3.85
non-wage 3.00 2.90 2.92 2.73 2.92 2.81 2.92 2.92 2.92 2.78
NAADS (Districts)** 2.57 2.42 5.66 9.32 14.27 13.75 16.02 15.13 27.46 24.87 NSCG*** 6.07 4.44 5.76 4.09 5.96 4.20 6.38 4.01 6.18 4.22
LGDP**** - 1.62 - 1.06 - 1.69 - 1.42 - 0.67 TOTAL 218.51 130.48 213.17 143.95 197.17 154.86 189.25 114.09 211.00 148.38 Total (constant terms) 295.86 176.67 265.61 179.36 231.22 181.60 206.09 124.24 211.00 148.38
Total GoU expenditure (nominal) 2,686 1,895 2,768 2,720 3,107 3,128 3,380 3,369 3,716 2,760
COFOG as % Total GoU 8.1 6.9 7.7 5.3 6.3 5.0 5.6 3.4 5.7 5.4
Source: MFPED Aid Liaison Department database; information collected by Study Team from MoLG, PMA Secretariat and NFA; DDA, NFA and UCDA annual reports; MFPED, various MTEF projections.
Notes: * including NARO and NAADS Secretariat
** From 2003/04 an amount appears in this vote under Donor Development. This cannot be accessed by the NAADS programme and yet, in at least one year, it is reported as having been fully spent.
*** NSCG data were made available by the PMA Secretariat and analysed by the Study Team to identify COFOG-relevant agriculture expenditure.
**** LGDP figures for COFOG-relevant agriculture expenditure are from an analysis by the Study Team of data provided by the LGDP Co-ordination Unit.
Out-turns („releases‟ as the percentage deviation from approved budgets) fluctuated between negative 40 percent (in 2001/02 and 2004/05) and negative 21 percent (2003/04) over the five-year analysis period, showing no distinct trend. However, as discussed later in Section 5, during the period, the average proportion of the development budget released by the GoU was significantly higher than the proportion released by the donor agencies. Evidence of deepening decentralisation in sector financing can be seen in Table 2.1 where the proportion of the COFOG agriculture budget channelled through local government rose from 7 percent at the start of the period, to 19 percent by 2005/06. This was mirrored by releases which rose from 10 percent of COFOG agriculture releases to 25 percent over the same period. Local government expenditure is discussed in more detail in Section 3.4 and Tables 3.18 and 3.19 and in Annex 5.
Uganda Agriculture Sector Public Expenditure Review Phases 1 and 2
Oxford Policy Management 7
2.3 Off-budget expenditure
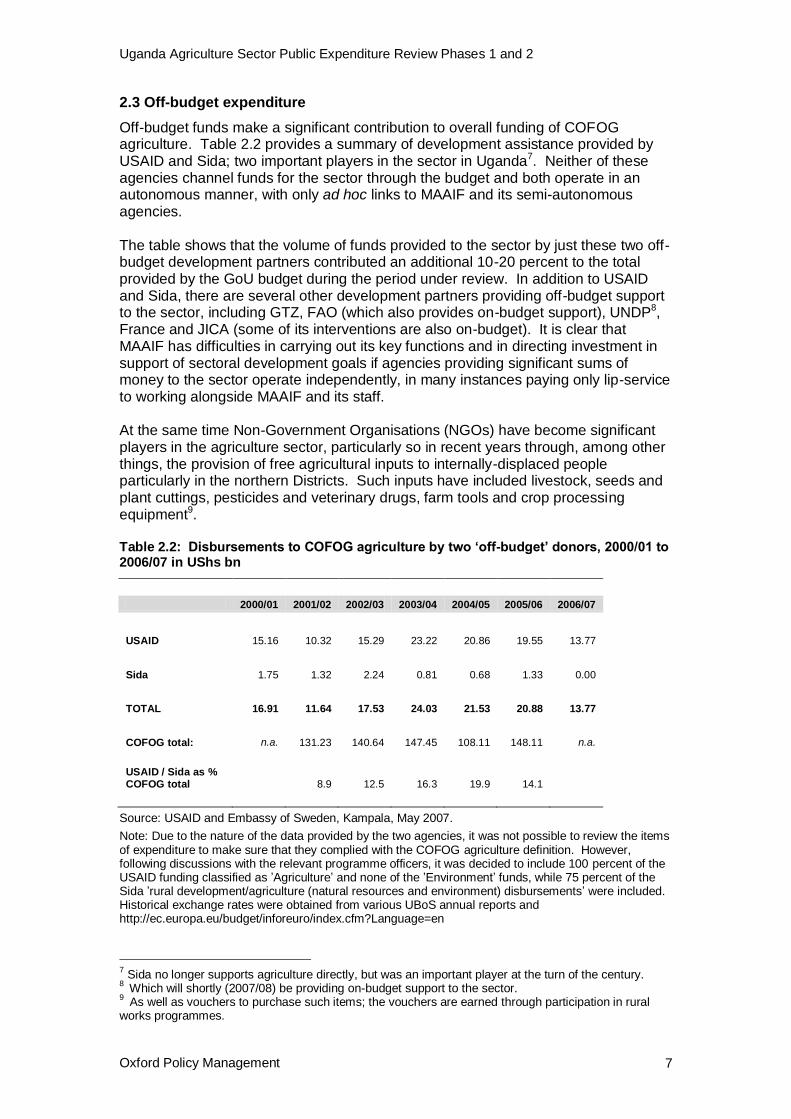
Off-budget funds make a significant contribution to overall funding of COFOG agriculture. Table 2.2 provides a summary of development assistance provided by USAID and Sida; two important players in the sector in Uganda7. Neither of these agencies channel funds for the sector through the budget and both operate in an autonomous manner, with only ad hoc links to MAAIF and its semi-autonomous agencies. The table shows that the volume of funds provided to the sector by just these two off-budget development partners contributed an additional 10-20 percent to the total provided by the GoU budget during the period under review. In addition to USAID and Sida, there are several other development partners providing off-budget support to the sector, including GTZ, FAO (which also provides on-budget support), UNDP8, France and JICA (some of its interventions are also on-budget). It is clear that MAAIF has difficulties in carrying out its key functions and in directing investment in support of sectoral development goals if agencies providing significant sums of money to the sector operate independently, in many instances paying only lip-service to working alongside MAAIF and its staff. At the same time Non-Government Organisations (NGOs) have become significant players in the agriculture sector, particularly so in recent years through, among other things, the provision of free agricultural inputs to internally-displaced people particularly in the northern Districts. Such inputs have included livestock, seeds and plant cuttings, pesticides and veterinary drugs, farm tools and crop processing equipment9. Table 2.2: Disbursements to COFOG agriculture by two ‘off-budget’ donors, 2000/01 to 2006/07 in UShs bn
2000/01 2001/02 2002/03 2003/04 2004/05 2005/06 2006/07
USAID 15.16 10.32 15.29 23.22 20.86 19.55 13.77
Sida 1.75 1.32 2.24 0.81 0.68 1.33 0.00
TOTAL 16.91 11.64 17.53 24.03 21.53 20.88 13.77
COFOG total: n.a. 131.23 140.64 147.45 108.11 148.11 n.a.
USAID / Sida as % COFOG total 8.9 12.5 16.3 19.9 14.1
Source: USAID and Embassy of Sweden, Kampala, May 2007.
Note: Due to the nature of the data provided by the two agencies, it was not possible to review the items of expenditure to make sure that they complied with the COFOG agriculture definition. However, following discussions with the relevant programme officers, it was decided to include 100 percent of the USAID funding classified as ‟Agriculture‟ and none of the ‟Environment‟ funds, while 75 percent of the Sida ‟rural development/agriculture (natural resources and environment) disbursements‟ were included. Historical exchange rates were obtained from various UBoS annual reports and http://ec.europa.eu/budget/inforeuro/index.cfm?Language=en
7 Sida no longer supports agriculture directly, but was an important player at the turn of the century.
8 Which will shortly (2007/08) be providing on-budget support to the sector.
9 As well as vouchers to purchase such items; the vouchers are earned through participation in rural
works programmes.
Uganda Agriculture Sector Public Expenditure Review Phases 1 and 2
Oxford Policy Management 8
Using data collected by FAO (Food Security Group, 2007) during a survey of approximately 25 agencies providing agricultural inputs to approximately 300,000 households in Northern districts during the first season of 2007, it is estimated that the total value of inputs supplied amounted to almost UShs 9bn. Given that agricultural inputs are also supplied in the second season albeit to a smaller number of farm households, the total annual value of agricultural inputs provided by NGOs and other humanitarian agencies is estimated to amount to approximately UShs 14.4bn. This represents almost 10 percent of the total amount of COFOG agriculture-related expenditure in 2006/07. However, care has to be taken to avoid double counting in aggregating NGO and donor off-budget expenditure because a high proportion of NGO funding is provided by donors. Once again, this is an important area of the sector over which neither MAAIF nor any of the District Production and Marketing Directorates have any control, nor do they have any powers or the resources to regulate the provision of inputs in order to ensure that quality standards are being met and that all communities are able to benefit equally from the resources being made available.

Uganda Agriculture Sector Public Expenditure Review Phases 1 and 2
Oxford Policy Management 9
3. MAAIF expenditure trends and resource allocation
3.1 Aggregate long term expenditure allocation
The Study Team has found it extremely difficult to source reliable data on GoU expenditure on agriculture before 1999/2000 and impossible to develop a long-term time series using the COFOG definition of agriculture. To obtain a long-term series the Team has been forced to rely on data reported by Nygaard et al. (1997) for earlier years. The time-series shows agriculture‟s (essentially MAAIF and excluding forestry) percentage share of the GoU-funded budget (that is, excluding donor funding other than budget support) for 30 years from 1980/81 to 2006/07 and projected to 2009/10 (Table 3.1). Table 3.1 shows the steady decline in agriculture‟s share of the GoU budget allocations through the 1980s as the structure of the economy changed under structural adjustment which led to the divestiture or closure of inefficient and heavily subsidised parastatal farms, cattle ranches and marketing boards (Nygaard et al. 1997). While the agriculture sector received 4 percent or more of the GoU-financed budget in the early 1980s, since 1991/92, agriculture has not received more than 3 percent of the GoU-financed budget in any year and in some years the share has been below 2 percent. However, agriculture‟s share is projected to grow over the 2007/08 to 2009/10 MTEF period. Table 3.1: Agriculture’s
a share of GoU-funded budget
b allocations 1980/81 to 2009/10
Year % Year % Year % 1980/81 9.6 1990/91 3.4 2000/01 1.6 1981/82 5.5 1991/92 2.6 2001/02 2.6 1982/83 5.1 1992/93 2.1 2002/03 2.3 1983/84 4.0 1993/94
c 2.4 2003/04 2.1
1984/85 3.9 1994/95 2.9 2004/05 2.0 1985/86 3.8 1995/96 2.0 2005/06 3.0 1986/97 5.4 1996/97 1.6 2006/07 3.0 1987/88 3.2 1997/98 1.1 2007/08 (proj.) 3.1 1988/89 3.1 1998/99 1.6 2008/09 (proj.) 3.5 1989/90 2.2 1999/2000 2.6 2009/10 (proj.) 5.1
Source: Nygaard, D. et al. 1997 using data from Uganda Statistical Abstracts and World Bank Agriculture Report; MAAIF, 2006. Development Strategy and Investment Plan; and analysis of MTEF data
Notes: a. Essentially recurrent and development expenditure for MAAIF (but see Note b). It excludes forestry
b. This only includes donor funds provided as budget support. It excludes donor funding of specific projects
c. From 1993/94 the NARO budget is included as part of the agriculture budget. Nygaard does not indicate how agricultural research funds were recorded prior to this.
Since 2000/01, information has been available on donor-financing of projects through the Central Government, although the 2000/01 figure for donor releases has never been computed. Table 3.2 shows agriculture‟s budget allocation as a percentage of total (GoU and donor-funded) budget allocations from 2000/01 to date and projected to 2009/10. This raises the agriculture sector‟s claim on total public expenditure substantially, but it has only exceeded 5 percent in one year (2001/02).

Uganda Agriculture Sector Public Expenditure Review Phases 1 and 2
Oxford Policy Management 10
Table 3.2: Agriculture’sa share of total GoU and donor funded budget
b allocations
2000/01 to 2009/10
Year GoU-funded% GoU and donor funded % 2000/01 1.6 4.5 2001/02 2.6 5.1 2002/03 2.3 4.8 2003/04 2.1 3.2 2004/05 2.0 3.4 2005/06 3.0 4.0 2006/07 3.0 3.6 2007/08 (proj.) 3.1 4.1 2008/09 (proj.) 3.5 4.3 2009/10 (proj.) 5.1 5.5
Source: MFPED Budget statements and (2007) National Budget Framework Paper
Note: a. Essentially MAAIF and its autonomous agencies (NARO, NAADS etc.) but excluding forestry
b. „GoU–funded‟ expenditure includes donor funds provided as budget support. „GoU and donor –funded‟ budget allocations also includes donor funding of specific projects. It is, of course, impossible to determine the amount of total donor budget support allocated to the agriculture sector because it is part of a common pot along with donor support allocated to other sectors together with all domestically financed support.
Although it is of little consolation to those concerned with the continuing low level of public investment in the agriculture sector, Uganda‟s experience in this regard is not out of line with many other countries in the region (Akroyd and Smith, 2007). A common feature in most countries is that there are political and other challenges that make it difficult to increase public spending on agriculture. A recent listing of these challenges by Birner and Palaniswamy (2006), all with relevance to Uganda, includes:
Lack of voice of small farmers and the rural poor in the political decision-making process;
Challenges for parliamentarians who represent the rural poor to influence the budgetary process;
Fiscal constraints;
An image of agriculture as a “backward sector”;
Lack of knowledge about the potential role of agriculture as an engine of pro-poor growth;
Negative experience with past investments in agriculture that were ineffective due to governance problems;
A short time horizon for policy-makers and politicians; and
Demands from other sectors which are perceived to be more urgent/ deserving.
3.2 Disaggregated expenditure allocations
3.2.1 MAAIF’s recurrent budget
MAAIF‟s recurrent Votes. The recurrent budget for agricultural activities under the
control of MAAIF is channelled through a variety of Votes. In 2001/02 there were three Votes, but one Vote (050) was sub-divided into two headings:

Uganda Agriculture Sector Public Expenditure Review Phases 1 and 2
Oxford Policy Management 11
010 Agriculture, Animal Industries and Fisheries
142 National Agricultural Research Organisation (NARO)
050 District Agricultural Extension
050 National Agricultural Advisory Services (NAADS). In 2002/03 Vote 050 was re-designated as Vote 500 and in 2003/04 was sub-divided into Votes 501-580 with a separate Vote for each district. In 2005/06 an additional Vote (152) was created for the NAADS Secretariat and in 2006/07 two additional Votes were formed for the Uganda Cotton Development Organisation (Vote 155) and the Uganda Coffee Development Authority (Vote 160). The approved budget allocations for these various Votes for the period 2001/02 to 2006/07 are shown in Table 3.3. It may be noted in Table 3.3 that only Vote 010 (Agriculture, Animal Industry and Fisheries) and Vote 501-580 (District Agricultural Extension) have recurrent votes for wages. Funds for wages for the other organisations tend to come from their development budgets or as subventions from the recurrent budget of Vote 010 (see later). No satisfactory reason for this procedure was given to the Study Team. With this caveat, the recorded wage bill, in constant prices, has remained relatively constant over the period 2001/02 to 2005/06. The non-wage component fell in real terms from 2001/02 to 2003/4 but has shown a marked increase since then. Some of the reasons for this are explained in the detailed examination of Vote 010 below. Table 3.3: Agriculture’s recurrent budget allocation in nominal and constant 2005/06 prices, 2001/02 to 2006/07 UShs bn
Vote 2001/02 2002/03 2003/04 2004/05 2005/06 2006/07
Wage Non-Wage Wage
Non-Wage Wage
Non-Wage Wage
Non-Wage Wage
Non-Wage Wage
Non-Wage
010 1.43 2.83 2.07 3.19 2.07 2.64 2.10 7.44 2.38 6.79 2.41 5.53
142 0.00 2.82 0.00 2.59 0.00 1.93 0.00 1.92 0.00 2.80 0.00 2.84
501-580 a 2.47 3.00 3.06 2.92 3.06 2.92 3.06 2.92 3.08 2.92 3.88 3.16
501-580 b 0.00 0.00 0.00 0.00 0.00 0.00 0.00 0.00 0.00 0.00 0.00 0.00
152 0.00 2.52 0.00 4.46
155 0.00 1.20
160 0.00 0.58
TOTAL 3.90 8.65 5.13 8.70 5.13 7.49 5.16 12.28 5.46 15.03 6.29 17.77
(nominal)
Constant 5.28 11.71 6.35 10.77 5.96 8.70 5.56 13.23 5.46 15.03 5.96 16.84
Source: MFPED Approved Budget Estimates
Notes: 010 Agriculture, Animal Industry and Fisheries
142 National Agricultural Research Organisation (NARO)
501-580 a District Agricultural Extension
501-580 b National Agricultural Advisory Services (Districts). All NAADS (Districts) budget is classified as „development‟ expenditure although increasingly its operations are recurrent.
152 NAADS Secretariat
155 Uganda Cotton Development Organisation
160 Uganda Coffee Development Authority
Uganda Agriculture Sector Public Expenditure Review Phases 1 and 2
Oxford Policy Management 12
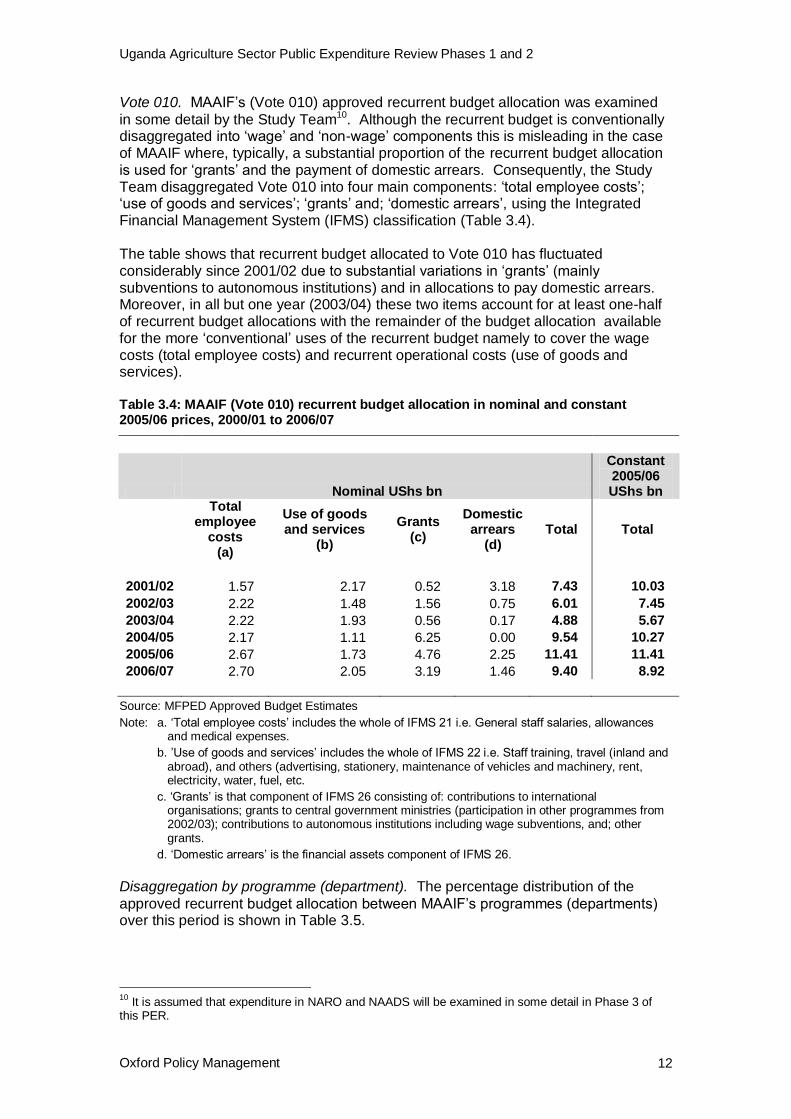
Vote 010. MAAIF‟s (Vote 010) approved recurrent budget allocation was examined
in some detail by the Study Team10. Although the recurrent budget is conventionally disaggregated into „wage‟ and „non-wage‟ components this is misleading in the case of MAAIF where, typically, a substantial proportion of the recurrent budget allocation is used for „grants‟ and the payment of domestic arrears. Consequently, the Study Team disaggregated Vote 010 into four main components: „total employee costs‟; „use of goods and services‟; „grants‟ and; „domestic arrears‟, using the Integrated Financial Management System (IFMS) classification (Table 3.4). The table shows that recurrent budget allocated to Vote 010 has fluctuated considerably since 2001/02 due to substantial variations in „grants‟ (mainly subventions to autonomous institutions) and in allocations to pay domestic arrears. Moreover, in all but one year (2003/04) these two items account for at least one-half of recurrent budget allocations with the remainder of the budget allocation available for the more „conventional‟ uses of the recurrent budget namely to cover the wage costs (total employee costs) and recurrent operational costs (use of goods and services). Table 3.4: MAAIF (Vote 010) recurrent budget allocation in nominal and constant 2005/06 prices, 2000/01 to 2006/07
Nominal UShs bn
Constant 2005/06 UShs bn
Total employee
costs (a)
Use of goods and services
(b)
Grants (c)
Domestic arrears
(d) Total Total
2001/02 1.57 2.17 0.52 3.18 7.43 10.03
2002/03 2.22 1.48 1.56 0.75 6.01 7.45
2003/04 2.22 1.93 0.56 0.17 4.88 5.67
2004/05 2.17 1.11 6.25 0.00 9.54 10.27
2005/06 2.67 1.73 4.76 2.25 11.41 11.41
2006/07 2.70 2.05 3.19 1.46 9.40 8.92
Source: MFPED Approved Budget Estimates
Note: a. „Total employee costs‟ includes the whole of IFMS 21 i.e. General staff salaries, allowances and medical expenses.
b. ‟Use of goods and services‟ includes the whole of IFMS 22 i.e. Staff training, travel (inland and abroad), and others (advertising, stationery, maintenance of vehicles and machinery, rent, electricity, water, fuel, etc.
c. „Grants‟ is that component of IFMS 26 consisting of: contributions to international organisations; grants to central government ministries (participation in other programmes from 2002/03); contributions to autonomous institutions including wage subventions, and; other grants.
d. „Domestic arrears‟ is the financial assets component of IFMS 26.
Disaggregation by programme (department). The percentage distribution of the
approved recurrent budget allocation between MAAIF‟s programmes (departments) over this period is shown in Table 3.5.
10
It is assumed that expenditure in NARO and NAADS will be examined in some detail in Phase 3 of this PER.

Uganda Agriculture Sector Public Expenditure Review Phases 1 and 2
Oxford Policy Management 13
„Headquarters‟ typically absorbs the largest share of the approved recurrent budget. In part, this is because funds for the payment of domestic arrears are channelled through Headquarters. These payments can be large both in absolute terms and as a proportion of the total recurrent budget (Table 3.4). In 2004/05, however, their share was disproportionately low when the budget allocation for the Crop Production Department was dramatically raised. The Headquarters‟ share of the recurrent budget allocation declined to 37-38 percent in 2005/06-2006/07 and to 27 percent of the approved recurrent budget in 2007/08. Table 3.5: Percentage distribution of MAAIF’s (Vote 010) approved recurrent budget allocation to programmes, 2000/01-2007/08
MAAIF Department 2000 /01
2001 /02
2002 /03
2003 /04
2004 /05
2005 /06
2006 /07
2007 /08
01 Headquarters 43 60 46 37 13 37 38 27
02 Directorate of Crop Resources 2 1 1 2 1 1 0 1
03 Farm Development Department 7 5 7 8 11 9 12 14
04 Crop Protection Department 11 7 9 11 5 7 9 10
05 Crop Production Department 6 4 5 5 41 13 2 3
Sub-total crops 26 17 22 24 57 29 23 27
06 Directorate of Animal Resources 3 3 4 4 7 12 13 15
07 Animal Production Department 6 4 7 7 9 8 10 12
08 Livestock Health & Entomology 10 6 8 9 5 5 6 8
09 Fisheries Resources Dept 6 6 8 10 5 5 6 8
Sub-total livestock 25 19 27 30 26 30 35 43
10 Department of Planning 6 4 5 8 3 2 4 3
Total Vote 010: actual UShs bn 4.71 7.43 6.01 4.88 9.54 11.41 9.40 8.62 : constant 2005/06 prices UShs bn 6.71 10.03 7.45 5.67 10.27 11.41 8.92 n.a
Source: MFPED Approved Budget Estimates
Note: „a‟ for the purposes of recurrent budgeting MAAIF uses the terms „programme‟ and „department‟ interchangeably.
The crops programmes (02-05) typically receive around one-quarter of the recurrent budget allocation. Within this total in recent years the allocation to the Farm Development Department has increased at the expense of the Crop Production Department. At the start of the period, the livestock programmes (06-09) received a similar share of the recurrent budget to the crops programmes (i.e. approximately one-quarter). However, in recent years this share has increased markedly to 30 percent in 2005/06, 35 percent in 2006/07 and 43 percent in the 2007/08 budget allocation. Much of this increase is being allocated to the Directorate of Animal Resources and the Department of Animal Production. The Department of Planning, which received around 6 percent of the allocation at the start of the period, has seen its share fall in recent years, while its UShs allocation has fallen in real terms. Grants. „Grants‟ have also been an important component of the Vote 010 recurrent
budget in recent years especially from 2003/4 onwards (Table 3.4). As shown in Table 3.6 these „grants‟ are mainly in the form of subventions, both wage and non-wage, to autonomous institutions On average these subventions accounted for 75 per cent of „grants‟ over the period 2001/02 to 2006/07.

Uganda Agriculture Sector Public Expenditure Review Phases 1 and 2
Oxford Policy Management 14
Table 3.6: Allocation of ‘grants’ in MAAIF’s (Vote 010) approved recurrent budget to functions UShs bn 2001/02-2006/07
Function 2000/ 01
2001/ 02
2002/ 03
2003/ 04
2004/ 05
2005/ 06
Av. 2001/02 to 2006/07
1. Other grants 0.00 0.00 0.24 0.24 0.24 0.21 0.15
2. Contributions to Int. Organisations 0.22 0.21 0.13 0.08 0.24 0.29 0.20
3. Grants to Central Govt. Ministries a 0.09 1.31 0.14 0.14 0.15 0.15 0.33
4. Contributions to autonomous inst. 0.00 0.00 0.01 3.01 2.14 1.02 1.03
5. Contributions to autonomous inst. (wage subventions)
0.03 0.03 0.03 2.77 1.99 1.51 1.06
6. PAF transfers 0.17 0.00 0.00 0.00 0.00 0.00 0.03
TOTAL GRANTS 0.52 1.56 0.56 6.25 4.76 3.19 2.81
Source: MFPED Approved Budget Estimates
Note: „a‟ After 2002/03 this is „Participation in other programmes‟.
The main programmes used to channel large subventions (Table 3.7) were:
Crop Production Department (2004/05 to 2005/06). These were used to finance the NAADS Secretariat before it was allocated a separate Vote.
Directorate of Animal Resources (2004/05 to2006/07) to support the National Animal Genetic Resource Centre and Databank (NAGRC&DB).
Department of Animal Production (2004/05 to2006/07) to finance the Dairy Development Authority.
Department of Farm Production (2004/05 to2006/07) to fund the PMA Secretariat and, in 2006/07, a contribution to the Inter-Governmental Authority on Drought and Development (IGADD).
Department of Livestock Health and Entomology (2006/07) to fund the Coordinating Office for the Control of Trypanosomosis in Uganda (COCTU).
Table 3.7: Allocation of ‘grants’ in MAAIF’s (Vote 010) approved recurrent budget to programmes UShs bn 2001/02-2006/07
MAAIF Department 2001/ 02
2002/ 03
2003/ 04
2004/ 05
2005/ 06
2006/ 07
Av. 2001/02 to 06/07
01 Headquarters 0.02 1.1 0.25 0.25 0.25 0.22 0.35
02 Dir. of Crop Resources 0.02 0.02 0.02 0.02 0.02 0 0.02
03 Farm Development Dept 0.01 0.04 0.01 0.70 0.75 0.78 0.38
04 Crop Protection Dept 0.08 0.06 0.02 0.01 0.04 0.04 0.04
05 Crop Production Dept 0.04 0.03 0.01 3.78 1.27 0.03 0.86
06 Dir. of Animal Resources 0.17 0.15 0.15 0.65 1.35 1.15 0.6
07 Animal Production Dept 0.01 0.01 0 0.61 0.66 0.57 0.31
08 Livestock Health and Ent. 0.03 0.02 0.01 0.17 0.25 0.23 0.12
09 Fisheries Resources Dept 0.13 0.12 0.09 0.07 0.17 0.17 0.13
10 Dept of Planning 0.01 0.01 0 0 0 0 0
TOTAL 0.52 1.56 0.56 6.25 4.76 3.19 2.81
Source: MFPED Approved Budget Estimates

Uganda Agriculture Sector Public Expenditure Review Phases 1 and 2
Oxford Policy Management 15
In addition, subventions were made through: Headquarters (2004/05 to 2006/07) to fund the Agricultural Attaché to FAO Rome; Directorate of Crop Resources (2004/05 and 2005/06) for Political Assistants to Ministers; and, Crop Protection to the Desert Locust Control Organisation – East Africa (DLCO-EA). Employment costs. As mentioned earlier, employment costs and use of goods and services represent less than one-half of the total recurrent budget in all but one year (2003/04). Employment costs rise steadily but slowly in nominal prices but are relatively stable in constant 2005/06 prices. Table 3.8 shows that in 2001/02, Headquarters was allocated the largest share of employment costs (27 percent) with no other department being allocated more than 14 percent. However, there has been a substantial increase in the employment cost allocation to Crop Protection, particularly from 2005/06, due to the recruitment of 32 crop inspectors in 2003/0411 to spearhead the GoU's programme to become EUREPGAP-compliant. This recruitment accounted for virtually the whole of the increase in total employment costs for Vote 010 in the period under consideration. Table 3.8: Percentage allocation of employment costs in MAAIF’s (Vote 010) approved recurrent budget to programmes 2001/02-2006/07
MAAIF Department 2001/ 02
2002/ 03
2003/ 04
2004/ 05
2005/ 06
2006/ 07
Av. 2001/02 to 06/07
01 Headquarters 27.0 25.1 18.2 16.1 18.1 19.1 20.2
02 Dir. of Crop Resources 1.8 1.3 1.2 1.1 1.0 1.0 1.2
03 Farm Development Dept 10.9 12.0 11.3 11.4 10.1 9.8 10.9
04 Crop Protection Dept 12.8 11.4 14.9 16.2 25.1 24.9 18.3
05 Crop Production Dept 4.4 5.2 4.8 4.9 4.2 4.2 4.6
06 Dir. of Animal Resources 1.2 1.2 1.1 1.2 1.3 1.3 1.2
07 Animal Production Dept 8.7 13.6 10.0 10.1 8.7 8.7 9.9
08 Livestock Health & Entomology 11.7 10.4 10.7 10.9 9.7 9.6 10.4
09 Fisheries Resources Dept 13.4 12.5 14.9 15.1 13.4 13.3 13.7
10 Dept of Planning 7.9 7.1 12.8 13.1 8.3 8.4 9.6
Total actual UShs bn 1.57 2.22 2.22 2.18 2.67 2.70 2.26
Source: MFPED Approved Budget Estimates
Expenditure on goods and services. The budget allocation for use of goods and
services has been extremely variable, falling by more than half between 2001/02 to 2004/05 before beginning to increase again after that (Table 3.9). By far the largest proportion of the budget for goods and services is allocated to Headquarters, which accounted for over half the budget allocation over the six-year period 2001/02 to 2006/07. It is recommended that the use of these funds is examined in detail in Phase 3. No other department received, on average, more than 9 percent of the budget allocation over this period.
11
This recruitment was not funded in the approved budgets in 2003/04 and 2004/05 but was funded in the revised budgets for those years. See Table 3.15.

Uganda Agriculture Sector Public Expenditure Review Phases 1 and 2
Oxford Policy Management 16
Table 3.9: Percentage allocation of expenditure on goods and services to programmes in MAAIF’s (Vote 010) approved recurrent budget 2001/02-2006/07
MAAIF Department 2001/ 02
2002/ 03
2003/ 04
2004/ 05
2005/ 06
2006/ 07
Av. 2001/02 to 06/07
01 Headquarters 39.6 25.4 50.0 55.9 72.9 69.1 52.5
02 Dir. of Crop Resources 1.8 2.4 1.7 0.8 0.8 0.7 1.4
03 Farm Development Dept 7.4 7.2 6.2 5.5 3.4 3.8 5.6
04 Crop Protection Dept 10.9 14.0 9.5 8.5 4.2 6.0 8.8 05 Crop Production Dept 8.4 11.2 7.7 6.6 4.7 2.7 6.7 06 Dir. of Animal Resources 1.4 3.8 2.2 2.2 1.7 1.0 2.0 07 Animal Production Dept 6.5 8.5 5.6 4.8 2.9 5.2 5.6 08 Livestock Health and Ent. 10.9 14.4 8.8 7.7 4.6 3.7 8.2 09 Fisheries Resources Dept 3.6 5.2 3.3 3.8 2.1 2.7 3.4 10 Dept of Planning 7.9 7.9 5.1 4.1 2.7 5.1 5.6
Total actual UShs bn 2.17 1.48 1.93 1.11 1.73 2.05 1.74
Source: MFPED Approved Budget Estimates
Wage: non-wage ratio An important parameter of the likely effectiveness of budget allocations is the ratio of wage to non-wage allocations or, in this study, the ratio of employment costs to expenditure on the use of goods and services. This is because a high ratio typically means that there are insufficient operational funds available to undertake activities that are essential to the proper performance of the department or programme. This is particularly true of activities that should involve travel and field trips. In aggregate, the ratio of total employee costs to the sum of expenditure allocated for employee costs plus the purchase goods and services allocation varies from 42 per cent in 2001/02 to 66 per cent in 2004/05 (Table 3.10). The weighted average over the six-year period 2001/02 to 2006/07 is 59 per cent. This is a reasonable ratio, suggesting that MAAIF should be able to operate effectively. However, this is deceptive, because the ratio is biased by the low wage: non-wage ratio in Headquarters, which accounts for a significant proportion of the recurrent budget allocation for expenditure on goods and services. In some other departments, the ratio of employment costs to funds available for goods and services is extremely high. This is particularly true of the Fisheries Resource Department where, over the six-year period, on average 84 per cent of the funds allocated for „employment costs and operational expenditure‟ has been absorbed by employment costs alone. Several other departments have averages above or around the 70 percent with the figure exceeding 80 percent in some years.

Uganda Agriculture Sector Public Expenditure Review Phases 1 and 2
Oxford Policy Management 17
Table 3.10: Employment costs as a percentage of total employment costs and use of goods and services in the approved recurrent budget allocation2001/02 to 2006/07.
MAAIF Department 2001/ 02
2002/ 03
2003/ 04
2004/ 05
2005/ 06
2006/ 07
Av. 2001/02 to 06/07
Headquarters 33.1 59.7 29.5 36.1 27.8 26.6 33.2
Directorate of Crop Resources 42.5 45.0 43.9 73.6 65.8 64.8 52.7
Farm Development Department 51.7 71.5 67.7 80.3 82.0 77.3 71.6
Crop Protection Department 45.9 55.1 64.4 78.8 90.2 84.4 73.0
Crop Production Department 27.6 41.3 42.0 59.2 58.0 66.8 47.0
Directorate of Animal Resources 38.8 32.7 36.9 50.4 53.3 62.1 44.6
Animal Production Department 49.1 70.5 67.4 80.6 82.2 68.7 69.7
Livestock Health and Entomology 43.9 52.0 58.5 73.5 76.6 77.4 62.1
Fisheries Resources Department 72.9 78.4 83.9 88.7 90.9 86.5 84.1
Department of Planning 41.9 57.5 74.4 86.2 82.6 68.6 69.0
Weighted average 42.0 60.0 53.5 66.3 60.7 56.8 59.0
Source: MFPED Approved Budget Estimates
Departments with a high wage: non-wage ratio will be particularly disadvantaged by any shortfall in releases relative to the budget allocation as the shortfall will have to be absorbed by the non-wage component. The recurrent budget allocation both to and within MAAIF merits more investigation in Phase 3 of this study, in particular:
The reasons for the high proportion of the recurrent budget and funds for the purchase of goods and services allocated to Headquarters;
The criteria used for allocating the non-wage component of the allocation between programmes;
Whether the operational effectiveness of the various programmes is affected by a high wage; non-wage ratio or whether this ratio is set in the knowledge that a proportion of development budget funds are used to finance recurrent costs.
3.2.2 MAAIF’s development budget
Overall development budget allocations. The Study Team‟s estimate of MAAIF‟s
total development budget allocations for the period 2001/02 to 2005/06 is shown in Table 2.1. Approximately 70 percent of this allocation is to MAAIF‟s (Vote 010). Most of the remainder is allocated to NARO (Vote 142) and, increasingly, to NAADS (Districts) (Votes 501-580). MAAIF‟s (Vote 010) approved development budget from 2000/01 to 2006/07 is shown in Table 3.11 in actual and constant 2005/06 prices disaggregated into the direct donor-financed component (donor funding of specific projects) and the domestic-financed component, which incorporates donor budget support funds. In actual prices, the total Vote 010 development budget was at its highest in 2001/02 at UShs 90bn, subsequently declining to UShs58 bn in 2004/05 and UShs56 bn in 2006/07 after a rise to UShs 76bn in 2005/06. In constant 2005/06 prices, the decline from a peak of UShs 122bn in 2001/02 to UShs 53bn in 2006/07 is even more marked.

Uganda Agriculture Sector Public Expenditure Review Phases 1 and 2
Oxford Policy Management 18
Table 3.11: Approved donor- and domestic-financed development budget allocations to MAAIF (Vote 010) 2000/01-2006/07, in actual and constant 2005 UShs bn
Source of funds 2000/01 2001/02 2002/03 2003/04 2004/05 2005/06 2006/07
Actual prices
Donor 54.72 61.37 60.99 42.35 47.55 51.71 48.88
Domestic 8.00 28.76 21.95 21.36 10.72 24.31 7.08
Total 62.72 90.13 82.94 63.71 58.27 76.02 55.69
Constant 2005/06 prices
Donor 71.70 83.10 75.48 49.19 51.22 51.71 46.33
Domestic 10.48 38.94 27.16 25.50 11.55 24.31 6.71
Total 82.19 122.04 102.64 74.69 62.77 76.02 52.78
Source: MFPED Approved Budget Estimates.
Note: Total development budget allocations for MAAIF, including NARO and NAADS Secretariat for 2001/02 to 2005/06 (Table 2.1) were:
2001/02 2002/03 2003/04 2004/05 2005/06 Actual UShs bn 127.85 126.16 90.66 85.06 106.07 Constant 2005/06 prices 173.11 157.20 106.33 92.63 106.07
In both actual and constant 2005/06 prices, there is a distinct fall in direct donor allocations to the development budget after 2002/03. In constant 2005/06 prices, in the 3 year period 2000/01 to 2002/03, direct donor contributions averaged UShs 77bn, but in the ensuing 3-year period this fell to UShs 51bn and to UShs 46bn in 2006/07. There is no evidence of any consistent pattern of domestic-financed funds increasing for MAAIF (Vote 010) development to compensate for the decline in direct-donor financing, but this should be viewed in the context of the substantial increase in domestic-financed support (including basket funding by donors) for NAADS (District) support, which is not part of Vote 010. Commodity classification. Table 3.12 shows MAAIF total development budget allocations for the period 2001/02-2005/06 disaggregated by direct donor- and domestic-financing and by crops, livestock, fish and other categories12. The table shows that in recent years around two-thirds of MAAIF (Vote 010) development project funds have been allocated to the „crops‟ sub-sector. To put this in context, it has been estimated that food crops account for 65 percent of COFOG-defined agriculture GDP and cash crops account for a further 11 percent (MAAIF, 2006). The livestock sub-sector, which accounts for 13 percent of COFOG-
12
This analysis uses the MFPED Aid Liaison Department databank of PIP project funding. Projects are classified by Agency (Vote), sector and sub-sector. Databank entries start in 2001/02 but are incomplete for 2006/07 and thus analysis only extends to 2005/06. Estimates of donor allocations (and disbursements) rely on information provided by development partners. There are some discrepancies between „approved‟ budget estimates and databank budget allocations, which appear to stem from the databank using „revised‟ budget allocations rather than approved. The extent of the discrepancies is shown below (all figures in UShs bn).
2001/02 2002/03 2003/04 2004/05 2005/06
Direct donor-finance
MFPED databank 57.54 60.28 41.15 46.19 51.71
Approved budget allocation 61.37 60.99 42.35 47.55 51.71
Domestic finance
MFPED databank 36.93 33.85 22.77 13.17 31.62
Approved budget allocation 28.76 21.95 21.36 10.72 24.31

Uganda Agriculture Sector Public Expenditure Review Phases 1 and 2
Oxford Policy Management 19
agriculture GDP has had a variable level of expenditure but its average over the 5 years is approximately in line with its contribution to GDP. The fish sub-sector has received proportionately more development funds than its 6 percent of COFOG-agriculture GDP, perhaps because of the emphasis that has been placed in recent years on improving the fish landing and processing facilities to exploit the potential provided by fish exports. Table 3.12: Allocation of donor- and GoU-financed development funds to MAAIF (Vote 010), 2001/02-2005/06
Sub-sector 2001/02 2002/03 2003/04 2004/05 2005/06
UShs bn
Crops
Donor 34.18 31.63 24.40 27.81 27.58
GoU 23.14 20.81 18.15 10.79 26.26
Total 57.31 52.44 42.54 38.60 53.84
% of project total 60.7 55.7 66.6 65.0 64.6
Livestock
Donor 17.52 0.24 3.65 7.20 17.72
GoU 8.52 0.30 2.83 1.54 3.88
Total 26.04 0.55 6.48 8.73 21.59
% of project total 27.6 0.6 10.1 14.7 25.9
Fish
Donor 5.84 28.00 12.85 10.49 5.94
GoU 5.27 8.22 1.76 0.82 1.36
Total 11.11 36.21 14.60 11.31 7.29
% of project total 11.8 38.5 22.8 19.1 8.8
Other
Donor 0.00 0.41 0.25 0.69 0.48
GoU 0.00 0.36 0.04 0.02 0.12
Total 0.00 0.77 0.30 0.71 0.60
% of project total 0.0 0.8 0.5 1.2 0.7
All Vote 010 projects
Donor 57.54 60.28 41.15 46.19 51.71
GoU 36.93 33.85 22.77 13.17 31.62
Total 94.46 94.13 63.92 59.36 83.33
Source: MFPED Aid Liaison Department database
Note: See footnote 12 regarding the construction, use and analysis of this databank.
Economic classification of development expenditure. Table 3.13 presents the summary of a detailed analysis carried out of all COFOG agriculture projects on the MFPED database for the four-year period for which budget allocations have been classified using the Integrated Financial Management System (IFMS), which was introduced at the start of the 2003/04 financial year13. The pattern of budgeted expenditure hardly changed over the four-year period14, with an average of approximately 14 percent being spent on employee costs, a little more than half on other „operational‟ costs such as supplies, vehicle and office running costs, staff training and travel, and 32 percent on items classified as ‟capital expenditure‟. However, the annual averages show that the proportion of expenditure on salaries increased from 13 percent in 2003/04 to 16 percent in 2006/07, while capital expenditure dropped from 33 percent to 26 percent over the same period. This current situation is far removed from the time when „capital expenditure‟ and „development expenditure‟ were virtually synonymous, and demonstrates that the
13
It is therefore impossible to break down and analyse budgeted expenditure allocations for 2001/02 to 2002/03 for which detailed project expenditure information is available from MFPED. Nevertheless, a useful foundation has been laid for analysis in future years. 14
The annual data have not been deflated which would have enabled a more accurate average to be calculated. However, given the short analysis period and the relatively low rate of change in the GDP deflator over this period, the average shown in Table 3.13 is believed to be a fair reflection of reality.

Uganda Agriculture Sector Public Expenditure Review Phases 1 and 2
Oxford Policy Management 20
separation of „recurrent‟ and „development‟ spending is not being properly applied in practice. This is a worrying trend that will need to be monitored closely. Table 3.13: Economic classification of COFOG agriculture development budget allocations, 2003/04 to 2006/07
Item IFMS Item Code GoU Donor Total
% % %
Employee costs of which: 21 23.5 10.4 14.4
Wages and salaries 211101 / 02 17.3 4.6 8.6
Allowances 211103 6.1 5.7 5.8 Total other operational costs of which: 2 (excl.21) 44.7 57.2 53.5
Staff training 221003 1.2 5.4 4.1
Vehicle O&M 227004 / 228002 4.8 4.5 4.1
Travel & transport 227 2.9 0.6 1.3
Supplies and services 224 27.1 17.9 20.7 Capital expenditure 3 31.8 32.4 32.2
Source: MFPED Aid Liaison Department database
It is interesting to note that allowances account for a high proportion of total staff costs – between 35 percent and 41 percent of the total – although no trend can be discerned over the four years. It is not clear what is contained within this category or whether allowances are distributed between staff in similar proportions as salaries. More striking, however, is the discrepancy in the proportion of staff costs consumed by allowances, between GoU (26 percent) and donor funds (55 percent). The reasons for this are not clear and deserve further study.
3.2.3 Recurrent and development budgets
Some „projects‟ have been in existence for many years and are now financed entirely by Government funds. At least four of these are regular, on-going MAAIF activities that could, and should, be funded from the recurrent budget, namely:
Development of national early warning system and statistics;
Support for institutional development;
Supervision, monitoring and evaluation, and;
Support for tea and cocoa. In 2005/06, the total budget allocation to these four projects was UShs 3.4bn, or approximately 4 percent of the Vote 010 total development budget. However, the regulatory and supervisory nature of much of MAAIF‟s mandate requires an assured source of recurrent operational expenditures for effective implementation of these activities. MAAIF need to emphasise the importance of these activities when presenting their budget framework paper and in subsequent negotiations relating to the budget. They also need to ensure that those departments and programmes undertaking essential regulatory and supervisory activities receive sufficient funds from the budget allocation to undertake them effectively.

Uganda Agriculture Sector Public Expenditure Review Phases 1 and 2
Oxford Policy Management 21
3.3 Planned versus actual agricultural sector expenditure
The relationship between planned and actual expenditure is an indicator of the effectiveness of the budget in allowing departments and programmes to plan their activities and deliver public services for the year, as expressed in policy statements, output commitments and work plans. Typically, in assessing aggregate budget performance the original approved budget allocations are taken as the measure of „planned‟ expenditure‟ as, in principle, this should be the basis used by ministries, departments and agencies (MDAs) in deciding on their programmes of work. Deviations of actual from planned expenditure can stem from at least four sources:
The extent to which budget allocations misjudged requirements in the first place;
Readjustments in budget allocations after the „approved‟ allocations have been announced. These could result from:
- The need for MFPED to accommodate fresh calls on the budget from other Votes;
- Effective negotiations to increase the MDAs budget in line with perceived requirements;
The non-release of budgeted funds („approved‟ or „revised‟) due to revenue shortfalls or further unforeseen calls on available funds; and,
The untimely release of funds required for seasonally-determined uses. Recurrent expenditure. Table 3.14 shows the approved and revised recurrent budget
allocations for MAAIF (Vote 010) and actual recurrent expenditure for the period 2000/01-2005/06 in UShs bn. It indicates that the actual expenditure was below the approved budget allocation in three of the six years, but above it in the other three. The Table also shows an upward revision in the recurrent budget allocation from the approved allocation in all years but, with the exception of 2003/04, actual expenditure is below the revised budget allocation. Table 3.14: Approved and revised recurrent budget allocations for MAAIF (Vote 010) and actual recurrent expenditure, 2000/01-2005/06, in UShs bn
2000/01 2001/02 2002/03 2003/04 2004/05 2005/06
Approved 4.71 7.36 6.01 4.88 9.54 11.41
Revised 4.73 7.61 6.34 5.89 12.19 12.19
Actual 4.01 6.05 6.22 7.83 11.32 10.31
Source: MFPED Approved Budget Estimates and Auditor General‟s Reports
Table 3.15 examines the actual recurrent expenditure for MAAIF (Vote 010) programmes (departments) as a percentage of the approved recurrent allocations for each of the years 2000/01 to 2005/06. In the table figures showing a variation of more than 15 percent between approved and revised allocations are shaded. It can be seen that in three of the past six years total actual recurrent expenditure has varied by more than 15 percent from the total approved recurrent allocations. In two years (2003/4 and 2004/05), the variation between total actual and total planned recurrent expenditure was due mainly to actual expenditure in two programmes (Headquarters and Crop Protection) being more than double the original budget

Uganda Agriculture Sector Public Expenditure Review Phases 1 and 2
Oxford Policy Management 22
allocation15. In 2001/02 actual expenditure was well below the approved budget allocation with most programmes showing large downward deviations from approved budget expenditure. Table 3.15: Actual recurrent expenditure as a percentage of approved recurrent budget allocations for MAAIF programmes 2000/01-2005/06
2000/01 2001/02 2002/03 2003/04 2004/05 2005/06
01 Headquarters 88.1 80.2 122.1 241.7 206.7 81.4
02 Directorate of Crop Resources 83.9 77.0 94.4 85.0 96.2 75.8
03 Farm Development Department 89.2 78.1 100.2 93.7 103.4 97.1
04 Crop Protection Department 75.7 113.2 87.6 235.3 219.0 91.0
05 Crop Production Department 83.6 74.2 80.2 79.0 99.7 97.2
06 Directorate of Animal Resources 92.1 93.9 95.1 91.0 97.6 100.0
07 Animal Production Department 90.7 74.1 90.6 89.0 98.6 100.0
08 Livestock Health and Entomology 78.9 73.4 84.4 84.7 96.5 100.3
09 Fisheries Resources Department 82.5 89.8 77.7 91.0 94.0 74.9
10 Department of Planning 82.9 72.5 84.1 84.0 95.8 96.5
Weighted average 85.2 82.1 103.5 160.5 118.7 90.4
Source: MFPED Approved Budget Estimates and Auditor General‟s Reports
The Study Team has also compared actual recurrent expenditure with the published revised recurrent budget allocations (Table 3.16) to see if there was a closer match between revised budget allocations and actual expenditure. In the case of Crop Protection there was a closer match in both 2003/04 and 2004/05, indicating that the budget allocation was revised to take account of the recruitment of the crop inspectors. However, there was still a massive overspend by Headquarters in 2003/04, but in 2004/05 there was over-compensation as actual expenditure was only 84 percent of the revised budget. The most noticeable feature of Table 3.16 is that virtually all programmes „underspend‟ every year. Whether this is the result of „voluntary‟ underspending by departments/ programmes; or overall shortfalls in MFPED releases as a result of the cash budget system and unforeseen calls on the aggregate budget, was not examined by the Study Team and merits further examination in Phase 3 of the study.
15
See the sub-section on Employment Costs associated with Table 3.8 for an explanation of the unbudgeted increase in the Crop Protection expenditure.

Uganda Agriculture Sector Public Expenditure Review Phases 1 and 2
Oxford Policy Management 23
Table 3.16: Actual recurrent expenditure as a percentage of revised recurrent budget allocations for MAAIF programmes, 2000/01-2005/06
2000/01 2001/02 2002/03 2003/04 2004/05 2005/06
01 Headquarters 87.3 79.7 110.4 212.9 84.1 68.6
02 Directorate of Crop Resources 83.9 77.0 94.4 85.0 93.0 75.8
03 Farm Development Department 89.2 78.1 91.7 93.7 96.7 97.1
04 Crop Protection Department 72.9 81.5 89.3 94.5 95.2 91.0
05 Crop Production Department 83.6 69.4 80.6 79.0 97.0 97.2
06 Directorate of Animal Resources 92.1 93.9 95.1 91.0 90.3 101.8
07 Animal Production Department 90.7 75.5 90.6 99.9 92.2 102.5
08 Livestock Health and Entomology 80.7 72.9 84.1 84.7 96.8 94.7
09 Fisheries Resources Department 82.5 89.8 77.4 91.0 99.1 74.9
10 Department of Planning 86.0 72.5 84.1 84.0 96.9 96.5
Weighted average 84.8 79.5 98.1 133.0 92.9 84.6
Source: MFPED Approved Budget Estimates and Auditor General‟s Reports
Development expenditure. There is a noticeable difference in the out-turn for direct
donor-financed development funds allocated to MAAIF (Vote 010) and for GoU-financed funds. The reasons for this are examined in Section 5, but Table 3.17 shows that over the 5-year period 2001/02-2005/06, direct donor-financed development disbursements were almost 60 percent below the budget allocation compared to a shortfall of 20 percent for GoU-financed development funds. Table 3.17: Disbursement / release of MAAIF (Vote 010) of donor- and GoU-financed development funds as a percentage deviation from development budget allocations, 2001/02-2005/06, in UShs bn
2001/02 2002/03 2003/04 2004/05 2005/06 Weighted average
Donor -64.3 -43.4 -49.0 -66.9 -65.6 -57.7
GoU -23.5 -21.1 -10.0 -26.5 -17.1 -19.5
Total -48.4 -35.4 -35.1 -57.9 -47.2 -44.3
Source: MFPED Aid Liaison Department databank
3.4 Allocations between central and local government
Local governments receive funding for providing agricultural services from a number of sources as detailed in Table 3.18. These include: unconditional grants (A1), for the wages of staff on the district payroll including some staff engaged in agriculture activities, conditional grants, donor and NGO funding and local revenue. Of these, the most significant sources are the conditional grants (Channels A2 and A3).
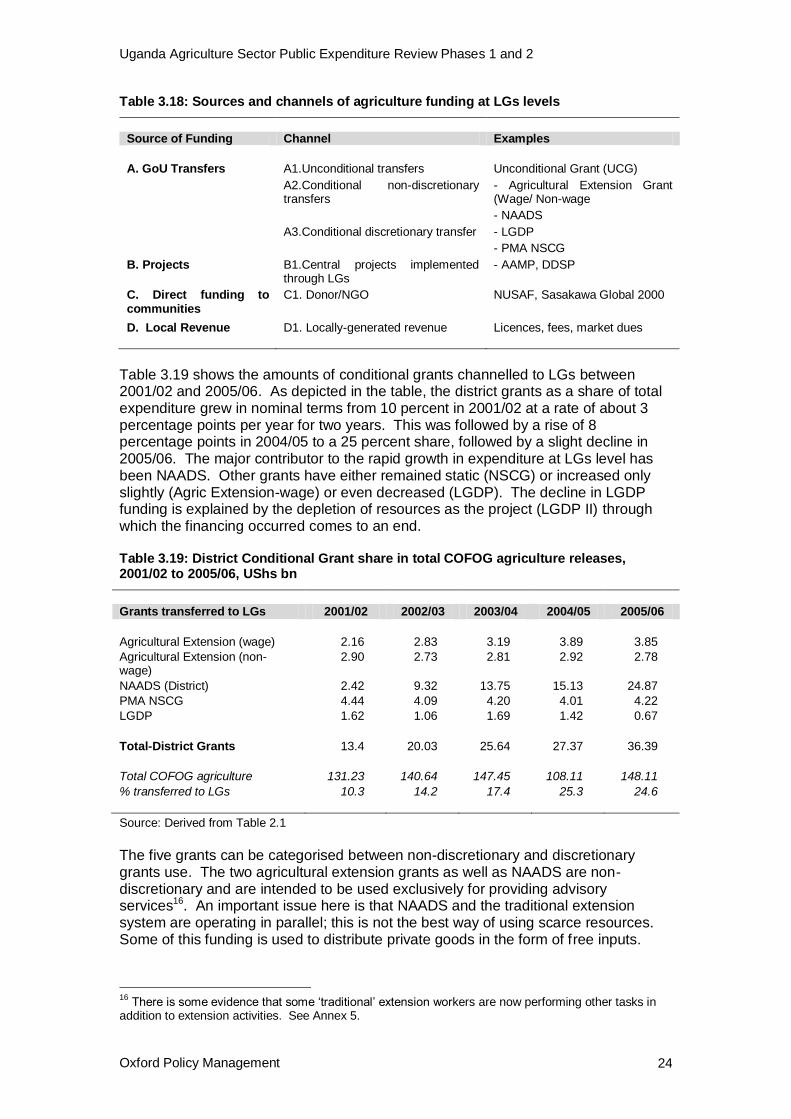
Uganda Agriculture Sector Public Expenditure Review Phases 1 and 2
Oxford Policy Management 24
Table 3.18: Sources and channels of agriculture funding at LGs levels
Source of Funding Channel Examples
A. GoU Transfers A1.Unconditional transfers Unconditional Grant (UCG)
A2.Conditional non-discretionary transfers
- Agricultural Extension Grant (Wage/ Non-wage
- NAADS
A3.Conditional discretionary transfer - LGDP
- PMA NSCG
B. Projects B1.Central projects implemented through LGs
- AAMP, DDSP
C. Direct funding to communities
C1. Donor/NGO
NUSAF, Sasakawa Global 2000
D. Local Revenue D1. Locally-generated revenue Licences, fees, market dues
Table 3.19 shows the amounts of conditional grants channelled to LGs between 2001/02 and 2005/06. As depicted in the table, the district grants as a share of total expenditure grew in nominal terms from 10 percent in 2001/02 at a rate of about 3 percentage points per year for two years. This was followed by a rise of 8 percentage points in 2004/05 to a 25 percent share, followed by a slight decline in 2005/06. The major contributor to the rapid growth in expenditure at LGs level has been NAADS. Other grants have either remained static (NSCG) or increased only slightly (Agric Extension-wage) or even decreased (LGDP). The decline in LGDP funding is explained by the depletion of resources as the project (LGDP II) through which the financing occurred comes to an end. Table 3.19: District Conditional Grant share in total COFOG agriculture releases, 2001/02 to 2005/06, UShs bn
Grants transferred to LGs 2001/02 2002/03 2003/04 2004/05 2005/06
Agricultural Extension (wage) 2.16 2.83 3.19 3.89 3.85
Agricultural Extension (non-wage)
2.90 2.73 2.81 2.92 2.78
NAADS (District) 2.42 9.32 13.75 15.13 24.87
PMA NSCG 4.44 4.09 4.20 4.01 4.22
LGDP 1.62 1.06 1.69 1.42 0.67
Total-District Grants 13.4 20.03 25.64 27.37 36.39
Total COFOG agriculture 131.23 140.64 147.45 108.11 148.11
% transferred to LGs 10.3 14.2 17.4 25.3 24.6
Source: Derived from Table 2.1
The five grants can be categorised between non-discretionary and discretionary grants use. The two agricultural extension grants as well as NAADS are non-discretionary and are intended to be used exclusively for providing advisory services16. An important issue here is that NAADS and the traditional extension system are operating in parallel; this is not the best way of using scarce resources. Some of this funding is used to distribute private goods in the form of free inputs.
16
There is some evidence that some „traditional‟ extension workers are now performing other tasks in addition to extension activities. See Annex 5.
Uganda Agriculture Sector Public Expenditure Review Phases 1 and 2
Oxford Policy Management 25
The Study Team was not able to ascertain the extent of this activity and this is an issue that warrants further consideration in Phase 3 of this review process. The PMA and LGDP grants are discretionary and have been used for a wide range of investments that address constraints related to poverty reduction, especially those affecting agricultural livelihoods. Analysis of the use of the PMA‟s NSCG in Section 2.2 shows that 75 percent of the expenditures to date have been COFOG agriculture relevant.
3.5 Budget allocations to different sub-sectors and alignment with the Poverty Eradication Action Plan (PEAP) priorities
One of the major reasons for drawing up the MAAIF Development Strategy and Investment Plan (DSIP) was for it to be used in guiding future planning in the sector. It was intended that it be used “in the prioritisation and definition of spending plans during the budgetary process each year” (MAAIF, 2006). Table 3.20 attempts to show how closely aligned the Ministry‟s annual budgets17
(including both development and recurrent costs and District grants which fall within the portfolio of MAAIF), have been with the projections made for the three years covered by the DSIP. From the table, it is clear that advisory services have been accorded a higher priority in practice than had been planned, while research allocations have been in line with the projections. Together, these two components of MAAIF‟s DSIP have been allocated 59 percent of the funds available, compared with the DSIP estimate of 48 percent. Both of these sub-sectors are accorded high priority in the PEAP. In the case of other priority areas there are notable discrepancies when average budget allocations over the three years are compared with the planned budget that appeared in the DSIP18. The most obvious is the high proportion of funds budgeted for physical infrastructure compared with the planned proportion – 15 percent compared with 5 percent; this can be explained in part by the delays in implementing the infrastructure component of a number of development projects. This back-log is being addressed by MAAIF, with a particular emphasis in the forthcoming budget as can be seen in Table 3.20. Worryingly, the emphasis given in the PEAP to disease control has not been reflected in the proportion of total funds allocated to it in MAAIF‟s annual budgets. Plant pest and disease control has received less than one percent of total resources, compared with the 5 percent planned for it, while the proportion of funding allocated to livestock disease control has fallen in each of the three years, even if the overall average is close to that projected in the DSIP.
17
The recurrent budget of the Ministry has been allocated on a pro-rata basis, in accordance with the proportion of the other funds allocated to each of the priority areas. This has been done due to the difficulty of allocating recurrent funds to the individual priority areas. 18
It should be noted that many of those involved with preparing the expenditure estimates for the sub-sectors that appear in the DSIP are the same personnel who have been closely involved in preparing the annual budgets for their sections / Departments / sub-sectors.

Uganda Agriculture Sector Public Expenditure Review Phases 1 and 2
Oxford Policy Management 26
Table 3.20: Proportion of the MAAIF budget allocated to the DSIP priority areas, compared to DSIP projections, 2005/06 to 2007/08 (in percent)
Budget allocations Av. over
the period DSIP av.
2005/06 2006/07 2007/08
Research 17 19 23 20 19
Advisory services 30 45 41 39 29
Livestock disease 9 7 4 7 6
Plant pest & disease 1 1 0 1 5
Livestock & fish regulatory services 2 2 2 2 5
Planning & policy 2 2 1 2 1
Institutional development 4 1 0 2 9
Water capacity building 3 4 4 4 10
Seed capacity development 9 3 3 5 8
Processing & marketing 7 2 2 3 3
Physical infrastructure 12 14 18 15 5
Promotion 3 1 1 2 1
Other 0 0 0 0 0
Source: MAAIF internal documents and discussions with MAAIF staff; MAAIF, 2006
The proportion of the budget allocated to each priority area varies considerably from one year to the next. Actual approved budgets are also less evenly-balanced than presented in the DSIP, with a greater concentration of resources in fewer priority areas: five priority areas account for 86 percent of MAAIF budget allocations over the three-year period, compared with 75 percent in the case of the DSIP. From this it can be concluded that the DSIP has not been used effectively as the basis for drawing up the sub-sector budgets, which detracts from the value of the document. It is hoped that the preparation of the second DSIP, covering the period 2008/09 to 2010/11 will include analysis of future budget requirements by programme and in relation to the resources available. It is also expected that the objectives and work plans for each of the priority areas will define clearly the components on which funds are to be spent and that these will be fully in line with the over-riding national development strategies and programmes, such as the PEAP and the PMA.

Uganda Agriculture Sector Public Expenditure Review Phases 1 and 2
Oxford Policy Management 27
4. Budget processes
4.1 Budget preparation
The main stages in the budget formulation process are shown in Box 4.1. From the viewpoint of the agriculture sector, the whole process, at least in principle, lasts nine months - from the national consultative meeting scheduled to be held in October, at which the MTEF ceilings are announced, to the reading of the Budget in June the following year. The main issues and problems identified by the Study Team relating to the current budget preparation process for the agriculture sector are discussed in the following Sections.
Box 4.1: The budget preparation process
Source: Adapted from Williamson, T (2003).
4.1.1 MTEF and budget ceilings
The MTEF should provide a reliable, rolling 3-year guide to overall, sector and sub-sector budget allocations. In practice, from year-to-year there are major changes to the MTEF ceilings in total and in the allocations to individual Sector Votes. This makes medium-term planning difficult to implement and undermines the predictability of the two outer years. Table 4.1 shows the agriculture sector MTEF and budget ceiling for FY 2007/08 as stated in annual National Budget Framework Papers (BFPs), Budget Speeches and Approved Budget Estimates from the time it was first announced in the BFP in March 2005 to the BFP in March 2007. It shows substantial variations both in the overall planning figure and in the individual sector components.
October: Draft Budget Ceilings
MFPED distributes Budget Call Circular (BCC) to all ministries, agencies etc. with inter- and intra-sector MTEF allocations
MFPED hosts a „Budget (Framework) Consultative Workshop November – December: Preparation of Sector Working Group Reports
SWGs use indicative budget ceilings to arrive at inter-sector allocations and prepare Sector Budget Framework Paper
January: Preliminary estimates
SBFP reports discussed with MFPED during ministerial consultations
Ministries and agencies prepare draft budget estimates on this basis March: National BFP to Cabinet and Parliament
MFPED compiles SBFPs into a National BFP; presented to Cabinet
When National BFP considered and approved, it is submitted to Parliament April-May: Parliament and Public Expenditure Review (PER)
The Budget Committee of Parliament discusses the NBFP and presents recommendations to the President and MFPED
National PER meeting is held at which the NBFP is discussed June: Finalisation of Budget.
On the basis of Parliamentary/ PER recommendations the proposed Budget and MTEF is amended
The Budget is read
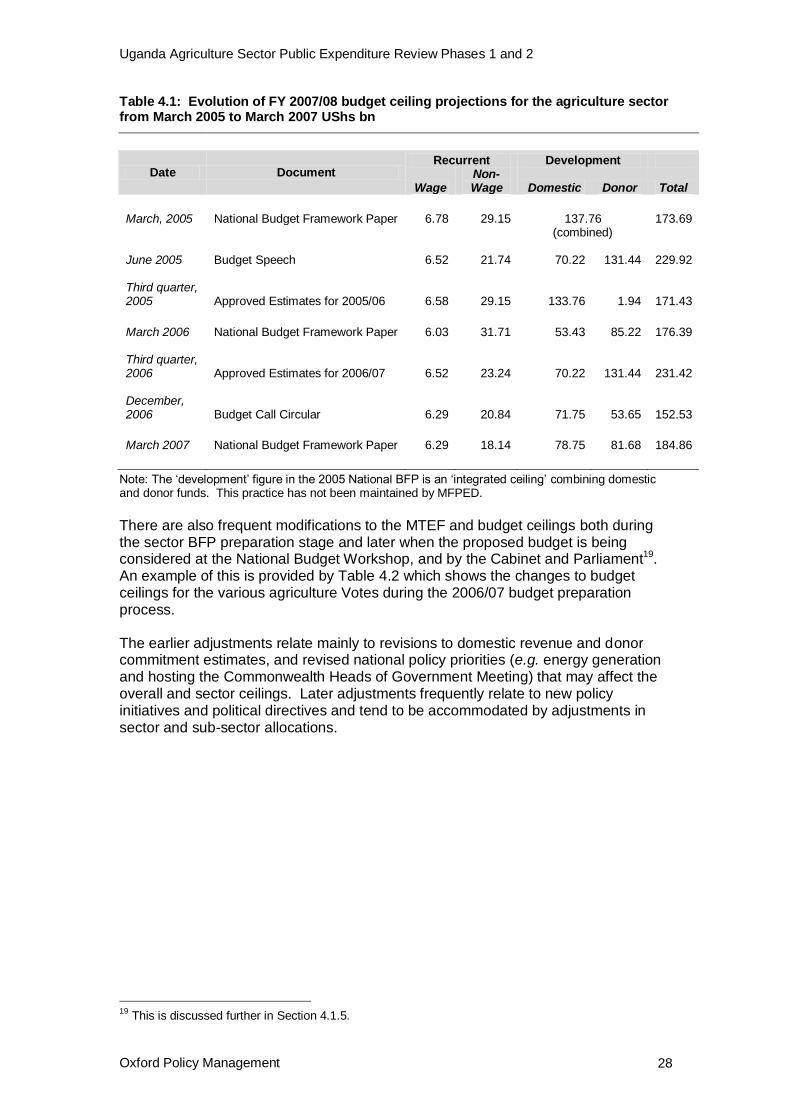
Uganda Agriculture Sector Public Expenditure Review Phases 1 and 2
Oxford Policy Management 28
Table 4.1: Evolution of FY 2007/08 budget ceiling projections for the agriculture sector from March 2005 to March 2007 UShs bn
Date Document Recurrent Development
Wage Non-Wage Domestic Donor Total
March, 2005 National Budget Framework Paper 6.78 29.15 137.76 173.69 (combined) June 2005 Budget Speech 6.52 21.74 70.22 131.44 229.92 Third quarter, 2005 Approved Estimates for 2005/06 6.58 29.15 133.76 1.94 171.43
March 2006 National Budget Framework Paper 6.03 31.71 53.43 85.22 176.39 Third quarter, 2006 Approved Estimates for 2006/07 6.52 23.24 70.22 131.44 231.42 December, 2006 Budget Call Circular 6.29 20.84 71.75 53.65 152.53
March 2007 National Budget Framework Paper 6.29 18.14 78.75 81.68 184.86
Note: The „development‟ figure in the 2005 National BFP is an „integrated ceiling‟ combining domestic and donor funds. This practice has not been maintained by MFPED.
There are also frequent modifications to the MTEF and budget ceilings both during the sector BFP preparation stage and later when the proposed budget is being considered at the National Budget Workshop, and by the Cabinet and Parliament19. An example of this is provided by Table 4.2 which shows the changes to budget ceilings for the various agriculture Votes during the 2006/07 budget preparation process. The earlier adjustments relate mainly to revisions to domestic revenue and donor commitment estimates, and revised national policy priorities (e.g. energy generation and hosting the Commonwealth Heads of Government Meeting) that may affect the overall and sector ceilings. Later adjustments frequently relate to new policy initiatives and political directives and tend to be accommodated by adjustments in sector and sub-sector allocations.
19
This is discussed further in Section 4.1.5.

Uganda Agriculture Sector Public Expenditure Review Phases 1 and 2
Oxford Policy Management 29
Table 4.2: Evolution of FY 2006/07 budget ceiling projections for the agriculture sector by Vote, in UShs bn
RECURRENT DEVELOPMENT TOTAL
Vote Agency Date Wage Non-wage GoU Donor
excl. Donor
incl Donor
010 MAAIF
05/06 Approved est. 2.49 4.93 34.23 38.08 41.65 79.73
Nov 2005 MTEF 2.37 6.79 26.28 60.18 35.45 95.63
April 2006 NBFP 2.38 5.53 8.86 57.74 16.08 73.81
June 06 Budget speech 2.41 5.53 7.08 48.88 15.03 63.91
142 NARO
05/06 Approved est. 13.36 7.4 6.31 20.76 27.07
Nov 2005 MTEF 10.58 12.2 5.53 22.78 28.32
April 206 NBFP 2.84 9.2 5.31 12.04 17.35
June 06 Budget speech 2.84 17.2 5.35 20.04 25.39
501-580
District Extension
05/06 Approved est. 3.21 3.2 6.41 6.41 Nov 2005 MTEF 3.21 3.15 6.36 6.36
April 206 NBFP 3.08 2.87 5.95 5.95
June 06 Budget speech 3.88 3.16 7.04 7.04
501-580
NAADS Districts
05/06 Approved est. 27.1 2.76 27.1 29.85
Nov 2005 MTEF 34.75 2.56 34.75 37.31
April 206 NBFP 24.75 2.47 24.75 27.21
June 06 Budget speech 37.13 1.53 37.13 38.66
152 NAADS
(Secretariat)
05/06 Approved est 3.77 2.44 6.21 6.21
Nov 2005 MTEF 3.77 2.44 6.21 6.21
April 206 NBFP 3.77 8.42 12.19 12.19
June 06 Budget speech 4.46 5.35 9.81 9.81
155 CDO
05/06 Approved est.
Nov 2005 MTEF
April 206 NBFP
June 06 Budget speech 1.2 1.2 1.2
160 UCDA
05/06 Approved est.
Nov 2005 MTEF
April 206 NBFP
June 06 Budget speech 0.58 0.58 0.58
TOTAL
05/06 Approved est. 5.7 25.26 71.17 47.15 102.13 149.27
Nov 2005 MTEF 5.58 24.29 75.67 68.27 105.55 173.83
April 206 NBFP 5.46 15.01 51.23 65.52 71.01 136.51
June 06 Budget speech 6.29 17.77 66.76 55.76 90.83 146.59
Source: SBFP; NBFP; Budget speech.
4.1.2 The Sector Budget Framework Paper and the Agriculture Sector Working Group
The Agriculture Sector Working Group. Following the distribution of the Budget Call
Circular (BCC) and the holding of the national consultative workshop where the main budget priorities and MTEF ceilings at the sector and Vote level are set out, the first stage in the annual budget process at the sector level is the preparation of the agriculture Sector Budget Framework Paper (SBFP). This is undertaken by the

Uganda Agriculture Sector Public Expenditure Review Phases 1 and 2
Oxford Policy Management 30
Agriculture Sector Working Group (SWG). The proposed TORs, composition and method of working of the SWG are set out in the BCC for FY 2005/06 (Box 4.2).
Box 4.2: The Agriculture Sector Working Group
Source: MFPED (2005) BCC
The SWG is chaired by the Permanent Secretary (PS) MAAIF. Typically, it meets soon after the distribution of the BCC and may meet once or twice more in December during the BFP preparation. Until recently, it has met rarely, if at all, outside the October to December period. Drafting. The Secretariat of the SWG is provided by the MAAIF Agricultural Planning
Department (APD), which does most of the work of producing drafts of the SBFP and writing the final version. In some years a small ‟technical drafting committee‟, comprising staff from a number of Departments in the Ministry and MFPED, has been appointed to draft the BFP. Inevitably, however, the bulk of the task of putting together drafts of the SBFP falls on the shoulders of the APD. Inputs to the BFP are provided by each of the technical units in the Ministry and its semi-autonomous agencies; representatives of these units are invited to attend meetings of the SWG. The draft final version of the SBFP is presented at a meeting
Proposed TOR of the Agriculture Sector Working Group
Review sector strategies and investment programmes.
Review and recommend projects for submission to the PMA Secretariat and Development Committee that are in line with sector plans.
Prepare Agriculture SBFP as a basis on which the annual budget for the sector is compiled and enables the MTEF for the sector to evolve overtime.
Provide the main forum for the sector-wide approach to planning and budgeting for the agriculture sector.
On the basis of the sector expenditure and investment plans and sector BFP identify policy issues for consideration and action by the Ministry Top Policy Management.
Provide information for the Joint GoU Donor Reviews.
Monitor budget implementation vis-à-vis the aims and objectives set out in the BFP. Composition of the Sector Working Group
MAAIF (including PMA Secretariat).
MAAIF Agencies (NARO, NAADS, UCDA, CDO, DDA, Animal Genetic Resource Centre, COCTU).
Donor Sub-Group on Agriculture.
Ministry of Finance, Planning and Economic Development.
Representation from Private Sector (PSFU).
Representation from NGOs (NGO Forum).
Representation from Civil Society.
Representation from Local Governments (ULAA).
Representation from Farmers' Associations and the Agricultural Council of Uganda).
Proposed Method of Work for the Working Group The Working Group will carry out its activities through meetings, retreats and workshops as well as consultative visits to LGs, as appropriate, as follows:
During the sector BFP preparation process: - At least once immediately following the conclusion of the National Budget Conference - At least once during November to review draft sector BFP - At least once during December to review and approve the final sector BFP
Quarterly after the sector BFP has been finalised.
Extraordinary/emergency meetings as may be necessary. Financing of the Sector Working Group
Funding for the SWG activities should be budgeted from within the sector MTEF ceilings.

Uganda Agriculture Sector Public Expenditure Review Phases 1 and 2
Oxford Policy Management 31
of the Ministry‟s Top Policy Management group (TPM)20 where alterations to the document and final changes to the proposed budget allocations are agreed. Time constraints. Since the enactment of the 2001 Budget Act, all SBFPs have to be
submitted to MFPED not later than 31 December; there is no any leeway for slippage, as was the case in earlier years21. MAAIF does not start to prepare the BFP until after receiving the BCC and the National Consultative Workshop has been held. Thus, any delays in either or both of these events further curtails the time available. As there is a tendency for increasing numbers of staff to take their annual leave as December progresses, considerable pressure can be placed on a very limited number of staff. MAAIF could ease this problem by starting its budget preparation process earlier – a considerable amount of documentation could be prepared, particularly on the evaluation of the current year‟s performance22 and out-turn and on developing strong cases to support new initiatives, even in the absence of MTEF and budget ceilings for the next year. Proposals for regular meetings of the SWG to evaluate performance and budget allocations are made in Section 4.2.3. The MFPED could also assist by releasing the BCC at a set time each year, even if there are delays in the timing of the national consultative workshop. The content of the SBFP. The format and content of the SBFP are largely dictated
by the guidance contained in the Budget Call Circular. The Study Team recommends that MFPED reconsiders the guidelines for the SBFP to assess whether the information it requires currently is essential or presented in the most effective format for making informed decisions on budget allocations. Except for FY2006/07 there has been no feedback to the SWG (or MAAIF) from MFPED on the content and quality of the SBFP nor are there suggestions for improvement in future years. The Study Team recommends that this should become a regular feature of the budget preparation process. The Study Team has examined the most recent SBFP guidelines in some detail and suggests modifications to the content procedures to improve its analytical content and internal consistency23. These are discussed below using the headings from the most recent (2007/08) SBFP.
Section 1.3.1 Priorities. Undertakings to be implemented as a result of the
PMA Joint Annual Review are listed. It is stated that they will also guide MAAIF‟s programme of work but currently there is no indication of this as the undertakings are not discussed in the remainder of the BFP.
Section 2.2 Overview of FY 2005/06 Performance. Low out-turns are simply
explained as „Shortfalls….in releases‟. A more detailed explanation of the reasons and responsibility for these shortfalls and whether these were one-off or recurring problems would be more helpful.
Five pages of text are devoted to listing key outputs of activities as outlined in the Ministry Policy Statement of 2005/06 and it is most unlikely that anyone will
20
Chaired by the Minister, MAAIF. 21
Although in 2006/07 due to delays by MFPED in sending out the Budget Call Circular, the date of submission was fixed for 15
th January, 2007.
22 Much of this material is also required for the quarterly and annual Budget Performance Reports (see
later). 23
The Study Team appreciates the pressure placed on a very small number of staff to complete the process on time. The content of the SBFP is further complicated because some agricultural sector activities (such as agro-processing and marketing and agricultural statistics) are shared with other ministries, agencies and local government and not completely under the control, nor budget, of MAAIF and its agencies. This leads to some ambiguities as to what precisely should be contained within the agriculture SBFP.

Uganda Agriculture Sector Public Expenditure Review Phases 1 and 2
Oxford Policy Management 32
read them. In terms of physical performance all that is required in the SBFP is a listing of highlights of selected physical and qualitative performance of activities. It is difficult to assess performance from this listing in the absence of the targets set for the previous year. A tabulation of actual outputs against targets would be much more informative and would help to establish a results-oriented management (ROM) culture in MAAIF. This could be complemented with a list of, say, the ten major achievements if this was required by the authors of the National BFP.
Section 3. Overview of FY 2006/07 Budget Allocations and Objectives. Similar observations made for Section 2.2 regarding budget and physical performance apply to Section 3, which deals with budget performance in the first half of the fiscal year. Although MAAIF is required to prepare quarterly Budget Performance Reports, which list activities undertaken in each department, they contain no systematic tabulation of planned and actual activities and outputs that could be used in the SBFP.
Section 4. Sector Budget Priorities for the Medium Term. The MAAIF Development Strategy and Investment Plan 2005/06 – 2007/08 (DSIP) has been used this year for the first time as the basis for both sector planning and prioritisation of spending plans. At first glance, there is a clear link between policy, planning and budgeting decisions for the agricultural sector. However, as discussed in Section 3.5 of this report, there are wide variations between planned expenditures as outlined in the DSIP and the actual budget allocations proposed in the SBFP.
Thus although the MTEF ceiling for 2007/08 called for an overall reduction of over 20 percent in expenditures compared to the DSIP requirement24, the SBFP makes reductions of over 50 percent in some priority areas, while one priority area, „Capacity building for production of improved seeds, planting materials and animal breeding stock‟ has a proposed budget allocation 25 percent higher than the DSIP (Table 4.3).
There is no explanation for the criteria used to make these marked changes to the DSIP estimates. One possible explanation is that the allocations, in large part, reflect the availability of development funds to finance some priority areas rather than others (Annex 2 of the SBFP indicates the various sources of funds being used for each priority area but is never referred to in the text). If this is correct, it indicates a disconnect, in practice, between policy, planning and the budget process. Alternative explanations are that the proposed budget allocations are more realistic assessments of the expenditure required for implementation of these priorities, or that there has been a significant shift in priorities since the DSIP was published in May 2006.
24
It should be noted that the published DSIP shows a „constrained‟ expenditure requirement. An earlier version gave MAAIF‟s view of its true requirements to fully implement its priorities, but this was not accepted by MFPED which required the DSIP to bear some relationship to likely future MTEF ceilings.

Uganda Agriculture Sector Public Expenditure Review Phases 1 and 2
Oxford Policy Management 33
Table 4.3: Proposed MAAIF budget allocations in relation to DSIP proposals
Priority Area
Description
DSIP at 2006/07
prices
Proposed budget
allocation
MTEF as % DSIP
UShs bn UShs bn %
1 Institutional development for agriculture sector institutions and local government
16.34 7.42 45.4
2 Capacity building for irrigation, drainage, water harvesting, soil and water conservation and rangeland management
16.65 6.95 41.7
3 Agricultural planning and policy 1.83 1.79 97.8
4 Capacity building for production of improved seeds, planting materials and animal breeding stock
15.74 19.63 124.7
5 Livestock epidemic diseases and vector control 10.46 9.75 93.2
6 Regulatory services for livestock and fisheries 7.33 4.83 65.9
7 Plant pest and disease control, regulation and certification
8.10 1.80 22.2
8 Processing and marketing of crops, livestock and fish
4.69 3.92 83.6
9 Agricultural research and technology development
41.32 25.58 61.9
10 Agricultural advisory services 65.35 62.81 96.1
11 Construction of supportive physical infrastructure (fish landing sites, livestock markets and slaughter facilities)
13.38 11.67 87.2
12 Promotion of increased agricultural production and productivity (food security)
1.32 1.38 104.5
TOTAL 202.51 157.53 77.8
Source: Agricultural Sector BFP 2007/08 Section 4
Section 5. Expected Outputs, Performance Indicators and Planned Activities for the Medium Term. Eight pages of text list outputs, indicators and activities for the 12 priority areas. A tabular presentation would have been more concise and effective as it could have more clearly linked indicators to specific outputs and activities. A Table set out in this format could then have been used in conjunction with the Table required in Section 9 showing outputs, indicators, targets and allocation of recurrent and development budgets to specific activities.
Section 6. Proposed Budget Allocations for FY 07/08. Having listed and
explained the twelve DSIP priority areas in Section 5, the Table used in Section 6 to summarise recurrent, development and total budget allocations is confusing as it shows only nine priority areas listed in a different order and consequently numbered differently to that used in the DSIP and Section 5. In Section 6, two of the DSIP priority areas (livestock and fish disease control and livestock regulation) have been amalgamated as one priority. „Processing and marketing of crops, livestock and fish‟ and „Promotion of increased agricultural production and productivity‟ are omitted; the activities and limited expenditure under these two priority areas are incorporated in other priority areas. Annex 2, indicating the sources of funding for each area, is classified in the same way as the Table used in Section 6.
Uganda Agriculture Sector Public Expenditure Review Phases 1 and 2
Oxford Policy Management 34
Section 7.1 Medium term challenges with implications for additional funding for Sector MTEF. This is the one place within the SBFP where a claim can be made for additional resources. A Table is presented of funding gaps between the sums required to implement the DSIP, in full, in six25 priority areas amounting to UShs 72.5bn in total, but no attempt is made to prioritise within this sum. Developed properly, the SBFP should provide an evidence-based justification for additional resources that can be compared by MFPED with the claims being made by other sectors. At the moment the agriculture SBFP cannot be used in this way. Until MFPED requires SBFPs to indicate and justify their expenditure priorities if their budget ceiling were to be raised (or lowered) by say 5, 10 or 20 percent, MAAIF is likely to avoid making these hard prioritisation decisions and much, or indeed most, of the rationale of the SBFP process will continue to be lost.
Section 7.2 Challenges with implications for additional funding outside the Sector MTEF ceiling. This Section allows the sector to highlight constraints in
other sectors that it considers should be addressed as they impinge on the sector‟s performance. Six areas are indicated, including finalising restructuring of the Local Government production departments. Funding for the Sembeguya goat multiplication project is also included in the list but it is difficult to understand why this is considered to be outside the Sector MTEF ceiling.
Section 8. Non Tax Revenue. Tables of non-tax revenue (NTR) funds are
shown for various MAAIF cost centres and the semi-autonomous agencies. The Table for MAAIF shows 2005/06 Budget NTR and out-turn; 2006/07 Budget NTR and estimated out-turn and Budget NTR estimate 2007/08. The latter is identical to the Budget 2006/07 figure even though out-turns for some expenditure items in 2006/07 are very different to the budget estimates. NARO shows 2005/06 actual, 2006/07 estimated actual, 2007/08 budget and budget forecasts for 2008/09 and 2009/10. This seems a more sensible and informative approach and might be adopted by all agencies.
Section 9. Summary of Proposed Budget Allocations for FY 2007/08. This Table uses the twelve DSIP priority area classification with the outputs, indicators and activities that were listed in bulleted text form in Section 5. It includes targets for each indicator and a breakdown of recurrent and development budget allocations for each activity. Because different classifications are used in the Tables in Section 6 (and Annex 2) and Section 9 there are apparent inconsistencies in the amounts allocated to each priority area, leading to unnecessary confusion.
Annex 1. Details of Expected Outputs, Performance Indicators and Planned Activities 2007/08 to 2007/10. This is the only opportunity in the BFP to
indicate how funds available under the MTEF ceilings for future years for each Vote would be allocated. An effective approach would be to have a summary table indicating whether any reallocation of funds between programmes or sub-sectors within a Vote was being contemplated or whether any changes in budget ceilings would be distributed equally between programmes. Justification for these adjustments could then be indicated, showing the predicted effects on outputs and activities. This would appear to be more informative than the current approach in the SBFP where some Votes and programmes give detailed accounts of intended outputs, targets, activities and allocations of recurrent and domestic development funds over the next three years, whereas many provide entries that: (i) do not indicate whether the
25
Livestock disease control and regulation are again amalgamated and a heading appears to be missing for „Capacity building in irrigation, etc.‟, so eight of the twelve DSIP areas may be represented.

Uganda Agriculture Sector Public Expenditure Review Phases 1 and 2
Oxford Policy Management 35
targets and activities are annual recurring events or totals for the whole period; (ii) contain several typing errors, and; (iii) lack some data and totals for the programmes.
4.1.3 MAAIF’s Development Strategy and Investment Plan (DSIP)
MAAIF‟s DSIP was intended to cover the three-year period 2005/06 to 2007/08. It was approved in 2005 but not issued until May 2006. Initially it was used only to a limited extent for sector planning and budgeting and only in 2007/08, its last valid year, has its use been more pronounced. There is thus an urgent need for MAAIF to update its strategy and investment plan for 2008/09 onwards in order to provide the means by which there can be a continuing link between policy, planning and budget preparation and negotiations. It would add to the credibility of the DSIP if increased attention were paid to:
The criteria used for prioritisation;
The expected outcomes;
Detailed explanations of expenditure estimates, and;
Linking the investment plans more closely to the anticipated MTEF ceilings, indicating how the plans would change if MTEF ceilings were increased (or decreased).
MAAIF should also consider whether a 3-year or 5-year investment plan is best suited to its purposes. A five-year plan would provide a longer time horizon for investment decisions and reduce the perceived need for frequent revisions but changing priorities and events might make the estimates for outer years unreliable.
4.1.4 Local Government agricultural budget preparation
„Bottom up‟ planning. A single BFP is prepared for the District by the District
Technical Planning Committee with the District Production Department contributing to it. In principle, the essence of the District BFP should be the coordination of plans submitted from lower levels of local government and developed in a participatory manner. However, in practice this participatory process rarely involves more than a minority of the local population (see Annex 5). Moreover, many sub-counties currently lack the capacity for effective plan preparation, while the desired participatory nature of the planning process is weak. Timing. Typically, the time period between the Regional LG BFP workshop when
Indicative Planning Figures (IPFs) are announced and the date for submission of the District BFP is short. In 2005, for example, the Regional Workshop for Mukono District was 19-20 December and the BFP submission date was 20 January 2006. The MFPED and line ministries comment on the BFP in March-April and then it is examined by various District Council committees before being read and approved by the full District Council in June. As at the national level, there are frequent adjustments to the IPFs for individual districts during the budget preparation process. Funds for production activities. The funds available for production activities are sourced from the NAADS District Grant, the District Agriculture Extension Grant and those portions of the NSCG and the LGDP that are apportioned to production activities, together with any projects funded from local tax revenue. In some districts, the Production Department receives extra funding from the 10 percent pooled from conditional grants under the Fiscal Decentralisation Strategy. There are various conditionalities to each of the grants channelled from Central Government.
Uganda Agriculture Sector Public Expenditure Review Phases 1 and 2
Oxford Policy Management 36
Decisions on the allocation of the NAADS District fund for both the district and sub-counties are predetermined from the NAADS Secretariat. The district only distributes according to the schedule from the Secretariat. However, decisions on the actual extension activities to be financed by the grant are made by the farmers‟ fora at sub-county level. In principle, decisions on the use of 65 percent of the NSCG funds should be made by the sub-counties. The district‟s role is to check conformity with the guidelines (e.g. to ensure that proposed investments are of the acceptable „public good‟ type). In practice, many of the decisions on project selection are made by the District Technical Committee on the basis of recommendations from the various relevant Departments. The Production Department‟s scope for flexibility in planning is mainly limited to decisions on allocating funds from the NSCG, the LGDP, the allocation from the 10 percent flexibility fund under the Fiscal Decentralisation Strategy and locally-financed projects. Due to local political pressures, there is a tendency to plan for more project expenditure than can be realistically financed, by inflating the projected level of local revenue collection. Failure to implement projects is then blamed on shortfalls in local revenue collection. Other sources of finance. Besides funds directly under the control of the LG, many production activities in the district are also supported by off-budget projects financed by donors and/or NGOs. As indicated in Annex 5, in some Districts this is an important source of finance but, at the moment, it does not appear to be taken fully into account by districts, nor by central government agencies, in planning the allocation of their own funds.
4.1.5 Transparency
The preparation and submission of the SBFP is only the prelude to the real budget negotiations and adjustments that continue right up to the Budget Speech and beyond. As indicated in Section 4.1.1 these adjustments frequently stem from policy initiatives and political directives that emerge when the proposed budget is being discussed in Cabinet and Parliament. In past years the Agriculture SWG has rarely, if ever, met after the SBFP has been submitted in December. As there is no overt high level Budget Committee with representatives from key ministries, subsequent adjustments are made by senior civil servants in MFPED in consultation with their Ministers after varying degrees of discussion with MAAIF officials and their ministers Any notification of required adjustments is then made by the PS MFPED to the PS MAAIF. MAAIF, of course, also engages in special pleading and has occasionally benefited from additional budget increments. Thus, although in some senses the budget process is relatively open and there are opportunities for consultation, it is managed at the higher and later levels in a closed and bureaucratic manner. Political interventions that occur after the Budget has been approved are accommodated by reallocating funds between or within Votes and through supplementary budgets. As these adjustments mainly have to be accommodated within the non-wage and non-PAF elements of recurrent and development expenditure, they create considerable instability and uncertainty both in terms of effective budget preparation and execution.
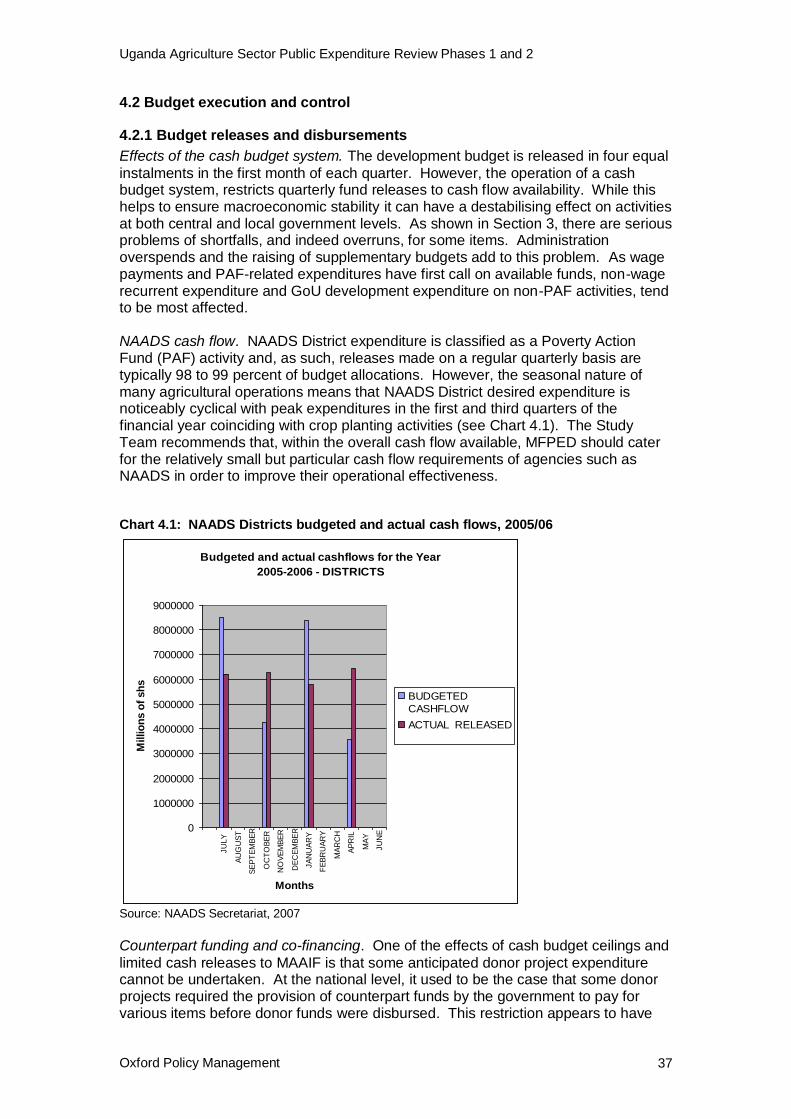
Uganda Agriculture Sector Public Expenditure Review Phases 1 and 2
Oxford Policy Management 37
4.2 Budget execution and control
4.2.1 Budget releases and disbursements
Effects of the cash budget system. The development budget is released in four equal
instalments in the first month of each quarter. However, the operation of a cash budget system, restricts quarterly fund releases to cash flow availability. While this helps to ensure macroeconomic stability it can have a destabilising effect on activities at both central and local government levels. As shown in Section 3, there are serious problems of shortfalls, and indeed overruns, for some items. Administration overspends and the raising of supplementary budgets add to this problem. As wage payments and PAF-related expenditures have first call on available funds, non-wage recurrent expenditure and GoU development expenditure on non-PAF activities, tend to be most affected. NAADS cash flow. NAADS District expenditure is classified as a Poverty Action Fund (PAF) activity and, as such, releases made on a regular quarterly basis are typically 98 to 99 percent of budget allocations. However, the seasonal nature of many agricultural operations means that NAADS District desired expenditure is noticeably cyclical with peak expenditures in the first and third quarters of the financial year coinciding with crop planting activities (see Chart 4.1). The Study Team recommends that, within the overall cash flow available, MFPED should cater for the relatively small but particular cash flow requirements of agencies such as NAADS in order to improve their operational effectiveness.
Chart 4.1: NAADS Districts budgeted and actual cash flows, 2005/06
Budgeted and actual cashflows for the Year
2005-2006 - DISTRICTS
0
1000000
2000000
3000000
4000000
5000000
6000000
7000000
8000000
9000000
JU
LY
AU
GU
ST
SE
PT
EM
BE
R
OC
TO
BE
R
NO
VE
MB
ER
DE
CE
MB
ER
JA
NU
AR
Y
FE
BR
UA
RY
MA
RC
H
AP
RIL
MA
Y
JU
NE
Months
Millio
ns o
f sh
s
BUDGETED
CASHFLOW
ACTUAL RELEASED
Source: NAADS Secretariat, 2007
Counterpart funding and co-financing. One of the effects of cash budget ceilings and
limited cash releases to MAAIF is that some anticipated donor project expenditure cannot be undertaken. At the national level, it used to be the case that some donor projects required the provision of counterpart funds by the government to pay for various items before donor funds were disbursed. This restriction appears to have

Uganda Agriculture Sector Public Expenditure Review Phases 1 and 2
Oxford Policy Management 38
been relaxed by most, if not all, development partners26. However, the Study Team has been informed that MFPED is reluctant to release counterpart funding if it is not convinced that the donor funds also associated with the project are being spent or where a project (whether externally- or domestically-financed) is no longer considered to be a priority. At the District level, several of the conditional grants provided by central government also require co-financing contributions to be made by the district and sub-county (NAADS, LGDP) or farmers‟ groups (NAADS). This requirement tends to be rigorously enforced by LGDP but less so by NAADS. Even though these grants are part of PAF, there are circumstances where overall cash constraints may limit access to them. This issue is discussed further in Annex 5.
4.2.2 Performance monitoring
MAAIF. MAAIF‟s APD has a Monitoring and Evaluation (M&E) Division staffed by six officers, supplemented by ten others from technical departments, who are required to carry out M&E of all MAAIF activities. They monitor each department and each of the officers is also responsible for the M&E of a development project. The M&E Division is also supposed to undertake field visits to monitor activities at the District level, but insufficient funds have been allocated to do this. It is planned to pool the M&E funds now available to each individual project to increase the funds available to the M&E Division. As noted earlier, lists of outputs, indicators and activities are now produced for the SBFP, and similar information is provided in the quarterly Budget Performance Reports that all Ministers responsible for a Vote in Appropriation-in-Aid are required to make to Parliament under the Budget Act (2001). These reports are expected to explain how funds have been spent and reflect specific data on value-for-money from the expenditure involved. The M&E Division of APD also prepares an annual Performance Monitoring and Evaluation Report. At the moment there appears to be no use made of these various reports within, or outside, MAAIF to reward good performance (or sanction poor performance), to measure the effectiveness of MAAIF‟s public expenditure or to reallocate resources between different priority areas. Furthermore, no feedback appears to be provided to MAAIF on the quality or usefulness of any of these reports. Within MAAIF, the TPM or the SWG would be appropriate bodies to carry out regular quarterly appraisals of the effectiveness of budget expenditure across MAAIF and its agencies. The TORs for the SWG already include a responsibility to monitor the performance of budget expenditures and implementing this would give a year-round agenda for the SWG, which would help to increase its effectiveness. However, the institution of such a system can only be effective if it is given strong Ministerial support and if it is seen to be implemented and supported by the Permanent Secretary and his senior colleagues. It would also require, and lead to, a substantial improvement in the quality of the reporting system, with a critical examination of the reasons for variations between planned and actual outputs and attention paid to the cost-effectiveness of different programmes and resource allocations. MFPED could also strengthen the case for performance monitoring to be taken more seriously in MAAIF if it insisted on a more rigorous analysis and presentation of sector performance in the SBFPs.
26
However, typically the donor will refuse to reimburse the project for any items that should have been funded by GoU.
Uganda Agriculture Sector Public Expenditure Review Phases 1 and 2
Oxford Policy Management 39
PMA Joint Annual Review. There is a Joint Annual Review (JAR) of PMA activities,
where, among other things, undertakings accepted by agencies at the previous JAR are reviewed and new undertakings accepted. Local Government. On paper, performance monitoring is much more rigorous at the
District level than in MAAIF. Each Department prepares a quarterly work plan with quantifiable targets and also a quarterly plan and budget implementation report that is reviewed by the District Council to measure the effectiveness of each Department, with an emphasis on physical and political accountability and value-for-money. This is examined further in Annex 5, Section 3.3. NAADS has its own auditing arrangements for its extension activities in the field. The Study Team was informed that one of the functions of the District Agricultural staff, who originally were to be „delayered‟ (declared redundant) when NAADS covered all sub-counties in a district, is to provide a technical audit function.
4.2.3 Donor budget releases and expenditure
Although approved budget allocations to the agricultural sector show GoU and donor contributions, Government information on budget releases (funds released by MFPED to Votes) and actual expenditure (expenditures by Votes for which payment has been made) only relates to GoU funds, including budget support. Donor releases and actual donor expenditure for development projects can only be obtained by consulting individual project accounts (in some cases, the development partner may be able to provide this information). MFPED does maintain a databank of donor budget allocations and releases to individual projects but this relies on information provided by the development partners themselves. It does not include information on actual expenditure. Given the importance of donor funds in supporting public expenditure in Uganda in general and the agricultural sector in particular, it is very surprising that there is no systematic collection of donor releases and expenditure from project accounts by MFPED or by the Principal Accountant (PA) MAAIF in collaboration with other sector agencies. The Study Team recommends that MFPED and MAAIF take urgent steps to remedy this deficiency.
4.3 Budget accounting, reporting and audit
Central government. Accounting for all MAAIF expenditure, including projects under
the control of MAAIF, is the responsibility of the Principal Accountant, MAAIF. The Internal Auditor audits all MAAIF expenditure, including projects, and also checks that all payments are in conformity with the law, before payment is authorised by the PS. The Internal Auditor also prepares quarterly reports relating to the effectiveness of the payments and control systems and any weaknesses in them. By statute, the Auditor General is responsible for carrying out an annual external financial audit of all Central Government agencies and LGs. External auditing is contracted out to private accountancy firms who write audit reports for the Auditor General to approve or action if there are qualifications to the accounts. A sample of projects is also audited. It is recommended that this sample be extended to the largest size that is practicable. Most donor-financed projects also have their own external audits. Audited accounts are also reviewed by the Parliamentary Public Accounts Committee.

Uganda Agriculture Sector Public Expenditure Review Phases 1 and 2
Oxford Policy Management 40
Local government. Besides the external audit carried out by the Auditor General,
districts have an Internal Audit Department. Initially, this was nested in the Management Department headed by the Chief Administrative Officer but, under the current structure, the Department is independent of management and reports directly to the Council. Its duties include pre-audit of payments and post-payment audits to check whether goods and services for which payments have been made have been undertaken of delivered. Findings from the Study team‟s field visits reveal that, in general, the internal audit units are carrying out this function effectively. In districts where the units are empowered and well resourced, such as Bushenyi, the Internal Audit is doing an outstanding job including value-for-money audits in the field.

Uganda Agriculture Sector Public Expenditure Review Phases 1 and 2
Oxford Policy Management 41
5. Donor funding and funding modalities
5.1 GoU intentions on donor funding
The evidence presented earlier in this study shows that, historically, the agriculture sector has relied heavily on donor funding to support its activities. In recent years, most of this funding has had to be contained within an MTEF ceiling. However, the Government‟s recently-declared intention regarding future donor funding, together with the current indicative MTEF ceilings for donor projects in the agriculture sector (Table 5.1), if realistic, suggest that a reappraisal of the whole approach to donor funding and funding modalities for the sector may be called for. The Government‟s intentions, contained in the National BFP for 2007/08 to 2009/10 (MFPED, 2007[a]), include:
A reduction in aid dependency;
A future restriction of loans to infrastructure, energy and value-addition projects;
The requirement to provide work plans and prove availability of counterpart funds within MTEF ceilings to trigger the use of external resources; and
The rejection of additional external resources for any sector which has unutilised resources.
Table 5.1: MTEF 2006/07-2009/10, donor project funds, in UShs bn
Vote/Sector
010 AAIF
Sub-Total COFOG agriculture
Grand Total
FY 2006/07 Approved Budget Estimates 48.88 55.76 1,039.24
FY 2007/08 Budget Projections 59.62 81.68 1,124.04
FY 2008/09 Budget Projection 63.06 88.21 1,358.14
FY 2009/10 Budget Projectionsa 34.62 56.45 695.45
Source: MFPED (2007) National BFP for FY 2006/07 – 2009/10 Annex 2.
Note: a. This sharp reduction in direct donor project funding in FY 2009/10 is based on the assumption that there will be a marked shift to donor budget support.
5.2 Disbursement of donor funds.
Allocations versus disbursements. At first glance, the current and indicative MTEF
ceilings for the agriculture sector in general, and individual Votes within it, appear to indicate that the ceilings are very tight constraints on current and future expenditure, given the level of donor funds already committed to agricultural projects. However, a different picture emerges when the disbursement of these funds is examined. Table 5.2 shows the approved budget allocations and disbursement (the release of funds by the donor to the project) and the out-turns (disbursement as a percentage deviation from budget allocations) for donor loans and grants to parts of agricultural sector27 in recent years. The Table indicates that the average out-turn for donor funds over the 5-year period, 2001/02 to 2005/06, for all crops, livestock, fish and forestry projects, was -50.3 percent. NARO projects had a slightly better out-turn (-
27
This analysis uses the same list of projects and classifications used for Table 2.1.

Uganda Agriculture Sector Public Expenditure Review Phases 1 and 2
Oxford Policy Management 42
45.1 percent) but the percentage deviation was greater for projects under Vote 010 of MAAIF at -57.7 percent. Table 5.2: Allocation and disbursement of donor development funds to the agriculture sector, 2001/02 to 2006/07 in UShs bn
Crops, Livestock, Fish,
Forestry Vote 010 (MAAIF) Vote 142 (NARO)
Alloc-ation
Disburse-ment
Out-turn %
Alloc-ation
Disburse-ment
Out-turn %
Alloc-ation
Disburse-ment
Out-turn %
2001/02 120.95 54.52 -54.9 57.54 20.53 -64.3 24.79 12.93 -47.8
2002/03 117.40 67.47 -42.5 60.28 34.12 -43.4 25.34 16.36 -35.4
2003/04 110.11 71.09 -35.4 41.15 20.97 -49.0 21.55 11.93 -44.7
2004/05 101.44 39.64 -60.9 46.19 15.31 -66.9 20.09 9.15 -54.5
2005/06 88.65 35.01 -60.5 51.71 17.77 -65.6 13.27 7.26 -45.3
Average 107.71 53.55 -50.3 51.37 21.74 -57.7 21.01 11.53 -45.1
Source:MFPED Aid Liaison Department database
This persistent gap between budget allocations and disbursements leads to a conundrum. On the one hand, the size of the budget allocation is, at least nominally, limited by the MTEF ceiling. On the other hand, the low rate of disbursement suggests that the MTEF ceiling is always undershot and that considerably more donor funds could be spent in the agriculture sector in general and in MAAIF, in particular – perhaps around UShs 30bn, within the current MTEF ceiling28. An initial step in attempting to understand and resolve this conundrum requires an examination of the various reasons that may contribute to the low out-turns. Project design and implementation. There are two types of persistent problems with
donor-funded projects in the agriculture sector, particularly if they are on a relatively large scale and are loans rather than grants. These are well known29 but are worth repeating briefly. The first relates to the design phase, which can be inordinately long. It is not unusual for design and approval by the lending institution to take four years or more30. The second type of problem relates to the implementation phase. Typically, the problems during this phase may include:
Delays of a year or more after the effective start date until actual implementation begins while a variety of pre-conditions (e.g. Parliamentary approval in the case of loans) are fulfilled. Selection of an over-ambitious start date inevitably leads to increased commitment charges on the undisbursed loans;
Problems of acquiring land needed for a project because of poor land titling, disputed ownership, etc;
Poor design, e.g. neglecting to include design costs for infrastructure, and insufficient flexibility in project implementation regulations to easily remedy this type of problem;
The inclusion of credit components that have been difficult to operationalise;
Unrealistic cost estimates in the original design;
28
This could still be constrained by a shortage of counterpart funds in the case of loans. 29
And still ongoing, as a recent paper indicates. See MAAIF (2007) Approved Mid Term Review Report: National Livestock Productivity Improvement Project. May. 30
The original concept paper for the Vegetable Oil Development Project was written in 1989. Serious planning started in1991 and the effective starting date was 1998.

Uganda Agriculture Sector Public Expenditure Review Phases 1 and 2
Oxford Policy Management 43
A shortage, or non-release, of counterpart funds for items such as fuel, vehicles, stationery, advertising, etc;
A failure to understand donor procurement procedures and/or a failure to implement them correctly; and,
The need to refer procurement decisions on large purchases to the donor‟s headquarters.
Combinations of these factors inevitably lead to a late start-up and disbursement delays for individual projects resulting, in aggregate, in the low disbursements and out-turns shown in Table 5.2. Slow disbursement also frequently leads to the project period being extended even further in the hope that undisbursed funds can be utilised. As indicated in Section 4, this may lead to policy priorities being distorted because the effort to spend funds on projects that are scheduled to close shortly becomes the driver in budget allocations regardless of the current policy priority of that project. Budget allocations. Part of the out-turn problem arises from slow disbursement, but, of course, projecting unrealistic budget allocations is also part of the equation. The global figure for MAAIF and its semi-autonomous agencies is set by MFPED after receiving information from donors regarding the amounts of funds that they are intending to commit for the following fiscal year. There is a possibility that some donors, mindful of the need to have committed funds spent, will pledge an allocation larger than their realistic hopes of actual disbursement. In the process they contribute to the low out-turn problem. The sum allocated by MFPED to MAAIF is then allocated internally to individual projects, initially by APD officers, as part of the SBFP process. Individual project coordinators “living in eternal hope”31 attempt to negotiate the largest possible allocation for their own projects, regardless of past disbursement rates and the various implementation constraints they are likely to encounter. In the absence of any objective analysis of the realistic expenditures and likely outputs and outcomes of these various bids, the final outcome tends to be based on previous allocations, negotiation and, as noted earlier, a desire to spend unused loan funds before project closure32. This is yet another area that is within the remit of the SWG and where a revitalised SWG would play a valuable role in providing a forum to assess the past performance of various projects and the competing submissions from project coordinators for further funds in relation to expected outputs and outcomes. Part of this assessment could be an examination of both the availability of counterpart funds (if this is likely to be an impediment) and the likely absorptive capacity of the projects. The potential exists for the Development Partners‟ Sub-Group to play a role in this process through internal discussions aimed at encouraging more realistic annual pledges of funds. Implications of accumulated undisbursed funds. What Table 5.2 does not show is
that the continuous lag of disbursements, below the level of allocations, inevitably leads to an accumulation of undisbursed funds until or unless:
Loan (or grant) agreements are terminated;
The funds are reallocated to other projects.
31
Personal communication from a MAAIF official. 32
This raises important issues regarding „value for money‟ that could be usefully explored in Phase 3 of this review.

Uganda Agriculture Sector Public Expenditure Review Phases 1 and 2
Oxford Policy Management 44
If the rate of disbursement cannot be raised from the average of the past 5 years and MFPED maintains its stance of not permitting additional external resources for any sector which has unutilised resources, the presence of the existing large loans will, in effect, crowd out the possibility of obtaining new donor funds (loans or grants) to meet emerging priorities even though actual expenditure in any one year is well below the MTEF ceiling.
5.3 Funding modalities
Based on the discussion in Section 5.2 there are several problems with large donor-funded projects in meeting the particular needs of the agriculture sector. These include:
The long gestation period before the effective implementation date;
Continuing design and implementation problems;
Slow disbursement rates;
Subject to possible influence by donor interests rather than GoU priorities;
Procurement procedures may differ from those of GoU resulting in delays and inefficiencies in disbursements;
Can occupy a significant proportion of the MTEF space; and,
Interventions may be unsustainable after the project closes if there are high recurrent budget implications;
In addition, for loans, there is the problem of commitment charges on the undisbursed portion. Many of these problems could be eased by smaller projects that are more carefully designed, or phased projects with the ability to adjust objectives and activities to suit changing circumstances and priorities. However, the recurrent cost implications of continuing these initiatives after project closure still have to be considered. Disbursement/release of GoU development funds. Using the same data source as for Table 5.2, Table 5.3 shows the approved budget allocations, releases by MFPED and the out-turns (release as a percentage of budget allocations) for GoU development funds to agriculture sector projects in recent years. These funds will include earmarked and general budget support but, by its very nature, it is impossible to determine what proportion this is of total GoU development funds allocated to the agricultural sector.

Uganda Agriculture Sector Public Expenditure Review Phases 1 and 2
Oxford Policy Management 45
Table 5.3: Allocation and disbursement of GoU development funds to the agriculture sector 2001/02 to 2005/06 UShs bn
Crops, Livestock, Fish,
Forestry Vote 010 (MAAIF) Vote 142 (Research)
Year Alloc-ation
Release Out-turn
% Alloc-ation
Release Out-
turn % Alloc-ation
Release Out-
turn %
2001/02 70.61 51.87 -26.5 36.93 28.26 -23.5 8.60 5.09 -40.8
2002/03 65.69 45.89 -30.1 33.85 26.71 -21.1 6.69 4.88 -27.0
2003/04 47.01 44.51 -5.3 22.77 20.49 -10.0 5.19 4.86 -64
2004/05 32.21 20.56 -36.2 13.17 9.68 -26.5 5.61 5.23 -6.8
2005/06 50.72 45.59 -10.1 31.62 26.20 -17.1 9.48 9.48 0
Average 53.25 41.68 -21.7 27.67 22.27 -19.5 7.11 5.91 -16.1
Source: MFPED Aid Liaison Department Database
For crop, livestock, fish and forestry projects in general, the average out-turn for GoU funds over the 5-year period was -21.7 percent compared to -50.3 percent for donor funds. For Vote 010 (MAAIF) the contrast was even greater: the out-turn for GoU funds was -19.5 percent compared to -57.7 percent for donor funds. The situation is similar for Vote 142 (NARO), where the out-turn for donor funds was -45.1 percent compared to -16.1 percent for GoU funds. There are a variety of reasons that may explain these differences that could usefully be explored in Phase 3 of this study. One possibility is that the higher out-turn for GoU funds is a reflection of the shortage of counterpart funds required to operationalise donor funding. However, another possibility is that projects financed mainly by GoU differ in character from projects relying mainly on donor funding. For instance, in Section 3.2.3 we observed that, currently, there are at least four MAAIF projects that finance the recurrent costs of „routine‟ activities. Thus there is also a need for further investigation of the uses made of GoU „development‟ funds to determine whether they are being used in the most cost-effective way possible. One important consequence of the differential out-turns for GoU and donor funds is that direct donor-funding of agriculture projects is less pronounced when measured by disbursements rather than allocations. As shown in Table 5.4, over the 5-year period, overall reliance on direct donor support falls from 67 percent using allocations as the indicator to 56 percent if disbursements are used as the indicator. For Vote 010 (MAAIF) the effect is even more marked, with direct donor funding accounting for only 49 percent of project disbursements. Research, however, received three-quarters of its development fund allocations from direct donor support and two-thirds of disbursements came from direct donor funding. Table 5.4: Average share of donor funds in the allocation and disbursement of development funds to the agriculture sector 2001/02 to 2005/06 UShs bn and percent
Av. annual
allocation 2001/02 – 05/06
Donor share (%)
Av. annual disbursement
2001/02 – 05/06
Donor share (%)
Crops, Livestock, Fish, Forestry 160.96 66.9 95.23 56.2 Vote 010 (MAAIF) 79.04 65.0 44.01 49.4 Vote 142 (Research) 28.12 74.7 17.43 66.1
Source: MFPED Aid Liaison Department Database

Uganda Agriculture Sector Public Expenditure Review Phases 1 and 2
Oxford Policy Management 46
Future funding. Increasingly, earmarked budget support and general budget support
are becoming the preferred funding modalities for donor support and this trend is continuing. However, development partners will have to be convinced that funds are being used effectively if the flow is to be maintained or increased significantly. This will, in turn, increase the pressure on the agriculture sector and MAAIF to develop a cost-effective and value-for-money development portfolio of projects, with high disbursement rates, for funding from GoU development funds, as they will be in direct competition with all other sectors for these resources.
5.4 Selecting a development portfolio
At the moment, criteria for selecting a „development portfolio‟ compatible with MAAIF‟s priority areas and the likely future MTEF ceilings appear to be non-existent. This is because in recent years the heavy reliance on large donor projects has led to them being developed on a „one-off‟ basis through negotiations with individual donors. As noted above, the trend towards budget support offers MAAIF and its autonomous agencies the opportunity, and necessity, to develop its own portfolio of value-for-money projects to operationalise its DSIP. Again, it is in the remit of the agriculture SWG to „review sector strategies and investment programmes‟ and „review and recommend projects for submission to the PMA Secretariat and Development Committee that are in line with sector plans‟ (see Box 4.2). A
revitalised SWG would provide an ideal forum for designing the future development portfolio in a systematic manner.
Uganda Agriculture Sector Public Expenditure Review Phases 1 and 2
Oxford Policy Management 47
6. Summary of main findings and action plan
There are four major groups of findings that arise from the report. (i) Using the COFOG definition of agriculture. The broad COFOG definition of agriculture shows that in 2001/02 the sector accounted for 8 percent of the GoU budget. Since then there has been a steady decline, to 5.7 percent in 2005/06. In constant 2005/06 prices the budget allocation to (COFOG) agriculture has decreased from approximately UShs 295bn at the start of the decade to UShs 210bn in 2005/06. The MTEF agriculture sector budget (MAAIF and its semi-autonomous agencies, NARO, NAADS, and District Agricultural Extension) accounted for 67 percent of the COFOG agriculture budget allocations in 2001/02 and 81 percent in 2005/06. The other major component, consisting of forestry programmes (now, in part, taken over by NFA expenditure) and some agriculture projects under the control of other ministries and agencies, fell from 30 percent of the COFOG agriculture budget in 2001/02 to 16 per cent in 2005/06. The final component, those parts of the LGDP and the NSCG allocated to agriculture, accounted for approximately 3 percent of the COFOG agriculture budget throughout the 5-year period. Decentralisation in sector financing is deepening with the proportion of the COFOG agriculture budget channelled through local government rising from 7 percent of the total in 2001/02 to 19 percent by 2005/06. This was mirrored by releases which rose from 10 percent of national releases to 25 percent over the same period.
By definition, off-budget expenditure is excluded from the definition of government expenditure. However, its contribution to expenditure on the agriculture sector by donors and NGOs is considerable. For example, during the period under review it is estimated that two development partners contributed an additional 10 to 20 per cent to the total sector allocation provided through the GoU budget.
Although MAAIF, in principle, now has direct control over a significant portion of the pubic resources channelled to that part of COFOG agriculture that is within its mandate, in reality it has problems in exercising effective control. MAAIF needs to devise strategies that recognise this reality and be provided with sufficient resources to perform its co-ordinating, facilitating, monitoring, supervising and evaluating roles at the national and local government levels, effectively. (ii) MAAIF’s budget allocation and expenditure patterns. MAAIF‟s budget is allocated through a series of Votes. In terms of the recurrent budget, the Study Team focussed its attention on Vote 010 on the assumption that expenditure through the other Votes, mainly to NARO and NAADS, will be examined in some detail in Phase 3 of the study. Although the recurrent budget is conventionally presented in terms of „wage‟ and „non-wage‟ components, it was found desirable to disaggregate the budget into four components: „total employee costs‟; „use of goods and services‟; „grants‟, and; „payment of domestic arrears‟. These latter two components typically account for at least one-half of recurrent budget allocations and fluctuate considerably from year to year. The Headquarters programme received over one-half of the budget for goods and services over the period 2001/02 to 2006/07. It also received the largest proportion of employment costs. The wage: non-wage ratio is a useful parameter of the likely

Uganda Agriculture Sector Public Expenditure Review Phases 1 and 2
Oxford Policy Management 48
effectiveness of budget allocations because a high ratio often indicates insufficient operational funds for a programme to function effectively. This applies particularly to the Fisheries Resource Department. The recurrent budget allocation both to and within MAAIF merits more investigation in Phase 3 of this study, in particular:
The reasons for the high proportion of the recurrent budget and funds for the purchase of goods and services allocated to Headquarters;
The criteria used for allocating the non-wage component of the allocation between programmes;
Whether the operational effectiveness of the various programmes is affected by a high wage; non-wage ratio or whether this ratio is set in the knowledge that a proportion of development budget funds are used to finance recurrent costs.
In terms of the development budget, Vote 010 accounts for approximately 70 per cent of the total MAAIF allocation. In actual prices, the budget allocation has fallen from UShs 90bn in 2001/02 to UShs 56bn in 2006/07. In constant 2005/06 prices, the decline from a peak of UShs 122bn in 2001/02 to UShs 53bn in 2006/07 is even more marked. There is a distinct fall in direct donor development project funding after 2002/03 with real budget allocations falling from an average of UShs 77bn in the 2000/01 to 2002/03 period to UShs 51bn in the ensuing 3-year period and to UShs 46bn in 2006/07. There is no evidence of any consistent pattern of domestic-financed funds increasing for MAAIF (Vote 010) development to compensate for the decline in direct-donor financing, but this should be viewed in the context of the substantial increase in domestic-financed support (including basket funding by donors) for NAADS (District) support, which is not part of Vote 010. An economic classification of development expenditure indicates that approximately 14 percent is allocated to employee costs, over half to other operational cost and 32 per cent to capital items. This current situation is far removed from the time when „capital expenditure‟ and „development expenditure‟ were regarded as virtually synonymous and demonstrates that the separation of „recurrent‟ and „development‟ spending is not being properly applied in practice. The relationship between planned expenditure (the original approved budget allocations) and actual expenditure is an important indicator of the effectiveness of the budget in allowing departments and programmes to plan their activities and deliver public services for the year, as expressed in policy statements, output commitments and work plans. The Study Team found that in three of the six years 2000/01 to 2005/06, total actual recurrent expenditure has varied by more than 15 percent from the total approved recurrent allocations. Revisions to the original budget allocations are sometimes made to accommodate these variations. However, virtually all programmes „underspend‟ the revised budget allocations every year. Whether this is the result of „voluntary‟ underspending by departments/ programmes; or overall shortfalls in MFPED releases as a result of the cash budget system and unforeseen calls on the aggregate budget, was not examined by the Study Team and merits further examination in Phase 3 of the study. Local government expenditure in the form of various District grants rose as a proportion of total COFOG agriculture expenditure from 10 percent in 2001/02 to 25 percent in 2005/06 due to the rapid growth in NAADS expenditure. One major issue is that in many districts the NAADS system is now running in parallel with the traditional extension system and this may not be the best way of using scarce

Uganda Agriculture Sector Public Expenditure Review Phases 1 and 2
Oxford Policy Management 49
resources. Another issue is that some of the funding is used to distribute private goods in the form of free inputs. The Study Team was not able to ascertain the extent of this activity and this is an issue that warrants further consideration in Phase 3 of this review process. A comparison of actual budget allocations with the planned budget published in MAAIF‟s Development Strategy and Investment Plan (DSIP) indicates that the DSIP has not been used effectively as the basis for drawing up the sub-sector budgets, which detracts from the value of the document. It is hoped that the preparation of the second DSIP, covering the period from 2008/09 to at least 2010/11 will involve careful analysis of future budget requirements by each of the technical units involved in drafting their sections, in light of the projected national resource envelope. It is also expected that the objectives and work plans for each of the priority areas will define clearly the components on which funds are to be spent and that these will be fully in line with the over-riding national development strategies and programmes, such as the PEAP and the PMA. (iii) The budget process. At the moment there is a vicious circle that needs to be
broken. On the one side MFPED goes through the motions of requiring an evidence-based claim for public expenditure resources through the formalised budget preparation process, setting the guidelines in the BCCs, the National Consultative Workshop, the requirement to submit SBFPs, etc. But at the same time the impression is created that scant regard is paid to this evidence – there is certainly little feedback provided on it – and that actual budget allocation decisions are still made in a non-transparent manner influenced by political pressures and bargaining. In this setting, there are few short-term incentives for MAAIF, or other agencies, to develop evidence-based budget applications based on coherent, well-constructed strategies, policies and investment plans designed to meet the Government‟s objectives and fulfil their mandates in a cost-effective manner. Indeed, when MAAIF officials see that more funds can be achieved by special pleading than through all the effort put into medium- and short-term budget preparation, it is hardly surprising if they wonder if the effort is worthwhile. On the other side of this vicious circle, in the absence of consistent and continuing evidence-based budget allocation requests, MFPED have no alternative but to make their own decisions on budget allocations to the agriculture sector. At the same time, the absence of well-argued and presented submissions for resources facilitates the continuation of the current practice where actual allocations appear to be made in a bureaucratic and closed manner influenced by political considerations and special pleading. An immediate step in easing this situation is for MFPED and MAAIF senior officials to meet to discuss ways of improving the content and presentation of the SBFP. MAAIF could also allot more time to the budget preparation process by starting the preparation of the SBFP earlier. However, much more than this is required. During the inception phase of the Review it was agreed that the Study Team would provide an action plan to enable MAAIF to improve budget processes with a view to enhancing efficiency in public spending in agriculture. This action plan is provided in Box 6.1 below. (iv) Donor funding. There is a conundrum related to donor funding of projects that needs to be resolved. Although the MTEF ceiling is tight from the viewpoint of budget allocations, disbursements of donor funds are so low that actual development expenditure is always significantly below the MTEF ceiling. This implies that more could be spent if disbursement rates were raised. However, for a variety of reasons

Uganda Agriculture Sector Public Expenditure Review Phases 1 and 2
Oxford Policy Management 50
low disbursement rates are a characteristic feature of large projects and the Study Team considers that, for most purposes, they are no longer the most suitable funding modality for the agricultural sector. As noted above, there is a need for MAAIF to design a portfolio of projects to implement the revised DSIP; they could be funded mainly by GoU using domestic finance and, thus, donor budget support.
Box 6.1: Proposed MAAIF Action Plan
The following actions are proposed to enable MAAIF to improve budget processes with a view to enhancing efficiency in public spending in agriculture.
Ensure that performance monitoring and results-oriented management are used systematically and effectively throughout MAAIF. This would require, and lead to, a substantial improvement in the quality of the reporting system, with a critical examination of the reasons for variations between planned and actual outputs and attention being paid to the cost-effectiveness of different programmes and resource allocations. However, this change can only be effective if it is given strong Ministerial support and if it is seen to be implemented and supported by the Permanent Secretary and his senior colleagues.
Assess the training needs, capacity building and resource requirements of the new system. The Study Team understands that all staff members have received ROM-related training, but there is probably a need for further in-service training to make this operationally effective. The Adviser to APD could play an invaluable role in helping this assessment to be undertaken and in conducting some of the training, but there may be a need for additional technical assistance, perhaps financed by the development partners.
Revitalise the SWG, which already has a remit to monitor the performance of budget expenditures in its TORs but does not fulfil this function. A revitalised SWG would have a year-round agenda, which would help to increase its effectiveness. MFPED could strengthen the case for more-effective performance monitoring if it insisted on a more rigorous analysis and presentation of sector performance in both the SBFPs and the quarterly Performance Reports.
Embark on an immediate revision of the DSIP for 2008/09 onwards, taking steps outlined in Section 3.1.3 to enhance its credibility, in order to provide the means by which there can be a continuing link between policy, planning and budget preparation and negotiations.
Develop a portfolio of value-for-money projects to operationalise the revised DSIP, designed to, among other things, ensure high disbursement rates and to be funded mainly through domestic development funds (including budget support).

Uganda Agriculture Sector Public Expenditure Review Phases 1 and 2
Oxford Policy Management 51
Annex 1: Terms of Reference
Agriculture Sector Public Expenditure Review, Phases 1 and 2. The Objective: The study is part of a wider review of public expenditure in the sector which will help identify types of expenditure best for pro-poor growth. It will provide a comprehensive assessment of public financing in the Agriculture Sector using the definition of the Sector set out in COFOG. The study will assist MAAIF to undertake further PER work in the sector and provide tools and methods to support this. The Recipient: The Ministry of Agriculture, Animal Industry and Fisheries, Ministry of
Finance, Economic Planning and Development and the PMA Development Partners group. Phase 1. The Level and Patterns of Allocation in the Agriculture Sector
The Scope: It will look at the current and historical patterns of allocation within the
sector and the source of funding (government and donor) and mode of financing (loans/grants/etc.). About 37% of the annual budget goes directly to the districts, which under the decentralization process are responsible for providing most of the services. The analysis thus needs to be conducted both at the national or central level and at the district or local government levels. Among the issues to be reviewed would include:
Overall trends in allocations to the sector (going back up to 20 years if feasible), in absolute terms and relative to other sectors, the overall budget and sector GDP,
Functional and economic classification of agriculture sector budget and changes therein overtime,
The levels and trends of recurrent and development expenditure, clearly identifying the salary, operational costs and development components (which are often included in both the recurrent and development expenditure categories)
Sub-sectoral allocations against core functions (set out in the MAAIF DSIP and PMA core document) and by commodity (i.e., crop, livestock and fisheries).
Allocations against policy priorities and principles set out in the PEAP and PMA and other more recent policy statements, including an assessment of expenditures from the perspective of public-private sector roles and functions in the delivery of goods and services
The scale and management of allocations to the sector functions (from COFOG) made through central government ministries and local government.
Composition and performance of agriculture budget by funding source - government vs external/donor, and external/donor financing by funding modality (projects, sector budget support, general budget support, etc.)
Changes overtime in the share of agriculture‟s budget spent at the centre and transferred to districts,
Estimation of the amount of off-budget expenditure going into the agriculture sector by activities (sub-sectors).
Uganda Agriculture Sector Public Expenditure Review Phases 1 and 2
Oxford Policy Management 52
The consultants will work closely with MAAIF staff in the Agricultural Planning Department, to ensure that they:
become familiar with the tools, methods and approaches used in the study and are able to undertake similar analyses in the future
improve their capacity for setting sector priorities and managing the annual budget process.
Phase 2: The Budget Process and Performance.
The Scope: The study will critically review the formulation and execution of the budget by government agencies. It will assess the overall budgeting process and system, identify weaknesses and suggest options and implementation strategy for its improvement with a view to attaining long-term efficiency in public spending. Among the other specific issues to be addressed include:
A critical assessment of the performance and effectiveness of the overall budget process – formulation, implementation, monitoring and evaluation of budgets, programmes, outputs and outcomes, and identify potential value for money issues; make recommendations on how to improve the process where necessary
The agriculture sector budget execution and performance by item and agency; assessment of the utilization and operational efficiency of public funds and identification of critical constraints to effective budget execution
The trends in budget allocations to the sector, corresponding releases and actual expenditures, implicit variances and overall sector budget execution by agency, as an assessment of absorptive capacity and management issues
Allocations and expenditure against key policy priorities, along with a description of the process underlying this prioritization. Are the linkages between objectives, organizational functions, outputs and resources available adequate?
Influence and impact or performance of differing funding sources (e.g.: projects vs earmarked budget support) on the allocation to agriculture and within agriculture, and the alignment and execution of the budget against sector priorities
The capacity of the institutions in the sector to formulate and execute their budgets, and make a convincing claim for scarce public resources
The links between and the impact of decentralization on the budget process, including the accountability of services
Political economic analysis of agricultural public expenditures and processes, and an implementation strategy.
The consultants will work closely with MAAIF staff in Agricultural Planning Department and budget voteholders, to ensure that they
become familiar with the tools, methods and approaches used in the study and are able to undertake similar analyses in the future
improve their capacity for setting sector priorities and managing the annual budget processreforms.
Uganda Agriculture Sector Public Expenditure Review Phases 1 and 2
Oxford Policy Management 53
Method: The study will be undertaken by a team of consultants, based for the
duration of the study in Kampala and working under the overall guidance of the Agriculture Sector Working Group. Management of the work by MAAIF on a day to day basis will be undertaken by the Agricultural Planning Department in MAAIF. Reporting: The consultant will report back to the PS, MAAIF. The consultants will provide an inception report to the TC within 5 days of the beginning of the work setting out in detail the approach to be taken, key milestones in delivery of the final report, and the structure of the final report. The Inception report will also highlight any design issues which need to be further discussed by the SWG. A draft final report will be submitted to the SWG 2 days before the study team finish their work. Timeframe: The work will begin on the 19th March and will run for 11 weeks.
Uganda Agriculture Sector Public Expenditure Review Phases 1 and 2
Oxford Policy Management 54
Annex 2: Inception Report (main sections33)
1 Purpose of the review
(See text of main report)
2 Approach to the terms of reference
Ownership by MAAIF. It is important that the PER process is viewed by MAAIF as an internal process that is being undertaken in order to provide improved data on patterns of spending in agriculture and its alignment with agricultural policies and strategies, and to strengthen the overall budget process within MAAIF. Over the longer-term, the aim is to provide MAAIF with the necessary data and tools to improve the targeting and development impact of agriculture sector spending, and to strengthen the justification for agriculture spending within annual budget negotiations. To ensure a close working relationship with MAAIF for the duration of the study the team will meet regularly with a Technical Committee (TC) chaired by MAAIF that will oversee the work of the team. Key meetings with the TC are indicated in the proposed Schedule (Annex 5) although others may be called as and when needed. In addition to interaction with MAAIF through the TC, it is understood that MAAIF will assign two staff to work with the PER team. This initiative is welcomed and is an important capacity-building component of the assignment. Phase 1 and Phase 2. Although the study is contracted in two phases, in practice the consultants are approaching the assignment as a single task. COFOG definition. The use of the COFOG definition of the agriculture sector requires information to be collected and analyzed relating to the core functions of the agriculture (includes crops and livestock), fishing, forestry and lands sub-sectors. This will include all recurrent and development spending by MAAIF whose mandate covers crops, livestock and fishing, including all of its semi-autonomous agencies34. However, the in the bulk of funds for irrigation development are allocated to the Ministry of Water and Environment (MWE) from where data on this expenditure item will need to be obtained. The Ministry of Lands, Housing and Urban Development (MLHUD) has the mandate to invest in land-related institutions and land reforms and any agriculture sector-related expenditure will need to be obtained from this source. The core functions for forestry are now under the mandate of the National Forestry Authority (NFA) within the MWE, which will require information to be collected in both the NFA and MWLE. A detailed breakdown of the agriculture COFOG classification is provided in Annex 3 and a proposed list of agencies and institutions to be visited by the study team is provided in Annex 6. Use of PEFA indicators. Many of the issues to be examined in this review, particularly under the Phase 2 ToRs, relate to the indicators developed in the Public
33
Only the part of the Inception Report dealing with the methodology used in the study is presented here. With the exception of Annex 3, the Annexes referred to below are not reproduced. 34
Cotton Development Organisation; Dairy Development Authority; National Agricultural Advisory Services (NAADS); National Agricultural Research Organisation (NARO); National Animal Genetic Resource Centre and Data Bank; Uganda Coffee Development Authority (UCDA); Uganda Trypanosomiasis Control Council.

Uganda Agriculture Sector Public Expenditure Review Phases 1 and 2
Oxford Policy Management 55
Expenditure and Financial Accountability (PEFA) PFM Performance Measurement Framework35. The study team understands that this approach has previously used in Uganda for two recent studies:
PFM Performance Report and Update of CIFA Action Plan, Final Report, July 2006
Local Government PFM Assessment, Draft December 21, 2005 Whilst it would be over-ambitious, given the resources and timescale available for this study, to attempt to use the PEFA indicator set for a formal measurement of relevant indicators the study team will be guided by both the suggested dimensions to be assessed and the scoring criteria in their examination and evaluation of various aspects of the budget process. District analysis. As noted above, several agricultural sector core functions have been devolved to local government. For some activities there are multiple sources of funds. For example extension funds are allocated both through the MAAIF budget for the District agricultural extension service and through National Agricultural Advisory Service (NAADS). However, a proportion of budgetary resources is allocated to the districts in the form of unconditional grants, other discretionary grants and transfers. This will necessitate collecting information on relevant expenditure through the Poverty Action Fund (PAF) or directly through the Ministry of Local Government (MoLG), and through interviews with a sample of districts. It has been agreed that information should be collected from seven districts. These should be „old‟ districts for which data should be available from 2000/01 onwards. Three of these districts are to be selected from those included in the early phases of the fiscal decentralization strategy (2001/02) and three selected from later phases. In addition, the districts selected should each have significant expenditures in all of the sub-sectors included in the COFOG classification of agriculture, i.e. crops, livestock, fisheries and forestry. Using these criteria, the study team proposes the following seven districts as the representative sample:
First phase fiscal decentralization: Bushenyi Lira Mukono Soroti Tororo Later phases of fiscal decentralization
Arua Masaka
District-level data and information will be collected from MoLG. In addition, the study team proposes to conduct interviews in each of these districts to verify the data and discuss any issues arising.
35
World Bank (2006) Public Expenditure and Financial Accountability Public Financial Management Performance Measurement Framework Reprinted June 2006 PEFA Secretariat, World Bank: Washington DC.
Uganda Agriculture Sector Public Expenditure Review Phases 1 and 2
Oxford Policy Management 56
Focus upon major areas of spending. The Inception Report highlights a number of areas where the study team is likely to face difficulties due to lack of expenditure data or the way in which this data is recorded and presented (for example, in the determination of off-budget expenditures, in the identification of recurrent spending and its allocation across different agriculture functions, in reviewing the „policy alignment‟ of individual projects, and in the disaggregation of spending by commodity or specific services). The approach of the team in such cases will be to allocate time and resources to these issues in a manner that is commensurate with the level of funding in question, so that detailed analysis is focused towards the major areas of spending.
3 Expenditure trends - data collection and analysis
The study will review current and historical patterns of expenditure allocations to, and within, the sector as well as the source of funding (government and donor) and mode of financing. As indicated above, around one-third of the state budget goes directly to the districts, which under decentralisation play a major role in services delivery. The expenditure analysis thus needs to be conducted both at national and district levels.
3.1 Aggregate long term expenditure allocation trends
The study will review aggregate trends in total, recurrent and capital expenditure allocations to the agricultural sector for the past twenty years, i.e. from 1986 if feasible. This will include Government of Uganda (GoU) expenditure allocations, both through central and local government channels, and development partner funding. Agricultural sector expenditure data will be presented in tabular and diagrammatic forms:
In current and real terms (Ushs million), using the appropriate IMF deflator;
As a percentage of overall public expenditure;
As a percentage of agricultural sector GDP.
If it proves difficult to obtain consistent information on development partner expenditure in the agricultural sector the tables will record only domestic expenditure, with the available data on development partner expenditure being shown separately.
3.2 Disaggregated recent expenditure allocations
This will entail a disaggregation and examination of the agriculture sector budget allocations for 2000/01 onwards and the agricultural sector Medium Term Expenditure Framework (MTEF) allocations for 2006/07 – 2008/09 (or 2007/08 – 2009/10, if available) in terms of both economic classification and functional criteria. Disaggregation by economic classification
In terms of economic classification, the total budget allocations will be disaggregated into recurrent and capital expenditure using the IFMS classification. Recurrent expenditure will be disaggregated further into wage and non-wage (operational) components. Additional breakdown of operational expenditure will be attempted if there are significant and clearly identifiable components. Capital expenditure will be disaggregated further into domestically-funded and development partner-funded expenditure. To the greatest extent possible, any recurrent expenditure included within development partner-funded „development‟ expenditure will be identified and
Uganda Agriculture Sector Public Expenditure Review Phases 1 and 2
Oxford Policy Management 57
appropriately classified. The information will be presented in tabular form (examples are shown in Annex 7) in absolute (Ushs million) real terms using the appropriate IMF deflator. This data will be analyzed in terms of trends in the:
Absolute level of agricultural expenditure;
Total agricultural expenditure as a percentage of total state expenditure and as a percentage of agriculture GDP;
Absolute level of total recurrent expenditure (broken down into salary and allowances) and non-wage (operational) expenditure;
Absolute level of capital expenditure;
Domestic capital expenditure as a percentage of total capital expenditure. Disaggregation by functional criteria
In terms of functional criteria, COFOG identifies the core areas of government functions relevant to the agricultural sector (Annex 1). All of the activities carried out by MAAIF appear to fall within these core areas. In addition, as mentioned in Section 1 above, some activities carried out by semi-autonomous agencies and other line ministries also fall within the COFOG definition of agriculture. Although MAAIF‟s Development Strategy and Investment Plan (DSIP) (2005/06 – 2007/08) categorises future functions into twelve priority strategy areas, historically MAAIF expenditure data can only be disaggregated on a „departmental‟ basis i.e. NAADS, NARO, livestock health, planning, policy, plant protection, etc. and the study team are thus constrained to using this as the basis of a functional analysis. Where significant items of expenditure exist within functions at the level of specific services (e.g. vaccinations) these will be highlighted separately. The information will be presented in tabular form. One problem that may emerge is difficulty in allocating recurrent expenditures (salaries and other „overheads‟) to the various agriculture functions. For some functions (e.g. NARO and NAADS) recurrent spending such as salaries can be identified and allocated to the research/ extension function. However, allocating central MAAIF salaries by function is problematic. Our approach to this issue will be determined once we have more information on the available data and will be discussed and agreed with the study Technical Committee.
The TORs also require expenditure allocations to be disaggregated by commodity. This will be easiest to achieve for forestry as virtually all COFOG-relevant forestry expenditure allocations are provided separately to the rest of agricultural sector expenditures. While it may also be possible to allocate specific items of expenditure against some of the major commodities within the crops, livestock and fisheries sub-sectors, inevitably there will be certain difficulties in doing this. However, the study team will attempt to ensure that a consistent approach is taken to this commodity classification so that any significant trends or imbalances between expenditure allocations to the various commodity groups are made apparent.
3.3 Allocations against PEAP and PMA policy priorities and principles.
The TORs call for a review of „Allocations against policy priorities and principles set out in the Poverty Eradication Action Plan (PEAP) and Plan for the Modernisation of Agriculture (PMA) and other more recent policy statements, including an assessment
Uganda Agriculture Sector Public Expenditure Review Phases 1 and 2
Oxford Policy Management 58
of expenditures from the perspective of public-private sector roles and functions in the delivery of goods and services‟. As mentioned earlier, MAAIF‟s Development Strategy and Investment Plan (DSIP) (2005/06 – 2007/08) categorises future functions into twelve priority strategy areas (Annex 4). Moreover, the DSIP states that these priority strategy areas were selected on the basis of the policy priorities and principles set out in the PEAP and PMA. Thus our approach will be to use the DSIP strategy areas, together with priority areas compatible with PEAP principles in the forestry and lands sub-sectors, as the basis for comparing agriculture sector expenditures with the PEAP and PMA policy priorities and principles. Any significant differences that emerge between the DSIP breakdown and the COFOG classification will clearly be identified. The team will:
Compile an inventory of all current and pipeline investment expenditure (projects) in the agriculture sector consistent with the COFOG classification, derived from the government‟s own inventory;
Analyse and comment on the process and criteria by which projects currently are reviewed and accepted for funding;
Apply a method of objectively assessing the alignment of on-going programmes with DSIP, forestry and lands priorities, as well as the principles and priorities of the PMA and PEAP, including an assessment of what should be publicly and privately funded;
Identify strengths and weaknesses in the portfolio of on-going agriculture sector projects and programmes, including gaps, overlaps and mismatches, and recommend corrective action.
3.4 Allocations between central and local government
The TORs call for a review of the „scale and management of allocations to the sector functions (from COFOG) made through central government ministries and local government‟. This will be achieved through an analysis of agricultural sector expenditure since 2000/01 obtained from MoLG statistics, including agriculture conditional grants, classified using the 12 DSIP and forestry and lands priority intervention areas. Patterns of expenditure in the 7 sample districts will also be obtained. The consultants will highlight:
Differences between the overall functional allocations at central government level and the functional allocations in the sample districts;
The degree of variability in the functional allocation between districts;
The main components of recurrent cost expenditure in the sample districts and their alignment with District Development Plans;
Changes over time in the share of the funds allocated to the agricultural sector budget spent at the centre and transferred to districts.
3.5 Approved vs actual agricultural sector expenditure
The approved agricultural sector expenditure (budget allocations) for the years since 2000/01 will be classified by funding source (i.e. domestic / development partner). Development partner funding will be shown by individual donor agency, and, to the

Uganda Agriculture Sector Public Expenditure Review Phases 1 and 2
Oxford Policy Management 59
extent possible, by funding modality (i.e. project funding, sector budget support, general budget support, etc). Supplementary allocations additional to the original budget allocations will also be identified and their significance and alignment with overall national/ sector policies evaluated. The actual level of expenditure in each year for each of these various funding modalities will then be compared with the planned expenditure to give a measure of „performance‟ of each form of modality. This information will be used as the basis of one of the issues to be addressed in Phase 2 of the study.
3.6 Off-budget expenditure
An attempt will made to estimate the amount of off-budget expenditure in the agricultural sector disaggregated by the 12 DSIP priority intervention areas (plus forestry and lands priority areas). The study team will use a short questionnaire when interviewing the main development partners known to be funding agricultural sector activities, whether through the budget or through off-budget procedures (including DANIDA, DFID, EU, JICA, SIDA, USAID, WB and some of the international NGOs). Our past experience cautions against expecting anything more than an estimate of off-budget expenditure being obtained from this exercise.
4 Budget processes
The team will review the formulation, execution and evaluation of the agriculture budget at both central and district levels. The analysis will cover the overall budgeting process and system, identifying weaknesses and providing recommendations for overcoming any problems identified. The team will suggest options and a strategy for the improvement of the budget process with a view to attaining increased efficiency in public spending over time. The consultants will structure the analysis around the three main stages of the budget cycle, including assessment of the impact of decentralisation as appropriate. Any political economy issues that emerge that affect the operation of the budget process will be noted and analysed.
4.1 Budget preparation
There are two elements to this. The first reflects the objective of the MTEF in ensuring a strong linkage between sector policy and actual expenditures. The consultants will therefore review forward looking expenditure proposals submitted by MAAIF and the extent to which these estimates reflect policy decisions or options described in sector strategy documents (e.g. the DSIP). Critical issues here are:
The extent to which new policies are affordable within aggregate fiscal targets as set by MoFPED;
The extent to which forward budget estimates for agriculture include explicit costing of the implication of new policy initiatives, and involve clear and strategy-linked selection criteria for investments that subsequently are integrated into the annual budget formulation process;
Whether there is adequate provision for the recurrent cost implications of on-going and proposed future capital investments whether funded from domestic sources or development partners;
The role of the Agricultural Sector Working Group in the MTEF process.
Uganda Agriculture Sector Public Expenditure Review Phases 1 and 2
Oxford Policy Management 60
The second element relates to the involvement of MAAIF and related sector agencies in the annual budget preparation process. While MoFPED is the driver of the annual budget formulation process, effective participation by MAAIF in the process is critical in ensuring that agriculture priorities are reflected in annual budget allocations. The consultants will assess the extent to which MAAIF, through the sector budget working group and other institutions, participates in annual budgeting in an orderly and timely manner, and in accordance with the budget framework guidelines prepared by MoFPED, including adherence to indicative budgetary ceilings for the ministry and its administrative units or functional areas.
4.2 Budget control and execution
The consultants will review the capacity of government and its agencies effectively to execute the agriculture budget through the allocation of expenditure according to the purposes indicated and by the raising of sector revenues (as applicable). This will involve analysis in a number of key areas:
Predictability in the availability of funds for commitment of expenditures to agriculture – an issue that can be critical for agriculture (determined largely by the manner in which Treasury releases are made);
Adherence to GoU procurement regulations – in relation to transparency, competitiveness and financial probity ;
Management and effectiveness in the collection of any agriculture sector revenues (levies or taxes, e.g. in forestry and from livestock vaccinations);
The existence of internal audit procedures within MAAIF and its agencies, and other line ministries involved in the agricultural sector, the extent of management response to internal audit findings (note: the team will not comment on the effectiveness of audit in relation to international audit standards).
4.3 Budget accounting, reporting, and audit
This involves accounting for and reporting on financial and non-financial performance and, at the end of the fiscal year, consolidating this information into a report for submission to MoFPED and subsequent legislative review and audit. The consultants will examine this process in relation to agriculture expenditures. Key areas for analysis are:
The extent to which current systems enable the tracking of information on resources received by agriculture service delivery units;
The quality and timeliness of in-year budget reports, and annual financial statement for agriculture sector spending;
The scope, nature, and follow-up of external audit as it applies to agriculture spending.
Note: The ToRs request that the study team include analysis of budget outcomes
and value for money issues as part of their work. However, this is a major undertaking given the limited time and resources available to the team. Furthermore, this aspect is due to be covered in the Phase 3 work to be undertaken in late 2007, which will address efficiency issues in agriculture service delivery. The team therefore propose not to address this element of the ToRs. Nevertheless, any

Uganda Agriculture Sector Public Expenditure Review Phases 1 and 2
Oxford Policy Management 61
impressions that the team gain of areas that warrant more detailed investigation in Phase 3 will be included in the report.
5. Schedule and team inputs
The schedule of work and team inputs is attached as Annex 3. Data collection for Phase 1 will commence on 26 March and the draft Inception Report will be submitted to the Technical Committee on 28 March. The draft final report will be submitted to the Permanent Secretary, MAAIF by 24/25 May. The final report will be submitted to the PS, MAAIF by 30 May 2007.
6. Structure of final report
The final report will be structured mainly along the lines of the approach taken in this Inception Report, namely
Executive summary (2 pages)
1. Purpose of review (2 pages)
2. Expenditure trends and resource allocation (15 pages)
2.1 Aggregate long term expenditure allocation
2.2 Disaggregated recent expenditure allocations
2.3 Allocations between central and local government
2.4 Planned vs actual agricultural sector expenditure
2.5 Off-budget expenditure
2.6 Allocations against PEAP and PMA policy priorities and principles
3. Budget processes (8 pages)
3.1 Budget preparation
3.2 Budget control and execution
3.3 Budget accounting, reporting and audit
4. Summary and recommendations (4 pages)
Methodological and other annexes

Uganda Agriculture Sector Public Expenditure Review Phases 1 and 2
Oxford Policy Management 62
Inception report (Annex 3)
Core Areas of Government Functions Relevant to the Agriculture Sector Based on Classification of Functions of Government (COFOG)
AGRICULTURE COFOG Class: 04.2.1 (http://unstats.un.org/unsd/cr/registry/regcs.asp?Cl=4&Lg=1&Co=04.2.1)
Administration of agricultural affairs and services; conservation, reclamation or expansion of arable land; agrarian reform and land settlement; supervision and regulation of the agricultural industry;
Construction or operation of flood control, irrigation and drainage systems, including grants, loans or subsidies for such works;
Operation or support of programmes or schemes to stabilize or improve farm prices and farm incomes; operation or support of extension services or veterinary services to farmers, pest control services, crop inspection services and crop grading services;
Production and dissemination of general information, technical documentation and statistics on agricultural affairs and services;
Compensation, grants, loans or subsidies to farmers in connection with agricultural activities, including payments for restricting or encouraging output of a particular crop or for allowing land to remain uncultivated.
Excludes: multi-purpose development projects (04.7.4). Class: 04.8.2 - R&D Agriculture, forestry, fishing and hunting (http://unstats.un.org/unsd/cr/registry/regcs.asp?Cl=4&Lg=1&Co=04.8.2)
Administration and operation of government agencies engaged in applied research and experimental development related to agriculture;
Grants, loans or subsidies to support applied research and experimental development related to agriculture by research institutes and universities.
FORESTRY Class: 04.2.2 (http://unstats.un.org/unsd/cr/registry/regcs.asp?Cl=4&Lg=1&Co=04.2.2)
Administration of forestry affairs and services; conservation, extension and rationalized exploitation of forest reserves; supervision and regulation of forest operations and issuance of tree-felling licenses;
Operation or support of reforestation work, pest and disease control, forest fire-fighting and fire prevention services and extension services to forest operators;
Production and dissemination of general information, technical documentation and statistics on forestry affairs and services;
Grants, loans, or subsidies to support commercial forest activities. Includes forest crops in addition to timber. Class: 04.8.2 - R&D Agriculture, forestry, fishing and hunting
Administration and operation of government agencies engaged in applied research and experimental development related to forestry;
Grants, loans or subsidies to support applied research and experimental development related to forestry and undertaken by research institutes and universities.
FISHING & HUNTING Class: 04.2.3 (http://unstats.un.org/unsd/cr/registry/regcs.asp?Cl=4&Lg=1&Co=04.2.3)
Administration of fishing affairs and services; protection, propagation and rationalized exploitation of fish stocks; supervision and regulation of freshwater fishing, coastal fishing, ocean fishing, fish farming and issuance of fishing licenses;
Uganda Agriculture Sector Public Expenditure Review Phases 1 and 2
Oxford Policy Management 63
Operation or support of fish hatcheries, extension services, or stocking activities, etc.;
Production and dissemination of general information, technical documentation and statistics on fishing affairs and services;
Grants, loans, or subsidies to support commercial fishing activities, including the construction or operation of fish hatcheries.
Administration and operation of government agencies engaged in applied research and experimental development related to fishing;
Grants, loans or subsidies to support applied research and experimental development related to fishing undertaken by research institutes and universities.
Excludes: control of offshore and ocean fishing (03.1.0); administration, operation or support of natural parks and reserves (05.4.0).
Uganda Agriculture Sector Public Expenditure Review Phases 1 and 2
Oxford Policy Management 64
Annex 3: Persons met
Ministry of Agriculture, Animal Industry & Fisheries Vincent Rubarema Permanent Secretary Rhoda Tumusiime Commissioner of Agricultural Planning Fred Mayanja Senior Finance Officer Mark Otim Assistant Commissioner, Planning, Mark Othieno Assistant Commissioner James Joughin Adviser, Agricultural Planning Department Boaz Keizire Senior Economist Dr Nicholas Kauta Commissioner of Livestock Health Dick Nyeko Commissioner of Fisheries Development Bulegeya Komayobi Commissioner of Plant Protection Alfred Wasolo Principal Accountant (0772-669-451) Yusuf Nsubuga Senior Accountant Joseph Kyamanywa Finance & Admin Manager NAADS Secretariat Tom Kakuba Acting Director PMA Secretariat Tom Mugisa Programme Officer PMA Secretariat Williams Ajoka Administrator/Accountant PMA Secretariat Richard Kabuleta Assistant PMA Secretariat Mary Kiggundu Chief Accountant NARO Grace Rugambwa Senior Finance Officer NARO Secretariat Connie Masaba Co-ordinator VODP Thomas Ojok Assistant Commissioner, Human Resources Development B. Nsimbe Co-ordinator, Fisheries Development Project Hillary Magunda Board Secretary Cotton Development Organisation Willy E G Owachi Finance Secretary Cotton Development Organisation Ministry of Finance, Planning & Economic Development
Angela Katama Private Sector Expert CICS Secretariat Dr Peter Ngategize National Co-ordinator CICS Secretariat Kenneth Mugambe Director of Economic Affairs Tisasirana L K Asst. Commissioner, Economic Devt., Policy and Research F. Tumwebaze Aid Liaison Department Ministry of Local Government
Gilbert Kiracho Information Systems Officer Ministry of Water and Environment Forestry Inspection Division
Richard Chong Assistant Commissioner Mr. I. Oluka-Akiling Principal Forestry Officer Charles Byrauhanga Forestry Officer Margaret Adata Senior Forestry Inspector John Awine Principal Forest Officer Rachel Musoke Assistant Commissioner Environment Inspection Margaret Mwebesa Senior Forestry Inspector S.R. Byarugaba Principal Forestry Officer National Forestry Authority
Paul Drichi Acting Executive Director Anatole Batabane Director of Finance

Uganda Agriculture Sector Public Expenditure Review Phases 1 and 2
Oxford Policy Management 65
Paul Musamali Acting Director of Corporate Affairs Development Partners
Dr Alan Tollervey Livelihoods Advisor DFID Dr Madhur Gautam Economist World Bank Dr Willie Odwongo Economist World Bank Lars Rimmer Counsellor Royal Danish Embassy Asaph Nuwagira Ag. & Rural Dev. Specialist African Development Bank Veronique Lorenzo Head of Rural Dev. Section EC Delegation Pontian Muhwezi Program Policy Co-ordinator IFAD Matthais Percl Programme Analyst UNDP Alexander Aboagye Economic Adviser UNDP Justin Ecaat Environmental Specialist UNDP Charles Owach Assistant Representative FAO Alexis Bonte Deputy Emergency Co-ord. FAO Bernard Onyango Data Analyst FAO ASPS II project
Warwick Thomson Chief Technical Adviser Others
Dr Jack Ruitenbeek Consultant, Sustainable Land Management PER Frank Vorhies Consultant, Sustainable Land Management, PER Mukono District
Dr Fred Mukulu District Production Officer Siraji Lyombye District Fisheries Officer James Kitali District Fisheries Officer Doreen Kataama District Agricutural Officer Annette Nassozi District Entomologist Christopher Mayanja District Planner Dr H. Mutumba District Veterinary Officer Soroti District
Dr.Joel Okalany District Production Coordinator Martin Ameo District Agricultural Officer Mr. Mbire District Planner Stephen Okudu Senior Accountant Lira District
Dr. Jacob Oweta District Production Coordinator James Ekonga Chief Finance Officer Peter Ajungu District Agricultural Officer Richard Adoko Deputy Chief Finance Officer Geoffery Ebonga Principal Accountant Masaka District
Dr. Paul Kanoonya District Production Coordinator Dr. Lawrence Mayega District Veterinary Officer Lugolobi Luyiga Accountant Julius Magonza District Entomology Officer Peter Ssennabulya District Fisheries Officer Paul Kiyemba Agricultural Officer Paul Ssebwana Sub-Accountant – Production
Uganda Agriculture Sector Public Expenditure Review Phases 1 and 2
Oxford Policy Management 66
Bushenyi District
Mathias Ndifuna Principal Assistant Secretary Dr. F. Muhumuza Ag. District Production Coordinator Peves R. Kakumu District Foresty Officer Joseph Mujungu Ag. Senior Lands Officer Allan Agaba For District NAADS Officer Gordon Tumuhimbise District Entomology Officer Cyril Mugyenyi District Natural Resource Officer J. Tumushabe District Agricultural Officer David Byaruhanga District Statistician Arua District Jimmy B. Ayoma District Production Co-ordinator Christopher Enima District Fisheries Officer Stella Achan District Population Officer Caroline Arubaku District Agricultural Officer Dr Okolloni Edoni Senior Veterinary Officer Robert Wadribo Senior Accounts Assistant Cyprian Ogwang District Commercial Officer Dr Gordon Victor Toa District Veterinary Officer Tororo District Eva Musenero District Production Coordinator Patrick Nkwanga District Fisheries Officer/Ag. CM Tororo DATIC James Ogwang Forest Ranger William Wangolo Forest Ranger Patrick Okware Ag. DAO Egos Opolot P.R.A District Commercial Officer Onyango-Odoi Ag. Land Officer Mukonge Tegule District Veterinary Officer James Kalange District NAADS Coordinator
Uganda Agriculture Sector Public Expenditure Review Phases 1 and 2
Oxford Policy Management 67
Annex 4: Bibliography
Akroyd, S. and Smith, L (2007) Review of Public Spending to Agriculture. Main Sudy and Country Case-studies. A joint DFID/ World Bank Study, Oxford Policy
Management, January. Birner, R. and Palinaswamy, N. (2006). The Political Challenges of Increasing Public Spending for Agricultural Development in Africa. Paper presented at the international
conference on „Championing Agricultural Successes for Africa‟s Future: A Parliamentarian‟s Dialogue on NEPAD‟. Somerset West, South Africa, May 2006.
Food and Agriculture Organisation. 2006(a). Dissemination of NERICA and improved rice production systems to reduce poverty and food deficit in Uganda.
Project proposal (GCP/UGA/035/JPN). Food and Agriculture Organisation. 2006(b). Improving integrated production and pest management to control Banana Bacterial Wilt. Project proposal (TCP/UGA/3102[T]).
Food and Agriculture Organisation. 2007. Emergency relief and rehabilitation country overview: Uganda. Draft Mimeo.
Food Security Group. 2007. Food security activities implemented by humanitarian agencies (excluding food aid) in Uganda during the first season of 2007: mid-season data update. FAO, Kampala..
Independent Consulting Group. 2005. Review of use of the Non-Sectoral Conditional Grant (NSCG) by local governments for the period 2000/01-2003/04.
Final report. PMA Secretariat36. MAAIF. 2002. Final accounts, 2001/02. Mimeo.
MAAIF. 2003. Reports and financial statements of MAAIF for the year ended 30 th June, 2003. Government of the Republic of Uganda. MAAIF. 2004. Annual performance monitoring and evaluation report for July 2003-June 2004. Monitoring & Evaluation Division, Agricultural Planning Department. November MAAIF. 2005. Annual performance monitoring and evaluation report for July 2004-June 2005. Monitoring & Evaluation Division, Agricultural Planning Department. October MAAIF. 2006. Reports and financial statements for the year ended 30th June, 2006. Government of the Republic of Uganda. MAAIF. 2006. Development strategy and investment plan (2005/06-2007/08). May.
36
For a number of reasons the data contained in this report are incorrect. Following the release of the report, the PMA Secretariat took steps to improve the standard of reporting on NSCG expenditure by local governments. Data on the NSCG used in the PER have therefore been obtained directly from the PMA Secretariat.

Uganda Agriculture Sector Public Expenditure Review Phases 1 and 2
Oxford Policy Management 68
MAAIF. 2007. Sector Budget Framework Paper, 2007/08 to 2009/10. Mimeo of
01/02/07) Agriculture Sector Working Group. MFPED. 2001. Budget performance report, 2000/01. November.
MFPED. 2002. Macro-economic plan and indicative budget framework for 2002/03-2004/05. Submission to Parliament under the Budget Act 2001 (Section 4).
MFPED. 2004. Annual budget performance report, FY 2003/04. November. MFPED. 2005. National Budget Framework Paper for 2005/06 to 2007/08.
Government of Uganda. MFPED. 2006. Development Co-operation Uganda 2005/06 Report: access to quality education is essential for social transformation and prosperity. Republic of
Uganda. November. MFPED. 2007. National Budget Framework Paper for 2007/08 to 2009/10. March.
Government of Uganda. MFPED. 2007. Finalisation of estimates for recurrent and development revenues and expenditure for 2007/08. Memorandum 03/04/07. MFPED. n.d. Various memorandum/communications from Ministry of Finance,
Planning and Economic Development. Mimeo. MFPED. n.d. Draft estimates of revenue and expenditure (recurrent and development) FY 2006/07 for the year ending on the 30 th June 2007. Kampala:
Republic of Uganda. Nabbumba, R. 2007. Progress in implementation of the Non-Sectoral Conditional Grant. Mimeo. PMA.
NARO. 2005. Response and action taken on the Auditor General‟s report and opinion for the financial year ended June 30th 2004, to the Public Accounts Committee. Mimeo. Entebbe. NARO. 2006. Response and action taken on the Auditor General‟s Management Letter for the financial year ended 2004/05, to the Public Accounts Committee. Mimeo. Entebbe. National Forestry Authority. n.d. Annual report 2005/2006. Kampala.
National Forestry Authority various. Annual budget for 2006/07 and 2007/08.
Kampala. National Forestry Authority. various. Financial statements for the years ending 30th June 2004, 2005 & 2006, together with the report and opinion thereon by the Auditor General. Kampala. Nygaard, D., R. Paarlberg, J. Sanyu-Mpagi, R. Matovu & S. Babu. 1997. The modernisation of agriculture in Uganda: the political challenge of moving from adjustment to investment. Research conducted by IFPRI. The Ford Foundation. Draft.

Uganda Agriculture Sector Public Expenditure Review Phases 1 and 2
Oxford Policy Management 69
Republic of Uganda. 2003. Budget speech delivered at the meeting of the 3rd session of the 7th Parliament of Uganda on 12th June, 2003 by Hon. Gerald Ssendaula.
Republic of Uganda. 2004. Budget delivered at the meeting of the 4th session of the 7th Parliament of Uganda on 10th June, 2004, by Hon. Gerald Ssendaula. Republic of Uganda. 2006. Budget speech for Financial Year 2006/07. Delivered by
Dr E. Suruma, Minister of Finance, Planning & Economic Development at Parliament Buildings on 15th June. Suruma, E. 2007. Speech delivered at the Public Expenditure Review workshop held at the Hotel Africana on 8th May. Uganda Debt Network. 2007. Civil society statement on the budget strategy for FY 2007/08 and the medium-term. Delivered at the Public Expenditure Review workshop held at the Hotel Africana on 9th May. Uganda Bureau of Statistics. 2003. Key economic indicators; 51st issue November. Entebbe. Uganda Bureau of Statistics. 2007. Key economic indicators; 64th issue: second quarter of 2006/07. March. Kampala.
Williamson, T. 2003. Targets and results in public expenditure management: Uganda case study. Working Paper 205, p.5, ODI: London. March. World Bank. 2006. Public Expenditure and Financial Accountability Public Financial Management Performance Measurement Framework Reprinted June 2006 PEFA Secretariat, World Bank: Washington DC.
Uganda Agriculture Sector Public Expenditure Review Phases 1 and 2
Oxford Policy Management 70
Annex 5: Findings and lessons from District visits
1. Introduction The 1997 Local Governments Act (as amended) devolved several core functions for the delivery of agricultural services to local governments (LGs). To enable them to carry out these functions central government transfers resources to LGs through various modalities and channels. For some activities there are multiple sources of funds. For example, funds for agricultural extension are allocated through both the MAAIF budget for the District agricultural extension service and through the National Agricultural Advisory Service (NAADS). In addition, a portion of the budget is allocated to the districts in the form of unconditional grants, other discretionary grants and transfers. In order to capture this component of agriculture public expenditure, the Study Team collected information on relevant expenditure through various sources including the Poverty Action Fund (PAF), MoLG and projects. In addition, information was collected from seven districts. These were „old‟ districts for which data was available from 2000/01 onwards. Four of these districts (Bushenyi, Lira, Soroti and Tororo) were selected from those that were part of the early phases of the fiscal decentralization strategy and three (Arua, Masaka and Mukono) selected from later phases. In addition, these districts were selected because of they have significant expenditures in all of the sub-sectors included in the COFOG classification of agriculture, namely crops, livestock, fisheries, forestry and lands. Besides gathering data, the Team held discussions with key district officials especially from the Production and Marketing and Natural Resources sectors as well as from Finance and Planning departments. The focus of the discussions was on the planning process, budget execution, how production and extension services are working, performance evaluation and donor and NGO investments and activities. This Annex covers:
COFOG agriculture expenditures (production and marketing, forestry and lands) as a share of the total district expenditure;
Budget performance for COFOG agriculture and agriculture-specific grants particularly agricultural extension (wage and non-wage), NSCG, NAADS and LGDP;
Order of magnitude of the donor and NGO funding; and
The budget process, covering formulation, execution and performance review. 2. Share of COFOG agriculture expenditure at the district level
As shown in Table 1, expenditures on COFOG agriculture ranged from 4.1 to 6.1 percent during the six years considered in the analysis. For four out of the six years analysed, the share ranges from 4-5 percent. The Table shows that there has been a gradual increase towards 6 percent in the recent years. This rise is partly explained by the roll out in NAADS and the corresponding increase in resources that accompany it.
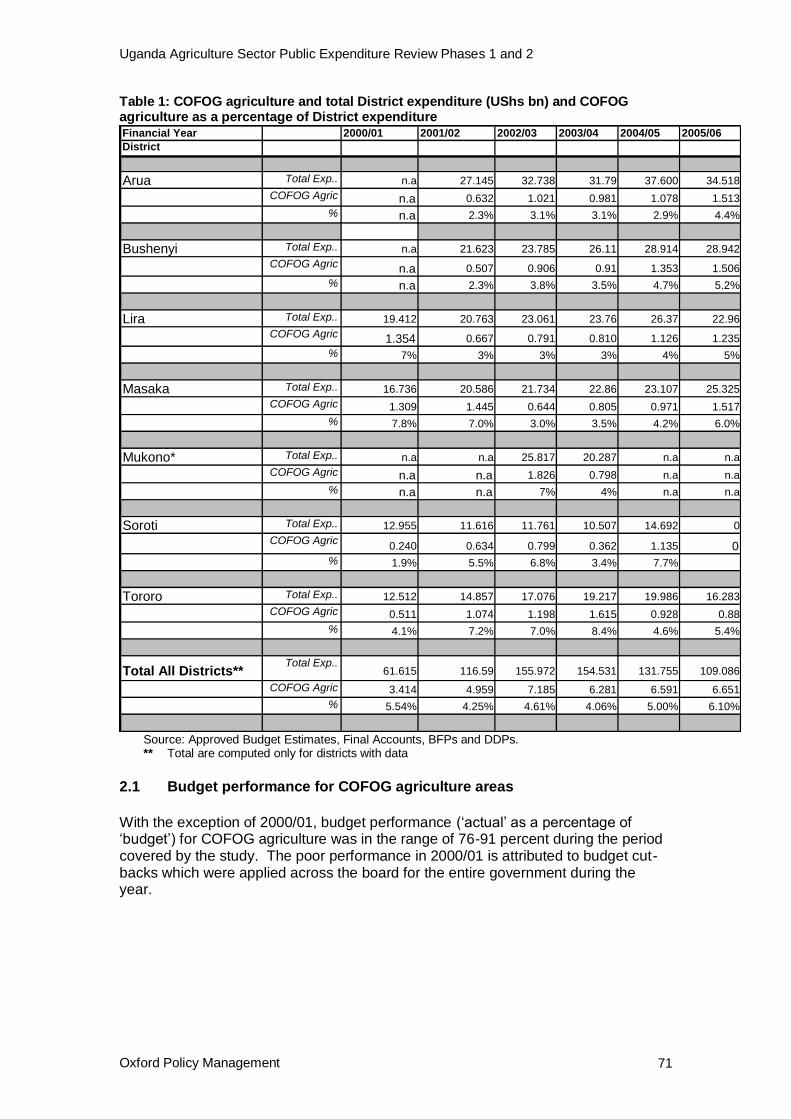
Uganda Agriculture Sector Public Expenditure Review Phases 1 and 2
Oxford Policy Management 71
Table 1: COFOG agriculture and total District expenditure (UShs bn) and COFOG agriculture as a percentage of District expenditure Financial Year 2000/01 2001/02 2002/03 2003/04 2004/05 2005/06
District
Arua Total Exp.. n.a 27.145 32.738 31.79 37.600 34.518
COFOG Agric n.a 0.632 1.021 0.981 1.078 1.513
% n.a 2.3% 3.1% 3.1% 2.9% 4.4%
Bushenyi Total Exp.. n.a 21.623 23.785 26.11 28.914 28.942
COFOG Agric n.a 0.507 0.906 0.91 1.353 1.506
% n.a 2.3% 3.8% 3.5% 4.7% 5.2%
Lira Total Exp.. 19.412 20.763 23.061 23.76 26.37 22.96
COFOG Agric 1.354 0.667 0.791 0.810 1.126 1.235
% 7% 3% 3% 3% 4% 5%
Masaka Total Exp.. 16.736 20.586 21.734 22.86 23.107 25.325
COFOG Agric 1.309 1.445 0.644 0.805 0.971 1.517
% 7.8% 7.0% 3.0% 3.5% 4.2% 6.0%
Mukono* Total Exp.. n.a n.a 25.817 20.287 n.a n.a
COFOG Agric n.a n.a 1.826 0.798 n.a n.a
% n.a n.a 7% 4% n.a n.a
Soroti Total Exp.. 12.955 11.616 11.761 10.507 14.692 0
COFOG Agric0.240 0.634 0.799 0.362 1.135 0
% 1.9% 5.5% 6.8% 3.4% 7.7%
Tororo Total Exp.. 12.512 14.857 17.076 19.217 19.986 16.283
COFOG Agric 0.511 1.074 1.198 1.615 0.928 0.88
% 4.1% 7.2% 7.0% 8.4% 4.6% 5.4%
Total All Districts**Total Exp..
61.615 116.59 155.972 154.531 131.755 109.086
COFOG Agric 3.414 4.959 7.185 6.281 6.591 6.651
% 5.54% 4.25% 4.61% 4.06% 5.00% 6.10%
Source: Approved Budget Estimates, Final Accounts, BFPs and DDPs. ** Total are computed only for districts with data
2.1 Budget performance for COFOG agriculture areas
With the exception of 2000/01, budget performance („actual‟ as a percentage of „budget‟) for COFOG agriculture was in the range of 76-91 percent during the period covered by the study. The poor performance in 2000/01 is attributed to budget cut-backs which were applied across the board for the entire government during the year.
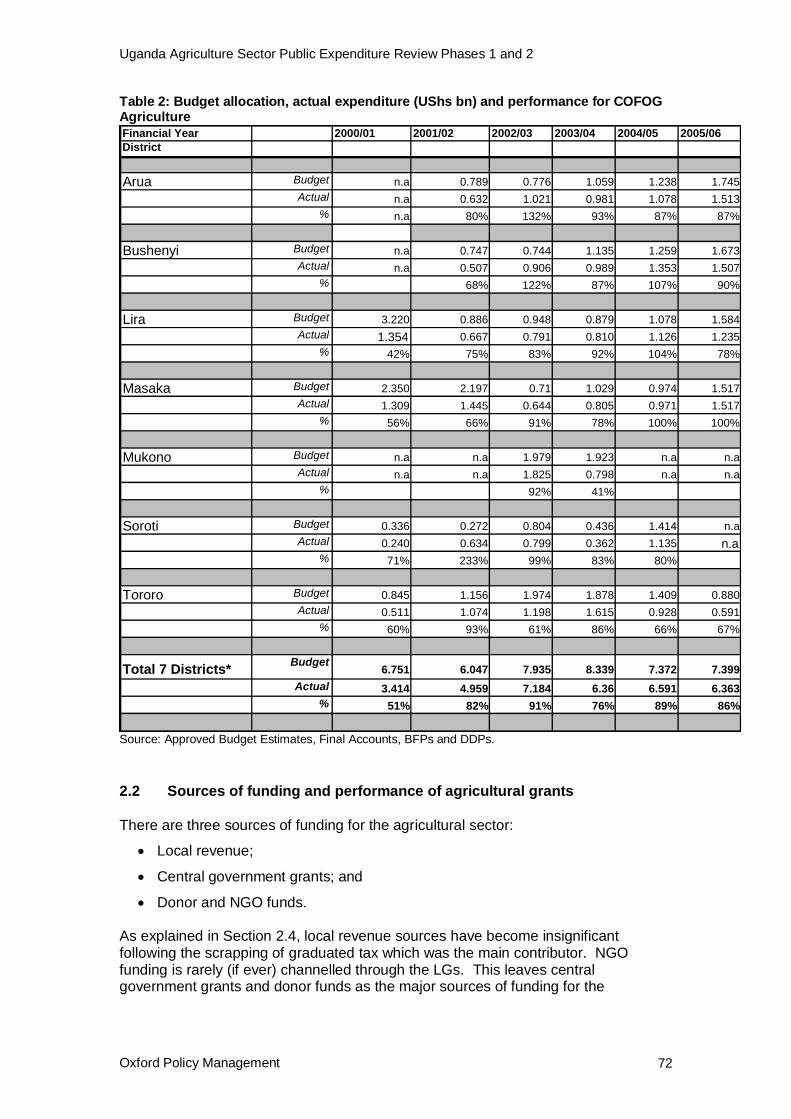
Uganda Agriculture Sector Public Expenditure Review Phases 1 and 2
Oxford Policy Management 72
Table 2: Budget allocation, actual expenditure (UShs bn) and performance for COFOG Agriculture
Financial Year 2000/01 2001/02 2002/03 2003/04 2004/05 2005/06
District
Arua Budget n.a 0.789 0.776 1.059 1.238 1.745
Actual n.a 0.632 1.021 0.981 1.078 1.513
% n.a 80% 132% 93% 87% 87%
Bushenyi Budget n.a 0.747 0.744 1.135 1.259 1.673
Actual n.a 0.507 0.906 0.989 1.353 1.507
% 68% 122% 87% 107% 90%
Lira Budget 3.220 0.886 0.948 0.879 1.078 1.584
Actual 1.354 0.667 0.791 0.810 1.126 1.235
% 42% 75% 83% 92% 104% 78%
Masaka Budget 2.350 2.197 0.71 1.029 0.974 1.517
Actual 1.309 1.445 0.644 0.805 0.971 1.517
% 56% 66% 91% 78% 100% 100%
Mukono Budget n.a n.a 1.979 1.923 n.a n.a
Actual n.a n.a 1.825 0.798 n.a n.a
% 92% 41%
Soroti Budget 0.336 0.272 0.804 0.436 1.414 n.a
Actual 0.240 0.634 0.799 0.362 1.135 n.a% 71% 233% 99% 83% 80%
Tororo Budget 0.845 1.156 1.974 1.878 1.409 0.880
Actual 0.511 1.074 1.198 1.615 0.928 0.591
% 60% 93% 61% 86% 66% 67%
Total 7 Districts*Budget
6.751 6.047 7.935 8.339 7.372 7.399
Actual 3.414 4.959 7.184 6.36 6.591 6.363
% 51% 82% 91% 76% 89% 86%
Source: Approved Budget Estimates, Final Accounts, BFPs and DDPs.
2.2 Sources of funding and performance of agricultural grants
There are three sources of funding for the agricultural sector:
Local revenue;
Central government grants; and
Donor and NGO funds. As explained in Section 2.4, local revenue sources have become insignificant following the scrapping of graduated tax which was the main contributor. NGO funding is rarely (if ever) channelled through the LGs. This leaves central government grants and donor funds as the major sources of funding for the
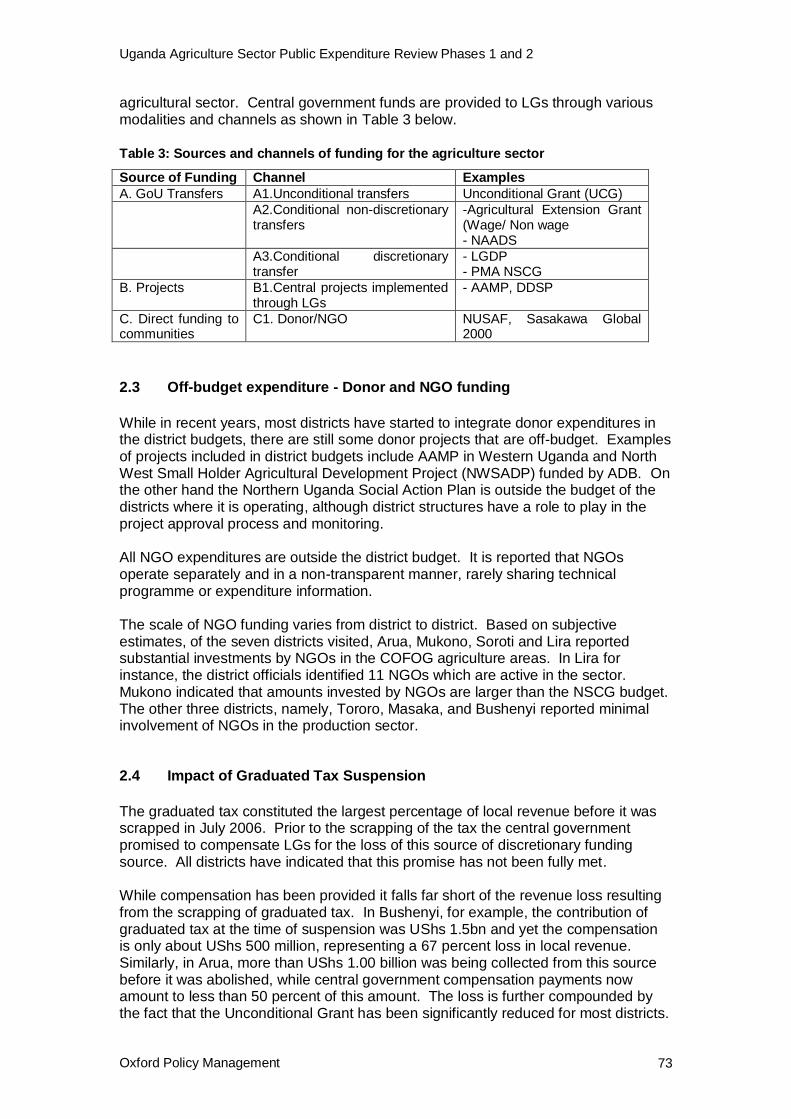
Uganda Agriculture Sector Public Expenditure Review Phases 1 and 2
Oxford Policy Management 73
agricultural sector. Central government funds are provided to LGs through various modalities and channels as shown in Table 3 below.
Table 3: Sources and channels of funding for the agriculture sector
Source of Funding Channel Examples
A. GoU Transfers A1.Unconditional transfers Unconditional Grant (UCG)
A2.Conditional non-discretionary transfers
-Agricultural Extension Grant (Wage/ Non wage - NAADS
A3.Conditional discretionary transfer
- LGDP - PMA NSCG
B. Projects B1.Central projects implemented through LGs
- AAMP, DDSP
C. Direct funding to communities
C1. Donor/NGO
NUSAF, Sasakawa Global 2000
2.3 Off-budget expenditure - Donor and NGO funding
While in recent years, most districts have started to integrate donor expenditures in the district budgets, there are still some donor projects that are off-budget. Examples of projects included in district budgets include AAMP in Western Uganda and North West Small Holder Agricultural Development Project (NWSADP) funded by ADB. On the other hand the Northern Uganda Social Action Plan is outside the budget of the districts where it is operating, although district structures have a role to play in the project approval process and monitoring. All NGO expenditures are outside the district budget. It is reported that NGOs operate separately and in a non-transparent manner, rarely sharing technical programme or expenditure information. The scale of NGO funding varies from district to district. Based on subjective estimates, of the seven districts visited, Arua, Mukono, Soroti and Lira reported substantial investments by NGOs in the COFOG agriculture areas. In Lira for instance, the district officials identified 11 NGOs which are active in the sector. Mukono indicated that amounts invested by NGOs are larger than the NSCG budget. The other three districts, namely, Tororo, Masaka, and Bushenyi reported minimal involvement of NGOs in the production sector. 2.4 Impact of Graduated Tax Suspension
The graduated tax constituted the largest percentage of local revenue before it was scrapped in July 2006. Prior to the scrapping of the tax the central government promised to compensate LGs for the loss of this source of discretionary funding source. All districts have indicated that this promise has not been fully met. While compensation has been provided it falls far short of the revenue loss resulting from the scrapping of graduated tax. In Bushenyi, for example, the contribution of graduated tax at the time of suspension was UShs 1.5bn and yet the compensation is only about UShs 500 million, representing a 67 percent loss in local revenue. Similarly, in Arua, more than UShs 1.00 billion was being collected from this source before it was abolished, while central government compensation payments now amount to less than 50 percent of this amount. The loss is further compounded by the fact that the Unconditional Grant has been significantly reduced for most districts.

Uganda Agriculture Sector Public Expenditure Review Phases 1 and 2
Oxford Policy Management 74
Since the two were the source for the wage bill, it means that most districts are now struggling to pay wages. The untimely disbursement of the compensation is another detrimental factor in using this source of revenue. The impact of the loss of graduated tax on the production sector varies from district to district. In districts such as Tororo where it has not been a major source of funding for the production and marketing sector, the impact is less significant. However, in Bushenyi where the allocation was significant, the impact of its loss has been marked. For example, local revenue allocated to production and marketing sector used to cover some unfunded priorities, operations (travel and allowances for field visits) and follow-up on the sustainability of previous investment. Without graduated tax, the vehicles are grounded, very few field visits can be undertaken, and previous investments are not being maintained adequately. The other impact that has affected all districts is the co-financing of some grants especially LGDP, NAADS and the NSCG. Most districts are struggling to raise funds for co-financing of these grants which is usually around 10 percent. While districts such as Masaka have managed, others are in facing difficulties. Lira district, for instance, has resorted to using the equalisation grant from the central government for co-financing instead of bridging financial gaps in priority areas such as health, education, road maintenance, etc. for which the fund is intended. The same situation pertains at sub-county level where funds for co-financing are unavailable. Furthermore, emoluments for council executives have been increased but the local revenue, from which they are paid with graduated tax as the main contributor, is not adequate. 3 The Budgeting Process
3.1 Planning process
The planning process for LGs is set out in the District Planning Guide (2006) and the Harmonised Participatory Planning Guide for Lower Local Governments and Councils (2005). The guides elaborate the planning steps, responsibilities and calendar. Discussions with the district officials reveal both similarities and differences in the way the planning process is implemented in practice. These are discussed below. i. Constricted planning process. Over the last 2-3 years, the regional workshops
which trigger the budgeting process have been convened in mid-December and in some cases in January. This has not only breached the time-frame which requires the BFP to be submitted by 31 December but also constrained the LGs to limit and sometimes skip some vital processes such as consultations with the community and other stakeholders, thereby compromising the quality of the BFP. However, Arua, Mukono and Masaka districts have addressed this by starting the priority setting and revision of the District Development Plan before the budget call is issued.
ii. Frequent revisions. Apart from the delayed release of the IPF to the District another aspect of the planning process is that there are usually several revisions (not always downwards). MFPED has also been known to change the required format for the District BFPs during the preparation process. This is both confusing and disheartening for those drafting it.
Uganda Agriculture Sector Public Expenditure Review Phases 1 and 2
Oxford Policy Management 75
iii. District Development Plans. The District Development Plan is prepared by all the districts as a three-year rolling plan. This resembles a ‟wish-list‟ especially for the second and third years. The BFP that is drawn up each year is based on the Plan and is more realistic and feasible since it is forced to fit within the IPF. The BFP is based on project proposals developed by Sub-County Production Officers and is consistent with national policies in the PEAP, the PMA and the NRM Manifesto.
iv. Inadequate resources for financing the planning process. The planning
process requires funding to cover, among other things, the cost of consultations and meetings. However, all districts reported inadequate funding for the planning process.
v. Participatory planning. Even where resources are available to carry out
participatory planning, the meetings are poorly attended. The main reasons for this include previous unimplemented priorities brought up by the communities and where the organisers have not previously provided lunch, drinks and transport refunds during the meeting. When community members shun planning meetings, their expected input in determining priorities is forfeited.
vi. Limited discretion in allocating resources and determining priorities. LGs
noted that the bulk of the resources (conditional grants) which they receive, have pre-determined uses. As a result they have very little input in determining how they are used. Even where some discretion is encouraged, such as with the 10 percent flexibility for non-wage Conditional Grants under the Fiscal Decentralisation Strategy and the PMA NSCG, the production and marketing departments complain that the allocations do not favour them. As a result some districts do not see any value in the planning process. In Tororo, for example, one production and marketing sub-sector head described planning as “a total waste of time”. On the other hand, the production and marketing and natural
resources staff in Bushenyi are very positive about their role in planning. They note that even if sector allocations are already determined, their contribution is still effective and important in terms of determining enterprises and the location of investments. Again, Tororo and Bushenyi are at opposite ends as far as application of the 10 percent under FDS is concerned. While all the sectors in Tororo have rejected applying the 10 percent flexibility (sometimes with official backing from line Ministries), in Bushenyi this is taking place without any problems. The agriculture production staff are happy with this process since they have so far got more than they have been contributing to the pool.
vii. Lack of transparency in the allocation of discretionary resources. The
budget desk usually determines the sharing (IPFs) of discretionary resources such as LGDP, PMA NSCG and 10 percent flexibility under FDS. The composition of the budget desk varies from district to district. In some districts it comprises only the planning and finance departments while in others it includes all sectors. In districts where the membership is limited to planning and finance (e.g. Tororo) there have been complaints of lack of transparency, compared to other districts with a wider composition and where the process is considered to be transparent (e.g. Bushenyi).
viii. Prioritisation: Where districts are responsible for the selection of projects, e.g.
35 percent under PMA NSCG and LGDP, these are prioritised by the District staff, based on their analysis of their relative merits and what the sub-counties have identified through the participatory planning process (where it is done). The role of the district in sub-county investment is guidance to ensure compliance
Uganda Agriculture Sector Public Expenditure Review Phases 1 and 2
Oxford Policy Management 76
with the guidelines for each of the grants. In some districts such as Arua, they also emphasise that sub-counties give priority to the completion of unfinished projects.
ix. Approval. Final approval of the BFPs and, later, the annual work plans and
budgets, is given by the Council. No technical representation is allowed at such meetings; the work plans cannot therefore be presented and justified. Directorate staff are consulted only to clarify technical issues if they arise.
x. Tendency to prioritise private goods. In all districts there is evidence of
financing of private goods in the form of free inputs. This ranges from the legitimate provision of inputs for demonstration purposes, to the financing of what should be a private sector investment. For example, the financing of a tractor for hire by farmers at subsidised rates and the purchase of rice millers that were donated to farmers‟ groups.
xi. Unrealistic budgeting. Although Section 36 of the LGA advocates a balanced
budget where expected revenues match estimates of expenditures, districts admit that many times under pressure from politicians they inflate the expected revenue so that more local priorities are included in the budget. In one case, out of a budget of UShs 100 million only UShs 8 million were realised. This behaviour can lead to distorted budgets.
In summary, the planning process, as envisaged in the guides, is implemented by LGs at varying levels of compliance and ingenuity and amidst a host of operational challenges, resulting is a mixed outcome. Some LGs have adapted well and appear to be on top of the planning process while others are struggling.
3.2 Budget Execution
Budget execution in the LGs is influenced by a number of factors including late release of funds, procurement delays, and cutbacks in approved budgets. Untimely release of funding. The untimely release of funds has a serious effect on
the execution of the budget for the agriculture sector. This stems from the fact that agricultural activities are linked to seasons and weather. For example, in most districts a number of releases have been made towards the end of the season. In Soroti, at the time of the visits (May), the district was still in the process of procuring seeds (groundnuts, maize, sunflower, cassava stems, potato vines etc.) for establishing demonstrations and yet the rainy season was far advanced. One Bushenyi district official summed up the situation in these words “they give you pea seeds for planting in demonstration plots when the rest of the farmers are harvesting peas”. The other effect of the late release of funding is that when releases are made towards the end of the financial year (May-June), the activities cannot be implemented and therefore have to be rolled over into the next season. However, the regulation requires unutilised funds to be returned to the Treasury in the Ministry of Finance unless they have already been committed. Even in cases when the funds are committed, the district has to request authority to use the funds. In one instance in Masaka, the authority was received after six months during which period the monies remained idle in the bank.
Uganda Agriculture Sector Public Expenditure Review Phases 1 and 2
Oxford Policy Management 77
Procurement delays. Across all districts delays in procurement are common. This
is partly a knock-on effect of the untimely release of funds. Regulations under the IFMS demand that contracts should not be signed unless there are adequate funds in the bank to pay for the services and goods under the contract. The other cause of procurement delays is the lack of funds for cover the cost of procurement activities, such as the advertisement and evaluation of bids. Cutback in approved budgets. Since 2000/01, when there was an across-the-
board cutback of 30 percent, there has not been any significant budget reduction. However, the effect of cutbacks, when they do occur, is that some activities remain uncompleted while others do not start at all. This leads to underperformance in financial and physical terms. 3.3 Performance Review and Monitoring
Different types of reviews and monitoring activities are carried out at the LG levels. These include:
Quarterly reviews for sectors receiving PAF funding;
Annual reviews as part of the BFP preparation process;
Annual review undertaken after the end of the financial year, and;
LGDP annual assessment of minimum conditions and performance measures
In theory, quarterly monitoring and review is expected to be carried out by the centre (for activities under PAF) and by the districts using the monitoring and accountability grant. However, funding shortages sometimes constrain this exercise. At the Sub-county level, for example, the operational budgets are highly constrained so field supervision activities are often not undertaken and the contribution that Sub-Counties are required to make to NAADS funding, for example, is often not possible. Monitoring and Evaluation is one of the principal roles of the Directorate of Production and Marketing, while politicians also use the funds of the Directorate (including those of the NSCG) to monitor the progress of projects in the District. The preparation of the BFP involves a review of not only the year for which the budget is under implementation but also the previous two to three years. The down-side to this exercise is that no feedback is provided to the districts by either MFPED or MAAIF. At the end of every financial year, districts carry out an annual review with the Annual Report as the main output. The quality of the reports varies from district to district. Poor quality reports contain a listing of the activities that were carried out with little or no quantification of results. However, some reports, such as the report for Bushenyi during 2004/05, compare targets with actual achievements and explain why there were deviations from planned targets and make recommendations for remedial action. Finally, the annual assessment of minimum conditions and performance measures is another form of review that is undertaken in local governments. The assessment results in rewards (in the form of increased funding) for good performance and sanctions (reduction in the LGDP grant) for poor performance. However, this
Uganda Agriculture Sector Public Expenditure Review Phases 1 and 2
Oxford Policy Management 78
assessment does not cover production sector indicators and therefore cannot be used as a means of improving performance in the sector. Apart from the LGDP assessment which does not specifically address agriculture, the monitoring review results in rewards / penalties for good / poor project performance. 4. Progress in NAADS Implementation
In 2001, GoU launched the National Agricultural Advisory Services (NAADS) to replace, in a phased and systematic manner, the agricultural extension system that was in place. Starting with six districts, the coverage has now reached 45 districts. Government transfers substantial financial resources to the LGs at both district and sub-county levels for the implementation of NAADS. All the seven districts visited are implementing NAADS.
NAADS Coverage Table 4 shows the number of sub-counties that are now benefiting from NAADS.
Table 4: NAADS coverage in the study districts
District Total Number of
Sub-counties
Number Covered
May 2007
percent
Coverage
Arua 16 14 88
Bushenyi 18 29 62
Lira 15 31 48
Masaka 12 19 63
Mukono 28 24 86
Soroti 15 15 100
Tororo 15 15 100
Source: NAADS District Coordinators
Farmer Forums. One of the major roles of the Sub-County Farmers‟ Forum (SFF) is
planning. This involves identification of appropriate enterprises and prioritising them. The assessment of the majority of districts is that, with the passage of time, the SFF are getting better at identifying enterprises. On the other hand, Bushenyi district officials are disappointed that SFFs have not matured and continue to select enterprises that are of limited commercial value. Traditional Extension. An assumptions made during the design of NAADS was that
the bulk of Government extension workers would be de-layered (made redundant) to form a pool of private service providers. Six years into implementation, this has not taken place. The main reason has been the stalemate in the restructuring of both MAAIF and the production departments in the districts. The result of this impasse has been that the government extension workers have continued in their positions even where NAADS has been fully rolled-out. So, what are traditional extension workers doing at the moment? Discussions during the field visits showed that the role of the traditional agricultural extension workers includes:
Participating in technical audit of NAADS;

Uganda Agriculture Sector Public Expenditure Review Phases 1 and 2
Oxford Policy Management 79
Providing advisory services to households/groups and for enterprises that are not covered under NAADS; and,
Providing disease control services (for veterinary/livestock extension workers). 5. Conclusion Data from the sample districts indicate that approximately 5 percent of district budgets is spent on services and investments related to COFOG agriculture. In terms of budget performance, the average for normal years is in the range of 80-90 percent. The shortfall in performance is a result of budget execution issues, especially the untimely release of funds and procurement delays which push implementation to the following year. With regard to the planning process, while the approach is well elaborated in the guidelines for preparation of the DDP, BFPs, work plans and budgets, in practice, planning in the agriculture sector is undermined by, among other things, the late communication of IPFs, lack of funds to facilitate the process, lack of feedback from MFPED and MAAIF and planning fatigue especially at community level. An increasing number of investments prioritised for funding are actually private goods (instead of public goods, which qualify for government resources). This implies that perhaps the persistent outcry that funds are inadequate may be a question of poor allocation and prioritisation. On budget execution, the issue of the untimely release of funds and procurement delays adversely affects the use of funds to provide the goods and services envisaged during the planning process. These need to be addressed to improve implementation. As the NAADS programme rolls-out to cover all sub-counties, the unresolved problem of de-layering extension workers is coming to the fore as scarce resources are being used to run parallel systems. It is important to have one system and address the associated problems (e.g. prioritisation of fewer enterprises and farmers
not yet registered with NAADS) within that system.