UDME Unit Development , Measurement and Efforts
24
1 UDME Unit Development , Measurement and Efforts A programmer‘s experience What is possible?
-
Upload
david-richards -
Category
Documents
-
view
48 -
download
6
description
UDME Unit Development , Measurement and Efforts. A programmer‘s experience What is possible?. U nit D evelopment, M easurement and E fforts Agenda. Problem Process Steps and Tests System Efforts Errors Measures Conclusion. U nit D evelopment, M easurement and E fforts The Problem. - PowerPoint PPT Presentation
Transcript of UDME Unit Development , Measurement and Efforts

1
UDMEUnit Development , Measurement and Efforts
A programmer‘s experience
What is possible?
2
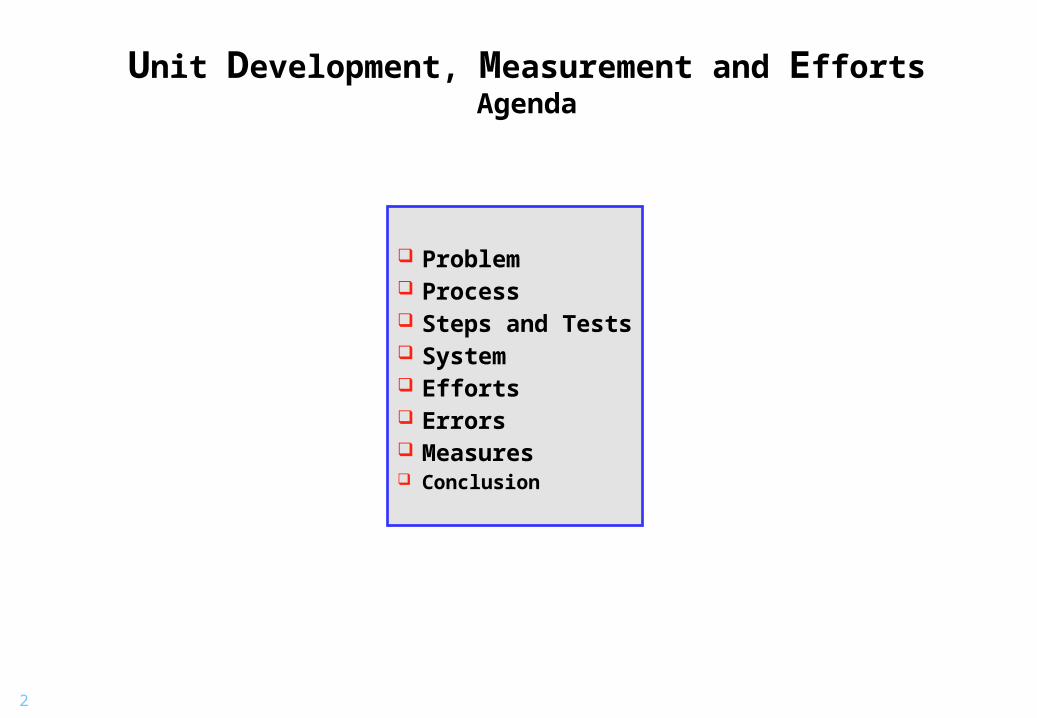
Unit Development, Measurement and EffortsAgenda
Problem Process Steps and Tests System Efforts Errors Measures Conclusion

3
Unit Development, Measurement and EffortsThe Problem
Too expensive ... Too difficult ... Too long ... Too ... Too ...

4
Unit Development, Measurement and EffortsProcess
SpecificationAlgorithm
DesignReuse
FunctionTC
BlackBox
FunctionTD
StructureTD
StructureTC
WhiteBox
Source Code$zzx#yy
P.u.T.Parm. Asserts
Inline Doc.
CompilePLIx#yy
Warnings/Obj.Del inst Obj. !
Static AnalysisOnline Instrumented
Code
DynamicAnalysisOnline
SCompileOK?
Q Characteristics
OK?
Test ResultsGOzzxIyy
CoverageReport
Online/PrintInfeasible LCSAJs
W Asexpected?
DebuggingOnline/Print
TER >= lim?
End
Start
?
Quality ReportOnline
+
+ +
+
-
-
-
-
Zeichnung1 17.11.2003 10:24:09
Test ResultsGOzzx#yy
B Asexpected?
- +
CompilePLIxTyy
Switch viaLink inst/orig
CompilePLIxIyy
Warnings/inst Obj.
TCompile OK?
DebuggingOnline
+
+
-P.u.T.
OK? -
Spec OK?
-
+
+
SourceTzzx#yyDriver
Exist inst Obj.?
-
Function TCOK?
-
+
5
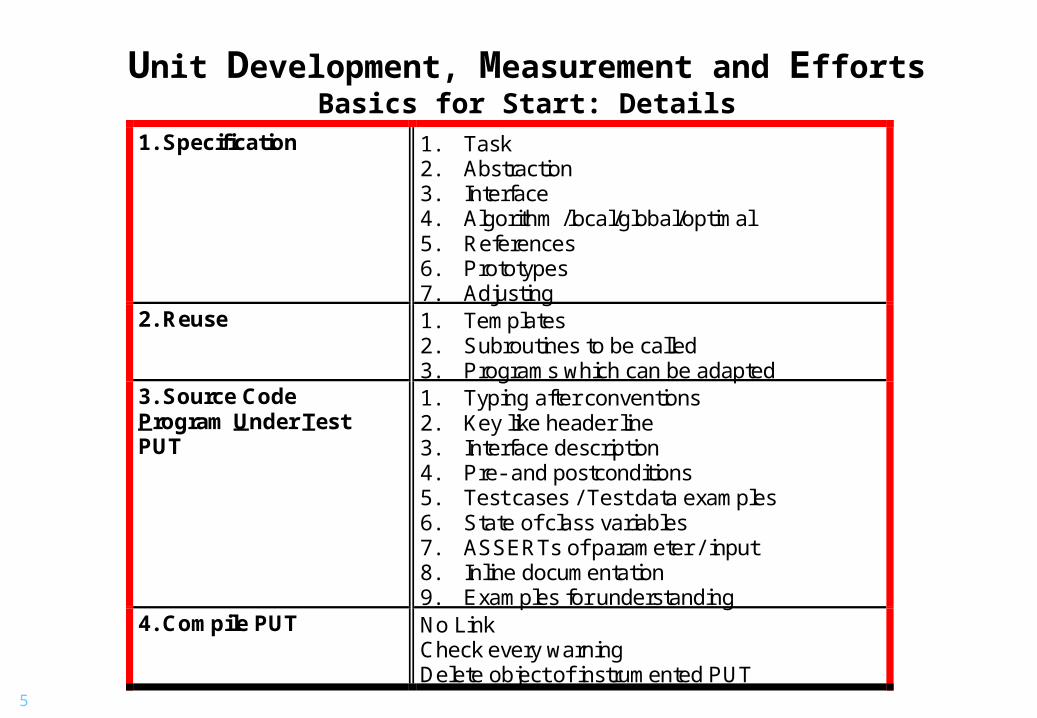
Unit Development, Measurement and EffortsBasics for Start: Details
1. Specification 1. Task2. Abstraction3. Interface4. Algorithm /local/global/optimal5. References6. Prototypes7. Adjusting
2. Reuse 1. Templates2. Subroutines to be called3. Programs which can be adapted
3. Source CodeProgram Under TestPUT
1. Typing after conventions2. Key like header line3. Interface description4. Pre- and postconditions5. Test cases / Test data examples6. State of class variables7. ASSERTs of parameter / input8. Inline documentation9. Examples for understanding
4. Compile PUT No LinkCheck every warningDelete object of instrumented PUT
6
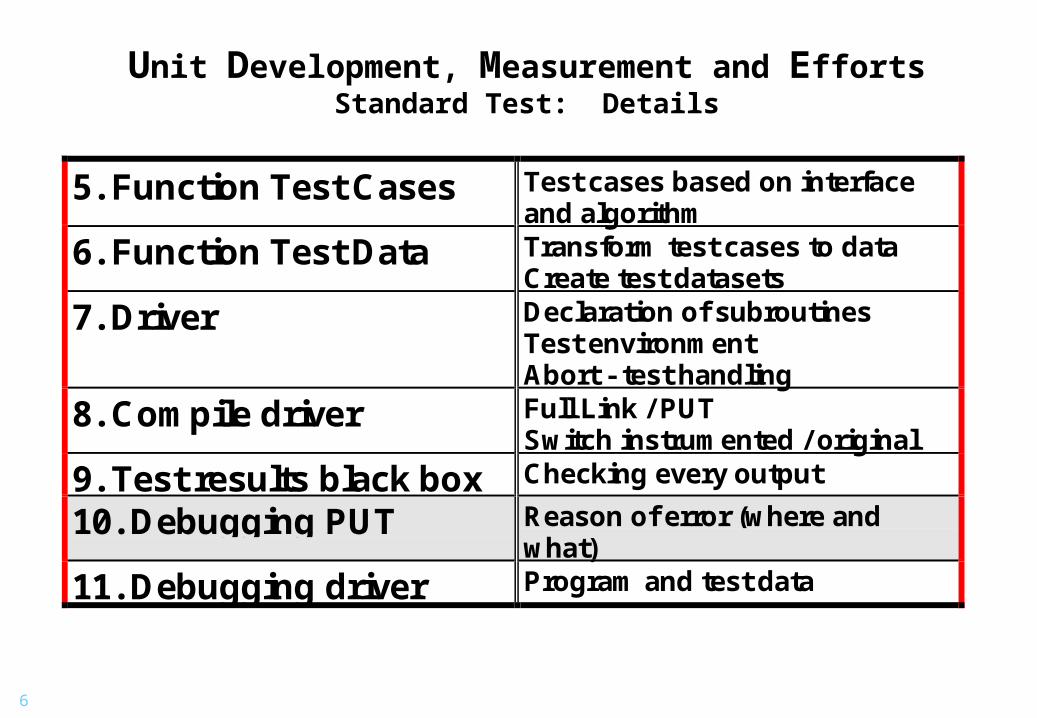
Unit Development, Measurement and EffortsStandard Test: Details
5. Function Test Cases Test cases based on interfaceand algorithm
6. Function Test Data Transform test cases to dataCreate test datasets
7. Driver Declaration of subroutinesTest environmentAbort - test handling
8. Compile driver Full Link / PUTSwitch instrumented / original
9. Test results black box Checking every output
10. Debugging PUT Reason of error (where andwhat)
11. Debugging driver Program and test data

7
Unit Development, Measurement and EffortsMeasured Quality: Details
12. Static analysis 1. Conventions2. Complexity3. Dataflow4. Cross References
13. Quality report 1. Penalties2. Structure3. Dataflow anomalies4. Unused variables5. Clear paths of parameters
14. Instrumented code Automatically
15. Compile instrumentedPUT
Check for additional warnings
16. Test results white box First run only black box
17. Dynamic analysis Test run with special historydata
18. Coverage report 1. Statements (100%)2. Branches (100%)3. LCSAJs ('100'%)4. Infeasible LCSAJs
19. Structure test cases New test cases based on thetask, the interface and theuncovered parts
20. Structured test data Transform test cases to dataCreate test datasets

8
Unit Development, Measurement and EffortsAlgorithm
highilow
x
axcxx
xXTT
shortsignedxxT
i
iiii
ii
ii
for
else
if:)(f
))((f)f(,:f
_)(:

9
Unit Development, Measurement and EffortsAsserts
highilow
x
axcxx
xXTT
shortsignedxxT
i
iiii
ii
ii
for
else
if:)(f
))((f)f(,:f
_)(:
assert ( tabel space )
assert ( overflow )
assert ( compiler restriction ) assert ( declaration of table limits )
assert ( underflow )
10
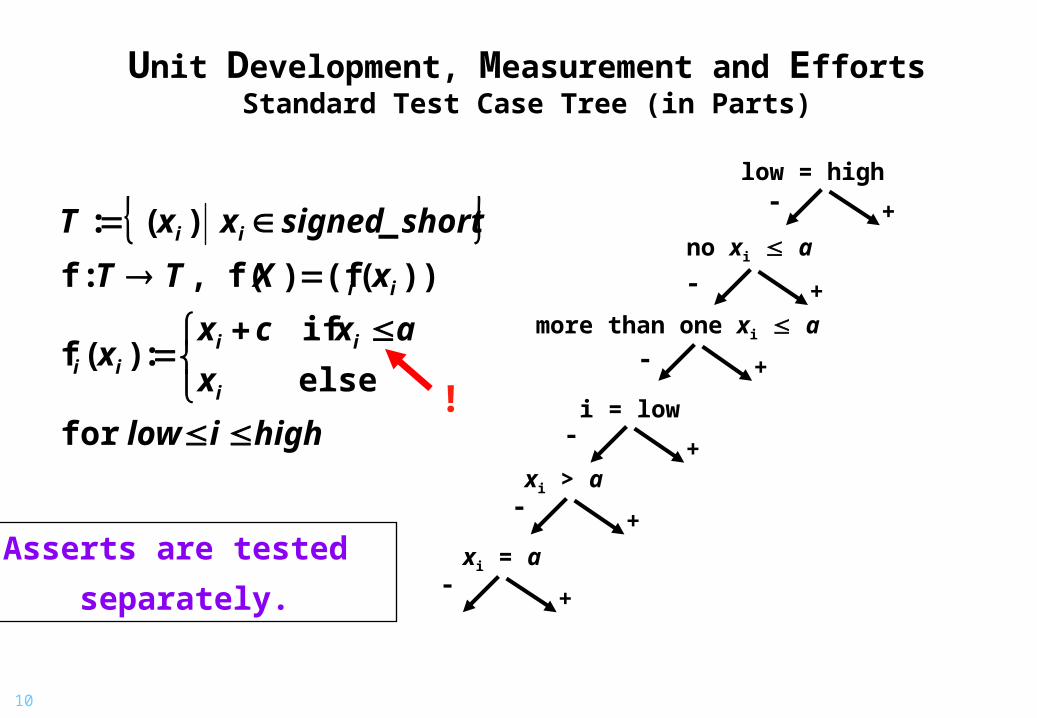
Unit Development, Measurement and EffortsStandard Test Case Tree (in Parts)
highilow
x
axcxx
xXTT
shortsignedxxT
i
iiii
ii
ii
for
else
if:)(f
))((f)f(,:f
_)(:
low = high
+ -
more than one xi a
Asserts are tested
separately.
i = low
no xi a
xi > a
xi = a
+
+
+
+
+
-
-
-
-
-
!

11
Unit Development, Measurement and EffortsPlanning the System
3
5
42
1
76
98
10
12
1413
15
11
High risk (mathematical)prototype requiredbefore implementation
Sequence of design
Per Level
Order of importance
Conditions sine qua non
12
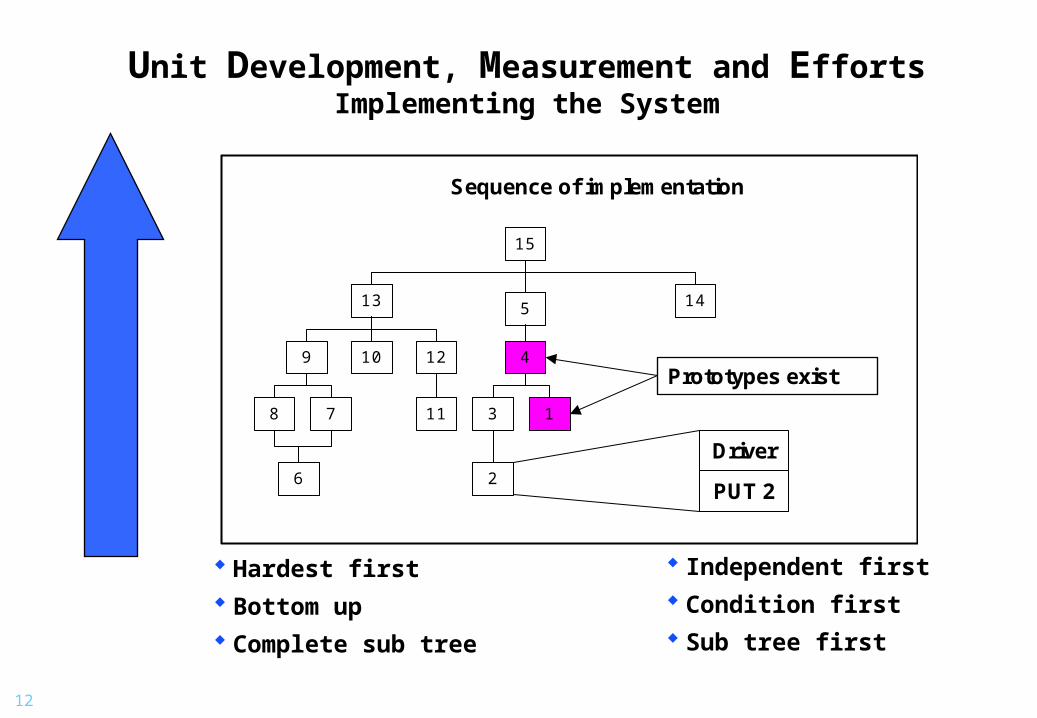
Unit Development, Measurement and EffortsImplementing the System
5
9
1413
15
1210
78
6
4
13
2
11
Prototypes exist
Sequence of implementation
PUT 2
Driver
Hardest first
Bottom up
Complete sub tree
Independent first
Condition first
Sub tree first

13
Unit Development, Measurement and EffortsSelected Location Parameter
Sum
Min
Q25
Med
ian
Q75
Max
Mod
al
Mea
n
Fspa
n
Qrt
Coe
ff
Med
95%
sym
Con
f Int
Med
95%
Con
f Int
low
Med
95%
Con
f Int
hig
h
Std
Dev
Var
Coe
ff
Mea
n 95
% C
onf I
nt
Out
lier
low
Out
lier
high
Diff
Ele
men
ts
Sha
pe
Gin
i %
Her
finda
hl %
CR
(3) %
Sum Effort 34037 21,0 67,0 107,0 207,0 1776,0 54,0 202,6 140,0 1,3 17,0 96,0 123,0 273,1 1,3 41,3 0 22 124 e 54,0 1,1 14,1
MI 46,0 87,5 104,5 122,2 146,1 87,5 103,9 34,7 0,3 4,2 96,0 112,0 22,9 0,2 3,5 0 0 68 N 12,6 0,0 5,0
PUT File Size 44003 30,0 73,8 128,5 411,5 3930,0 500,0 261,9 337,8 2,6 41,0 112,0 177,0 373,0 1,4 56,4 0 36 120 e 53,3 1,2 14,8
Driver Files Size 23734 0,0 56,8 93,5 202,0 1032,0 202,0 141,3 145,3 1,6 17,6 80,0 115,0 127,5 0,9 19,3 0 5 101 e 43,6 0,5 9,1
Sum File Size 67737 32,0 142,0 215,5 640,3 3961,0 702,0 403,2 498,3 2,3 60,5 182,0 311,0 435,2 1,1 65,8 0 18 134 e 47,3 0,7 11,2
Data collected: 7.2002 - 7.2003 # of modules: 168
Effort in minutes Size in editor lines Maintenance index no dimension

14
Unit Development, Measurement and EffortsParticular Efforts
35,73
0,99
24,41
2,98
6,04
9,788,67
1,960,22
3,74
0,51 0,51 0,54 0,54 0,15 0,71 1,620,20 0,16 0,53
0,00
5,00
10,00
15,00
20,00
25,00
30,00
35,00
40,00
Sp
ec
ific
ati
on
Re
us
e
So
urc
e P
UT
Co
mp
ile P
UT
Fu
nc
tio
n T
C
Fu
nc
tio
n T
D
Dri
ve
r
Co
mp
ile D
riv
er
Dri
ve
r D
eb
ug
gin
g
Bla
ck
Bo
x T
es
t R
es
ult
s
Sta
tic
An
aly
sis
Qu
alit
y R
ep
ort
Ins
tru
me
nte
d C
od
e
Co
mp
ile In
str
um
en
ted
Wh
ite
Bo
x T
es
t R
es
ult
s
Dy
na
mic
An
aly
sis
Co
ve
rag
e R
ep
ort
Str
uc
ture
TC
Str
uc
ture
TD
PU
T D
eb
ug
gin
g
---- Based on 168 Progams ----

15
Unit Development, Measurement and EffortsEfforts Groups
Basics for Start
64,64%
Standard Test
30,41%
Measured Quality4,95%
16
Unit Development, Measurement and EffortsErrors
342
163
218
3 14 26
87
47
89
0
50
100
150
200
250
300
350
400
no
t s
co
mp
ileo
k -
----
no
t tc
om
pile
ok
----
-
no
t b
b a
se
xp
ec
ted
---
-
no
t q
ch
ara
cte
ris
tic
so
k -
--
no
t w
b a
se
xp
ec
ted
---
no
t te
r g
e li
m -
--
no
t P
UT
ok
---
no
t s
pe
c o
k -
--
no
t fu
nc
tio
n t
co
k -
--
---- Based on 168 Programs ----
Benefit dynamic measurement 5:1

17
Unit Development, Measurement and EffortsMaintenance Measuring
120
0
)(log)(
))1(100sin(50
)ln(2.16)'V(23.0)ln(44.5171
2
1
2
1
21221
curve comment the of Shape.K
EF Factor, ExpansionEF
Ratiomment_all) Coment/Lines(Lines_ComCR
ent)/EFLines_Comml (Lines_alLOC
s statement decision compoundNoV(g') V(g),if
gh flow grap ofy Complexitc CyclomatiExtended V(g')
gh flow grap ofy ComplexitCyclomaticV(g)
Operands#Distinct η
Operators#Distinct η
#OperandsN
#OperatorsN
NNV
CRK
LOCgV
MI
Measure
Tool
Formula

18
Unit Development, Measurement and EffortsComment and MI
sin( sqrt( 0.12 * (100-x) ) )
-0,4
-0,2
0
0,2
0,4
0,6
0,8
1
0 10 20 30 40 50 60 70 80 90 100
%

19
Unit Development, Measurement and EffortsRegions of Maintenance
MI
0,005,00
10,0015,00
20,0025,00
1 2 3 4 5 6 7 8 9 10 11
Class
%
ca 65 ca 85
MI < 65 poor65 MI < 85 fair
85 MI excellent
More than 95 % of the modules have at least a fair maintainability index.
Benefit of static measurement

20
Unit Development, Measurement and EffortsEffort and Poor Maintenance
Within poor region HP (n=5 %=2.98)Effort Type- --Group--- Percent mean part mean all-
Basic------ 1645 7.48 329.00 130.96 Std. Test-- 759 7.33 151.80 61.61 Measurement 98 5.82 19.60 10.03
Sum Effort- 2502 7.35 500.40 202.60

21
Unit Development, Measurement and EffortsEffort and Fair Maintenance
Within fair region HP (n=28 %=16.67)Effort Type- --Group--- Percent mean part mean all-
Basic------ 8340 37.91 297.86 130.96 Std. Test-- 3125 30.19 111.61 61.61 Measurement 480 28.49 17.14 10.03
Sum Effort- 11945 35.09 426.61 202.60
22
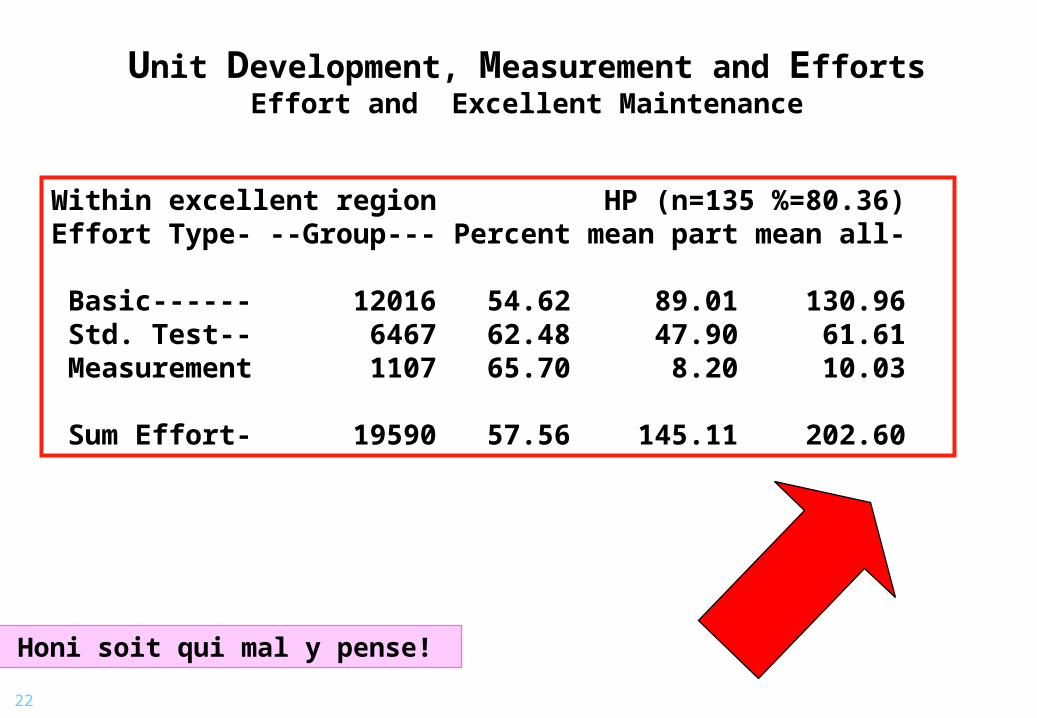
Unit Development, Measurement and EffortsEffort and Excellent Maintenance
Within excellent region HP (n=135 %=80.36)Effort Type- --Group--- Percent mean part mean all-
Basic------ 12016 54.62 89.01 130.96 Std. Test-- 6467 62.48 47.90 61.61 Measurement 1107 65.70 8.20 10.03
Sum Effort- 19590 57.56 145.11 202.60
Honi soit qui mal y pense!

23
Unit Development, Measurement and Efforts It is possible ...
To develop programs so that
Measuring requires less than 5 % of the effort,
Test reach a code coverage of 100% LCSAJs within less than 2 % of the effort,
Source codes fulfils the high level quality requirements without any additional effort for 98 % of the modules,
An excellent maintainability is achieved with less effort per module than the mean value for more than 80 % of the modules,
A poor maintainability appears for less than 3 % of the modules and
Quality benefits are earned during the development process.

24
Unit Development, Measurement and Efforts