UCSF Finance 101
28
UCSF Finance 101 Improvement Community of Practice & Value Improvement Teams Amy Shlossman, Claudia Hermann, Kim Berry, Jahan Fahimi, Catherine Lau, Sarah Imershein
Transcript of UCSF Finance 101

UCSF Finance 101Improvement Community of Practice &Value Improvement Teams Amy Shlossman, Claudia Hermann, Kim Berry, Jahan Fahimi, Catherine Lau, Sarah Imershein

Objectives Provide broad overview of UCSF Financial Organizational Structure
Understand key financial vocabulary:
• Direct Cost
• Indirect Cost
• Contribution Margin
• Net Revenue
• Medicare DRG vs. Fee for service
Articulate how payer mix affects financial outcomes
Understand value based healthcare and how to calculate a ROI
Be able to access financial data sources – Finance Dept / The Cube, SvcDash, tag.bio
UCSF Finance 101

Value Based Healthcare MissionTo improve the value of healthcare delivered at UCSF
This is achieved by reducing waste and lowering health care costs while maintaining or improving health
UCSF Finance 101
VALUE =OUTCOMES
COST
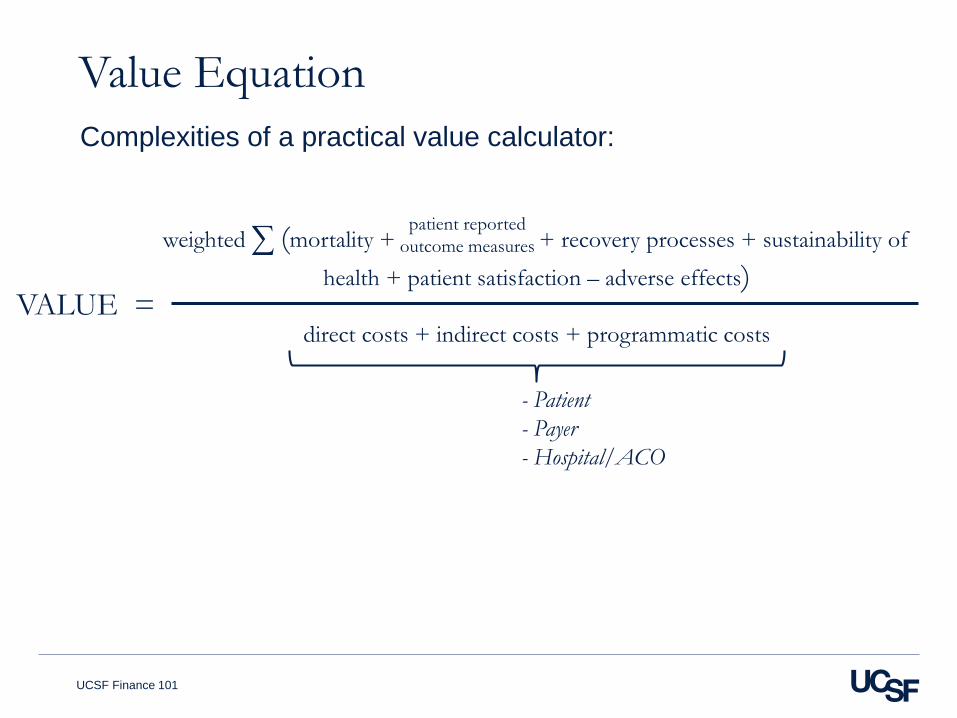
Value EquationComplexities of a practical value calculator:
UCSF Finance 101
VALUE =
weighted ∑ (mortality + + recovery processes + sustainability of
health + patient satisfaction – adverse effects)
direct costs + indirect costs + programmatic costs
patient reportedoutcome measures
- Patient- Payer- Hospital/ACO

Financial Organizational Structure
UCSF Finance 101
UCSF Health(Medical Center)
UCSF SchoolOf Medicine(Campus)Cost Centers
Charge StringsFunds Flow
Physician Faculty Practices
Pro Fees
Facility Charges
wRVUs

Net IncomeNet Revenue – Total Cost“What we are paid minus
all costs, including keeping the lights on”
Total CostDirect + Indirect
UCSF Finance 101
Direct CostCosts we have
direct control over
Indirect CostCost not directly tied
to services; infrastructure costs
Net Revenue What UCSF is reimbursed
Generally ~ 25% of Gross Revenue
Gross RevenueFacility charges; what UCSF charges for services;
what shows up on an itemized hospital bill
Contribution MarginNet Revenue – Direct Cost
“What we are paid minus what costs we have direct control over”

Direct versus Indirect
Direct Cost
• Inpatient Room and Board
• Supplies
• Imaging
• Drugs + Administration
• OR costs
• Labs
Indirect Cost
• Sterile Processing
• Social Work
• Rent
• Utilities
• Graduate Medical Education and School of Medicine Agreements
• Caring Wisely Program
UCSF Finance 101

Cost Centers with Direct and Indirect Cost
UCSF Finance 101
OR
Direct Cost Indirect CostCost Center Total Cost
Periop/OR/PACU
Clinical Labs & Path Labs
Room and Board
• Sterile Processing• Water• Equipment
• OR Nurses• Techs
• Equipment• Reagents• Lab Supplies• Lab techs
• Nursing ratios • Beds• Capital costs of room

Revenue - Payer Mix
UCSF Finance 101
37%
31%
31%1%
FY18 IP Gross Revenue - Payor Mix
COMMERCIAL MEDI-CAL MEDICARE OTHER
51%24%
24%1%
FY18 IP Net Revenue - Payor Mix
COMMERCIAL MEDI-CAL MEDICARE OTHER

LOS Definitions
UCSF Finance 101
ED Obs Inpatient
OR Obs Inpatient
OR
ED LOSClinical / Operational Hospital LOS
EPSI Inpatient LOS
InpatientInptOR
Clinical / Operational Hospital LOS
EPSI Inpatient LOS
EPSI Inpatient LOS
Clinical / Operational Hospital LOS
ORHospital Outpatient Surgery with same day discharge
• Clinical LOS = 0• EPSI LOS = 1

Revenue – Payment Models Fee-for-Service (FFS) – traditional reimbursement for services rendered; now
very little of UCSF Health revenue
Case Rates – contract agreements with commercial payers for care of certain diagnoses
MS-DRG – Diagnostic Related Group – Federal Medicare system of paying one price for a specific diagnosis, adjusted for region and cases w/ or w/o major comorbid conditions (MCCs)
ACOs – Shared cost savings for participation in network of providers and specialties; population health approach with rewards for keeping people healthy; UCSF Canopy Health
Capitation – per capita, or ‘per head’ payment for care of a population, regardless of complexity; Medical programs
Pro fees – Individual provider revenue for services; separate from UCSF Health revenue
Ambulatory Payer Groups – Payment for outpatient surgeries
UCSF Finance 101

Return on Investment (ROI) EquationsFor Value Improvement
UCSF Finance 101
# Reduction
in Utilization( )*
$ Unit Cost - $ Program Cost = ROI
Standard Group $ Cost Per
Case )Intervention Group $ Cost Per
Case- $ Program
Cost = ROI( - * # of Inter-
vention Cases

Age Friendly Health System – Delirium Reduction Case StudyThe team implemented a validated screening tool to assess
Delirium risk, and an order set to implement a range of mitigating activities if high Delirium risk was detected
The Delirium initiative was completed on all inpatient units at the start of FY19
The initiative is designed to decrease delirium onset and intensity, resulting in a decreased length of stay (LOS) for patients with Delirium
LOS of the baseline population was 10.7 days
The team targeted an LOS reduction of 0.1 days (essentially 10% of patients are discharged 1 day earlier as a result of the intervention)
UCSF Finance 101

Delirium Reduction Case Example
UCSF Finance 101
LOS Reduction 0.2 days *
1000 cases( )* Direct Variable
Room Cost per Day$1,500
- MD Lead$20,000
= $280,000

Heme Onc Cost per Case Reduction Case Study In an assessment of service line LOS and cost, it was noted that
LOS and direct cost per case had grown significantly and exceed that of our peers
The team conducted a deep analysis of their costs to understand the key drivers
Initiatives were developed to address areas of opportunity. Some of these areas included:
• Swapping out the use of an expensive drug with a lower cost alternative that had comparable / better outcomes
• Developing a new protocol for platelet utilization that had no detrimental impact on outcomes
UCSF Finance 101

Heme Onc Cost per Case Reduction Case Example
UCSF Finance 101
Baseline Cost per
Case$41,000( )Intervention
Group Cost per Case$40,500
=$680,000- Improve-
ment Specialist $20,000
Inter-vention Cases1,400
* -

Peds Heme Onc Cost per Case Reduction Case StudyThe team did a deep dive into services and noted that LOS index
was high and cost per case was increasing despite a decrease in CMI
The team conducted a root cause analysis of possible issues and initiatives were developed to address areas of opportunity. Key areas that were contributing to the LOS index and high costs included:
• High variability in the admission time of chemo patients with 70% of patients initiating chemo after 7pm
• Communication challenges with incomplete participation on multi-disciplinary teams and with patients families
UCSF Finance 101

Peds Heme Onc Cost per Case Reduction Case Example
UCSF Finance 101
Baseline Cost per
Case$25,000( )Intervention
Group Cost per Case$23,000
=$1,160,000- Intervention
Cases580
*

Antibiotic resistance is a major threat
https://www.cdc.gov/getsmart/community/images/materials/ar-deaths.jpg; Schuts EC et al., Lancet Infect Dis. 2016 Jul;16(7):847-56; Faezel LM et al. J Antimicrob Chemother. 2014 Jul;69(7):1748-54
Antibiotic stewardship is a proven approach to combat resistance, prevent CDI, decrease mortality, and lower costs

Prospective audit and feedback (PAF)“The bread and butter” of ASP

The problem with PAF: Inefficiency
9%
<1%

The solution: Can teams identify patients for our review?

Targeted antibiotic use
FY16 DOT: 400.35FY17 DOT: 368.58↓7.9%

Antibiotic Stewardship Value ROI
*Data source, John Hillman, PhD
Metric Direct Cost Savings
Annualized cost savings, pre-ASP vs. post-Caring Wisely ASP* (2/2017 – 3/2018)
$837,000
Clostridium difficile infections• Rate: 11.06 9.35 7.45• ↓ 54 cases• ↓ 27%

Accessing UCSF Financial Data SourcesFinance Department – The Cube (EPSI data)
Vizient Database
SvcDash – svcdash.ucsfmedicalcenter.org
tag.bio tool – in development (Jahan Fahimi)
UCSF Finance 101

UCSF Finance 101


UCSF Finance 101
UB Class/Major Category Cases* Qty Charges Direct Cost Indirect
Cost Total Cost Charges Per Case
Direct Cost Per Case
Total Cost Per Case
Direct Cost Per Day
Total Cost Per Day
Daily Room & Board 1,106 5,758 87,591,729 11,611,090 8,500,585 20,111,675 79,197 10,498 18,184 2,017 3,493 Drugs 1,087 2,584,250 3,690,500 2,377 3,395 449 641
Pharmacy 1,087 2,640,540 14,964,760 2,584,250 1,106,250 3,690,500 13,767 2,377 3,395 448.81 640.93 Services 902 5,321,218 8,833,476 5,899 9,793 924 1,534
Ambulatory Clinic Services 19 33 9,426 - - - 496.11 - - - - Electoencephalography 541 2,190 18,615,634 1,160,387 666,090 1,826,477 34,410 2,145 3,376 202 317 Imaging 795 5,553 15,790,697 995,448 911,236 1,906,685 19,863 1,252 2,398 173 331 Clinical Laboratory & Pathology 902 57,526 10,265,191 855,140 579,720 1,434,859 11,380 948 1,591 149 249 Respiratory Therapy 219 4,575 4,884,447 727,074 335,005 1,062,080 22,303 3,320 4,850 126 184 Rehabilitation Services 646 8,357 2,824,430 445,850 269,092 714,942 4,372 690 1,107 77 124 Emergency Room 423 1,720 2,029,797 352,490 256,477 608,967 4,799 833 1,440 61 106 Perioperative/OR/PACU 107 17,242 2,889,028 352,074 213,014 565,088 27,000 3,290 5,281 61 98 Cardiology Services 625 1,776 1,734,834 124,211 83,527 207,738 2,776 199 332 22 36 Anesthesia 187 44,589 2,109,071 92,239 61,610 153,850 11,278 493 823 16 27 Blood Services 83 659 153,944 75,748 42,939 118,687 1,855 913 1,430 13 21 Peripheral Vascular Lab 144 284 570,457 68,170 42,012 110,182 3,962 473 765 12 19 Renal Dialysis 9 34 216,093 27,390 14,825 42,215 24,010 3,043 4,691 5 7 Observation Bed 44 1,835 173,106 24,747 18,332 43,079 3,934 562 979 4 7 Radiology - Therapeutic 1 65 286,009 15,769 13,090 28,859 286,009 15,769 28,859 3 5 Telemetry 1 1 135 - - - 135 - - - - Pumonary Function 75 434 124,578 4,480 2,079 6,559 1,661 60 87 1 1 GI & Endoscopy Services 3 3 9,964 - 1,431 3,210 3,321 - 1,070 - 1
Supplies 337 1,121,486 2,032,619 3,328 6,032 195 353 Medical Supplies & Devices 337 4,987 6,227,654 1,121,486 911,134 2,032,619 18,480 3,328 6,032 195 353
Other 458 366,019 644,547 799 1,407 64 112 Miscellaneous Services 458 2,076 2,330,795 366,019 278,529 644,547 5,089 799 1,407 64 112
Grand Total 1,106 2,800,237 173,801,778 21,005,843 14,306,975 35,312,817 157,144 18,993 31,928 3,648 6,133