UCONN Energy Conservation C.O.R.E Assessment Matrix December 19, 2008.
24
UCONN Energy Conservation C.O.R.E Assessment Matrix December 19, 2008
-
date post
19-Dec-2015 -
Category
Documents
-
view
215 -
download
2
Transcript of UCONN Energy Conservation C.O.R.E Assessment Matrix December 19, 2008.

UCONN Energy Conservation
C.O.R.E Assessment MatrixDecember 19, 2008
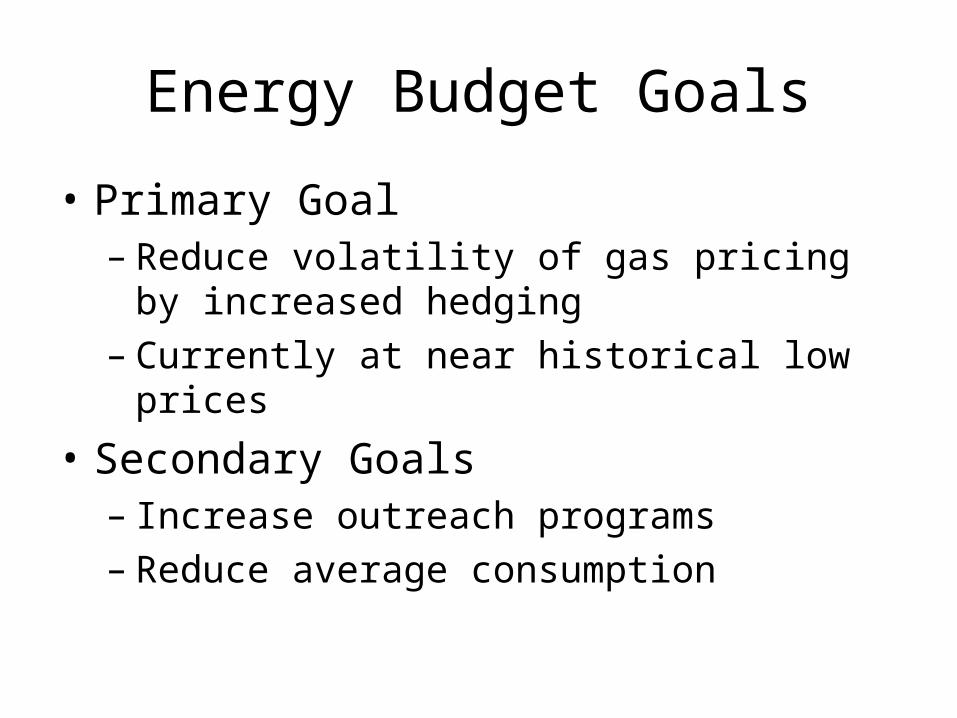
Energy Budget Goals
• Primary Goal– Reduce volatility of gas pricing by increased
hedging – Currently at near historical low prices
• Secondary Goals– Increase outreach programs– Reduce average consumption
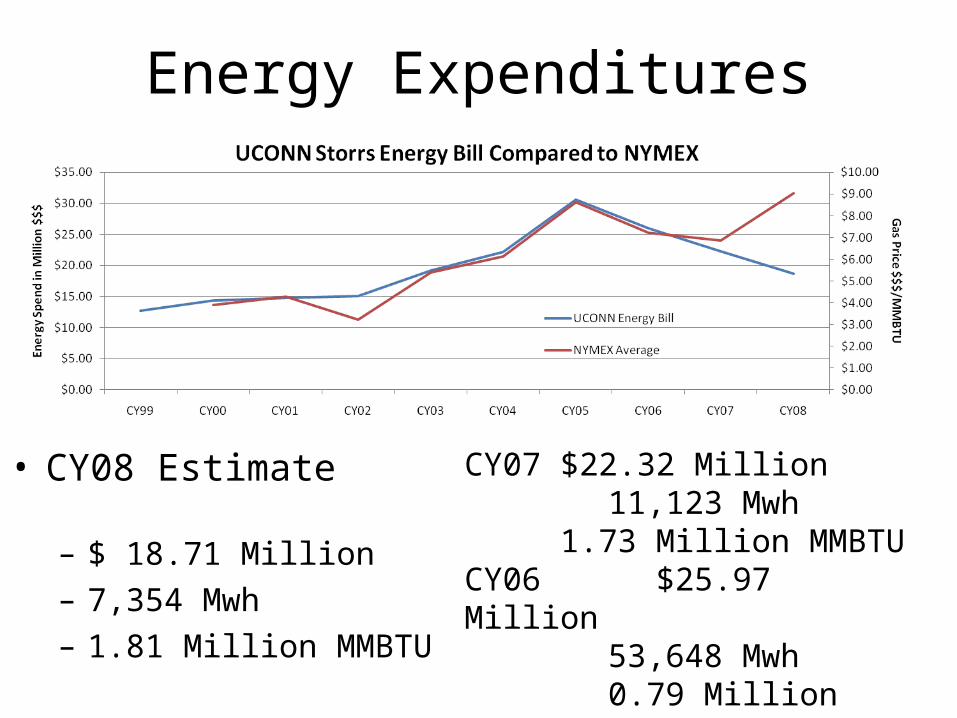
Energy Expenditures
• CY08 Estimate – $ 18.71 Million– 7,354 Mwh– 1.81 Million MMBTU
CY07 $22.32 Million11,123 Mwh
1.73 Million MMBTUCY06 $25.97 Million
53,648 Mwh0.79 Million MMBTU
(6 mth)

Monitoring Capability
• FASER Version 5.0 Software (1999)– Monitors all accounts with energy vendors– Database maintained by Accounts Payable since 2006
by Bruce Gerber/Michael Virone– Updates/Patches required
• PowerLogic Square D Software– Monitors on campus sub-meters– Ideally suited for electrical tracking/troubleshooting– Capable of energy use reporting

Monitoring Capability(Continued)
• Andover Building Management System– Capable of control, monitoring, and reporting– 150 Buildings can be controlled
• Phoenix Control Systems (Lab Hoods)– Used in Labs and Animal Care Facilities where airflow
tolerances are critical • CT Water– Monitors campus supplied customers
• Metering Program – In process– 30 water meters, minimal users– 20 electrical meters– 10 steam meters

Energy Hogs
• Develop lists of Top Ten “Energy Hogs”• Encourage Energy Hog managers to
proactively administer conservation efforts• Develop conservation goals addressing issues
discovered • Pursue high ROI improvements• Distribute progress reports

CL&P Supplied Energy HogsJuly 2007 to Current

UCONN Main CL&P Meters
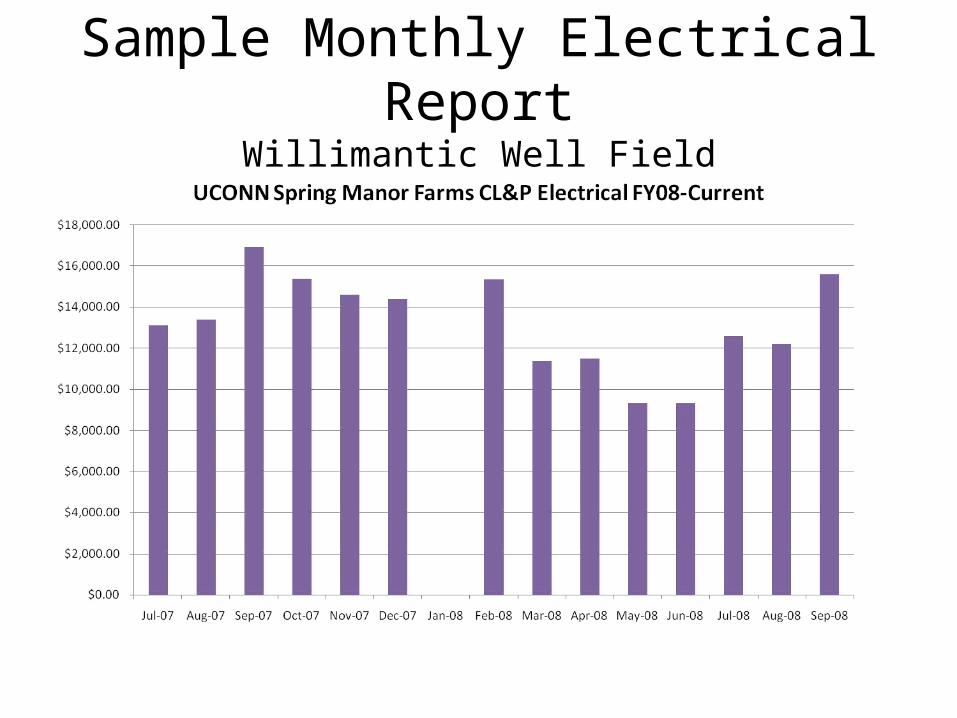
Sample Monthly Electrical ReportWillimantic Well Field
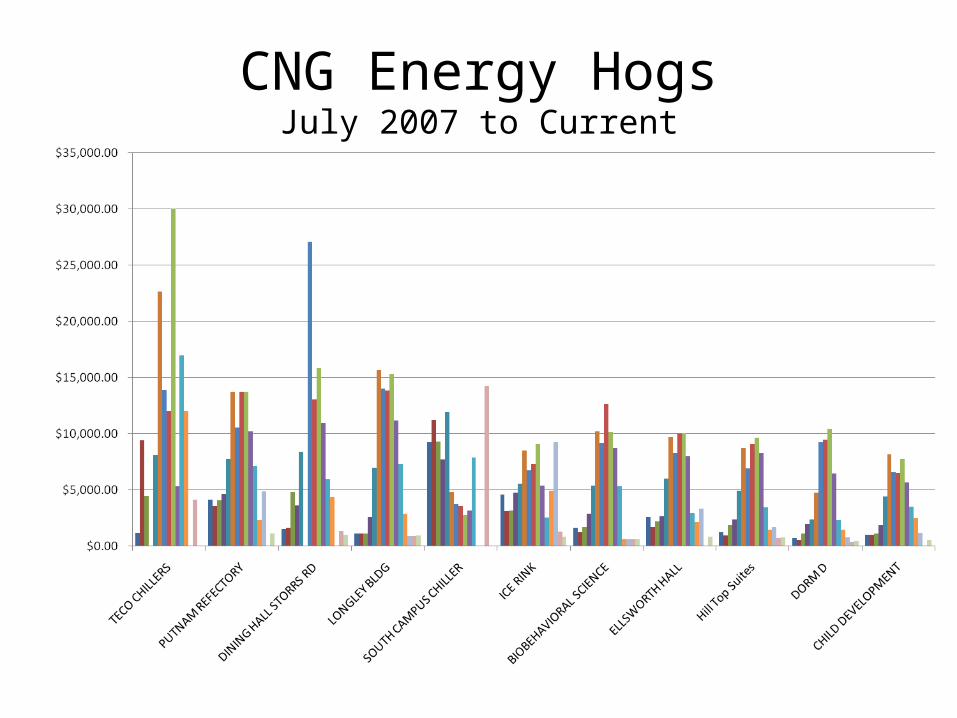
CNG Energy HogsJuly 2007 to Current
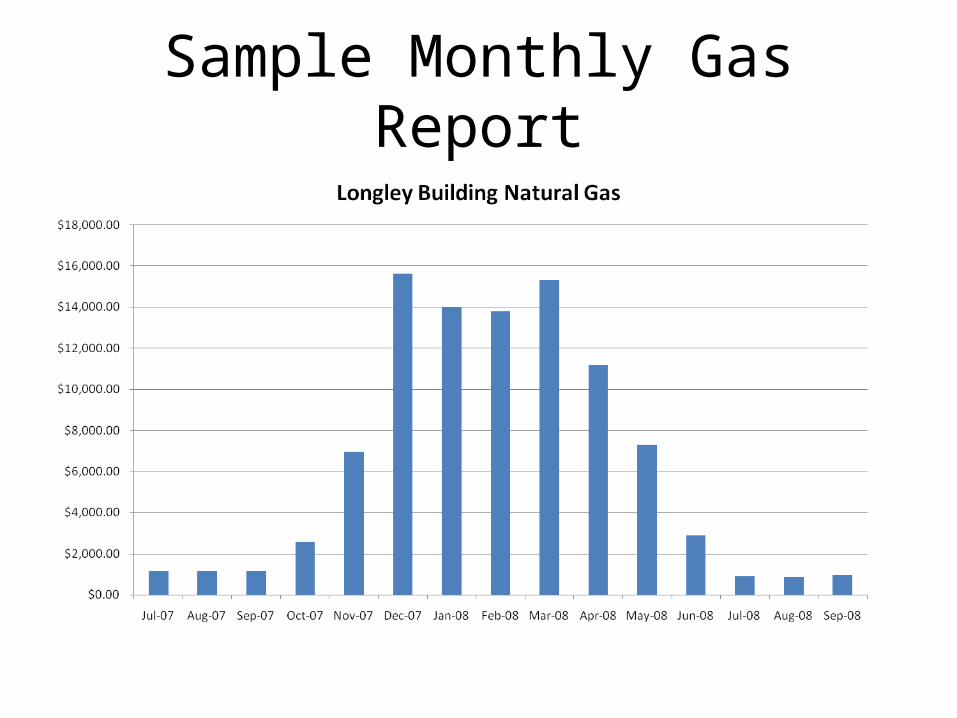
Sample Monthly Gas Report

Converting Gas to Electricity

Sample PowerLogic Monthly Report

Conservation Project Types
• Lighting – High Efficiency/Low Wattage• VFD – Variable Speed Drive on motors/fans• Occupancy Sensors – Hallways and Stairs• Energy Star Program – Appliances/Equipment• CO2 Sensors- Air change optimization

Previous Conservation ProjectsEquipment Life Cycle Savings
• Biology Physics Building New (2002)
• Engineering IT Building New (2003)
• Pharmacy Biology New (2005)
• North Parking Garage (2006)
• South Parking Garage (2006)
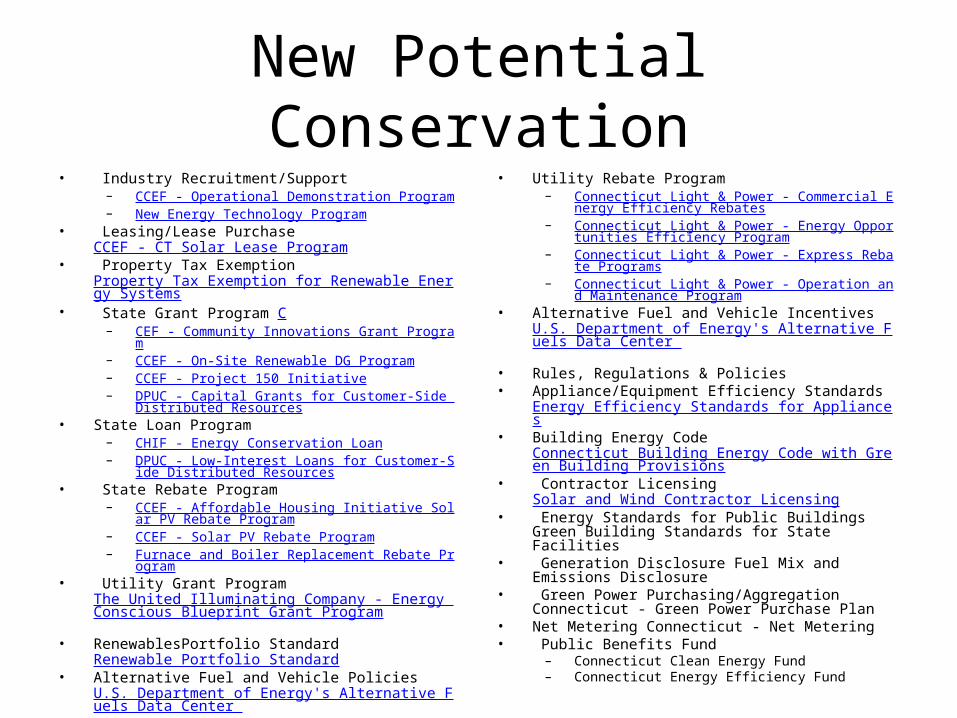
New Potential Conservation• Industry Recruitment/Support
– CCEF - Operational Demonstration Program– New Energy Technology Program
• Leasing/Lease Purchase CCEF - CT Solar Lease Program• Property Tax Exemption
Property Tax Exemption for Renewable Energy Systems• State Grant Program C
– CEF - Community Innovations Grant Program– CCEF - On-Site Renewable DG Program– CCEF - Project 150 Initiative– DPUC - Capital Grants for Customer-Side Distributed Resour
ces• State Loan Program
– CHIF - Energy Conservation Loan– DPUC - Low-Interest Loans for Customer-Side Distributed Re
sources• State Rebate Program
– CCEF - Affordable Housing Initiative Solar PV Rebate Program
– CCEF - Solar PV Rebate Program– Furnace and Boiler Replacement Rebate Program
• Utility Grant Program The United Illuminating Company - Energy Conscious Blueprint Grant Program
• RenewablesPortfolio Standard Renewable Portfolio Standard• Alternative Fuel and Vehicle Policies
U.S. Department of Energy's Alternative Fuels Data Center
• Utility Rebate Program – Connecticut Light & Power - Commercial Energy Efficiency R
ebates– Connecticut Light & Power - Energy Opportunities Efficiency
Program– Connecticut Light & Power - Express Rebate Programs– Connecticut Light & Power - Operation and Maintenance Pr
ogram• Alternative Fuel and Vehicle Incentives
U.S. Department of Energy's Alternative Fuels Data Center • Rules, Regulations & Policies • Appliance/Equipment Efficiency Standards
Energy Efficiency Standards for Appliances• Building Energy Code
Connecticut Building Energy Code with Green Building Provisions
• Contractor Licensing Solar and Wind Contractor Licensing• Energy Standards for Public Buildings Green Building
Standards for State Facilities• Generation Disclosure Fuel Mix and Emissions Disclosure• Green Power Purchasing/Aggregation Connecticut - Green
Power Purchase Plan• Net Metering Connecticut - Net Metering• Public Benefits Fund
– Connecticut Clean Energy Fund– Connecticut Energy Efficiency Fund

Building Schedule Reduction SavingsWeekend and Holiday Break
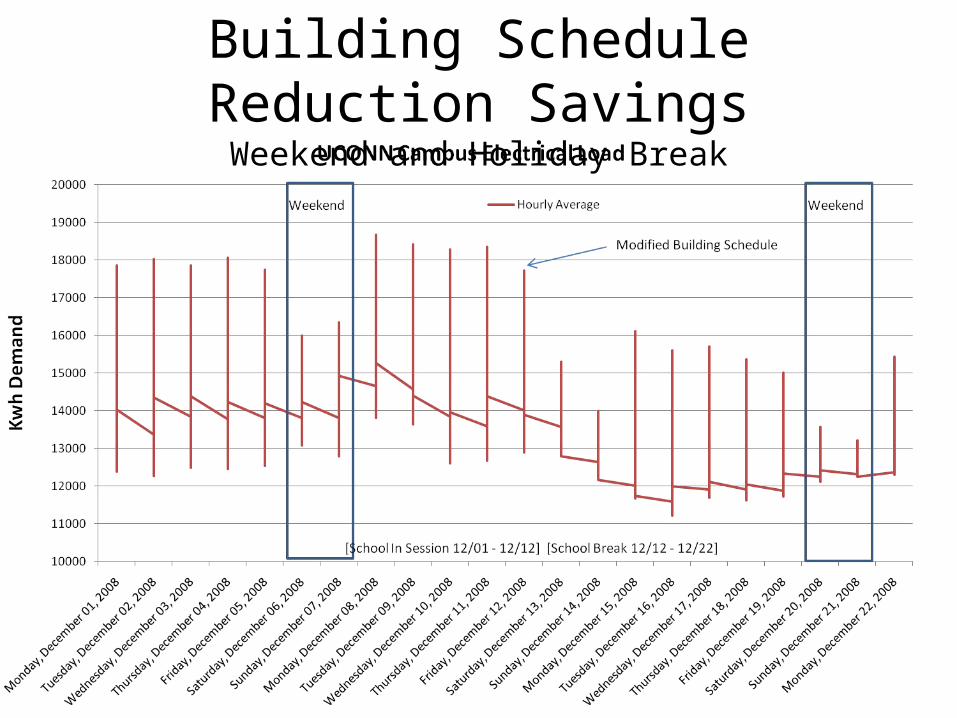
Building Schedule Reduction SavingsWeekend and Holiday Break

Building Schedule Reduction SavingsWeekend and Holiday
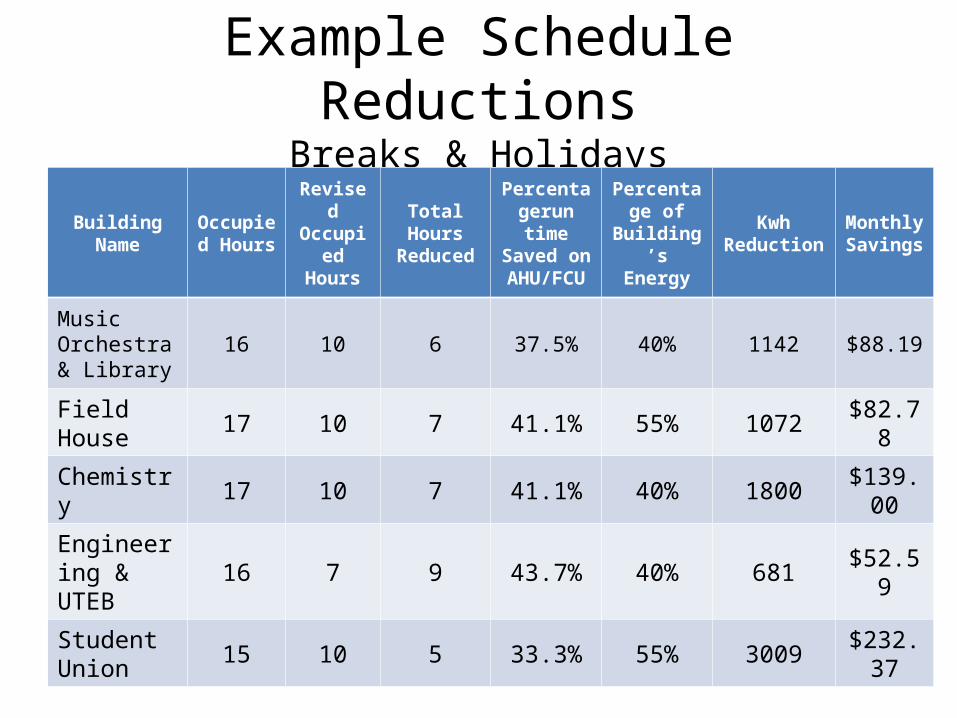
Example Schedule ReductionsBreaks & Holidays
Building Name Occupied Hours
Revised Occupied
Hours
Total Hours Reduced
Percentagerun time Saved on AHU/FCU
Percentage of
Building’s Energy
KwhReduction
Monthly Savings
Music Orchestra & Library
16 10 6 37.5% 40% 1142 $88.19
Field House 17 10 7 41.1% 55% 1072 $82.78
Chemistry 17 10 7 41.1% 40% 1800 $139.00
Engineering & UTEB 16 7 9 43.7% 40% 681 $52.59
Student Union 15 10 5 33.3% 55% 3009 $232.37

Savings Thumb Rule
Cooling Thermostat Heating Thermostat
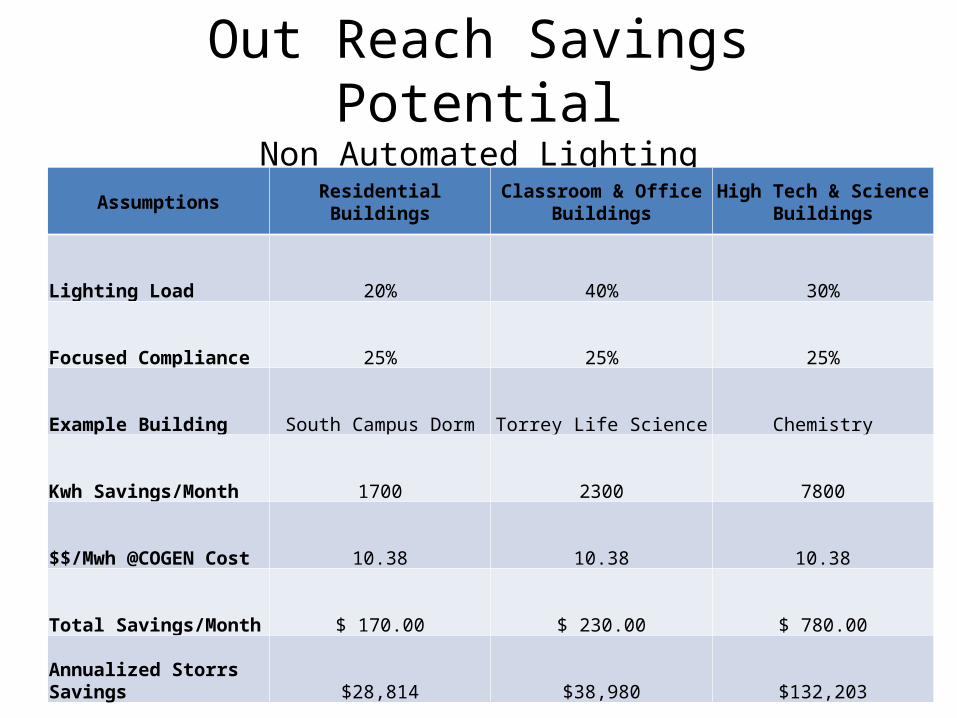
Out Reach Savings PotentialNon Automated Lighting
Assumptions Residential Buildings Classroom & Office Buildings
High Tech & Science Buildings
Lighting Load 20% 40% 30%
Focused Compliance 25% 25% 25%
Example Building South Campus Dorm Torrey Life Science Chemistry
Kwh Savings/Month 1700 2300 7800
$$/Mwh @COGEN Cost 10.38 10.38 10.38
Total Savings/Month $ 170.00 $ 230.00 $ 780.00
Annualized Storrs Savings $28,814 $38,980 $132,203
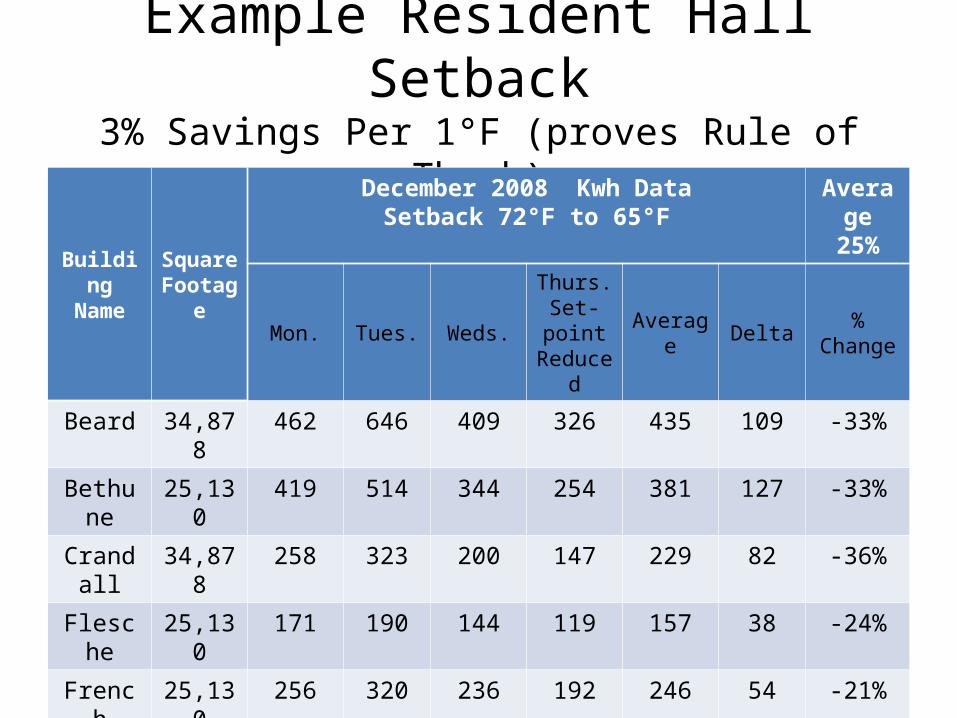
Example Resident Hall Setback3% Savings Per 1°F (proves Rule of Thumb)
Building Name
Square Footage
December 2008 Kwh DataSetback 72°F to 65°F
Average 25%
Mon. Tues. Weds.
Thurs. Set-
point Reduced
Average Delta % Change
Beard 34,878 462 646 409 326 435 109 -33%
Bethune 25,130 419 514 344 254 381 127 -33%
Crandall 34,878 258 323 200 147 229 82 -36%
Flesche 25,130 171 190 144 119 157 38 -24%
French 25,130 256 320 236 192 246 54 -21%
Merritt 25,130 181 297 208 147 195 48 -25%
Grasso 34,878 638 846 645 505 641 136 -21%
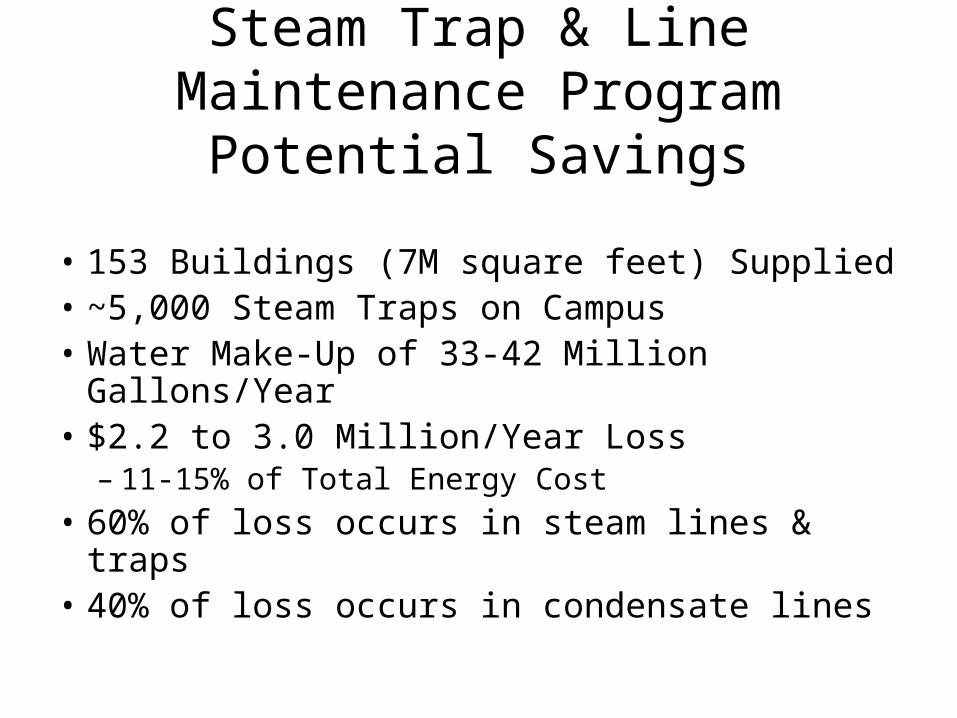
Steam Trap & Line Maintenance Program Potential Savings
• 153 Buildings (7M square feet) Supplied• ~5,000 Steam Traps on Campus• Water Make-Up of 33-42 Million Gallons/Year• $2.2 to 3.0 Million/Year Loss– 11-15% of Total Energy Cost
• 60% of loss occurs in steam lines & traps• 40% of loss occurs in condensate lines